
Palmitoleoylethanolamide Is an Efficient Anti-Obesity Endogenous Compound: Comparison with Oleylethanolamide in Diet-Induced Obesity

 , , , and
Abstract
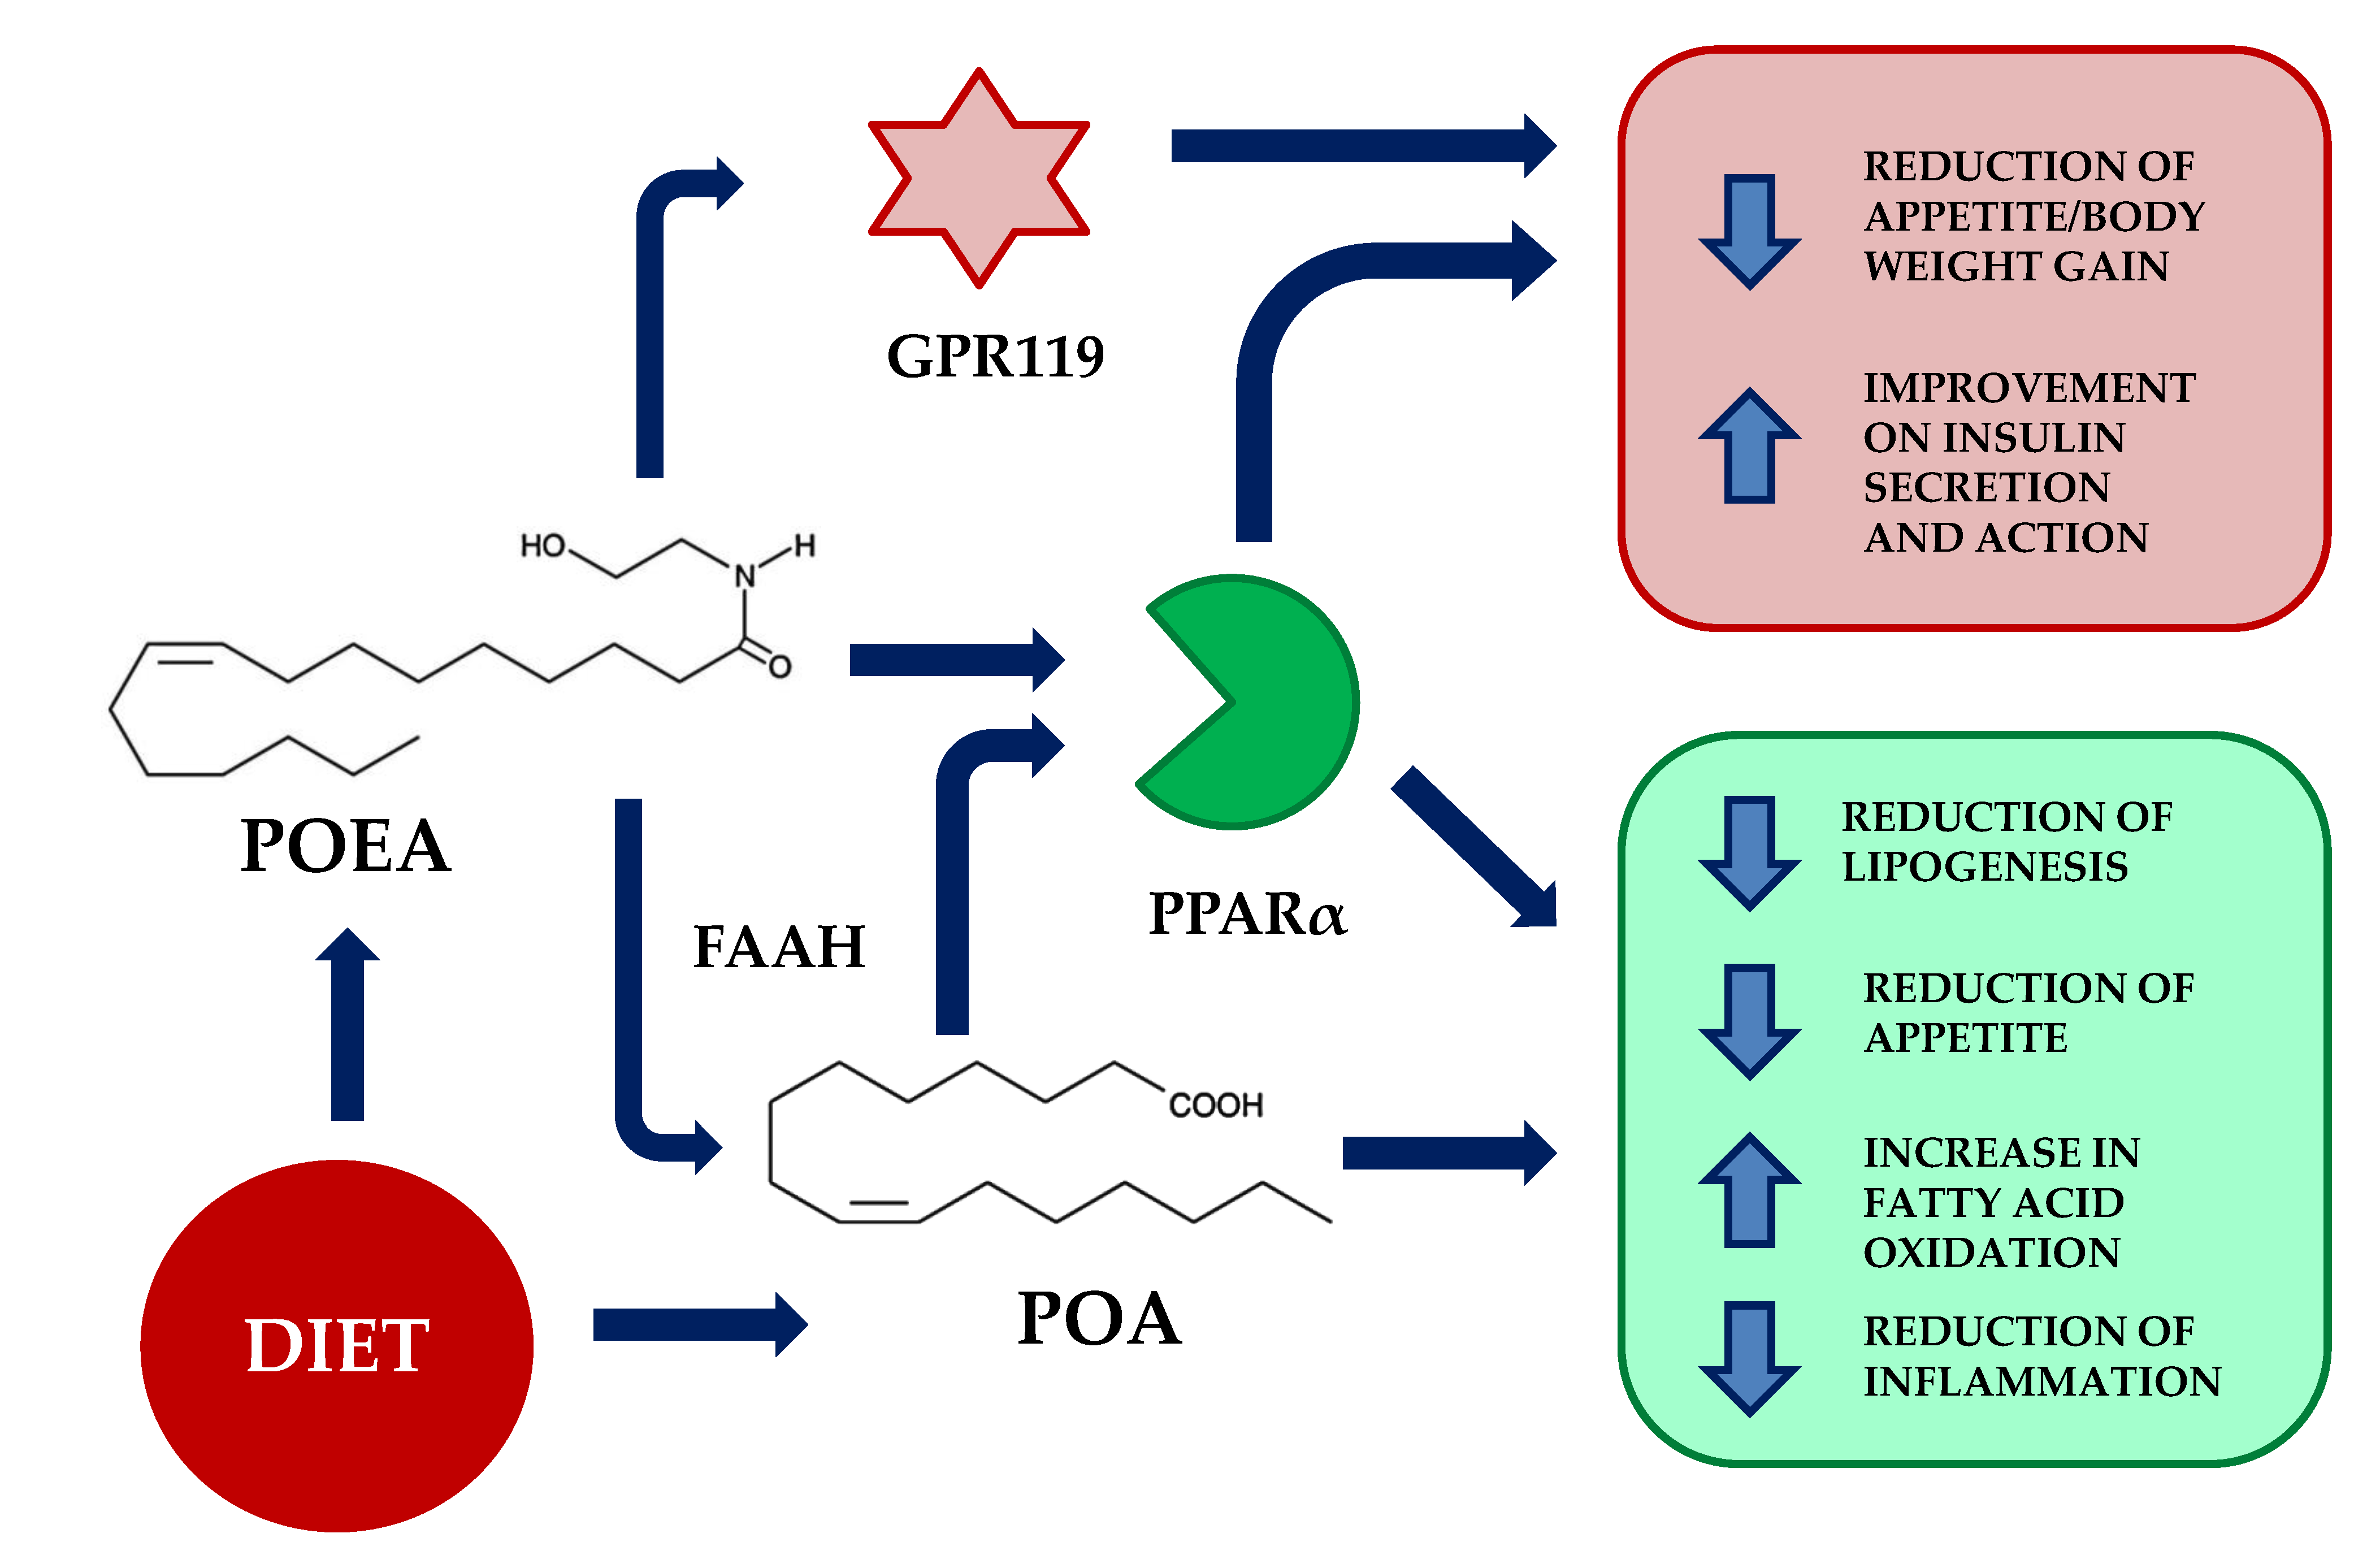
:1. Introduction
2. Materials and Methods
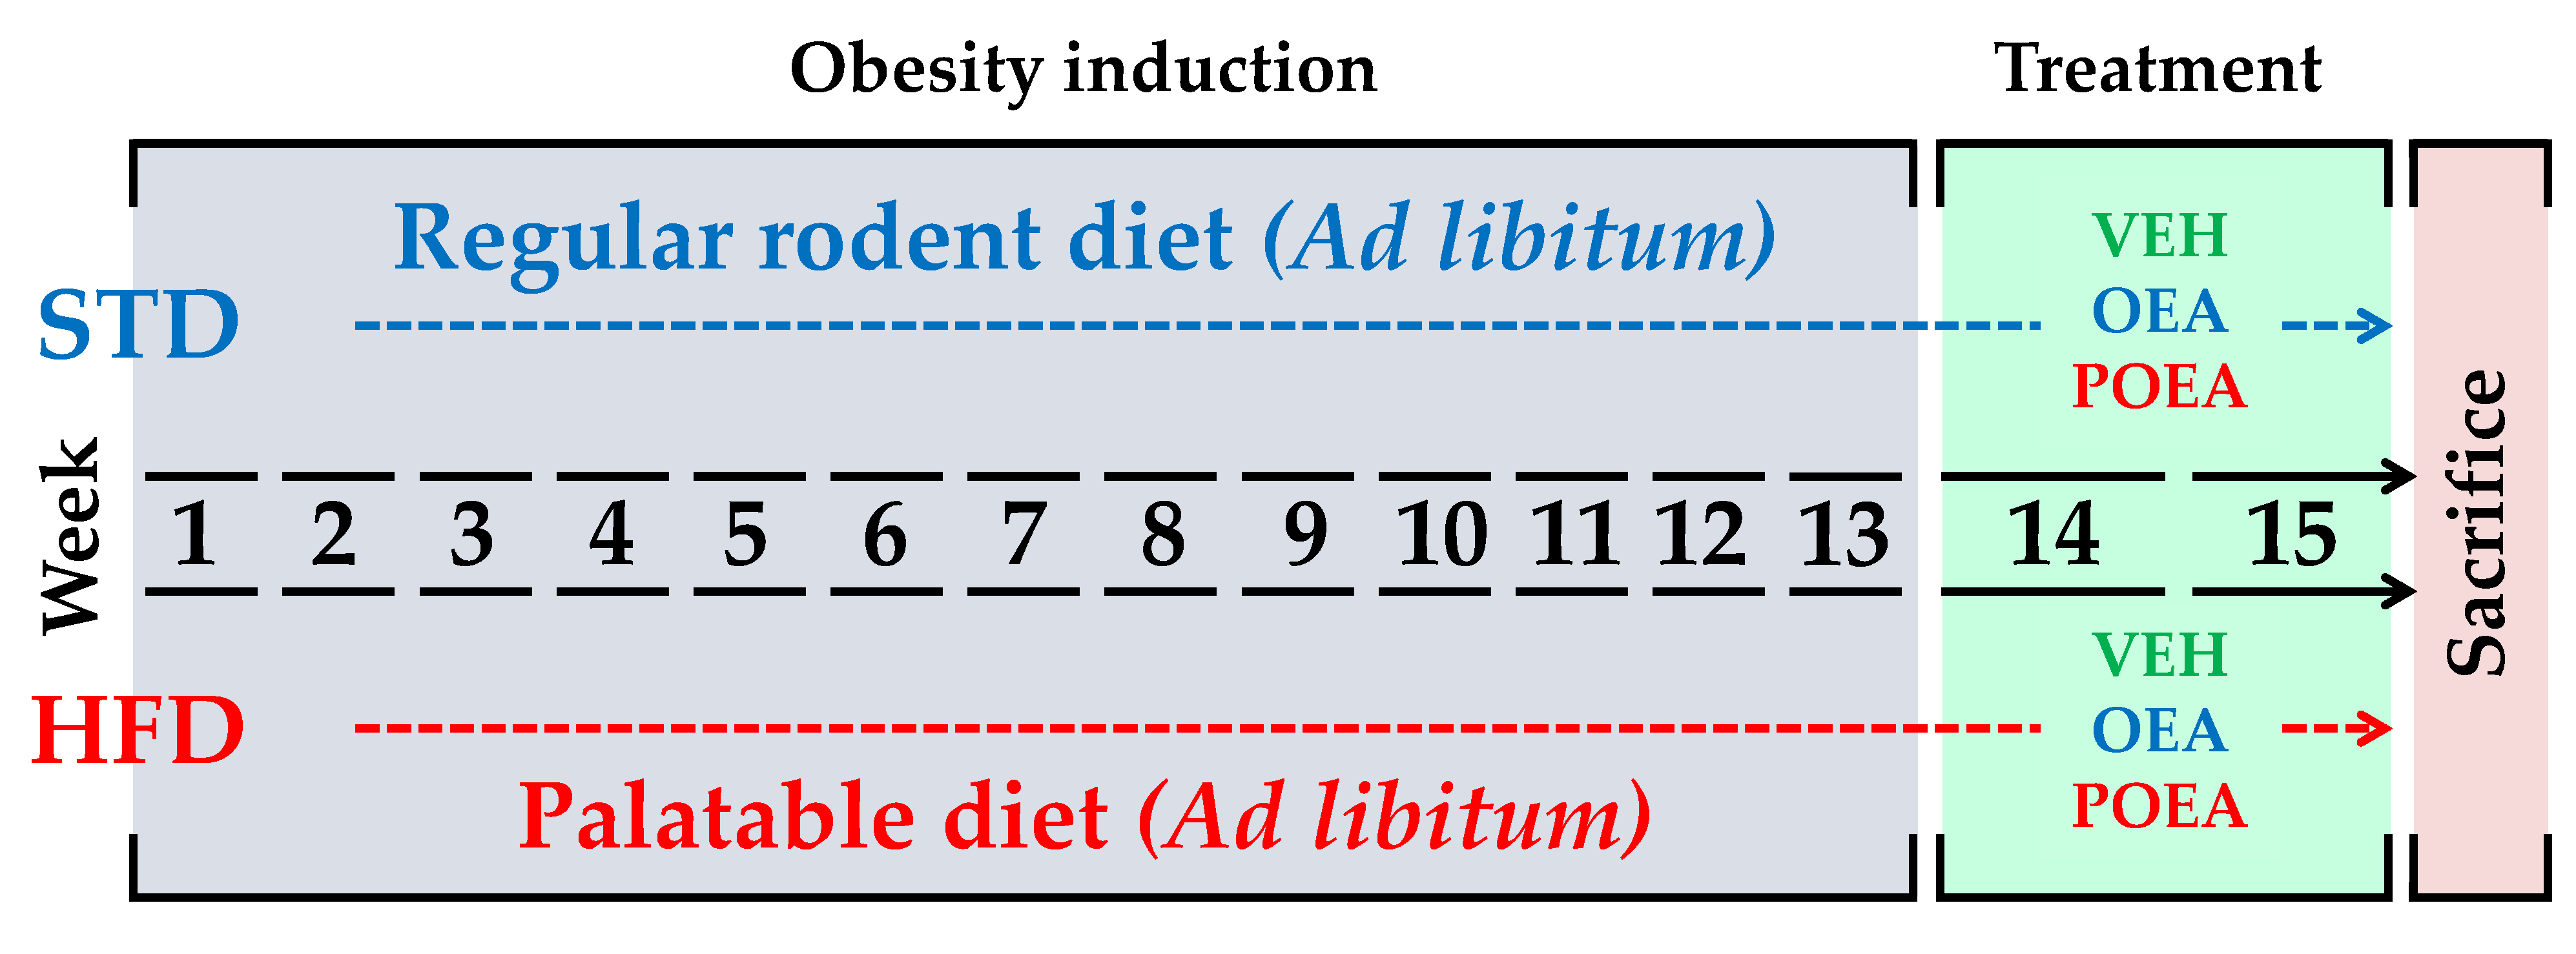
2.1. Animals, Diets, and Experimental Groups
2.2. Glucose Tolerance Test
2.3. Drugs and Chronic Treatment
2.4. Sample Collection
2.5. Measurement of Metabolites, Hepatic Enzymes, and Hormones in Plasma
2.6. Hepatic Lipid Extraction and Fat Content
2.7. Protein Extraction and Western Blot Analysis
2.8. Statistical Analysis
3. Results
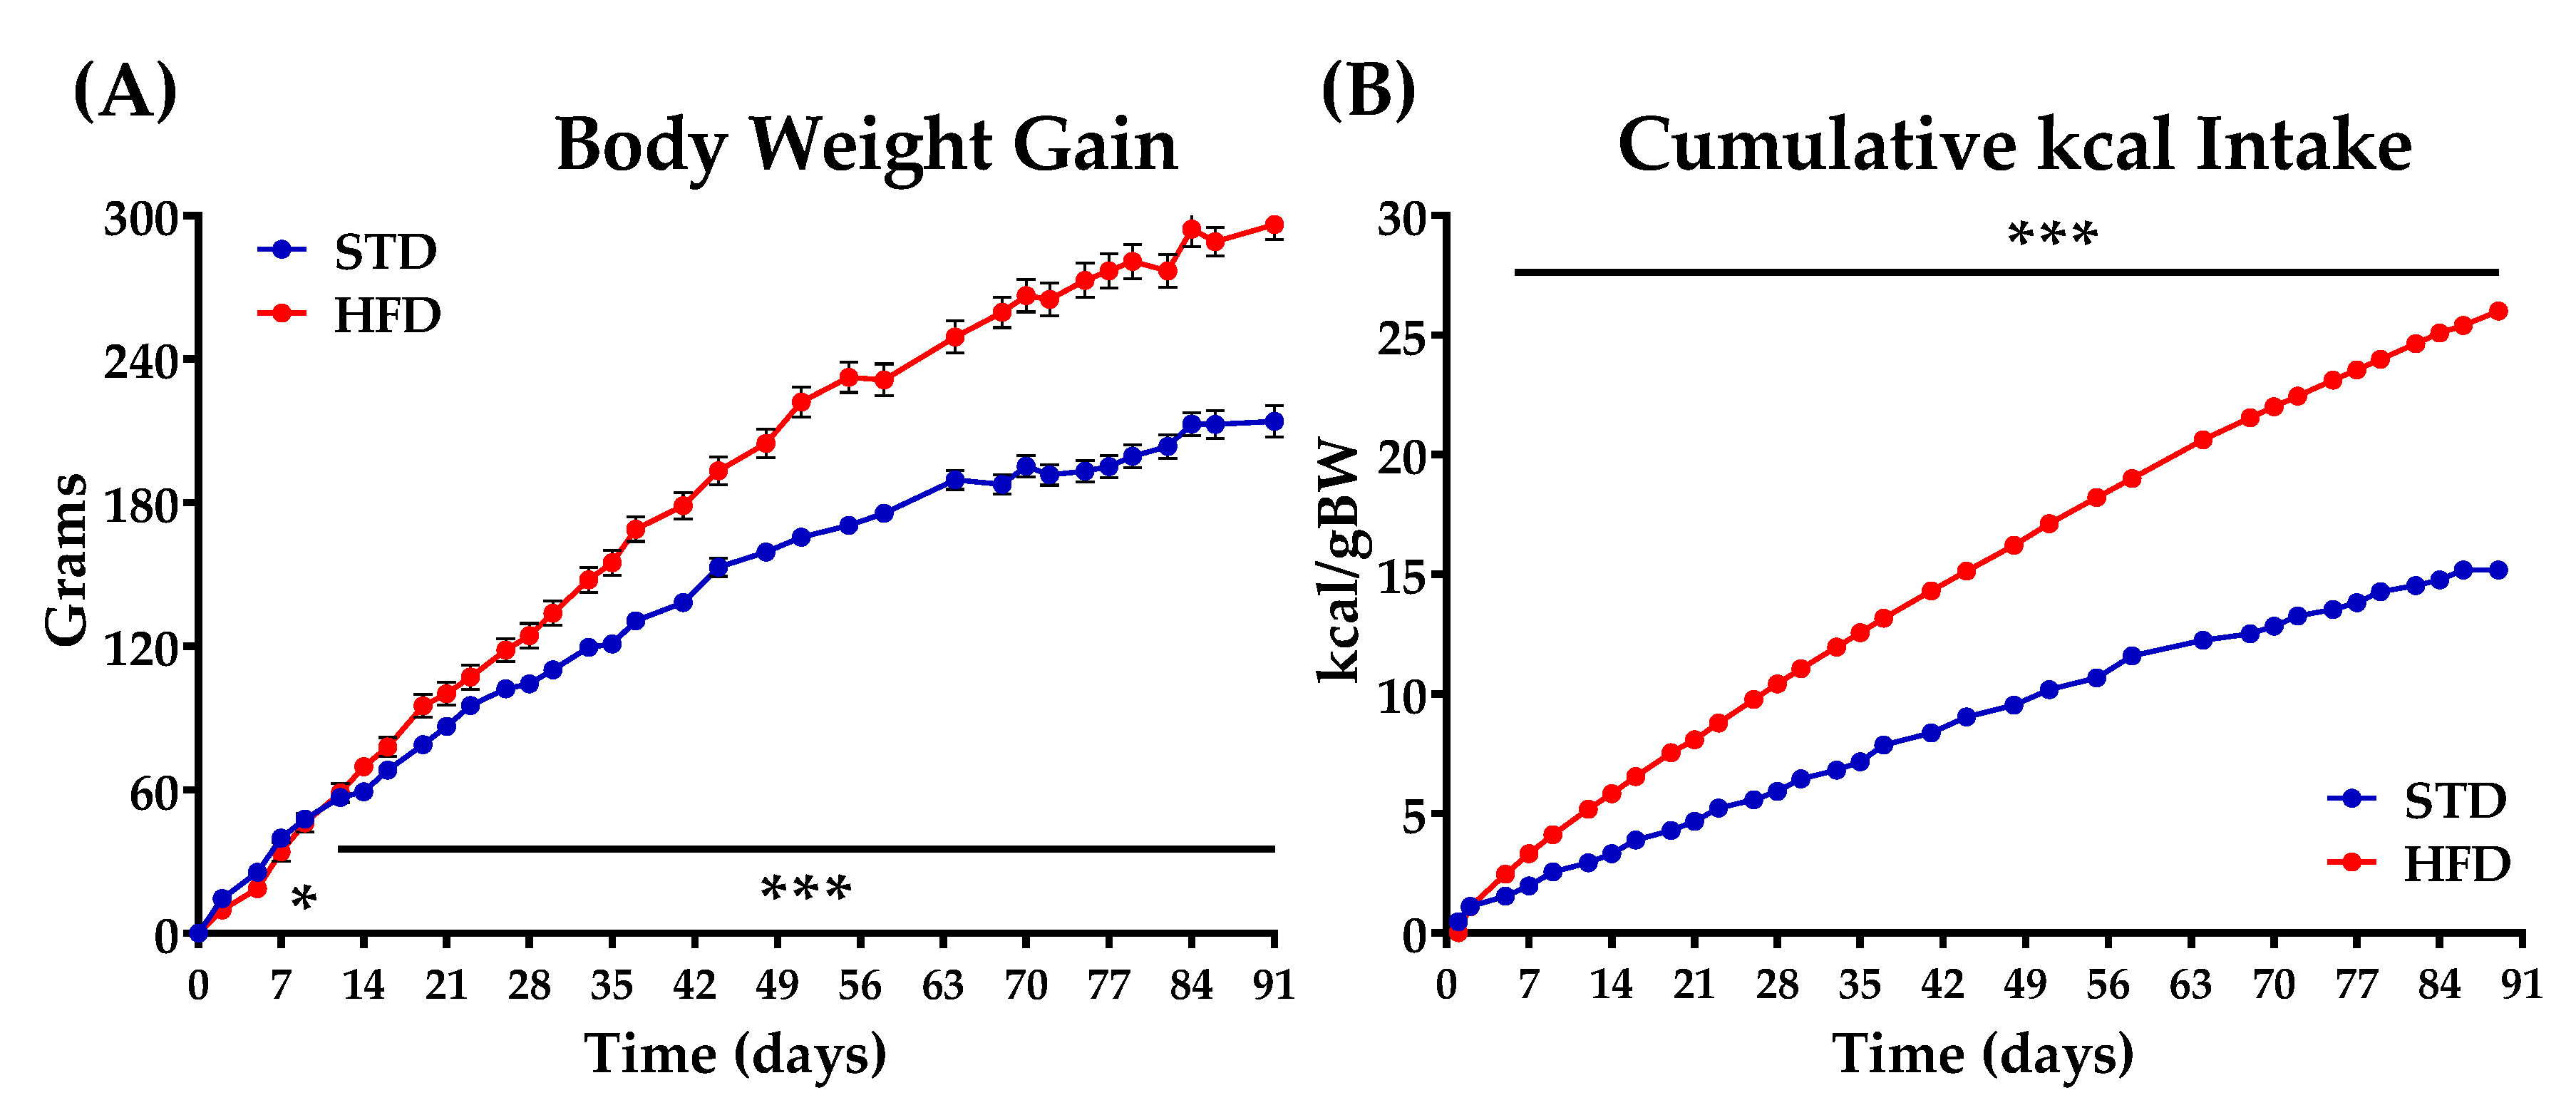
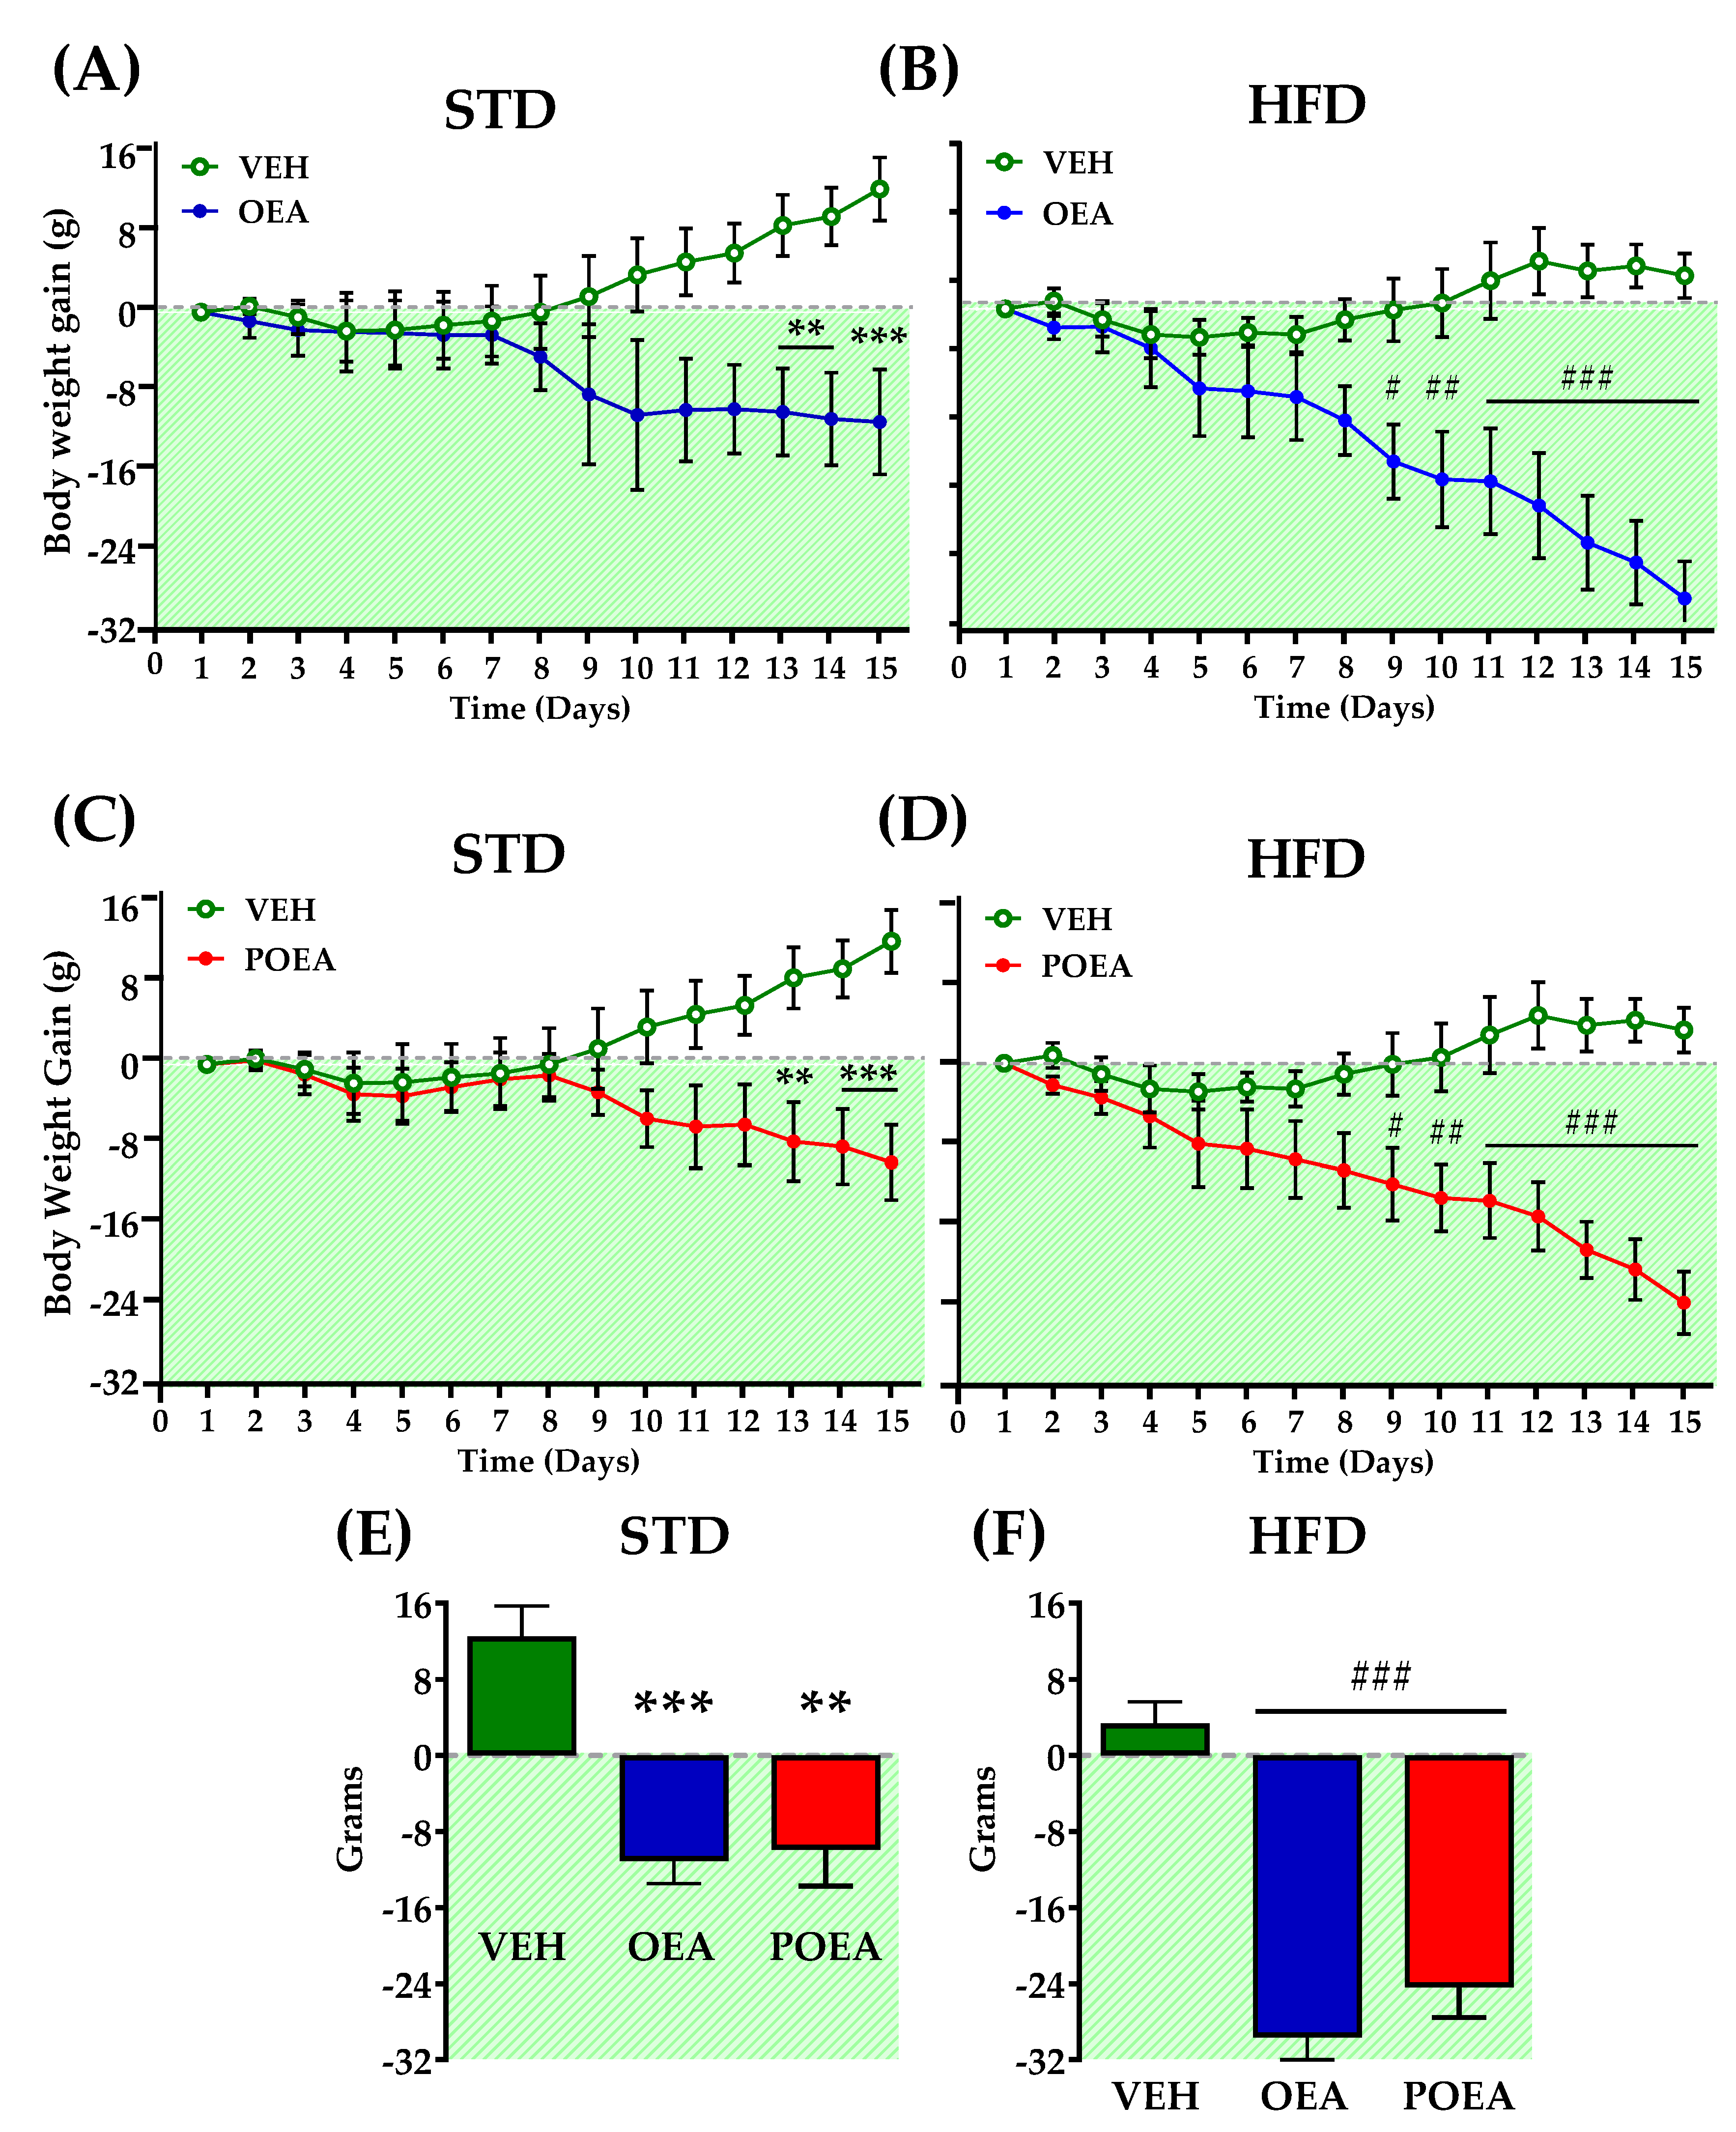
3.1. Comparative Effects of OEA and POEA on Body Weight in STD and HFD
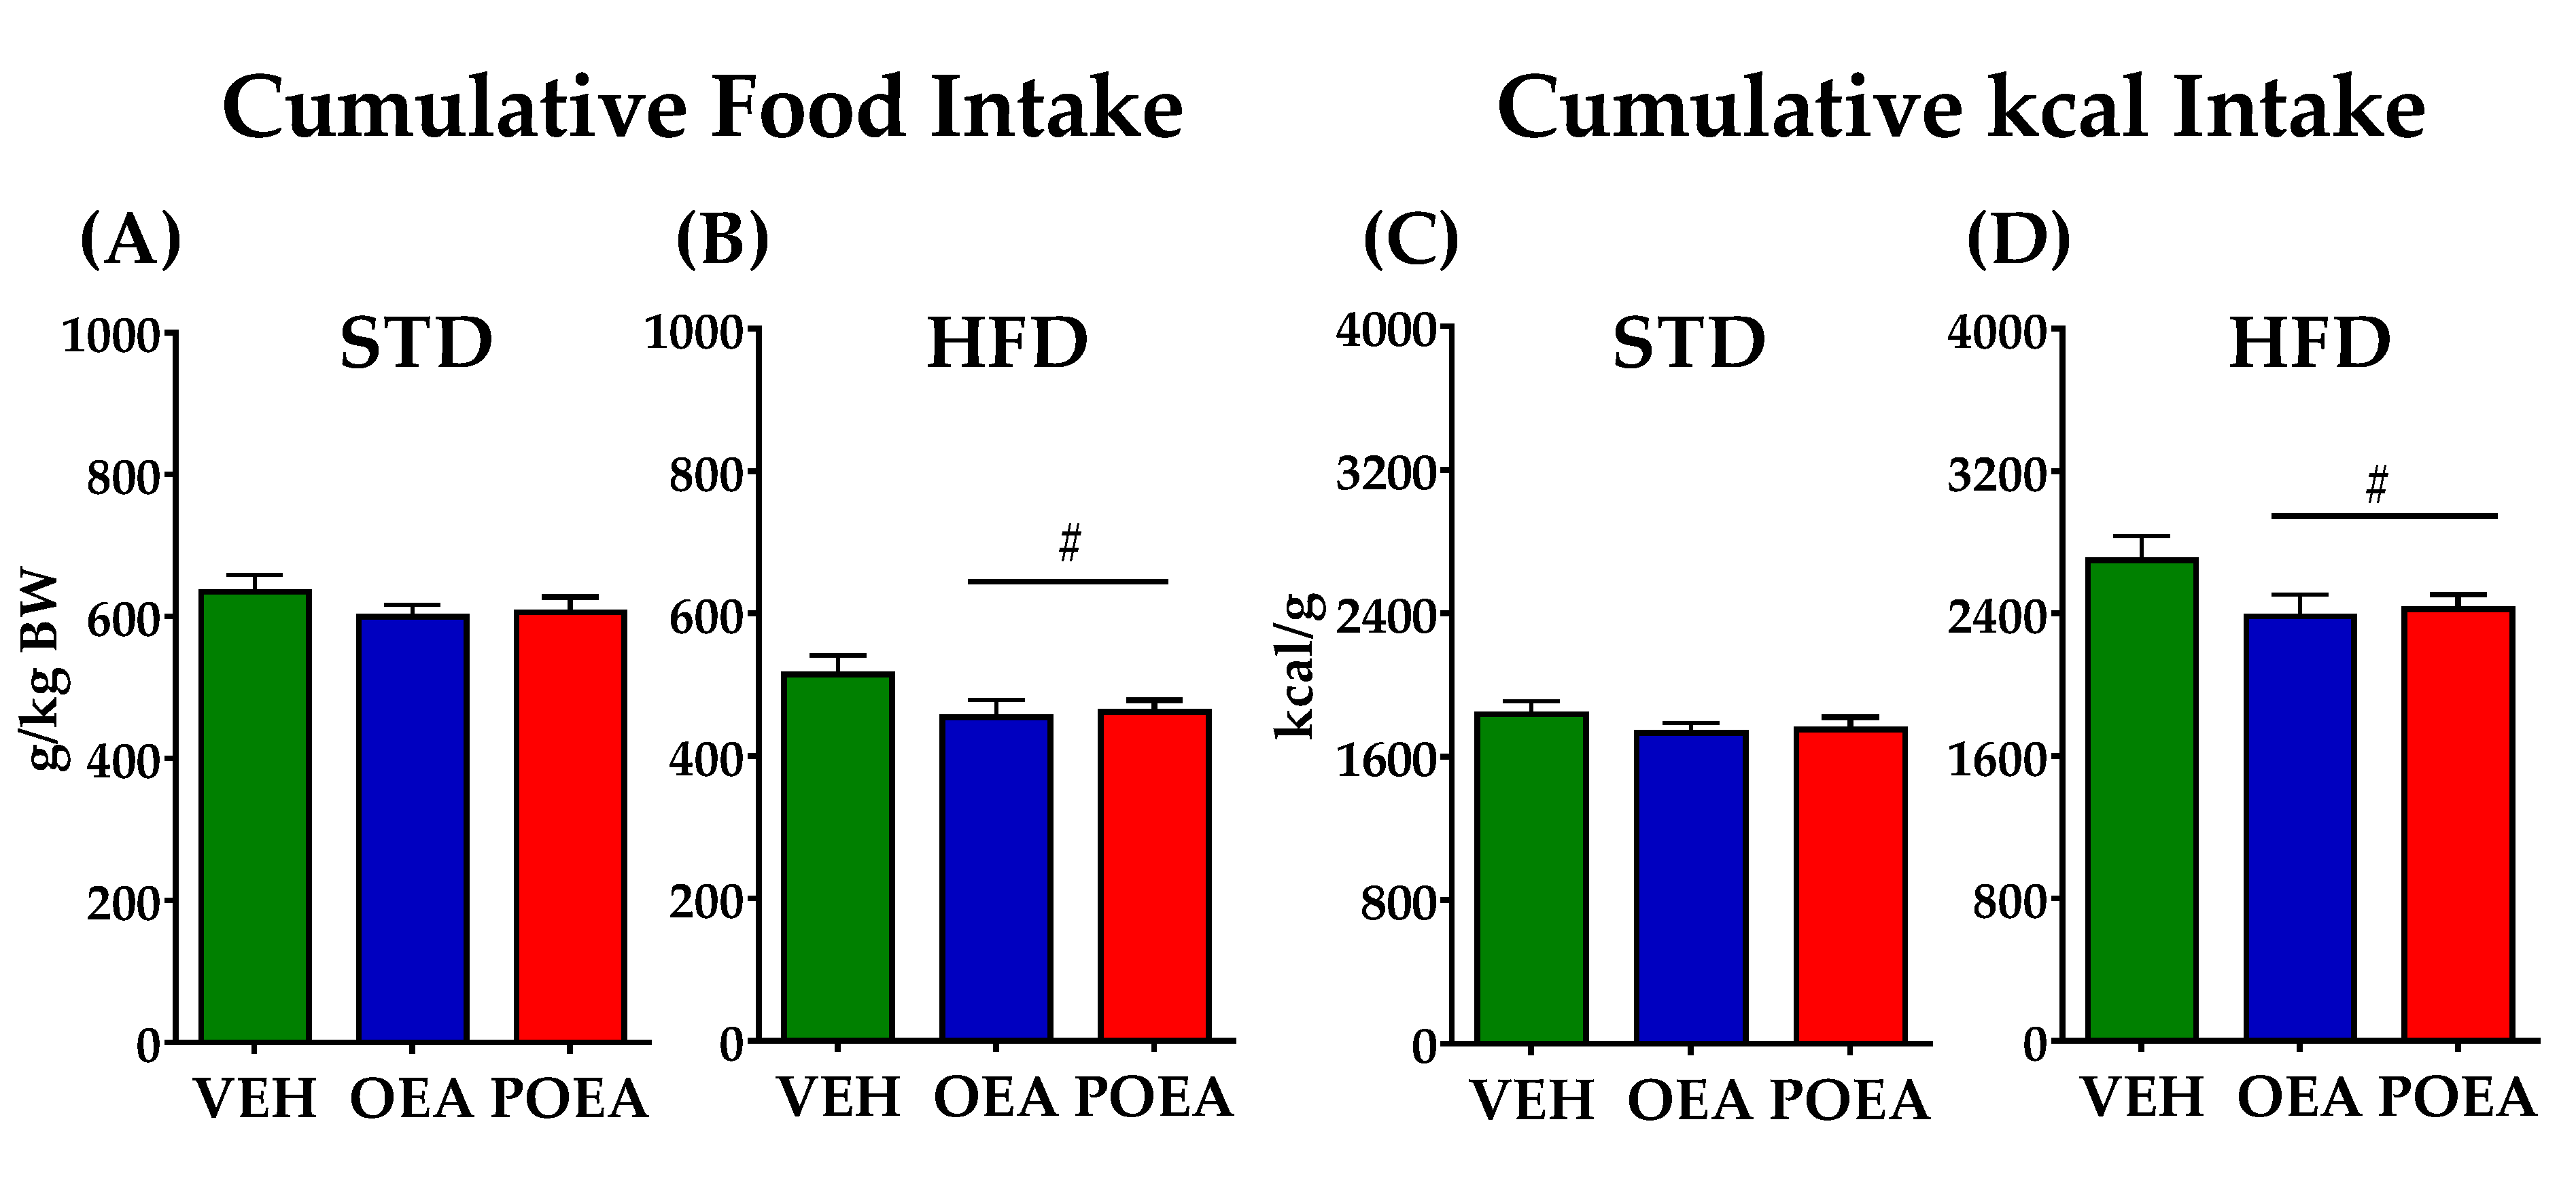
3.2. OEA and POEA Reduced Food Intake in Diet-Induced Obese Rats
3.3. Effects of OEA and POEA on the Plasma Biochemistry in STD-Fed Animals
3.4. Effects of OEA and POEA on the Plasma Biochemistry in HFD-Fed Animals
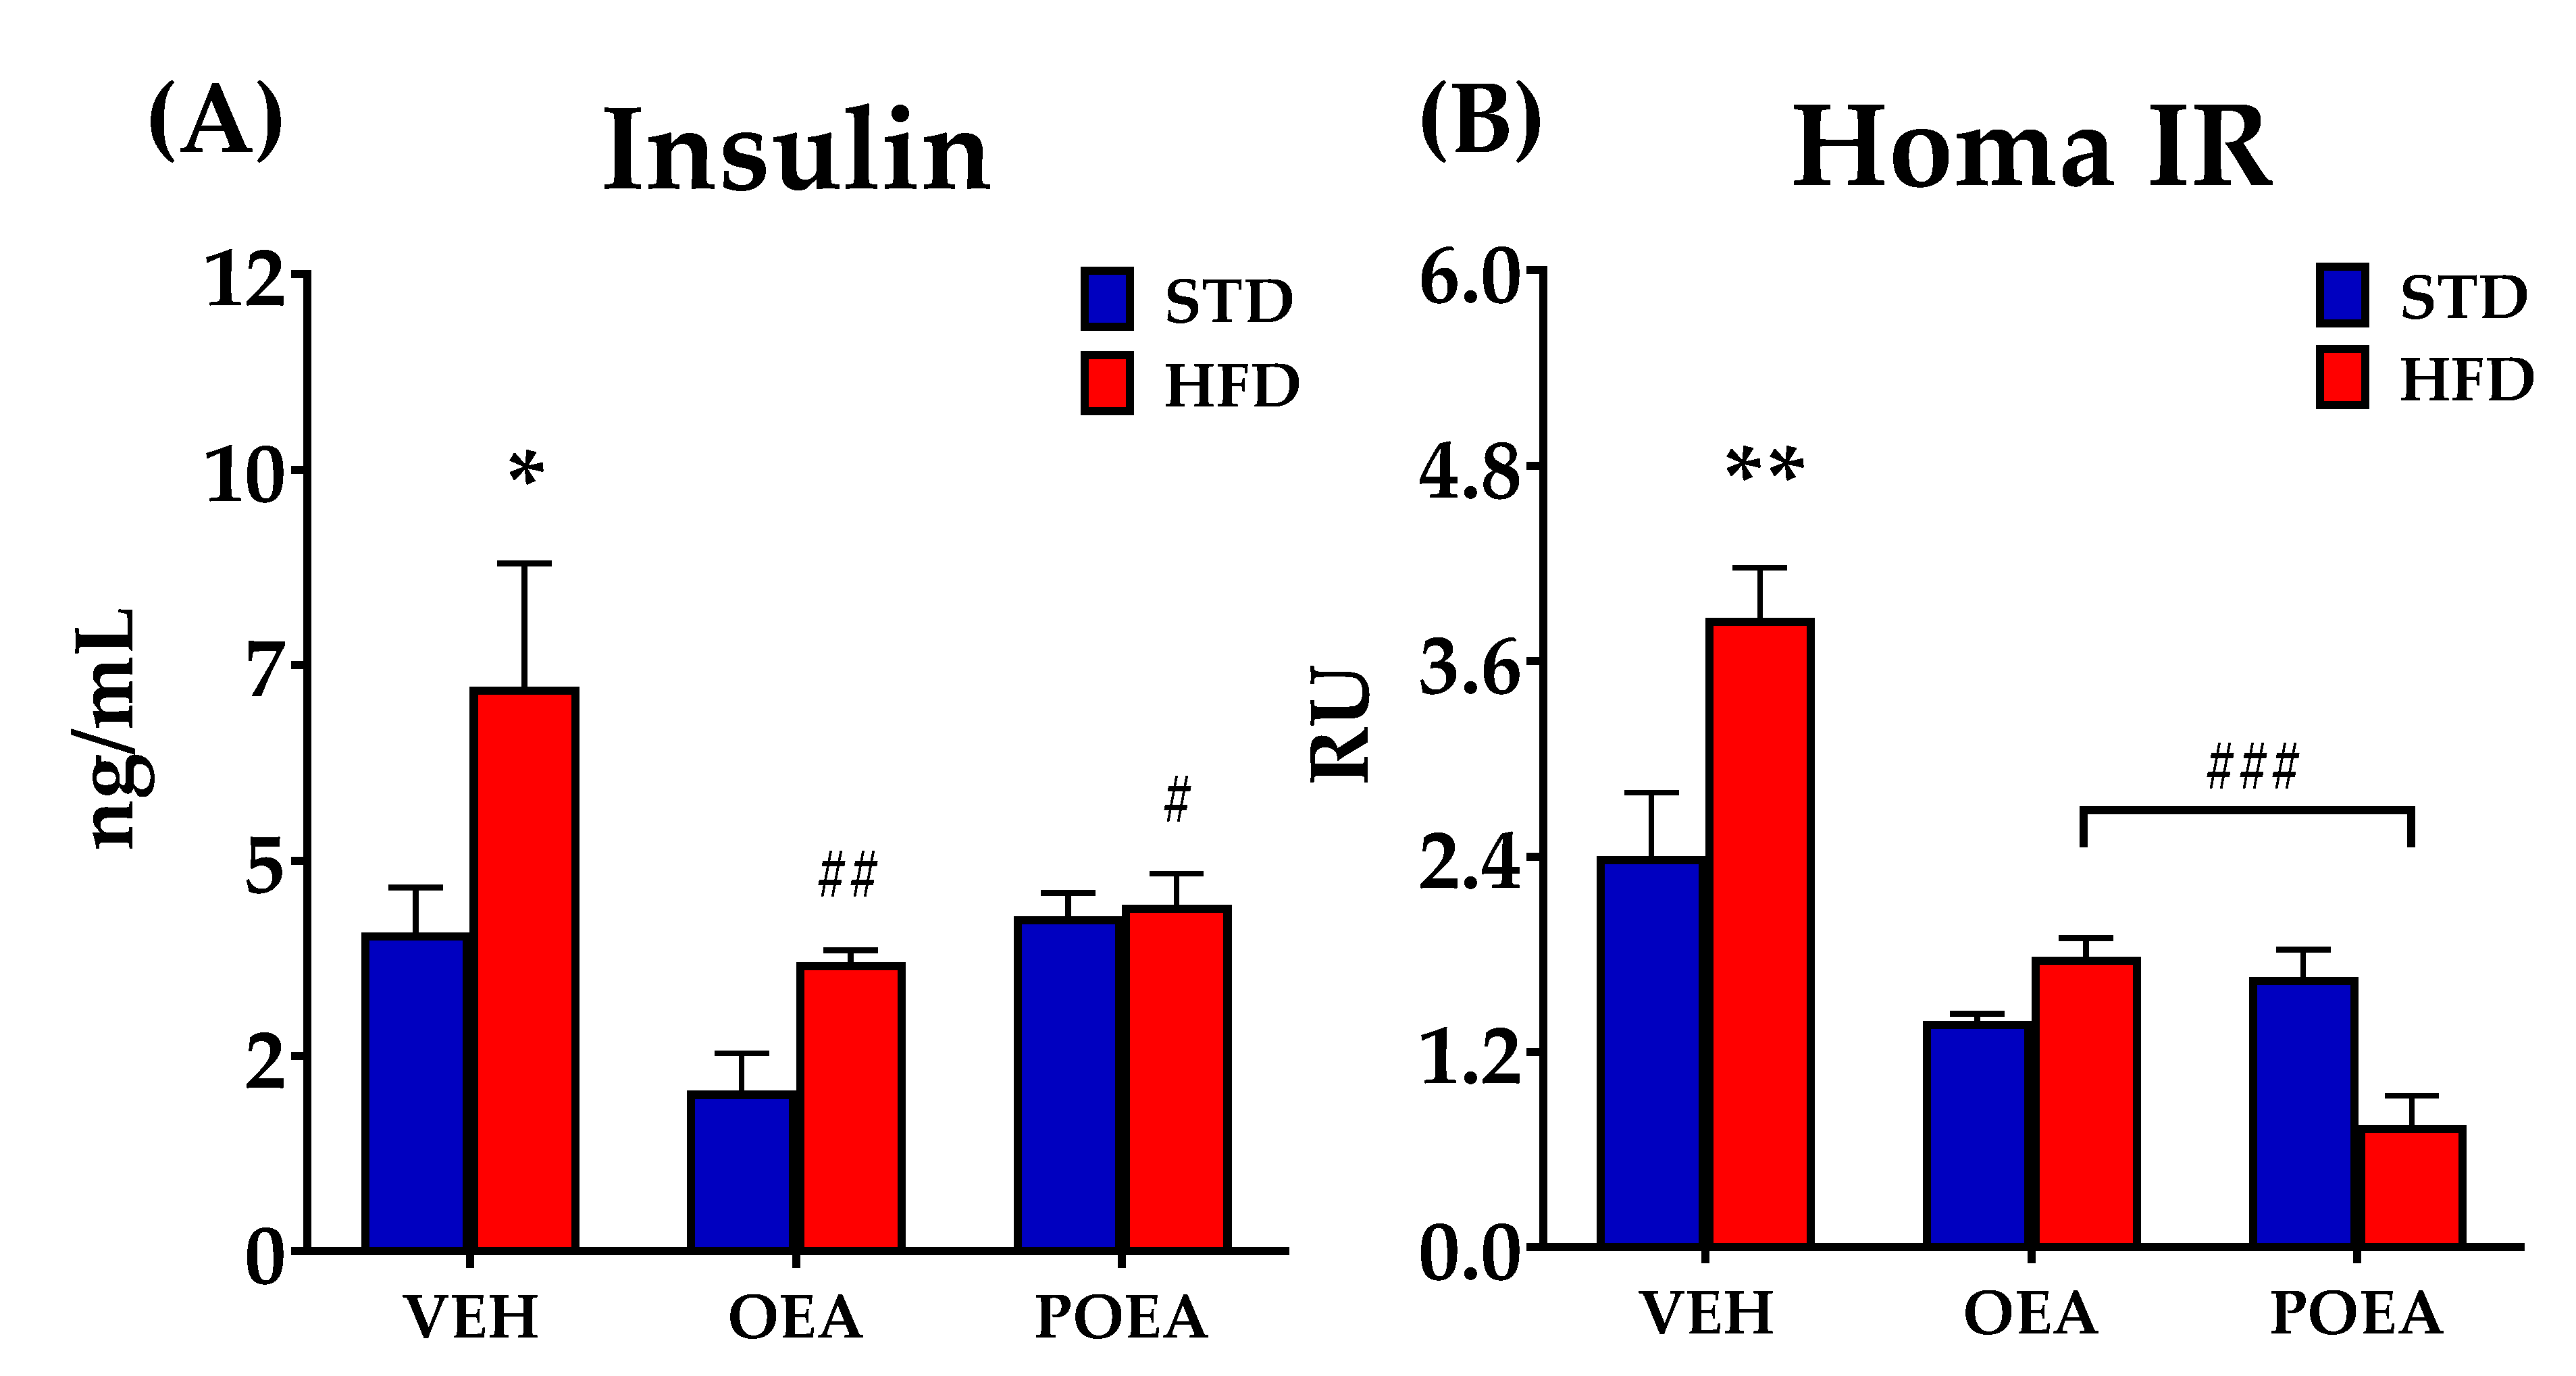
3.5. Effect of OEA and POEA on Insulin Resistance
3.6. NAEs Reduce the Plasma Concentration of Pro-Inflammatory Cytokines IL-6 and TNF-α
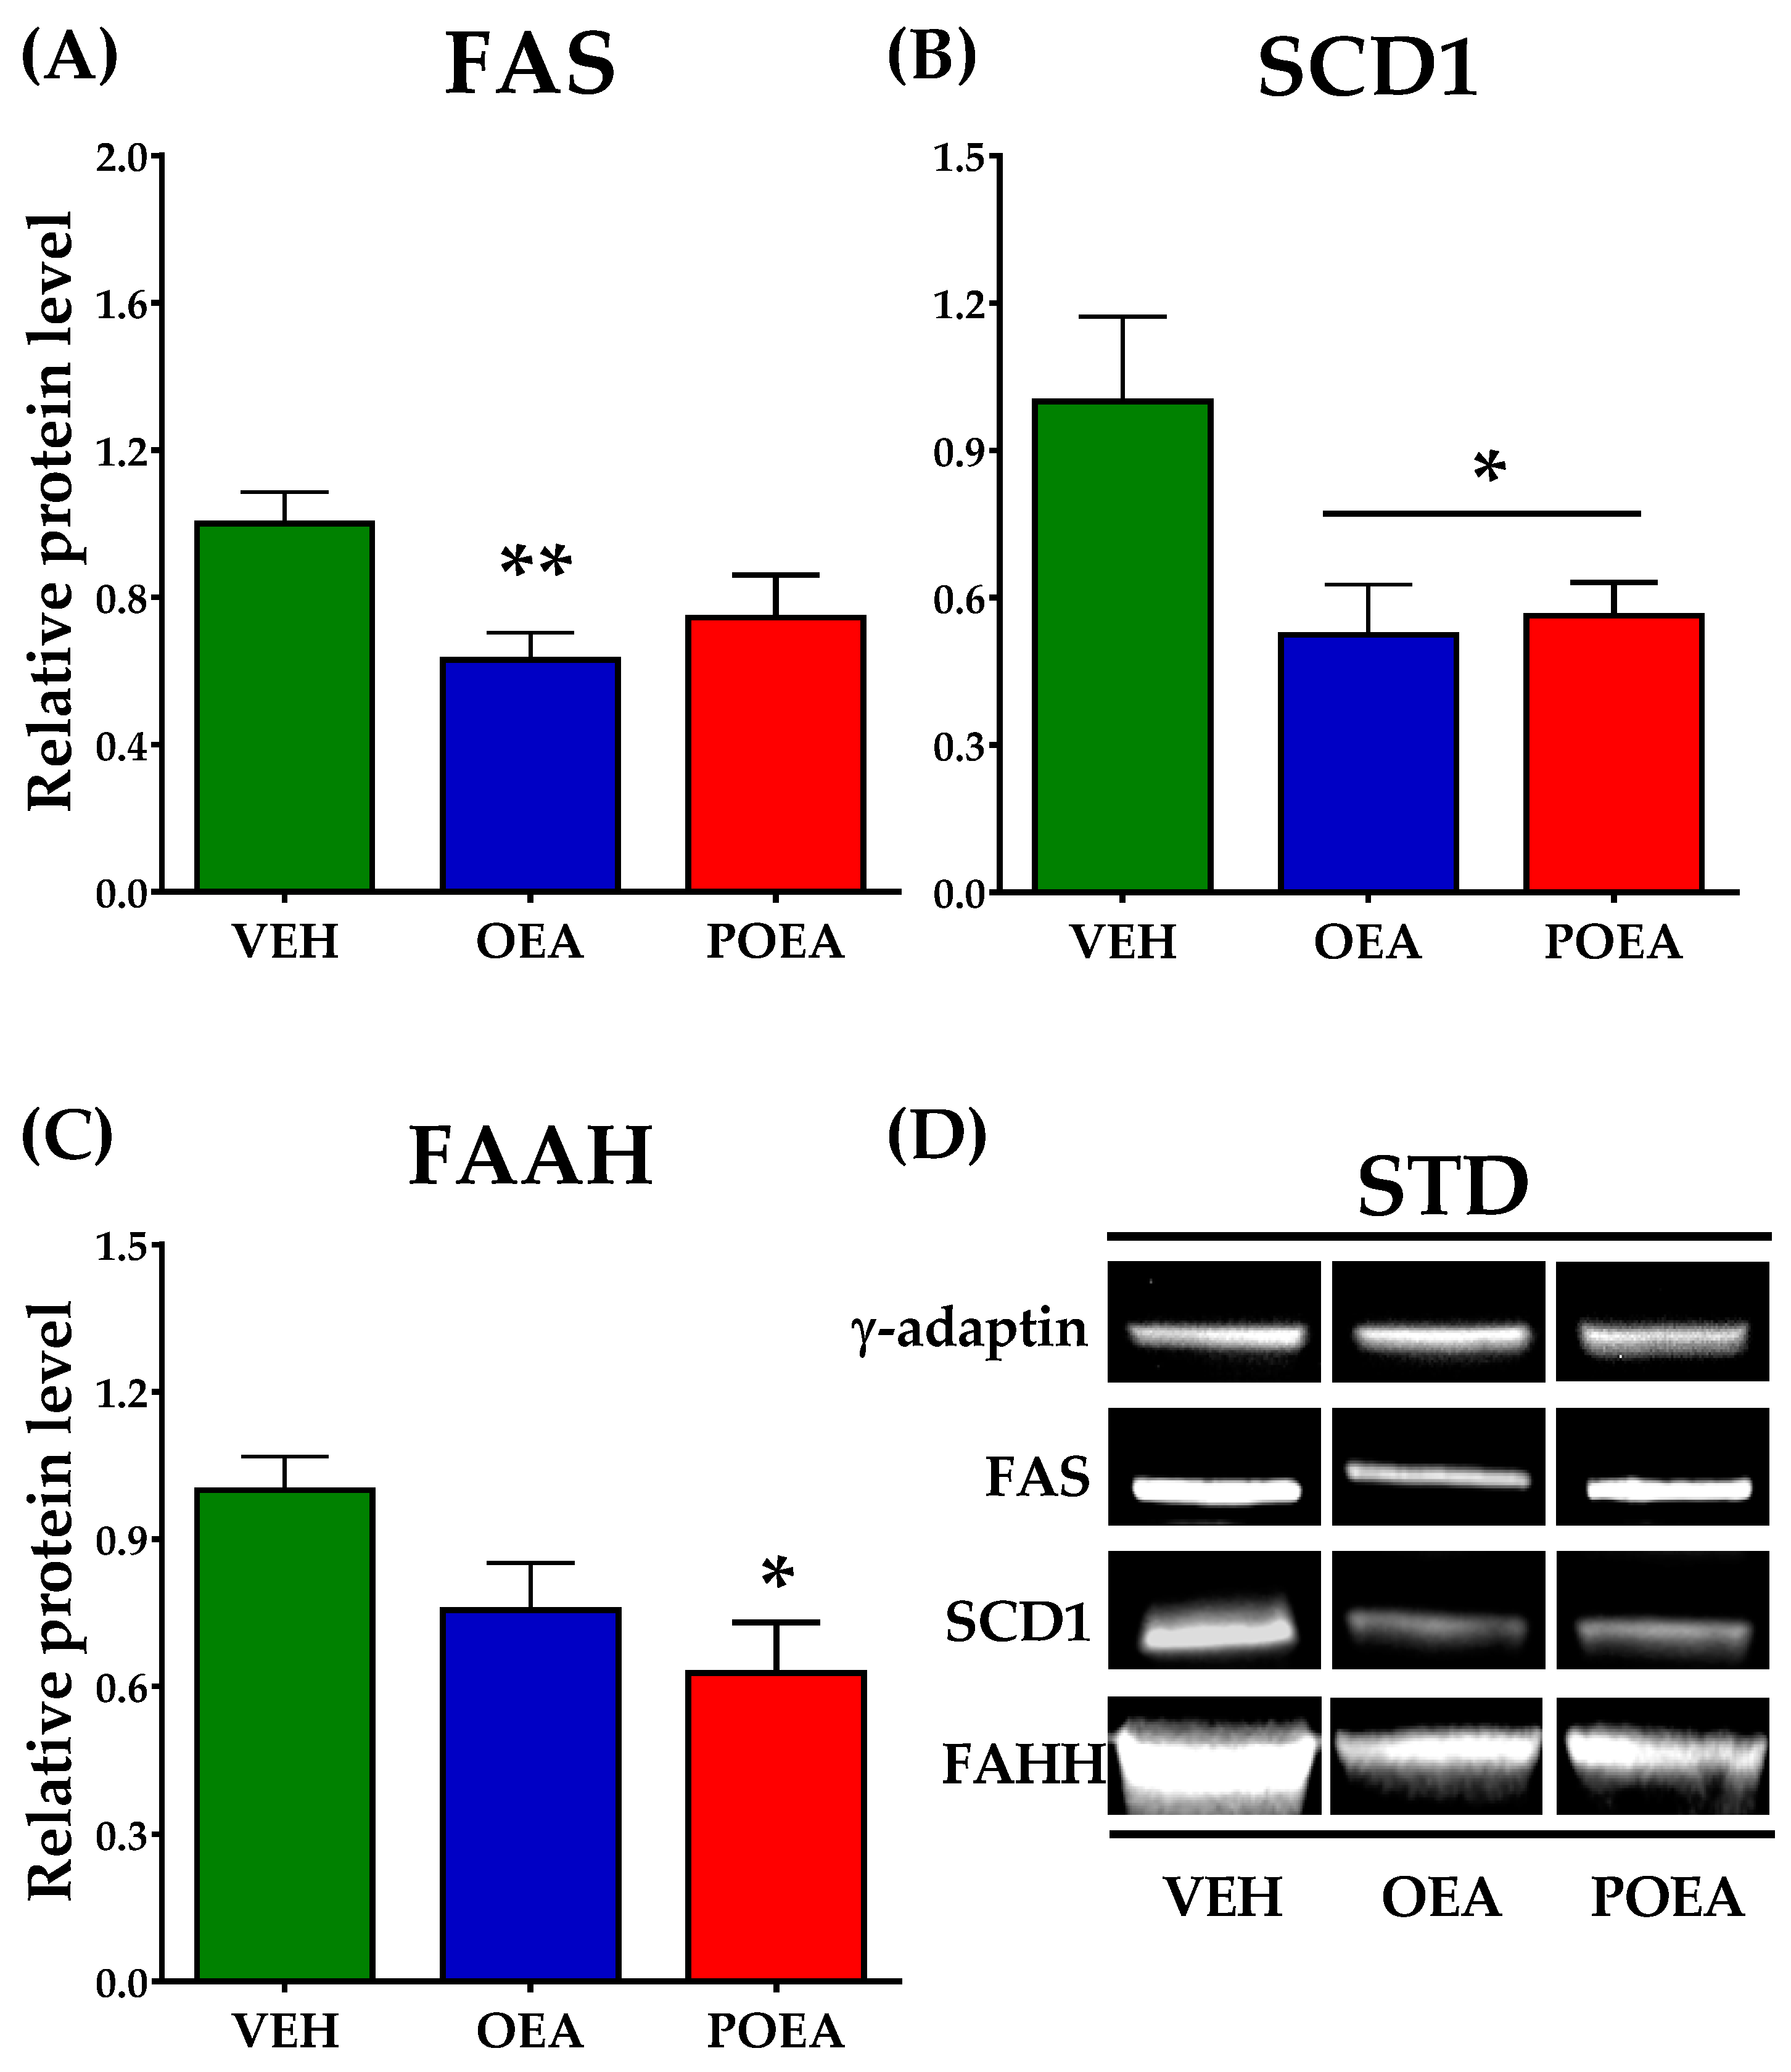
3.7. Effects of Repeated OEA and POE Administration on the Expression of Enzymes Involved in Fatty Acid Synthesis and NAEs Degradation in the Liver
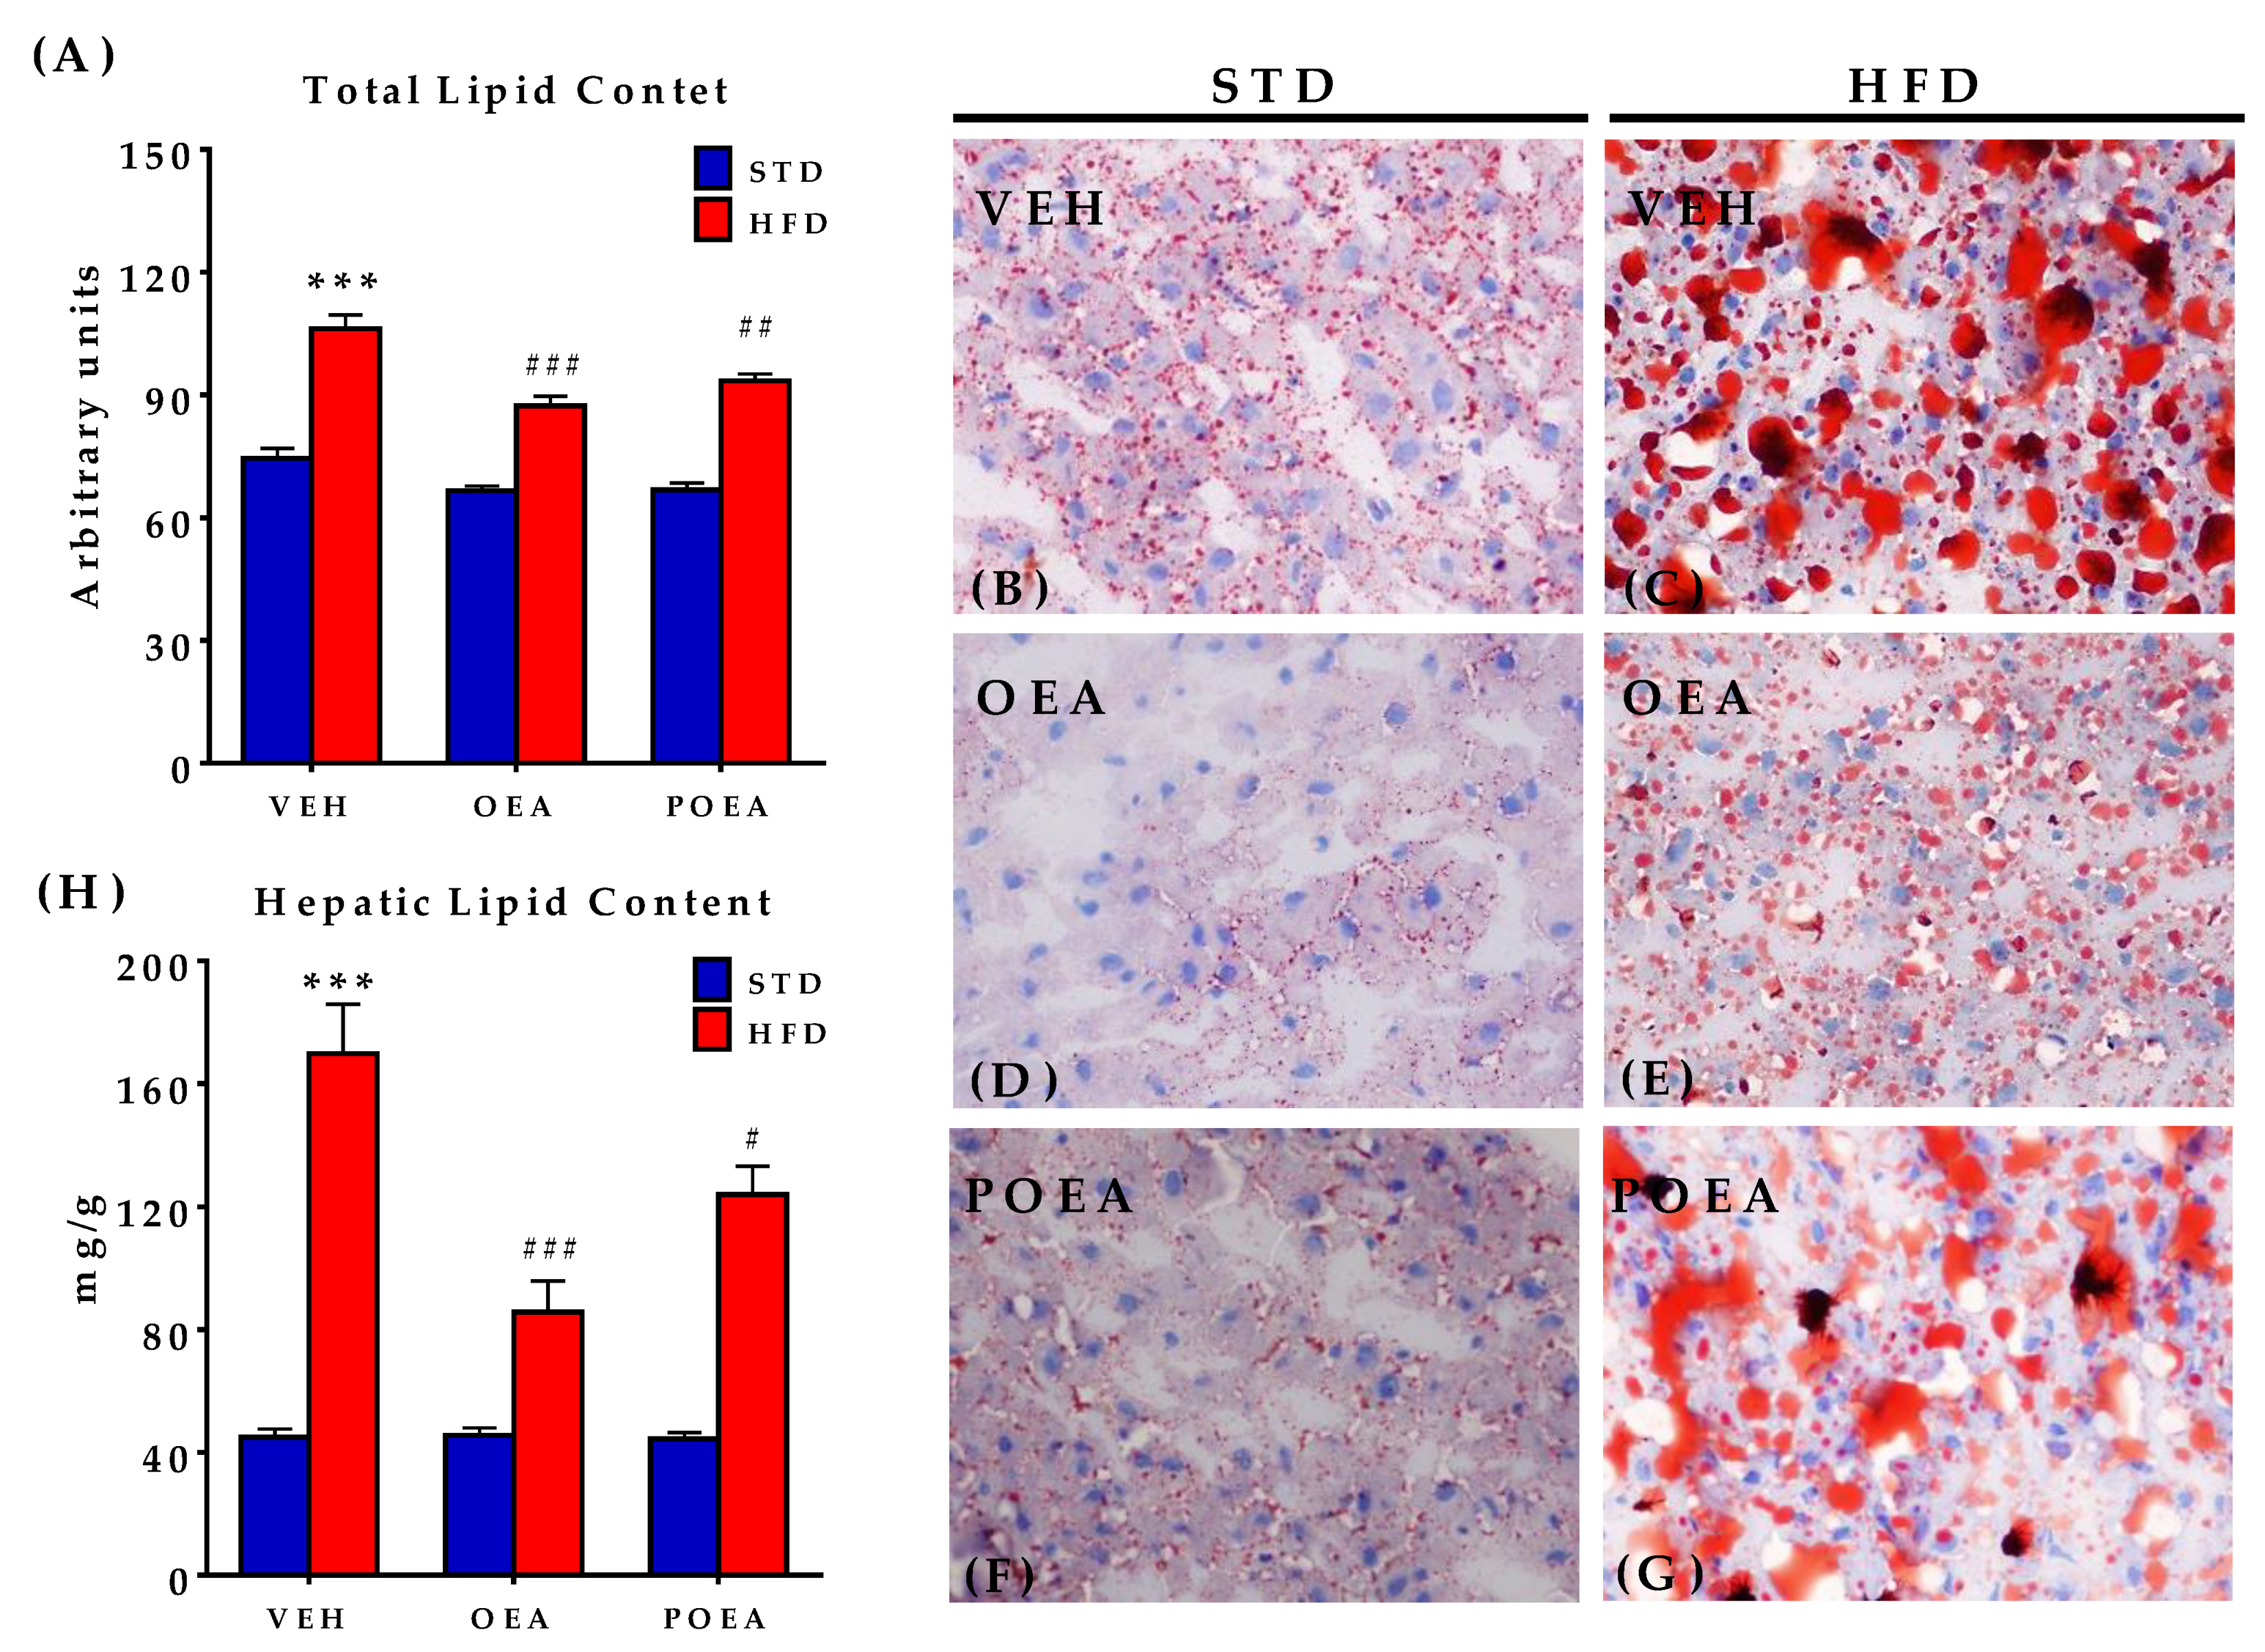
3.8. Analysis of Liver Steatosis after NAEs Treatment
4. Discussion
5. Conclusions
Supplementary Materials
Author Contributions
Funding
Institutional Review Board Statement
Informed Consent Statement
Data Availability Statement
Acknowledgments
Conflicts of Interest
References
- Stein, C.J.; Colditz, G.A. The epidemic of obesity. J. Clin. Endocrinol. Metab. 2004, 89, 2522–2525. [Google Scholar] [CrossRef] [PubMed] [Green Version]
- Venables, B.J.; Waggoner, C.A.; Chapman, K.D. N-acylethanolamines in seeds of selected legumes. Phytochem 2005, 66, 1913–1918. [Google Scholar] [CrossRef] [PubMed]
- Pertwee, R.G. Pharmacology of cannabinoid receptor ligands. Curr. Med. Chem. 1999, 6, 635–664. [Google Scholar] [PubMed]
- O’Sullivan, S.E. Cannabinoids go nuclear: Evidence for activation of Peroxisome proliferator-activated receptors. Br. J. Pharmacol. 2007, 152, 576–582. [Google Scholar] [CrossRef] [PubMed] [Green Version]
- Devane, W.A.; Hanus, L.; Breuer, A.; Pertwee, R.G.; Stevenson, L.A.; Griffin, G.; Gibson, D.; Mandelbaum, A.; Etinger, A.; Mechoulam, R. Isolation and structure of a brain constituent that binds to the cannabinoid receptor. Science 1992, 258, 1946–1949. [Google Scholar] [CrossRef] [PubMed]
- Mechoulam, R.; Ben-Shabat, S.; Hanus, L.; Ligumsky, M.; Kaminski, N.E.; Schatz, A.R.; Gopher, A.; Almog, S.; Martin, B.R.; Compton, D.R.; et al. Identification of an endogenous 2-monoglyceride, present in canine gut, that binds to cannabinoid receptors. Biochem. Pharmacol. 1995, 50, 83–90. [Google Scholar] [CrossRef]
- Lu, H.C.; Mackie, K. An Introduction to the Endogenous Cannabinoid System. Biol. Psychiatry 2016, 79, 516–525. [Google Scholar] [CrossRef] [Green Version]
- Curioni, C.; Andre, C. Rimonabant for overweight or obesity. Cochrane Database Syst. Rev. 2006, 4, CD006162. [Google Scholar] [CrossRef] [PubMed]
- Bermudez-Silva, F.J.; Viveros, M.P.; McPartland, J.M.; Rodriguez de Fonseca, F. The endocannabinoid system, eating behavior and energy homeostasis: The end or a new beginning? Pharm. Biochem. Behav. 2010, 95, 375–382. [Google Scholar] [CrossRef]
- Rodriguez de Fonseca, F.; Navarro, M.; Gomez, R.; Escuredo, L.; Nava, F.; Fu, J.; Murillo-Rodriguez, E.; Giuffrida, A.; LoVerme, J.; Gaetani, S.; et al. An anorexic lipid mediator regulated by feeding. Nature 2001, 414, 209–212. [Google Scholar] [CrossRef] [Green Version]
- Fu, J.; Gaetani, S.; Oveisi, F.; Lo Verme, J.; Serrano, A.; Rodriguez De Fonseca, F.; Rosengarth, A.; Luecke, H.; Di Giacomo, B.; Tarzia, G.; et al. Oleylethanolamide regulates feeding and body weight through activation of the nuclear receptor PPAR-alpha. Nature 2003, 425, 90–93. [Google Scholar] [CrossRef]
- Suardiaz, M.; Estivill-Torrus, G.; Goicoechea, C.; Bilbao, A.; Rodriguez de Fonseca, F. Analgesic properties of Oleoylethanolamide (OEA) in visceral and inflammatory pain. Pain 2007, 133, 99–110. [Google Scholar] [CrossRef]
- Ueda, N.; Tsuboi, K.; Uyama, T. Metabolism of endocannabinoids and related N-acylethanolamines: Canonical and alternative pathways. FEBS J. 2013, 280, 1874–1894. [Google Scholar] [CrossRef]
- Tsuboi, K.; Uyama, T.; Okamoto, Y.; Ueda, N. Endocannabinoids and related N-acylethanolamines: Biological activities and metabolism. Inflamm. Regen. 2018, 38, 1–10. [Google Scholar] [CrossRef]
- Schoonjans, K.; Martin, G.; Staels, B.; Auwerx, J. Peroxisome proliferator-activated receptors, orphans with ligands and functions. Curr. Opin. Lipidol. 1997, 8, 159–166. [Google Scholar] [CrossRef]
- Nissen, S.E.; Nicholls, S.J.; Wolski, K.; Howey, D.C.; McErlean, E.; Wang, M.D.; Gomez, E.V.; Russo, J.M. Effects of a potent and selective PPAR-alpha agonist in patients with atherogenic dyslipidemia or hypercholesterolemia: Two randomized controlled trials. JAMA 2007, 297, 1362–1373. [Google Scholar] [CrossRef] [Green Version]
- Janani, C.; Ranjitha Kumari, B.D. PPAR gamma gene a review. Diabetes Metab. Syndr. 2015, 9, 46–50. [Google Scholar] [CrossRef]
- Gomez, R.; Navarro, M.; Ferrer, B.; Trigo, J.M.; Bilbao, A.; Del Arco, I.; Cippitelli, A.; Nava, F.; Piomelli, D.; Rodriguez de Fonseca, F. A peripheral mechanism for CB1 cannabinoid receptor-dependent modulation of feeding. J. Neurosci. 2002, 22, 9612–9617. [Google Scholar] [CrossRef] [PubMed] [Green Version]
- Lo Verme, J.; Gaetani, S.; Fu, J.; Oveisi, F.; Burton, K.; Piomelli, D. Regulation of food intake by Oleoylethanolamide. Cell. Mol. Life Sci. CMLS 2005, 62, 708–716. [Google Scholar] [CrossRef] [PubMed] [Green Version]
- Kokatnur, M.G.; Oalmann, M.C.; Johnson, W.D.; Malcom, G.T.; Strong, J.P. Fatty acid composition of human adipose tissue from two anatomical sites in a biracial community. Am. J. Clin. Nutr. 1979, 32, 2198–2205. [Google Scholar] [CrossRef] [PubMed] [Green Version]
- Huth, P.J.; Fulgoni, V.L., III; Larson, B.T. A systematic review of high-oleic vegetable oil substitutions for other fats and oils on cardiovascular disease risk factors: Implications for novel high-oleic soybean oils. Adv. Nutr. 2015, 6, 674–693. [Google Scholar] [CrossRef] [PubMed] [Green Version]
- Mennella, I.; Savarese, M.; Ferracane, R.; Sacchi, R.; Vitaglione, P. Oleic acid content of a meal promotes Oleoylethanolamide response and reduces subsequent energy intake in humans. Food Funct. 2015, 6, 204–210. [Google Scholar] [CrossRef]
- Lucanic, M.; Held, J.M.; Vantipalli, M.C.; Klang, I.M.; Graham, J.B.; Gibson, B.W.; Lithgow, G.J.; Gill, M.S. N-acylethanolamine signalling mediates the effect of diet on lifespan in Caenorhabditis elegans. Nature 2011, 473, 226–229. [Google Scholar] [CrossRef]
- Syed, S.K.; Bui, H.H.; Beavers, L.S.; Farb, T.B.; Ficorilli, J.; Chesterfield, A.K.; Kuo, M.S.; Bokvist, K.; Barrett, D.G.; Efanov, A.M. Regulation of GPR119 receptor activity with endocannabinoid-like lipids. Am. J. Physiology. Endocrinol. Metab. 2012, 303, E1469–E1478. [Google Scholar] [CrossRef]
- Cao, H.; Gerhold, K.; Mayers, J.R.; Wiest, M.M.; Watkins, S.M.; Hotamisligil, G.S. Identification of a lipokine, a lipid hormone linking adipose tissue to systemic metabolism. Cell 2008, 134, 933–944. [Google Scholar] [CrossRef] [Green Version]
- Decara, J.M.; Romero-Cuevas, M.; Rivera, P.; Macias-Gonzalez, M.; Vida, M.; Pavon, F.J.; Serrano, A.; Cano, C.; Fresno, N.; Perez-Fernandez, R.; et al. Elaidyl-sulfamide, an Oleoylethanolamide-modelled PPARalpha agonist, reduces body weight gain and plasma cholesterol in rats. Dis. Models Mech. 2012, 5, 660–670. [Google Scholar]
- Warnick, G.R.; Knopp, R.H.; Fitzpatrick, V.; Branson, L. Estimating low-density lipoprotein cholesterol by the Friedewald equation is adequate for classifying patients on the basis of nationally recommended cutpoints. Clin. Chem. 1990, 36, 15–19. [Google Scholar] [CrossRef] [PubMed]
- Matthews, D.R.; Hosker, J.P.; Rudenski, A.S.; Naylor, B.A.; Treacher, D.F.; Turner, R.C. Homeostasis model assessment: Insulin resistance and beta-cell function from fasting plasma glucose and insulin concentrations in man. Diabetoogia 1985, 28, 412–419. [Google Scholar] [CrossRef] [Green Version]
- Decara, J.M.; Pavon, F.J.; Suarez, J.; Romero-Cuevas, M.; Baixeras, E.; Vazquez, M.; Rivera, P.; Gavito, A.L.; Almeida, B.; Joglar, J.; et al. Treatment with a novel oleic-acid-dihydroxyamphetamine conjugation ameliorates non-alcoholic fatty liver disease in obese Zucker rats. Dis. Models Mech. 2015, 8, 1213–1225. [Google Scholar] [CrossRef] [Green Version]
- Arrabal, S.; Lucena, M.A.; Canduela, M.J.; Ramos-Uriarte, A.; Rivera, P.; Serrano, A.; Pavon, F.J.; Decara, J.; Vargas, A.; Baixeras, E.; et al. Pharmacological Blockade of Cannabinoid CB1 Receptors in diet-induced obesity regulates mitochondrial dihydrolipoamide dehydrogenase in muscle. PLoS ONE 2015, 10, e0145244. [Google Scholar] [CrossRef] [PubMed] [Green Version]
- Wulff-Perez, M.; Pavon, F.J.; Martin-Rodriguez, A.; de Vicente, J.; Alen, F.; de Fonseca, F.R.; Galvez-Ruiz, M.J.; Serrano, A. Preparation, characterization and in vivo evaluation of nanoemulsions for the controlled delivery of the antiobesity agent N-oleoylethanolamine. Nanomedicine 2014, 9, 2761–2772. [Google Scholar] [CrossRef]
- De Luca, L.; Ferracane, R.; Vitaglione, P. Food database of N-acyl-phosphatidylethanolamines, N-acylethanolamines and endocannabinoids and daily intake from a Western, a Mediterranean and a vegetarian diet. Food Chem. 2019, 300, 125218. [Google Scholar] [CrossRef] [PubMed]
- Jakob, T.; Nordmann, A.J.; Schandelmaier, S.; Ferreira-Gonzalez, I.; Briel, M. Fibrates for primary prevention of cardiovascular disease events. Cochrane Database Syst. Rev. 2016, 11, CD009753. [Google Scholar] [CrossRef]
- Serrano, A.; Del Arco, I.; Javier Pavon, F.; Macias, M.; Perez-Valero, V.; Rodriguez de Fonseca, F. The cannabinoid CB1 receptor antagonist SR141716A (Rimonabant) enhances the metabolic benefits of long-term treatment with Oleoylethanolamide in Zucker rats. Neuropharmacology 2008, 54, 226–234. [Google Scholar] [CrossRef] [PubMed]
- Suarez, J.; Romero-Zerbo, Y.; Marquez, L.; Rivera, P.; Iglesias, M.; Bermudez-Silva, F.J.; Andreu, M.; Rodriguez de Fonseca, F. Ulcerative colitis impairs the Acylethanolamide-based anti-inflammatory system reversal by 5-aminosalicylic acid and glucocorticoids. PLoS ONE 2012, 7, e37729. [Google Scholar] [CrossRef] [PubMed]
- Decara, J.; Rivera, P.; Lopez-Gambero, A.J.; Serrano, A.; Pavon, F.J.; Baixeras, E.; Rodriguez de Fonseca, F.; Suarez, J. Peroxisome Proliferator-Activated Receptors: Experimental Targeting for the Treatment of Inflammatory Bowel Diseases. Front. Pharmacol. 2020, 11, 730. [Google Scholar] [CrossRef] [PubMed]
- Sayd, A.; Anton, M.; Alen, F.; Caso, J.R.; Pavon, J.; Leza, J.C.; Rodriguez de Fonseca, F.; Garcia-Bueno, B.; Orio, L. Systemic administration of Oleoylethanolamide protects from neuroinflammation and anhedonia induced by LPS in rats. Int. J. Neuropsychopharmacol. 2014, 18, pyu111. [Google Scholar] [CrossRef] [Green Version]
- Artmann, A.; Petersen, G.; Hellgren, L.I.; Boberg, J.; Skonberg, C.; Nellemann, C.; Hansen, S.H.; Hansen, H.S. Influence of dietary fatty acids on endocannabinoid and N-acylethanolamine levels in rat brain, liver and small intestine. Biochim. Biophys Acta 2008, 1781, 200–212. [Google Scholar] [CrossRef]
- Gillingham, L.G.; Harris-Janz, S.; Jones, P.J. Dietary monounsaturated fatty acids are protective against metabolic syndrome and cardiovascular disease risk factors. Lipids 2011, 46, 209–228. [Google Scholar] [CrossRef]
- Overton, H.A.; Fyfe, M.C.; Reynet, C. GPR119, a novel G protein-coupled receptor target for the treatment of type 2 diabetes and obesity. Br. J. Pharmacol. 2008, 153, S76–S81. [Google Scholar] [CrossRef] [Green Version]
- Lipina, C.; Walsh, S.K.; Mitchell, S.E.; Speakman, J.R.; Wainwright, C.L.; Hundal, H.S. GPR55 deficiency is associated with increased adiposity and impaired insulin signaling in peripheral metabolic tissues. FASEB J. 2019, 33, 1299–1312. [Google Scholar] [CrossRef] [PubMed] [Green Version]
- de Souza, C.O.; Vannice, G.K.; Rosa Neto, J.C.; Calder, P.C. Is palmitoleic acid a Plausible nonpharmacological strategy to prevent or control chronic metabolic and inflammatory disorders? Mol. Nutr. Food Res. 2018, 62, 1700504. [Google Scholar] [CrossRef] [PubMed] [Green Version]


| STD | Regular Rodent Diet | Amount (%) | kcal (g) | FAT per 100 g of food | |
|---|---|---|---|---|---|
| Saturated | Unsaturated | ||||
| Rat chow pellets | (4RF18) Mucedola | 100 | 2.60 | 1.4 | 5.0 |
| Total kcal/g of STD Food | 2.60 | ||||
| Palatable HFD | Description (Italian Food) | Amount (%) | kcal (g) | FAT per 100 g of food | |
| Saturated | Unsaturated | ||||
| Mortadella | Mortadella Italiana | 10 | 3.21 | 8.0 | 17.0 |
| Rusk | Crostini | 8 | 5.53 | 5.4 | 6.6 |
| Cookie with cream | Macine con panna | 18 | 5.44 | 5.1 | 12.9 |
| Muffin with chocolate | Muffin con ciocolatto | 22 | 4.56 | 3.1 | 13.9 |
| Cheese | Parmeggiano Reggiano | 14 | 4.38 | 17.0 | 11.0 |
| Snack | Patatine al formaggio | 16 | 5.35 | 3.3 | 21.7 |
| Flavored lard | Lardo | 12 | 9.04 | 34.0 | 53.0 |
| Total kcal/g of HFD Food | 5.30 | ||||
| Standard Diet (STD) | |||
|---|---|---|---|
| Plasma Metabolites | VEH | OEA | POEA |
| Glucose (mg/dL) | 164.00 ± 8.45 | 168.57 ± 4.50 | 160.33 ± 12.37 |
| Triglycerides (mg/dL) | 150.29 ± 12.27 | 161.20 ± 8.82 | 136.33 ± 7.93 |
| Cholesterol (mg/dL) | 68.83 ± 4.80 | 48.29 ± 3.76 * | 69.83 ± 7.42 |
| VLDL (mg/dL) | 27.67 ± 1.30 | 30.06 ± 2.45 | 32.24 ± 1.76 |
| LDL (mg/dL) | 77.90 ± 7.55 | 72.06 ± 7.67 | 87.43 ± 7.47 |
| HDL (mg/dL) | 10.57 ± 1.70 | 19.90 ± 1.34 * | 23.60 ± 6.09 |
| Uric acid (mg/dL) | 2.28 ± 0.34 | 1.40 ± 0.22 | 1.97 ± 0.36 |
| Urea (mg/dL) | 16.86 ± 1.40 | 14.00 ± 1.29 | 13.40 ± 1.14 |
| Creatinine (mg/dL) | 0.75 ± 0.09 | 1.00 ± 0.19 | 0.53 ± 0.15 |
| Bilirubin (mg/dL) | 0.18 ± 0.02 | 0.19 ± 0.02 | 0.10 ± 0.00 * |
| AST (UI) | 150.57 ± 19.91 | 138.00 ± 27.06 | 160.67 ± 24.25 |
| ALT (UI) | 53.14 ± 9.66 | 69.67 ± 11.14 | 58.40 ± 11.71 |
| Hypercaloric Cafeteria Diet (HFD) | |||
|---|---|---|---|
| Plasma Metabolites | VEH | OEA | POEA |
| Glucose (mg/dL) | 380.00 ± 9.08 *** | 168.20 ± 17.11 ### | 167.60 ± 8.28 ### |
| Triglycerides (mg/dL) | 368.75 ± 82.68 ** | 173.00 ± 7.68 ### | 198.00 ± 12.18 ## |
| Cholesterol (mg/dL) | 211.00 ± 35.35 *** | 75.20 ± 2.55 ### | 79.40 ± 3.80 ### |
| VLDL (mg/dL) | 73.75 ± 16.53 ** | 34.60 ± 1.54 ## | 39.60 ± 4.44 ## |
| LDL (mg/dL) | 106.82 ± 5.02 ** | 72.06 ± 7.67 ## | 97.59 ± 5.20 |
| HDL (mg/dL) | 20.52 ± 0.95 *** | 72.06 ± 7.67 ### | 28,72 ± 2.94 # |
| Uric acid (mg/dL) | 9.38 ± 1.95 *** | 1.64 ± 0.25 ### | 3.21 ± 0.90 ### |
| Urea (mg/dL) | 72.92 ± 3.29 *** | 33.75 ± 4.17 ### | 43.30 ± 3.02 ### |
| Creatinine (mg/dL) | 1.74 ± 0.12 ** | 0.69 ± 0.21 ### | 0.87 ± 0.23 ## |
| Bilirubin (mg/dL) | 0.99 ± 0.31 ** | 0.21 ± 0.03 ## | 0.31 ± 0.12 ## |
| AST (UI) | 553.00 ± 41.37 *** | 288.33 ± 34.17 ## | 400.40 ± 33.10 ## |
| ALT (UI) | 206.33 ± 28.93 *** | 85.00 ± 9.05 ### | 140.40 ± 29.76 |
Publisher’s Note: MDPI stays neutral with regard to jurisdictional claims in published maps and institutional affiliations. |
© 2021 by the authors. Licensee MDPI, Basel, Switzerland. This article is an open access article distributed under the terms and conditions of the Creative Commons Attribution (CC BY) license (https://creativecommons.org/licenses/by/4.0/).
Share and Cite
Tovar, R.; Gavito, A.L.; Vargas, A.; Soverchia, L.; Hernandez-Folgado, L.; Jagerovic, N.; Baixeras, E.; Ciccocioppo, R.; Rodríguez de Fonseca, F.; Decara, J. Palmitoleoylethanolamide Is an Efficient Anti-Obesity Endogenous Compound: Comparison with Oleylethanolamide in Diet-Induced Obesity. Nutrients 2021, 13, 2589. https://doi.org/10.3390/nu13082589
Tovar R, Gavito AL, Vargas A, Soverchia L, Hernandez-Folgado L, Jagerovic N, Baixeras E, Ciccocioppo R, Rodríguez de Fonseca F, Decara J. Palmitoleoylethanolamide Is an Efficient Anti-Obesity Endogenous Compound: Comparison with Oleylethanolamide in Diet-Induced Obesity. Nutrients. 2021; 13(8):2589. https://doi.org/10.3390/nu13082589
Chicago/Turabian StyleTovar, Rubén, Ana Luisa Gavito, Antonio Vargas, Laura Soverchia, Laura Hernandez-Folgado, Nadine Jagerovic, Elena Baixeras, Roberto Ciccocioppo, Fernando Rodríguez de Fonseca, and Juan Decara. 2021. "Palmitoleoylethanolamide Is an Efficient Anti-Obesity Endogenous Compound: Comparison with Oleylethanolamide in Diet-Induced Obesity" Nutrients 13, no. 8: 2589. https://doi.org/10.3390/nu13082589
APA StyleTovar, R., Gavito, A. L., Vargas, A., Soverchia, L., Hernandez-Folgado, L., Jagerovic, N., Baixeras, E., Ciccocioppo, R., Rodríguez de Fonseca, F., & Decara, J. (2021). Palmitoleoylethanolamide Is an Efficient Anti-Obesity Endogenous Compound: Comparison with Oleylethanolamide in Diet-Induced Obesity. Nutrients, 13(8), 2589. https://doi.org/10.3390/nu13082589