
A Food, a Bite, a Sip: How Much Allergen Is in That?


Abstract
1. Introduction
2. Materials and Methods
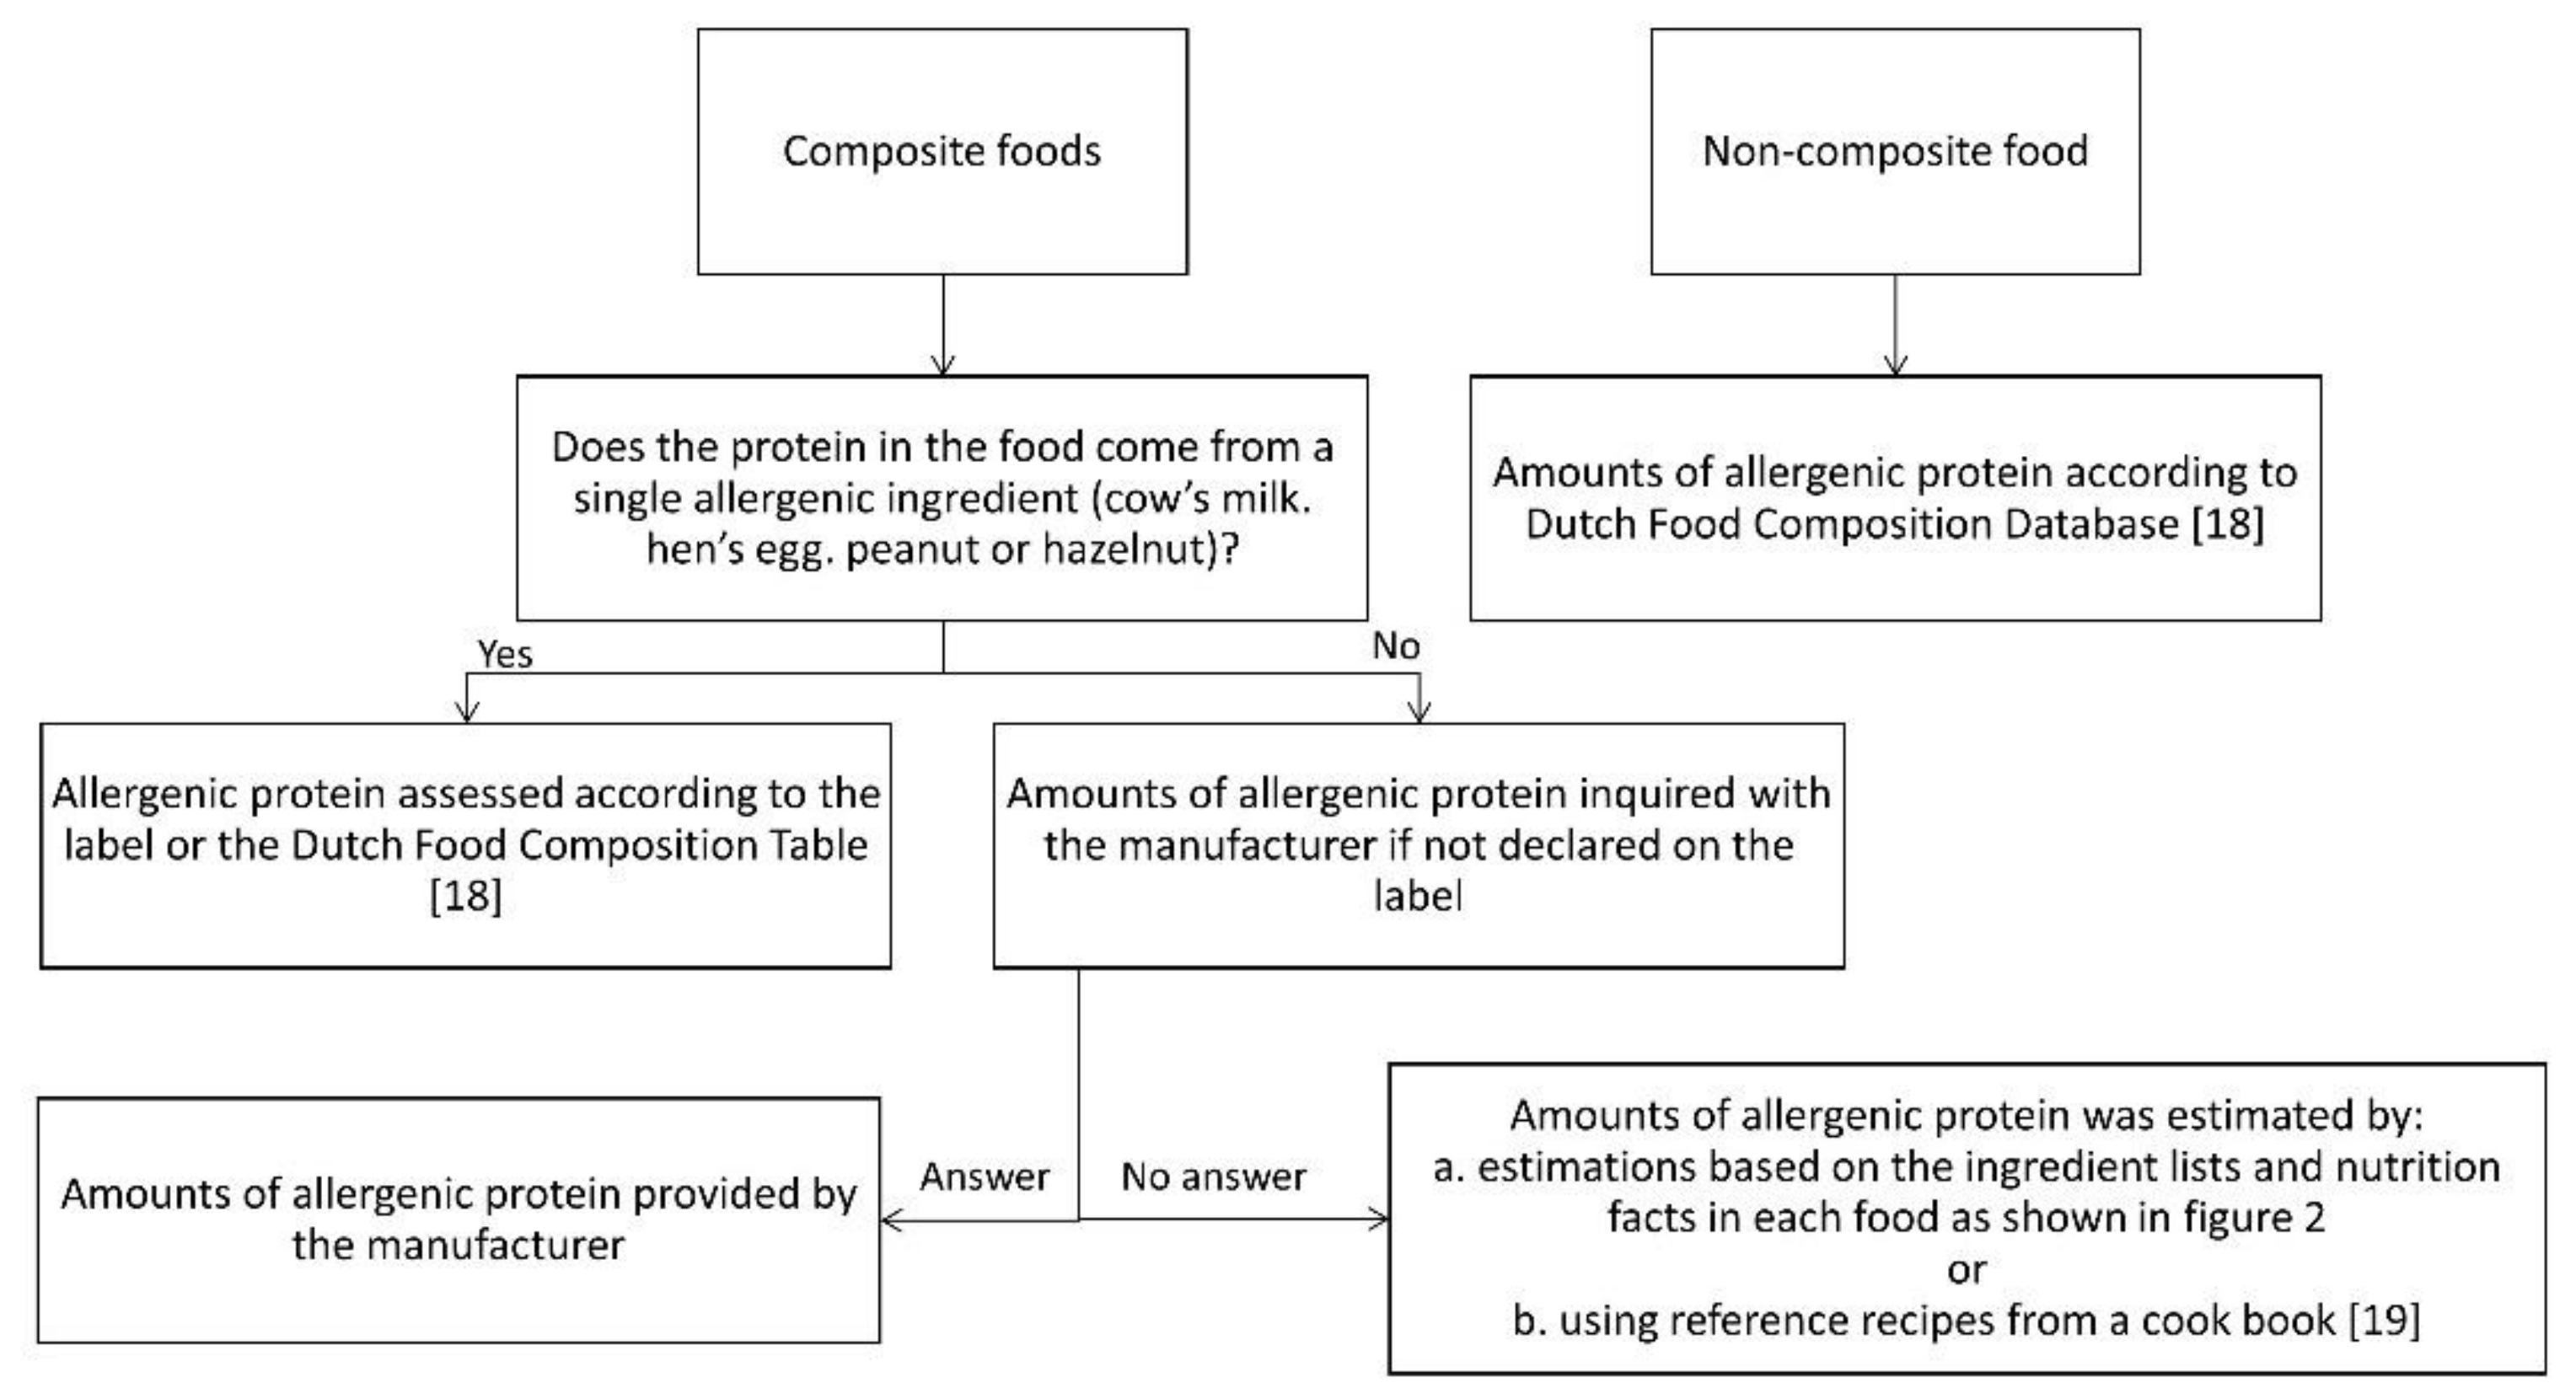
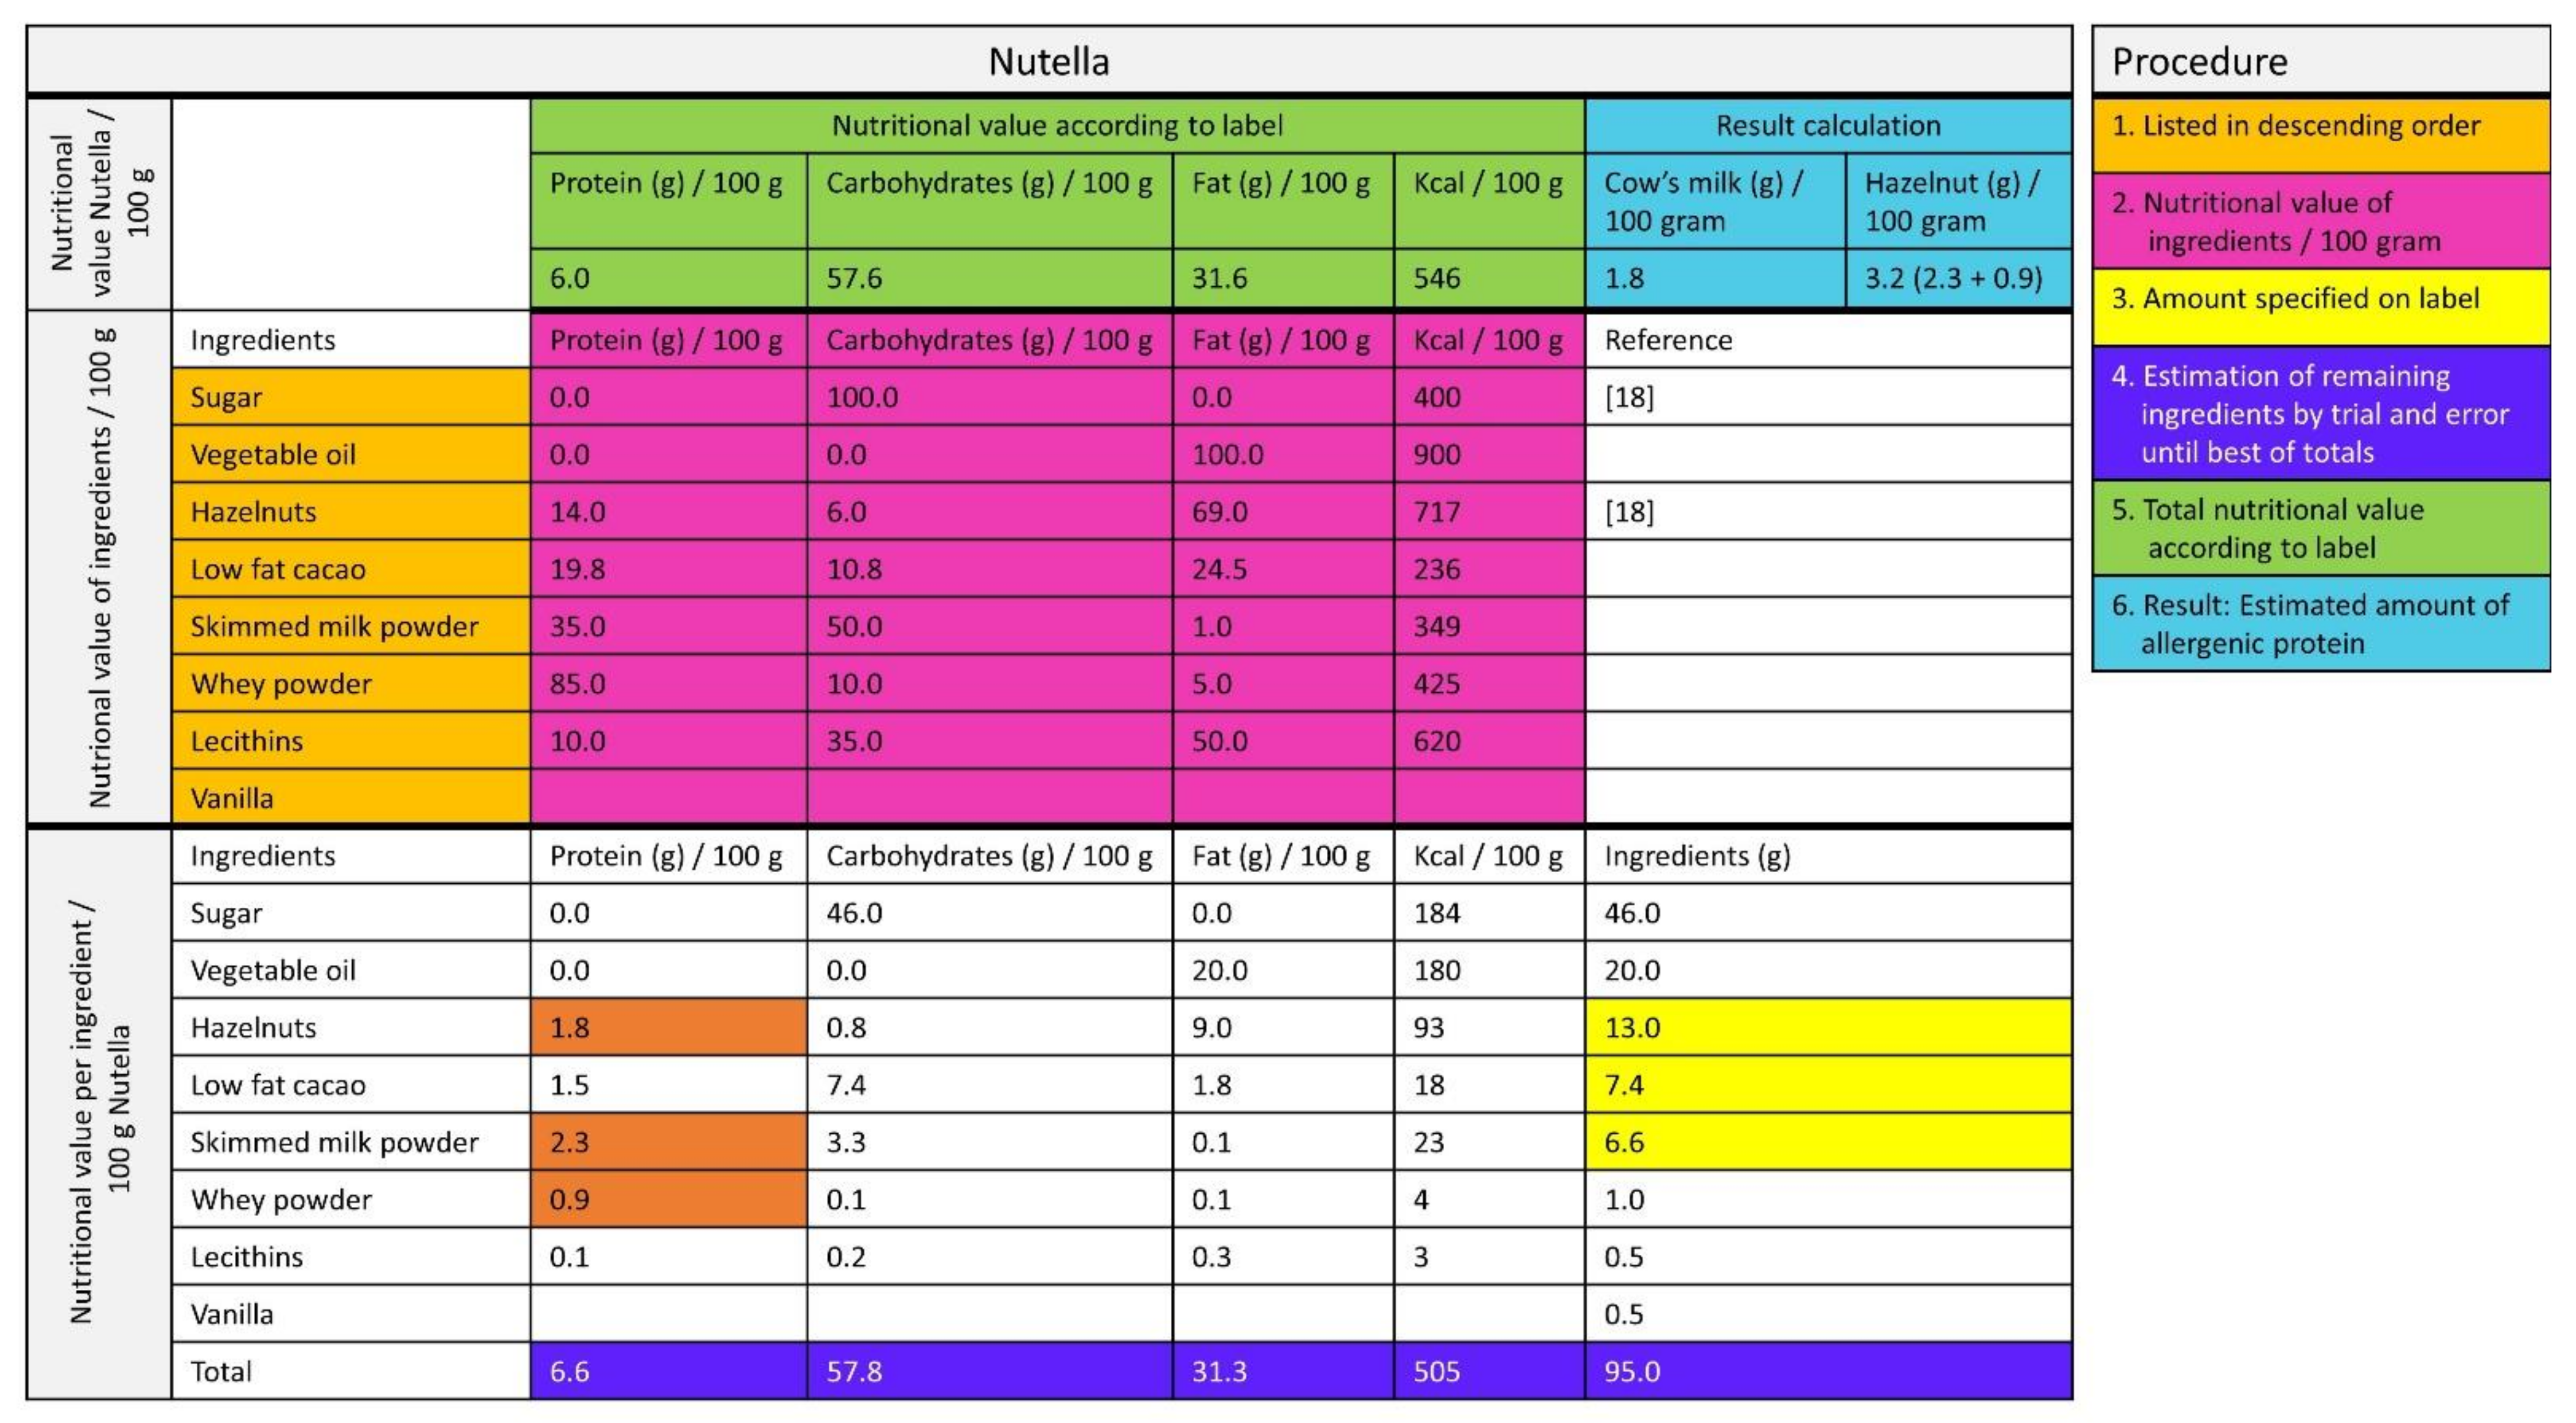
2.1. The Amount of Allergenic Protein in Foods
2.2. Assessment of Bite and Sip Sizes in Different Age Groups
2.2.1. Selection of Foods
2.2.2. Study Population and Measurements of Bites and Sips
2.2.3. Pilot Study
2.2.4. Statistics
3. Results
3.1. The Amount of Allergenic Protein in Foods
3.2. Comparison of the Estimated Amount of Allergenic Protein to ED10 and ED50
- Milk
- Egg
- Peanut
- Hazelnut
3.3. Assessment of Bite and Sip Sizes in Different Age Groups
3.3.1. Differences between the Different Age Groups
3.3.2. Amount of Protein per Bite or Sip
4. Discussion
5. Conclusions
Author Contributions
Funding
Institutional Review Board Statement
Informed Consent Statement
Data Availability Statement
Acknowledgments
Conflicts of Interest
References
- Boyce, J.A.; Assa’ad, A.; Burks, W.A.; Jones, S.M.; Sampson, H.A.; Wood, R.A.; Plaut, M.; Cooper, S.F.; Fenton, M.J.; Arshad, S.H.; et al. Guidelines for the diagnosis and management of food allergy in the United States: Report of the NIAID-sponsored expert panel. J. Allergy Clin. Immunol. 2010, 126, S1–S58. [Google Scholar] [CrossRef] [PubMed]
- Muraro, A.; Werfel, T.; Hoffmann-Sommergruber, K.; Roberts, G.A.; Beyer, K.; Bindslev-Jensen, C.; Cardona, V.; Dubois, A.; Dutoit, G.; Eigenmann, P.; et al. EAACI food allergy and anaphylaxis guidelines: Diagnosis and management of food allergy. Allergy 2014, 69, 1008–1025. [Google Scholar] [CrossRef] [PubMed]
- Skypala, I.J.; Venter, C.; Meyer, R.; de Jong, N.W.; Fox, A.T.; Groetch, M.; Elberink, J.N.O.; Sprikkelman, A.B.; Diamandi, L.; Diamandi, L.; et al. The development of a standardised diet history tool to support the diagnosis of food allergy. Clin. Transl. Allergy 2015, 5, 7. [Google Scholar] [CrossRef] [PubMed]
- Eigenmann, P.; Atanaskovic-Markovic, M.; Hourihane, J.O.; Lack, G.; Lau, S.; Matricardi, P.M.; Muraro, A.; Baranova, L.N.; Nieto, A.; Papadopoulos, N.G.; et al. Testing children for allergies: why, how, who and when. Pediatr. Allergy Immunol. 2013, 24, 195–209. [Google Scholar] [CrossRef]
- Turner, P.J.; Baumert, J.L.; Beyer, K.; Boyle, R.J.; Chan, C.-H.; Clark, A.; Crevel, R.W.R.; DunnGalvin, A.; Fernández-Rivas, M.; Gowland, M.H.; et al. Can we identify patients at risk of life-threatening allergic reactions to food? Allergy 2016, 71, 1241–1255. [Google Scholar] [CrossRef] [PubMed]
- Van der Zee, T.; Dubois, A.; Kerkhof, M.; van der Heide, S.; Vlieg-Boerstra, B.J. The eliciting dose of peanut in double-blind, placebo-controlled food challenges decreases with increasing age and specific IgE in children and young adults. J. Allergy Clin. Immunol. 2011, 128, 1031–1036. [Google Scholar] [CrossRef] [PubMed]
- Dubois, A.E.J.; Turner, P.J.; Hourihane, J.; Ballmer-Weber, B.; Beyer, K.; Chan, C.H.; Gowland, M.H.; O’Hagan, S.; Regent, L.; Remington, B.; et al. How does dose impact on the severity of food-induced allergic reactions, and can this improve risk assessment for allergenic foods? Report from an ILSI Europe Food Allergy Task Force Expert Group and Workshop. Allergy 2018, 73, 1383–1392. [Google Scholar] [CrossRef] [PubMed]
- Brough, H.A.; Turner, P.J.; Wright, T.; Fox, A.T.; Taylor, S.L.; Warner, J.O.; Lack, G. Dietary management of peanut and tree nut allergy: What exactly should patients avoid? Clin. Exp. Allergy 2015, 45, 859–871. [Google Scholar] [CrossRef] [PubMed]
- The European Parliament and the Council of the European Union. REGULATION (EU) No 1169/2011 OF THE EUROPEAN PARLIAMENT AND OF THE COUNCIL of 25 October 2011. Available online: http://eur-lex.europa.eu/LexUriServ/LexUriServ.do?uri=OJ:L:2011:304:0018:0063:EN:PDF (accessed on 11 October 2014).
- Mills, E.N.C.; Adel-Patient, K.; Bernard, H.; De Loose, M.; Gillard, N.; Huet, A.-C.; Larré, C.; Nitride, C.; Pilolli, R.; Tranquet, O.; et al. Detection and quantification of allergens in foods and minimum eliciting doses in food-allergic individuals (ThRAll). J. AOAC Int. 2019, 102, 1346–1353. [Google Scholar] [CrossRef] [PubMed]
- Raposo, A.; Pérez, E.; Tinoco de Faria, C.; Carrascosa, C. Allergen management as a key issue in food safety. In Food Safety and Protection; Ravishankar Rai, V., Bai, J.A., Eds.; CRC Press: Boca Raton, FL, USA, 2017; pp. 195–242. [Google Scholar]
- Sampson, H.A.; Van Wijk, R.G.; Bindslev-Jensen, C.; Sicherer, S.H.; Teuber, S.S.; Burks, A.W.; Dubois, A.E.; Beyer, K.; Eigenmann, P.A.; Spergel, J.M.; et al. Standardizing double-blind, placebo-controlled oral food challenges: American Academy of Allergy, Asthma & Immunology—European Academy of Allergy and Clinical Immunology PRACTALL consensus report. J. Allergy Clin. Immunol. 2012, 130, 1260–1274. [Google Scholar] [CrossRef] [PubMed]
- Glaumann, S.; Nopp, A.; Johansson, S.G.O.; Borres, M.P.; Nilsson, C. Oral peanut challenge identifies an allergy but the peanut allergen threshold sensitivity is not reproducible. PLoS ONE 2013, 8, e53465. [Google Scholar] [CrossRef]
- Dua, S.; Ruiz-Garcia, M.; Bond, S.; Durham, S.R.; Kimber, I.; Mills, C.; Roberts, G.; Skypala, I.; Wason, J.; Ewan, P.; et al. Effect of sleep deprivation and exercise on reaction threshold in adults with peanut allergy: A randomized controlled study. J. Allergy Clin. Immunol. 2019, 144, 1584–1594.e2. [Google Scholar] [CrossRef] [PubMed]
- Leonard, S.A.; Caubet, J.C.; Kim, J.S.; Groetch, M.; Nowak-Węgrzyn, A. Baked milk- and egg-containing diet in the management of milk and egg allergy. J. Allergy Clin. Immunol. Pract. 2015, 3, 13–23. [Google Scholar] [CrossRef] [PubMed]
- Van Rossum, C.T.M.; Fransen, H.P.; Verkaik-Kloosterman, J.; Buurma-Rethans, E.J.M.; Ocke, M.C. RIVM Rapport Dutch National Food Consumption Survey 2007—2010: Diet of Children and Adults Aged 7 to 69 Years. 2011. Available online: https://www.rivm.nl/bibliotheek/rapporten/350050006.pdf (accessed on 15 September 2013).
- National Institute for Public Health and the Environment. Food Consumption Survey of Dutch Children (Users and Total Population) Age 2–6 Years. Available online: https://www.rivm.nl/en/dutch-national-food-consumption-survey/overview-surveys/young-children-2-6-years-2005-2006 (accessed on 15 September 2013).
- National Institute for Public Health and the Environment. NEVO-online. Available online: http://nevo-online.rivm.nl/ (accessed on 30 January 2013).
- Blommestein, I.; van Eijndhoven, A.; van Mill, J. Kook Ook, 8th ed.; VBK Media: Utrecht, The Netherlands, 2008. [Google Scholar]
- Blom, W.M.; Vlieg-Boerstra, B.J.; Kruizinga, A.G.; Van Der Heide, S.; Houben, G.F.; Dubois, A.E.J. Threshold dose distributions for 5 major allergenic foods in children. J. Allergy Clin. Immunol. 2013, 131, 172–179. [Google Scholar] [CrossRef] [PubMed]
- Klemans, R.J.B.; Blom, W.M.; van Erp, F.C.; Masthoff, L.J.N.; Rubingh, C.M.; van der Ent, C.K.; Bruijnzeel-Koomen, C.A.F.M.; Houben, G.F.; A Pasmans, S.G.M.; Meijer, Y.; et al. Objective eliciting doses of peanut-allergic adults and children can be combined for risk assessment purposes. Clin. Exp. Allergy 2015, 45, 1237–1244. [Google Scholar] [CrossRef] [PubMed]
- Athanasopoulou, P.; Deligianni, E.; Dean, T.; Dewey, A.; Venter, C. Use of baked milk challenges and milk ladders in clinical practice: a worldwide survey of healthcare professionals. Clin. Exp. Allergy 2017, 47, 430–434. [Google Scholar] [CrossRef] [PubMed]
- Burger, K.S.; Fisher, J.O.; Johnson, S.L. Mechanisms behind the portion size effect: Visibility and bite size. Obesity 2011, 19, 546–551. [Google Scholar] [CrossRef] [PubMed]
- Hill, S.W.; McCutcheon, M.B. Contributions of obesity, gender, hunger, food preference, and body size to bite size, bite speed, and rate of eating. Appetite 1984, 5, 73–83. [Google Scholar] [CrossRef]
- Forde, C.; Van Kuijk, N.; Thaler, T.; De Graaf, C.; Martin, N. Oral processing characteristics of solid savoury meal components, and relationship with food composition, sensory attributes and expected satiation. Appetite 2013, 60, 208–219. [Google Scholar] [CrossRef] [PubMed]
- Hübel, R.; Laessle, R.; Lehrke, S.; Jass, J. Laboratory measurement of cumulative food intake in humans: Results on reliability. Appetite 2006, 46, 57–62. [Google Scholar] [CrossRef] [PubMed]


| Food | Composite or Non-Composite Food | Amount of Protein (mg or ml/Portion) | Amount of Protein (mg or ml)/100g) | Amount of Protein (mg or ml)/Median Bite or Sip Size 2–3 Years | Amount of Protein (mg or ml)/Median Bite or Sip Size 4–6 years | Amount of Protein (mg or ml)/Median Bite or Sip Size 19–30 years) |
|---|---|---|---|---|---|---|
| COW’S MILK | ||||||
| Cheese | ||||||
| Cottage cheese [18] | Non-composite food | 1680 | 11,200 | 100 | 100 | 290 |
| Goat cheese fresh [18] | Non-composite food | 2010 | 13,400 | 120 | 120 | 350 |
| Cheese spread 20+ [18] | Non-composite food | 2550 | 17,000 | 150 | 150 | 440 |
| Brie 60+ [18] | Non-composite food | 3400 | 17,000 | Nd | Nd | Nd |
| Goat cheese hard [18] | Non-composite food | 4480 | 22,400 | 250 | 250 | 760 |
| Gouda cheese 48+ [18] | Non-composite food | 4560 | 22,800 | 250 | 250 | 780 |
| Gouda cheese 20+ (low-fat) [18] | Non-composite food | 6840 | 34,200 | 380 | 380 | 1160 |
| Milk, Milk Products, Milk Replacers and Ice Cream | ||||||
| Coffee creamer, powder, low-fat [18] | Non-composite food | 50 | 2000 | Nd | Nd | Nd |
| Coffee creamer full fat [18] | Non-composite food | 50 | 8100 | Nd | Nd | Nd |
| Whipping cream [18] | Non-composite food | 230 | 2300 | Nd | Nd | Nd |
| Crème fraiche [18] | Non-composite food | 330 | 2200 | Nd | Nd | Nd |
| Crème fraiche demi [18] | Non-composite food | 450 | 3000 | Nd | Nd | Nd |
| Sour cream [18] | Non-composite food | 470 | 3100 | Nd | Nd | Nd |
| Fromage frais full fat 8.2% [18] | Non-composite food | 1420 | 7100 | Nd | Nd | Nd |
| Fromage frais low-fat 0.5% [18] | Non-composite food | 2020 | 10,100 | 610 | 610 | 1370 |
| Fromage frais half fat 4.6% [18] | Non-composite food | 2300 | 11,500 | 690 | 690 | 1560 |
| Nutrilon 2 Infant Formula (Nutricia) | Non-composite food | 2800 | 1400 | Nd | Nd | Nd |
| 3.5% Full fat yoghurt [18] | Non-composite food | 5550 | 3700 | 220 | 220 | 500 |
| Yoghurt, low-fat 0.3% [18] | Non-composite food | 6150 | 4100 | 250 | 250 | 560 |
| Yoghurt, low-fat 1.5% [18] | Non-composite food | 6750 | 4500 | 270 | 270 | 610 |
| Buttermilk [18] | Non-composite food | 7500 | 3000 | Nd | Nd | Nd |
| Whole Milk 3.5% [18] | Non-composite food | 8250 | 3300 | 83 | 264 | 1056 |
| Semi skimmed milk 1.5% [18] | Non-composite food | 8500 | 3400 | 85 | 274 | 1088 |
| Skimmed milk 0.1% [18] | Non-composite food | 9250 | 3700 | 93 | 296 | 1184 |
| Fat, Oil and Sauce | ||||||
| Butter, salted [18] | Non-composite food | 40 | 700 | <10 | <10 | <10 |
| HEN’S EGG | ||||||
| Egg | ||||||
| Boiled egg [18] | Non-composite food | 6200 | 12,300 | 308 | 615 | 1476 |
| PEANUT | ||||||
| Spread | ||||||
| Peanut butter (Calvé) | Non-composite food | 3200 | 21,420 | 210 | 190 | 560 |
| Food | Composite or Non-Composite Food | Amount of Protein (mg or ml/Portion) | Amount of Protein (mg or ml)/100g) | Amount of Protein (mg or ml)/Median Bite or Sip Size 2–3 Years | Amount of Protein (mg or ml)/Median Bite or Sip Size 4–6 years | Amount of Protein (mg or ml)/Median Bite or Sip Size 19–30 years) |
|---|---|---|---|---|---|---|
| COW’S MILK | ||||||
| Bread and Crackers | ||||||
| Currant bread **(Jumbo) | Composite food | 590 | 1700 | 70 | 70 | 100 |
| White bread (Jumbo *) | Composite food | 770 | 1700 | 30 | 30 | 100 |
| Spread | ||||||
| Chocolate hazelnut spread (Nutella) | Composite food | 470 | 3160 | 30 | 30 | 80 |
| Cake and Biscuits | ||||||
| Filled Biscuit (Biscuit fourré **) (Jumbo *) | Composite food | 8.75 | 175 | <10 | <10 | <10 |
| Syrup waffle (Jumbo *) | Composite food | 70 | 180 | <10 | <10 | <10 |
| Waffle (Jumbo *) | Composite food | 90 | 180 | <10 | <10 | 20 |
| Penny waffle (Jumbo *) | Composite food | 117 | 780 | <10 | <10 | 20 |
| Eclair with whipped cream filling (Roomsoesje **) (Jumbo *) | Composite food | 190 | 1550 | Nd | Nd | Nd |
| Apple flan and crumble topping (Jumbo *) | Composite food | 430 | 430 | Nd | Nd | Nd |
| Cake [19] | Composite food | 550 | 1830 | 70 | 70 | 160 |
| Cheesecake with fromage frais (Dr. Oetker *) | Composite food | 2000–6000 | 2000–6000 | Nd | Nd | Nd |
| Vegetables | ||||||
| Creamed spinach frozen (Iglo) | Composite food | 600 | 1250 | 50 | 250 | 130 |
| Milk, Milk Products, Milk Replacers and Ice Cream | ||||||
| Ice cream dairy, Cornetto Classic (Ola) | Composite food | 882 | 1470 | Nd | Nd | Nd |
| Vanilla custard full fat (Friesland Campina *) | Composite food | 3600 | 2400 | 140 | 140 | 460 |
| Ice cream dairy, cream based (Hertog) | Composite food | 3690 | 2460 | Nd | Nd | Nd |
| Baby Porridge vanilla (Pyjama–papje **) (Nestlé) | Composite food | 3840 | 1920 | Nd | Nd | Nd |
| Composite Meals | ||||||
| Infant jarred food: Lasagna with vegetables (Olvarit) | Composite food | 1100 | 550 | Nd | Nd | Nd |
| Pancakes) [19] | Composite food | 1491 | 2130 | 90 | 60 | Nd |
| Soup | ||||||
| Chinese Tomato soup, canned (Unox) | Composite food | 110 | 40 | Nd | Nd | <10 |
| Sweets and Chocolate | ||||||
| Foam sweets banana flavor (Bananen schuimpjes **) (Haribo) | Composite food | 6 | 120* | Nd | Nd | Nd |
| Fudge Caramel Vanilla (Lonka) | Composite food | 80 | 1575 | Nd | Nd | Nd |
| Chocolate bar with hazelnuts (Verkade) | Composite food | 180 | 3510 | 100 | 70 | 210 |
| Filled milk chocolate bar with hazelnuts (BonBon Bloc Praliné milk **) (Cote d’Or) | Composite food | 650 | 4310 | 130 | 090 | 260 |
| Belgium chocolate (Zeevruchten bonbon **) (Isaura) | Composite food | 650 | 4320 | 130 | 90 | 260 |
| Fat, Oil and Sauce | ||||||
| Low-fat margarine (Gouda’s Glorie *) | Composite food | 4 | 80* | <10 | <10 | <10 |
| Tzatziki (Remia) | Composite food | 110 | 740 | Nd | Nd | 30 |
| Gravy, powdered (Knorr) | Composite food | 110 | 700 | Nd | Nd | Nd |
| Bechamel sauce [19] | Composite food | 1300 | 8680 | Nd | Nd | Nd |
| Meat and Poultry | ||||||
| Hamburger (Mora) | Composite food | 780 | 1060 | 20 | 20 | 100 |
| Ragout, beef, canned (Unox) | Composite food | 175 | 350 | Nd | Nd | Nd |
| HEN’S EGG | ||||||
| Bread and Crackers | ||||||
| Round toast (Bolletje *) | Composite food | 5 | 50 | Nd | Nd | Nd |
| Round toast, whole wheat (Bolletje *) | Composite food | 30 | 300 | Nd | Nd | Nd |
| Cake and Biscuits | ||||||
| Syrup waffle (Jumbo *) | Composite food | 3 | 6 | <10 | <10 | <10 |
| Penny waffle (Jumbo *) | Composite food | 3 | 33 | <10 | <10 | Nd |
| Marzipan and chocolate cake (Mergpijpje **) (Jumbo *) | Composite food | 100 | 980 | Nd | Nd | Nd |
| Chocolate coated marsh mellow (Schuimzoenen **) (Buys) | Composite food | 140 | 1400 | Nd | Nd | Nd |
| Eclair with whipped cream filling (Roomsoesje **) (Jumbo *) | Composite food | 220 | 1720 | Nd | Nd | Nd |
| Cake [19] | Composite food | 390 | 1300 | 50 | 50 | 120 |
| Dutch sponge cake (Eierkoek **) (AH) | Composite food | 660 | 2210 | 90 | 90 | 200 |
| Waffle (Jumbo *) | Composite food | 1970 | 3940 | 118 | 158 | 355 |
| Pasta | ||||||
| Ravioli (Grand Italia) | Composite food | 1190 | 2380 | Nd | Nd | Nd |
| Tortellini (Grand Italia) | Composite food | 1190 | 2380 | Nd | Nd | Nd |
| Milk, Milk Products, Milk Replacers and Ice Cream | ||||||
| Ice cream dairy, Cornetto Classic (Ola) | Composite food | 3 | 5 | Nd | Nd | Nd |
| Snacks, Meals | ||||||
| Beef salad (Johma) | Composite food | 50 | 30 | Nd | Nd | Nd |
| Composite Dishes | ||||||
| Egg roll, chicken and ham (Mora) | Composite food | 1100 | 630 | Nd | Nd | Nd |
| Pancakes [19] | Composite food | 8610 | 12,300 | 492 | 369 | Nd |
| Fat, Oil and Sauce | ||||||
| Salad cream 25% oil (Slasaus **) (Remia) | Composite food | 20 | 150 | Nd | Nd | Nd |
| Sauce for chips 35% oil (Fritessaus **) (Remia) | Composite food | 50 | 334 | <10 | 20 | 10 |
| Mayonnaise (Remia) | Composite food | 130 | 840 | <10 | 500 | 30 |
| PEANUT | ||||||
| Cake and Biscuits | ||||||
| Peanut cookie (Jumbo *) | Composite food | 630 | 6300 | 63 | 63 | Nd |
| Snack Food | ||||||
| Japanese rice cracker mix with peanuts (Davis) | Composite food | 600 | 3020 | Nd | Nd | Nd |
| Coated peanuts (Duyvis) | Composite food | 2720 | 13,610 | Nd | Nd | Nd |
| Sweets and Chocolate | ||||||
| Candy bar, Snickers | Composite food | 1210 | 6050 | 180 | 180 | Nd |
| M&M’s, chocolate with peanut | Composite food | 1160 | 5800 | Nd | Nd | Nd |
| Peanuts coated with milk chocolate (Chocopinda’s **) (Jumbo *) | Composite food | 1260 | 6300 | Nd | Nd | Nd |
| Fats, Oils and Savory Sauces | ||||||
| Peanut sauce (Wijko) | Composite food | 1820 | 12,100 | 120 | 610 | 420 |
| HAZELNUT | ||||||
| Spread | ||||||
| Chocolate hazelnut spread (Nutella) | Composite food | 270 | 1820 | 20 | 20 | 50 |
| Cake and Biscuits | ||||||
| Penny waffle (Jumbo *) | Composite food | 7 | 70 | <10 | <10 | Nd |
| Cereals | ||||||
| Muesli (Jumbo *) | Composite food | 60 | 140 | Nd | Nd | <10 |
| Milk, Milk Products, Milk Replacers and Ice Cream | ||||||
| Ice cream dairy, Cornetto Classic (Ola) | Composite food | 168 | 280 | Nd | Nd | Nd |
| Sugar, Sweets, Chocolate and Sweet Sauces | ||||||
| Belgium chocolate (Zeevruchten bonbon **) (Isaura) | Composite food | 380 | 2520 | 80 | 580 | Nd |
| Type of Food | Median Weight or Volume in Gram or ml * (IQR) * | Number of Participants |
|---|---|---|
| 2–3 years of age | ||
| Wheat bread | 2.00 (2.00–3.00) | 9 |
| Chocolate hazelnut spread, Nutella * | 0.86 | n.d. |
| Peanut butter * | 0.86 | n.d. |
| Low-fat margarine * | 0.29 | n.d. |
| Cheese * | 1.14 | n.d. |
| Milk ** | 2.50 (2.00–4.25) | 6 |
| Boiled egg | 2.50 (2.00–4.50) | 4 |
| Biscuit (Maria biscuit) | 1.00 (1.00–1.00) | 8 |
| Crisps (Hamka’s) | 0.50 (0.25–0.60) | 5 |
| Currant bread | 3.00 (1.25–5.50) | 4 |
| Pancake | 4.00 (3.00–9.00) | 5 |
| Snickers | 2.50 (1.88–3.25) | 6 |
| Soft drink (Taksi) ** | 11.00 (8.00–12.25) | 6 |
| Vanilla custard | 6.00 (−) | 3 |
| Cake batter | 2.00 (1.00–3.50) | 5 |
| Fried egg | 3.00 (1.00–3.00) | 6 |
| Creamed spinach | 4.00 (−) | 2 |
| Chicken nuggets | 2.00 (1.75–3.50) | 6 |
| Mayonnaise | 1.00 (1.00–2.00) | 6 |
| Milk chocolate | 2.50 (1.00–4.00) | 10 |
| Muffin | 3.00 (1.00–4.50) | 9 |
| 4–6 years of age | ||
| Wheat bread | 2.00 (1.00–2.00) | 17 |
| Hazelnut spread * | 0.86 | n.d. |
| Peanut butter * | 0.86 | n.d. |
| Low-fat margarine * | 0.29 | n.d. |
| Cheese * | 1.14 | n.d. |
| Milk ** | 8.00 (4.00–18.00) | 11 |
| Boiled egg | 5.00 (3.00–7.75) | 16 |
| Biscuit | 1.00 (1.00–2.00) | 19 |
| Crisps (Hamka’s chips) | 0.25 (0.1875–0.5425) | 18 |
| Currant bread | 3.00 (2.00–4.00) | 15 |
| Pancake | 3.00 (2.00–5.25) | 18 |
| Snickers | 3.00 (2.00–4.00) | 16 |
| Soft drink (Taksi) | 8.00 (4.00–12.00) | 17 |
| Vanilla custard | 6.00 (3.00–8.50) | 13 |
| Cake batter | 1.00 (0.50–1.00) | 7 |
| Fried egg | 3.00 (2.00–4.00) | 11 |
| Cream spinach | 5.00 (4.00–7.00) | 7 |
| Chicken nuggets | 2.00 (1.50–4.00) | 9 |
| Mayonnaise | 0.50 (0.50–1.00) | 9 |
| Milk chocolate | 2.00 (2.00–3.00) | 17 |
| Muffin | 4.00 (2.00–6.25) | 14 |
| 19–30 years | ||
| Milk ** | 32.00 (24.00–58.75) | 14 |
| Hardboiled egg | 12.00 (7.75–16.50) | 14 |
| Crisps (Hamka’s chips) | 2.00 (1.00–2.00) | 11 |
| Soft drink (Taksi) | 36.00 (30.70–43.75) | 14 |
| Fried egg | 6.50 (5.00–9.25) | 14 |
| Cream spinach | 10.00 (8.50–13.00) | 14 |
| Muffin | 9.00 (6.00–11.25) | 14 |
| Soft drink (Rivella) | 31.50 (27.25–50.75) | 14 |
| Canned Soup | 9.00 (8.00–10.00) | 12 |
| Cappuccino | 23.50 (14.50–37.50) | 14 |
| White bread | 6.00 (3.75–8.25) | 14 |
| Hazelnut spread * | 2.57 | n.d. |
| Peanut butter * | 2.57 | n.d. |
| Low-fat margarine * | 0.86 | n.d. |
| Cheese * | 3.43 | n.d. |
| Yogurt with muesli (Cruesli) | 19.00 (14.00–21.25) | 14 |
| Potato croquette | 5.50 (4.75–8.25) | 14 |
| Schnitzel | 9.00 (8.50–10.00) | 14 |
| Sate sauce | 3.50 (2.00–6.00) | 14 |
| Nougat | 5.50 (4.75–7.25) | 14 |
| Belgium chocolate | 6.00 (3.75–10.00) | 14 |
| Spiced biscuit | 3.00 (3.00–5.00) | 14 |
Publisher’s Note: MDPI stays neutral with regard to jurisdictional claims in published maps and institutional affiliations. |
© 2021 by the authors. Licensee MDPI, Basel, Switzerland. This article is an open access article distributed under the terms and conditions of the Creative Commons Attribution (CC BY) license (http://creativecommons.org/licenses/by/4.0/).
Share and Cite
Kok, M.; Compagner, A.; Panneman, I.; Sprikkelman, A.; Vlieg-Boerstra, B. A Food, a Bite, a Sip: How Much Allergen Is in That? Nutrients 2021, 13, 587. https://doi.org/10.3390/nu13020587
Kok M, Compagner A, Panneman I, Sprikkelman A, Vlieg-Boerstra B. A Food, a Bite, a Sip: How Much Allergen Is in That? Nutrients. 2021; 13(2):587. https://doi.org/10.3390/nu13020587
Chicago/Turabian StyleKok, Melanie, Astrid Compagner, Ina Panneman, Aline Sprikkelman, and Berber Vlieg-Boerstra. 2021. "A Food, a Bite, a Sip: How Much Allergen Is in That?" Nutrients 13, no. 2: 587. https://doi.org/10.3390/nu13020587
APA StyleKok, M., Compagner, A., Panneman, I., Sprikkelman, A., & Vlieg-Boerstra, B. (2021). A Food, a Bite, a Sip: How Much Allergen Is in That? Nutrients, 13(2), 587. https://doi.org/10.3390/nu13020587