Associations of Food Outlet Densities with Obesity Measures Identify Fish and Chip Shops as a Uniquely Important Problem


Abstract
1. Introduction
2. Method
2.1. Data Sources
2.2. Inclusion and Exclusion Criteria
2.3. Definition of Food Outlets Densities
2.4. Adjustment Variables (Possible Confounding Factors)
2.5. Sampling Unit (PDs)
2.6. Outcome Variables
2.7. Statistical Analysis
3. Results
4. Discussion
5. Strengths and Limitations
6. Conclusions
Author Contributions
Funding
Conflicts of Interest
Appendix A


References
- Baker, C. Obesity Statistics; House of Commons Library: London, UK, 2018. [Google Scholar]
- Rippin, H.; Hutchinson, J.; Evans, C.E.L.; Jewell, J.; Breda, J.; Cade, J. National nutrition surveys in Europe: A review on the current status in the 53 countries of the WHO European region. Food Nutr. Res. 2018, 62. [Google Scholar] [CrossRef]
- Burgoine, T.; Forouhi, N.G.; Griffin, S.J.; Wareham, N.J.; Monsivais, P. Associations between exposure to takeaway food outlets, takeaway food consumption, and body weight in Cambridgeshire, UK: Population based, cross sectional study. BMJ 2014, 348, g1464. [Google Scholar] [CrossRef]
- Burgoine, T.; Forouhi, N.G.; Griffin, S.J.; Brage, S.; Wareham, N.J.; Monsivais, P. Does neighborhood fast-food outlet exposure amplify inequalities in diet and obesity? A cross-sectional study. Am. J. Clin. Nutr. 2016, 103, 1540–1547. [Google Scholar] [CrossRef]
- Powell, L.M.; Nguyen, B.T. Fast-Food and Full-service Restaurant Consumption among Children and Adolescents: Impact on Energy, Beverage and Nutrient Intake. JAMA Pediatr. 2013, 167, 14–20. [Google Scholar] [CrossRef]
- Young, L.R.; Nestle, M. The Contribution of Expanding Portion Sizes to the US Obesity Epidemic. Am. J. Public Health 2002, 92, 246–249. [Google Scholar] [CrossRef]
- Lachat, C.; Nago, E.; Verstraeten, R.; Roberfroid, D.; Van Camp, J.; Kolsteren, P. Eating out of home and its association with dietary intake: A systematic review of the evidence. Obes. Rev. 2011, 13, 329–346. [Google Scholar] [CrossRef]
- Drewnowski, A.; Specter, S.E. Poverty and obesity: The role of energy density and energy costs. Am. J. Clin. Nutr. 2004, 79, 6–16. [Google Scholar] [CrossRef]
- Currie, J.; DellaVigna, S.; Moretti, E.; Pathania, V. The Effect of Fast Food Restaurants on Obesity and Weight Gain. Am. Econ. J. Econ. Policy 2010, 2, 32–63. [Google Scholar] [CrossRef]
- Miura, K.; Giskes, K.; Turrell, G. Socio-economic differences in takeaway food consumption among adults. Public Health Nutr. 2011, 15, 218–226. [Google Scholar] [CrossRef]
- Miura, K.; Turrell, G. Reported consumption of takeaway food and its contribution to socioeconomic inequalities in body mass index. Appetite 2014, 74, 116–124. [Google Scholar] [CrossRef]
- Thornton, L.; Bentley, R.; Kavanagh, A.M. Individual and area-level socioeconomic associations with fast food purchasing. J. Epidemiol. Community Health 2010, 65, 873–880. [Google Scholar] [CrossRef]
- Ball, K.; Crawford, D. Socioeconomic status and weight change in adults: A review. Soc. Sci. Med. 2005, 60, 1987–2010. [Google Scholar] [CrossRef]
- Penney, T.; Jones, N.; Adams, J.; Maguire, E.; Burgoine, T.; Monsivais, P. Are sit-down restaurant, fast food and café usage independently associated with diet and obesity?Tarra Penney. Eur. J. Public Health 2016, 26. [Google Scholar] [CrossRef]
- Moore, L.V.; Roux, A.V.D.; Nettleton, J.A.; Jacobs, D.R.; Franco, M. Fast-Food Consumption, Diet Quality, and Neighborhood Exposure to Fast Food. Am. J. Epidemiol. 2009, 170, 29–36. [Google Scholar] [CrossRef]
- Dunn, R.A.; Sharkey, J.R.; Horel, S. The effect of fast-food availability on fast-food consumption and obesity among rural residents: An analysis by race/ethnicity. Econ. Hum. Boil. 2011, 10, 1–13. [Google Scholar] [CrossRef]
- Mazidi, M.; Speakman, J.R. Association of Fast-Food and Full-Service Restaurant Densities with Mortality From Cardiovascular Disease and Stroke, and the Prevalence of Diabetes Mellitus. J. Am. Hear. Assoc. 2018, 7, e007651. [Google Scholar] [CrossRef]
- Mazidi, M.; Speakman, J.R. Higher densities of fast-food and full-service restaurants are not associated with obesity prevalence. Am. J. Clin. Nutr. 2017, 106, 603–613. [Google Scholar] [CrossRef]
- Thorpe, R.J.; Ferraro, K. Aging, Obesity, and Mortality. Res. Aging 2004, 26, 108–129. [Google Scholar] [CrossRef]
- North American Industry Classification System, United States Department of Agriculture. Available online: https://www.ers.usda.gov/ (accessed on 3 November 2019).
- Turrell, G.; Giskes, K. Socioeconomic disadvantage and the purchase of takeaway food: A multilevel analysis. Appetite 2008, 51, 69–81. [Google Scholar] [CrossRef]
- Simpson, J.; Weiner, E. English Oxford Living Dictionaries; Oxford University Press: Oxford, UK, 2020; Available online: https://www.oxfordlearnersdictionaries.com/definition/english/cafe?q=café (accessed on 21 January 2019).
- Napierala, M.A. What is the Bonferroni correction. AAOS Now 2012, 6, 40. [Google Scholar]
- Jaworowska, A.; Blackham, T.M.; Long, R.; Taylor, C.; Ashton, M.; Stevenson, L.; Davies, I.G. Nutritional composition of takeaway food in the UK. Nutr. Food Sci. 2014, 44, 414–430. [Google Scholar] [CrossRef]
- Robinson, E.; Jones, A.; Whitelock, V.; Mead, B.; Haynes, A. (Over)eating out at major UK restaurant chains: Observational study of energy content of main meals. BMJ 2018, 363, k4982. [Google Scholar] [CrossRef] [PubMed]
- Boothby, L. FATS Uses in the Food Industry. Encyclopedia Food Sci. Nutr. 2003, 34, 2270–2274. [Google Scholar]
- Ansorena, D.; Guembe, A.; Mendizábal, T.; Astiasarán, I. Effect of Fish and Oil Nature on Frying Process and Nutritional Product Quality. J. Food Sci. 2010, 75, H62–H67. [Google Scholar] [CrossRef]
- Fine, G.; Greenwood, D.; Haggarty, P.; Jebb, S.; Kiely, M. New Scientific Advisory Committee on Nutrition. Nutr. Food Sci. 2000, 30, 3. [Google Scholar]
- Goffe, L.; Hillier-Brown, F.; Hildred, N.; Worsnop, M.; Adams, J.; Araujo-Soares, V.; Penn, L.; Wrieden, W.; Summerbell, C.; A Lake, A.; et al. Feasibility of working with a wholesale supplier to co-design and test acceptability of an intervention to promote smaller portions: An uncontrolled before-and-after study in British Fish & Chip shops. BMJ Open 2019, 9, e023441. [Google Scholar]
- Mitchell, M. Increasing fish consumption for better health—Are we being advised to eat more of an inherently unsustainable protein? Nutr. Bull. 2011, 36, 438–442. [Google Scholar] [CrossRef]
- Vandevijvere, S.; Lachat, C.; Kolsteren, P.; Van Oyen, H. Eating out of home in Belgium: Current situation and policy implications. Br. J. Nutr. 2009, 102, 921–928. [Google Scholar] [CrossRef]
- Johar, M.; Maruyama, S.; Truong, J. The contribution of Western fast food to fast-growing body mass in China. Appl. Econ. 2016, 49, 1–15. [Google Scholar] [CrossRef][Green Version]
- Marlow, M.L.; Shiers, A.F. The relationship between fast food and obesity. Appl. Econ. Lett. 2012, 19, 1633–1637. [Google Scholar] [CrossRef]
- Paeratakul, S.; Ferdinand, D.P.; Champagne, C.M.; Ryan, D.; Bray, G.A. Fast-food consumption among US adults and children: Dietary and nutrient intake profile. J. Am. Diet. Assoc. 2003, 103, 1332–1338. [Google Scholar] [CrossRef]
- Kang, J.; Jun, J.; Arendt, S.W. Understanding customers’ healthy food choices at casual dining restaurants: Using the Value–Attitude–Behavior model. Int. J. Hosp. Manag. 2015, 48, 12–21. [Google Scholar] [CrossRef]
- Offer, A.; Pechey, R.; Ulijaszek, S. Obesity under affluence varies by welfare regimes: The effect of fast food, insecurity, and inequality. Econ. Hum. Boil. 2010, 8, 297–308. [Google Scholar] [CrossRef] [PubMed]
- Fry, A.; Littlejohns, T.; Sudlow, C.L.; Doherty, N.; Adamska, L.; Sprosen, T.; Collins, R.; E Allen, N. Comparison of Sociodemographic and Health-Related Characteristics of UK Biobank Participants With Those of the General Population. Am. J. Epidemiol. 2017, 186, 1026–1034. [Google Scholar] [CrossRef] [PubMed]


| Mean | SD | Percent (%) | Total (N) | Missing | |
|---|---|---|---|---|---|
| Biobank population | 496.5 | 421.18 | 502,540 | 46,461 | |
| Sex | |||||
| Females | 54.4% | 248,657 | 46,461 | ||
| Males | 45.6% | 207,422 | 46,461 | ||
| Age | |||||
| Total mean age | 56.5 | 8.09 | |||
| Female | 56.3 | 8 | |||
| Male | 56.7 | 8.1 | |||
| Employment | |||||
| Employed | 60.4% | 303,346 | |||
| Unemployed | 38.2% | 192,079 | |||
| Student | 0.3% | 1343 | |||
| Household income | |||||
| 18,000–30,999 | 21.5% | 108,179 | |||
| 31,000–51,999 | 22.0% | 110,776 | |||
| 52,000–100,000 | 17.2% | 86,272 | |||
| >100,000 | 4.6% | 22,932 | |||
| <18,000 | 19.3% | 97,208 | |||
| Education | |||||
| University or college degree | 37.2% | 186,983 | |||
| O levels/GCSEs or equivalent | 20.9% | 105,200 | |||
| A levels/AS levels or equivalent | 11% | 55,326 | |||
| NVQ or HND or HNC or equivalent | 6.5% | 32,730 | |||
| CSEs or equivalent represented | 5.4% | 26,887 | |||
| Ethnicity | |||||
| Caucasian | 94.1% | 472,729 | |||
| Chinese | 0.3% | 1574 | |||
| Indian | 1.6% | 8067 | |||
| Black | 1.6% | 8034 | |||
| Mixed | 0.4% | 1952 | |||
| Other | 1.5% | 7407 | |||
| Household size | 2.41 | 1.37 | |||
| Deprivation level | −1.29 | 3.09 | |||
| Mean | SD | Total (N) | Missing | |
|---|---|---|---|---|
| BMI | 456,079 | 46,461 | ||
| Females | 27.08 | 5.17 | ||
| Males | 27.83 | 4.22 | ||
| %fat | 456,079 | 46,461 | ||
| Females | 36.59 | 6.90 | ||
| Males | 25.28 | 5.80 | ||
| WHR | 456,079 | 46,461 | ||
| Females | 0.81 | 0.07 | ||
| Males | 0.93 | 0.06 |
| Total (N) | PDs Covered (N) | PD Covered (%) | |
|---|---|---|---|
| Delivery shops | 801 | 406 | 43.98 |
| FFRs | 17,355 | 815 | 88.29 |
| FSRs | 13,915 | 923 | 100 |
| Fish and chip shops | 3617 | 803 | 86.9 |
| Takeaways | 3466 | 693 | 75 |
| Pubs | 10,610 | 804 | 87 |
| Cafes | 9264 | 861 | 93.2 |
| Total food outlets | 59,028 | 923 | 100 |
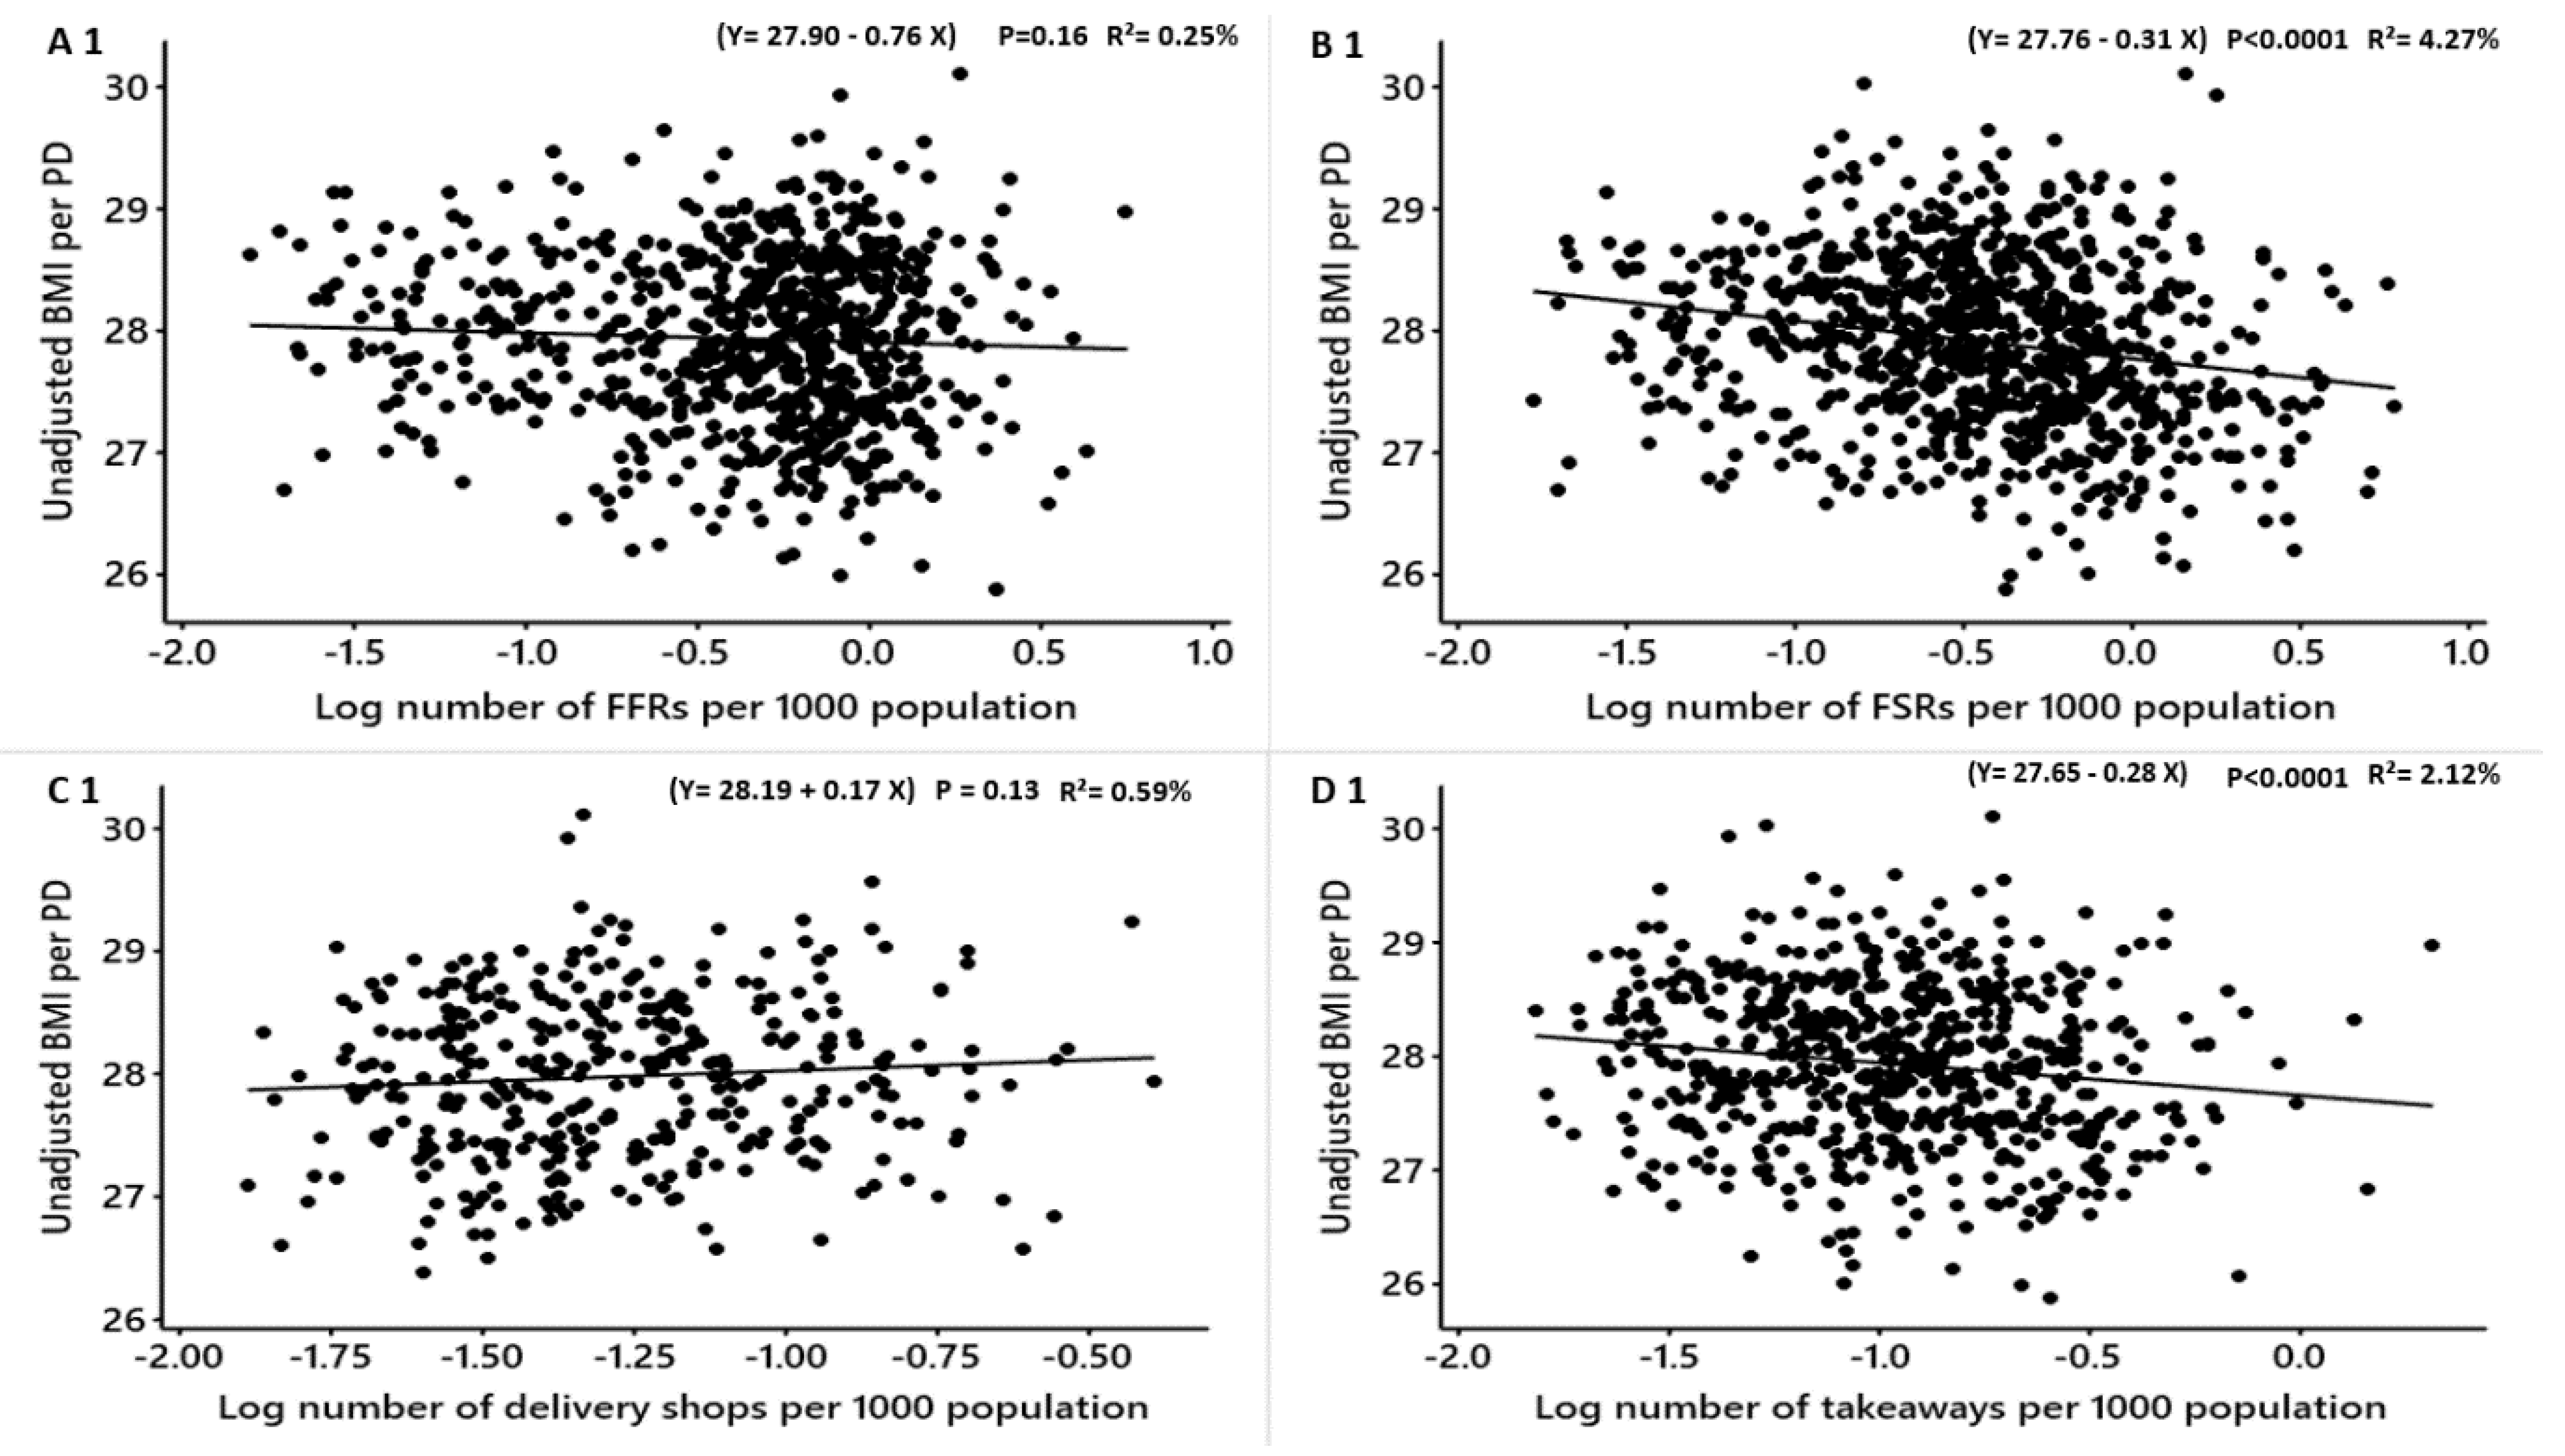
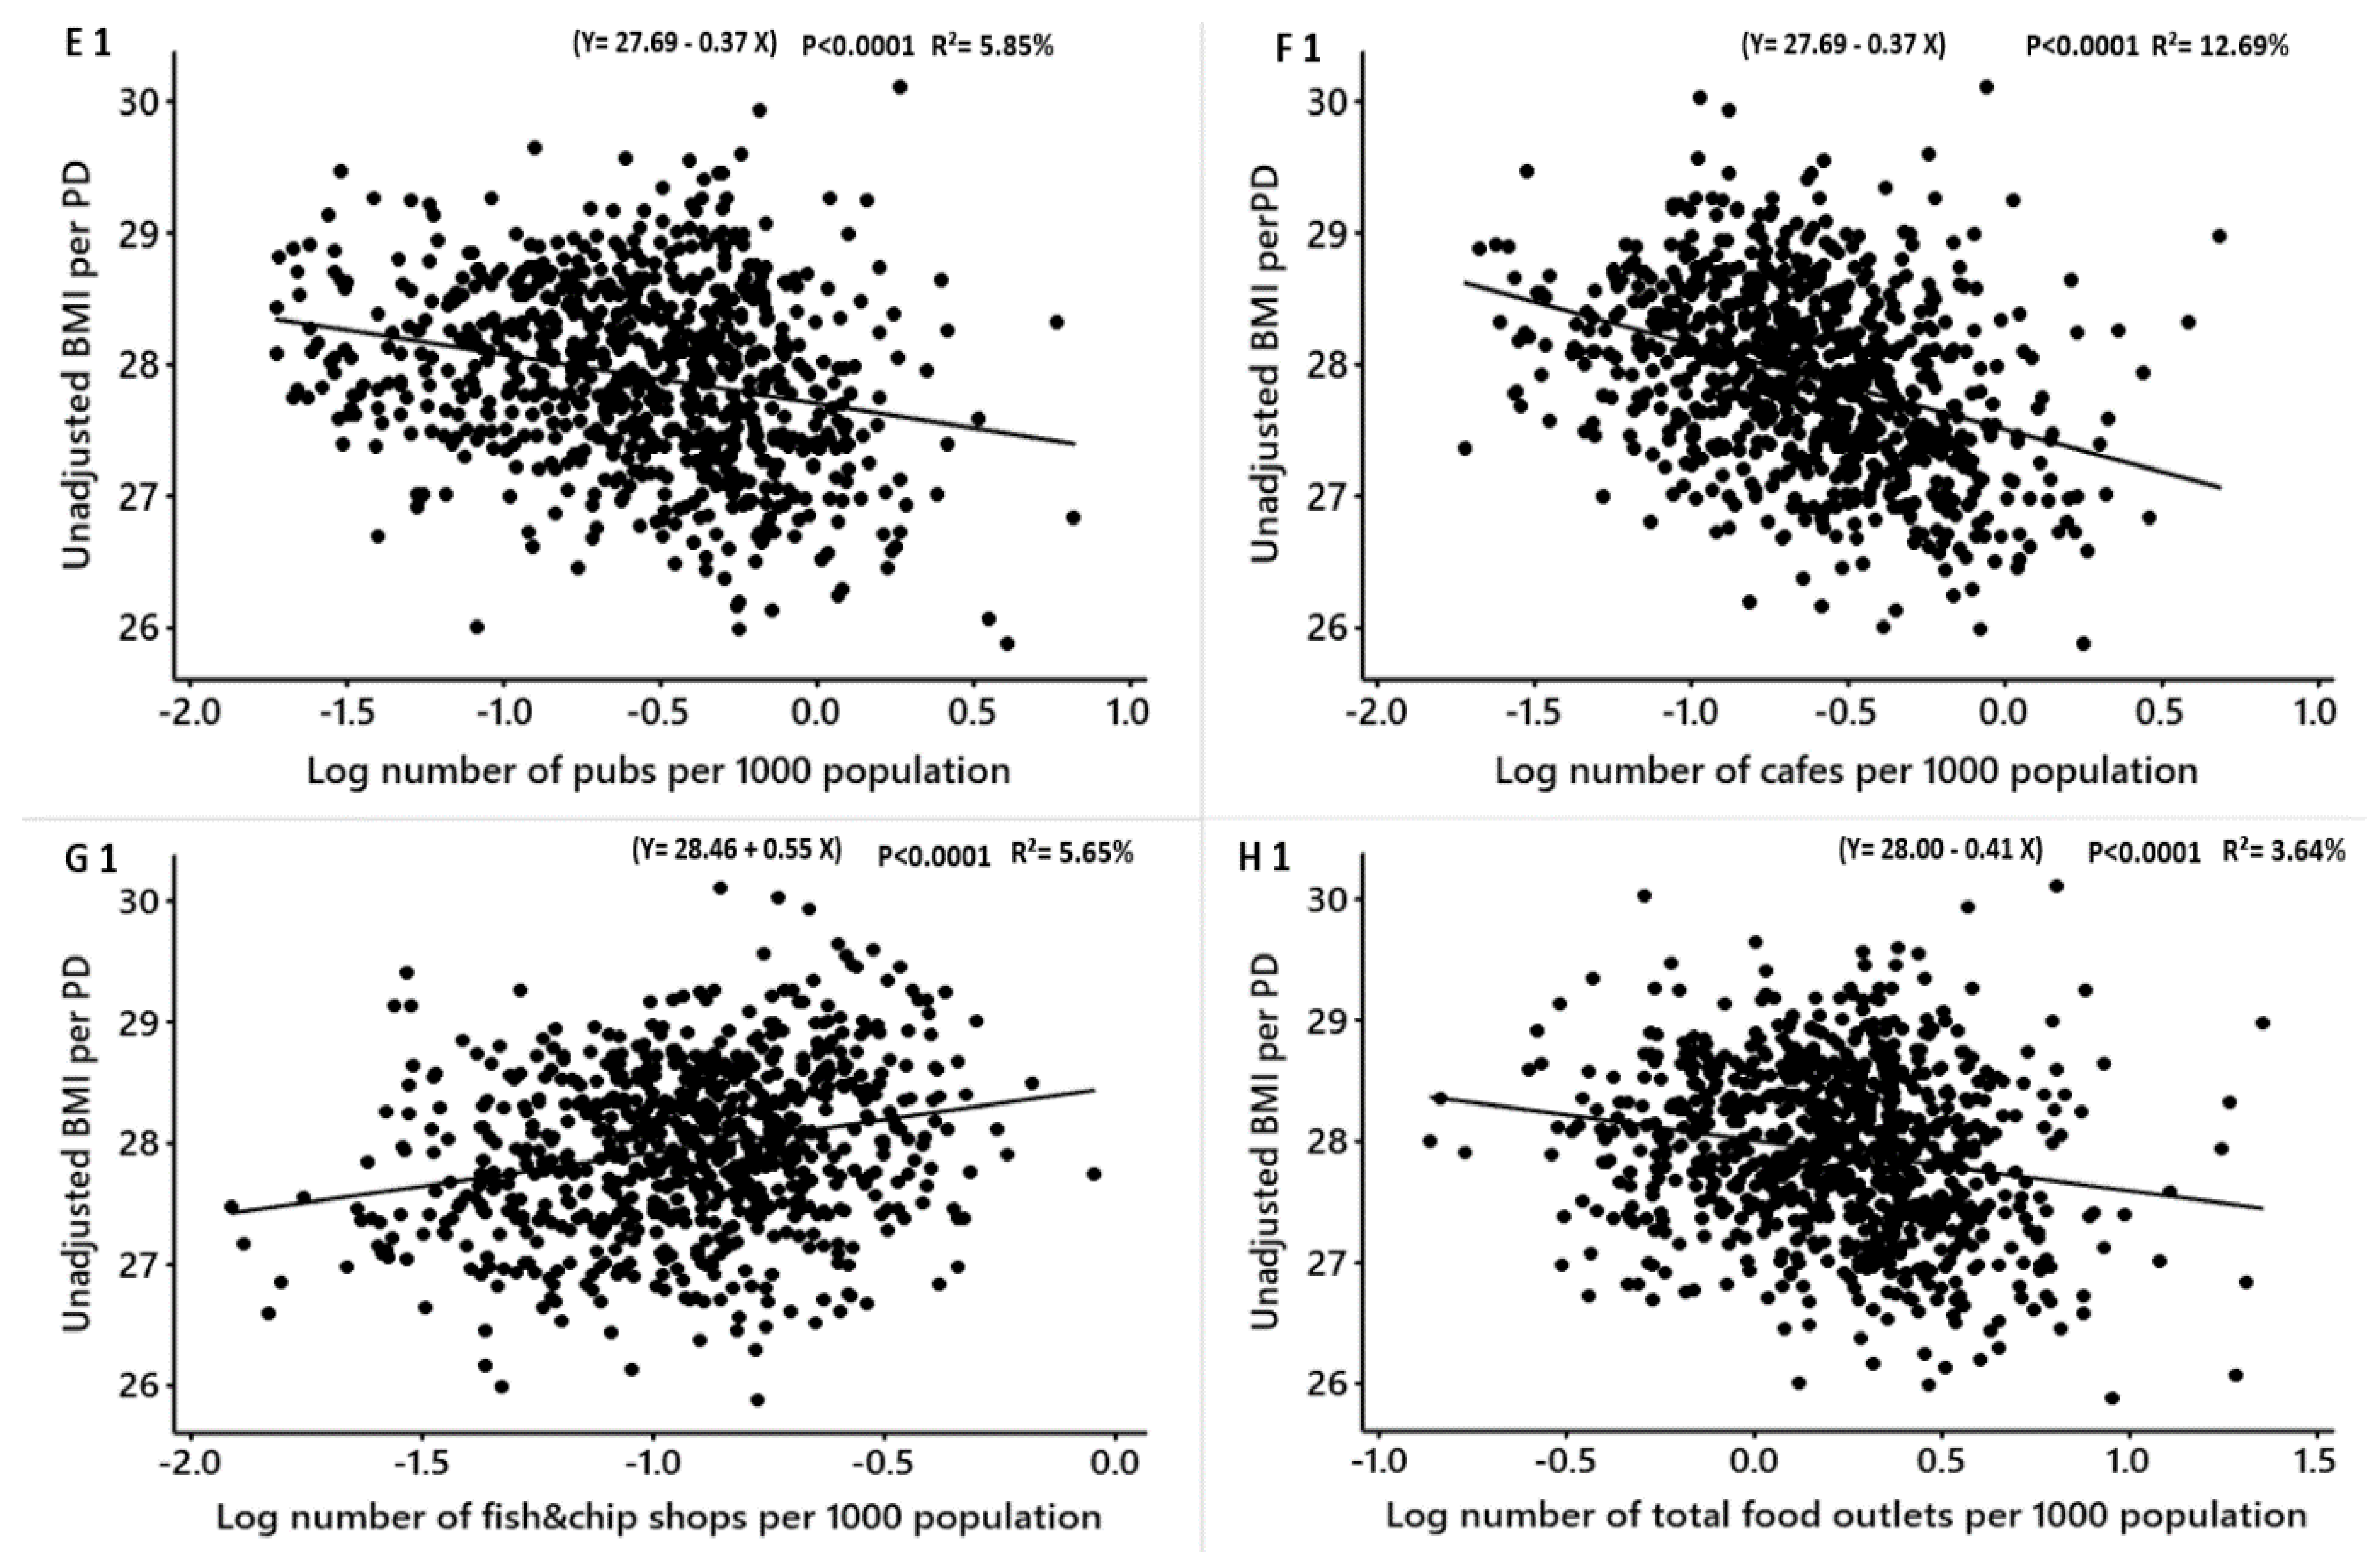
| Obesity Measure | Food Outlet Type | β | Converted β | 99% CI | R2 (%) | T | Adjusted P-Value | Figure 1 |
|---|---|---|---|---|---|---|---|---|
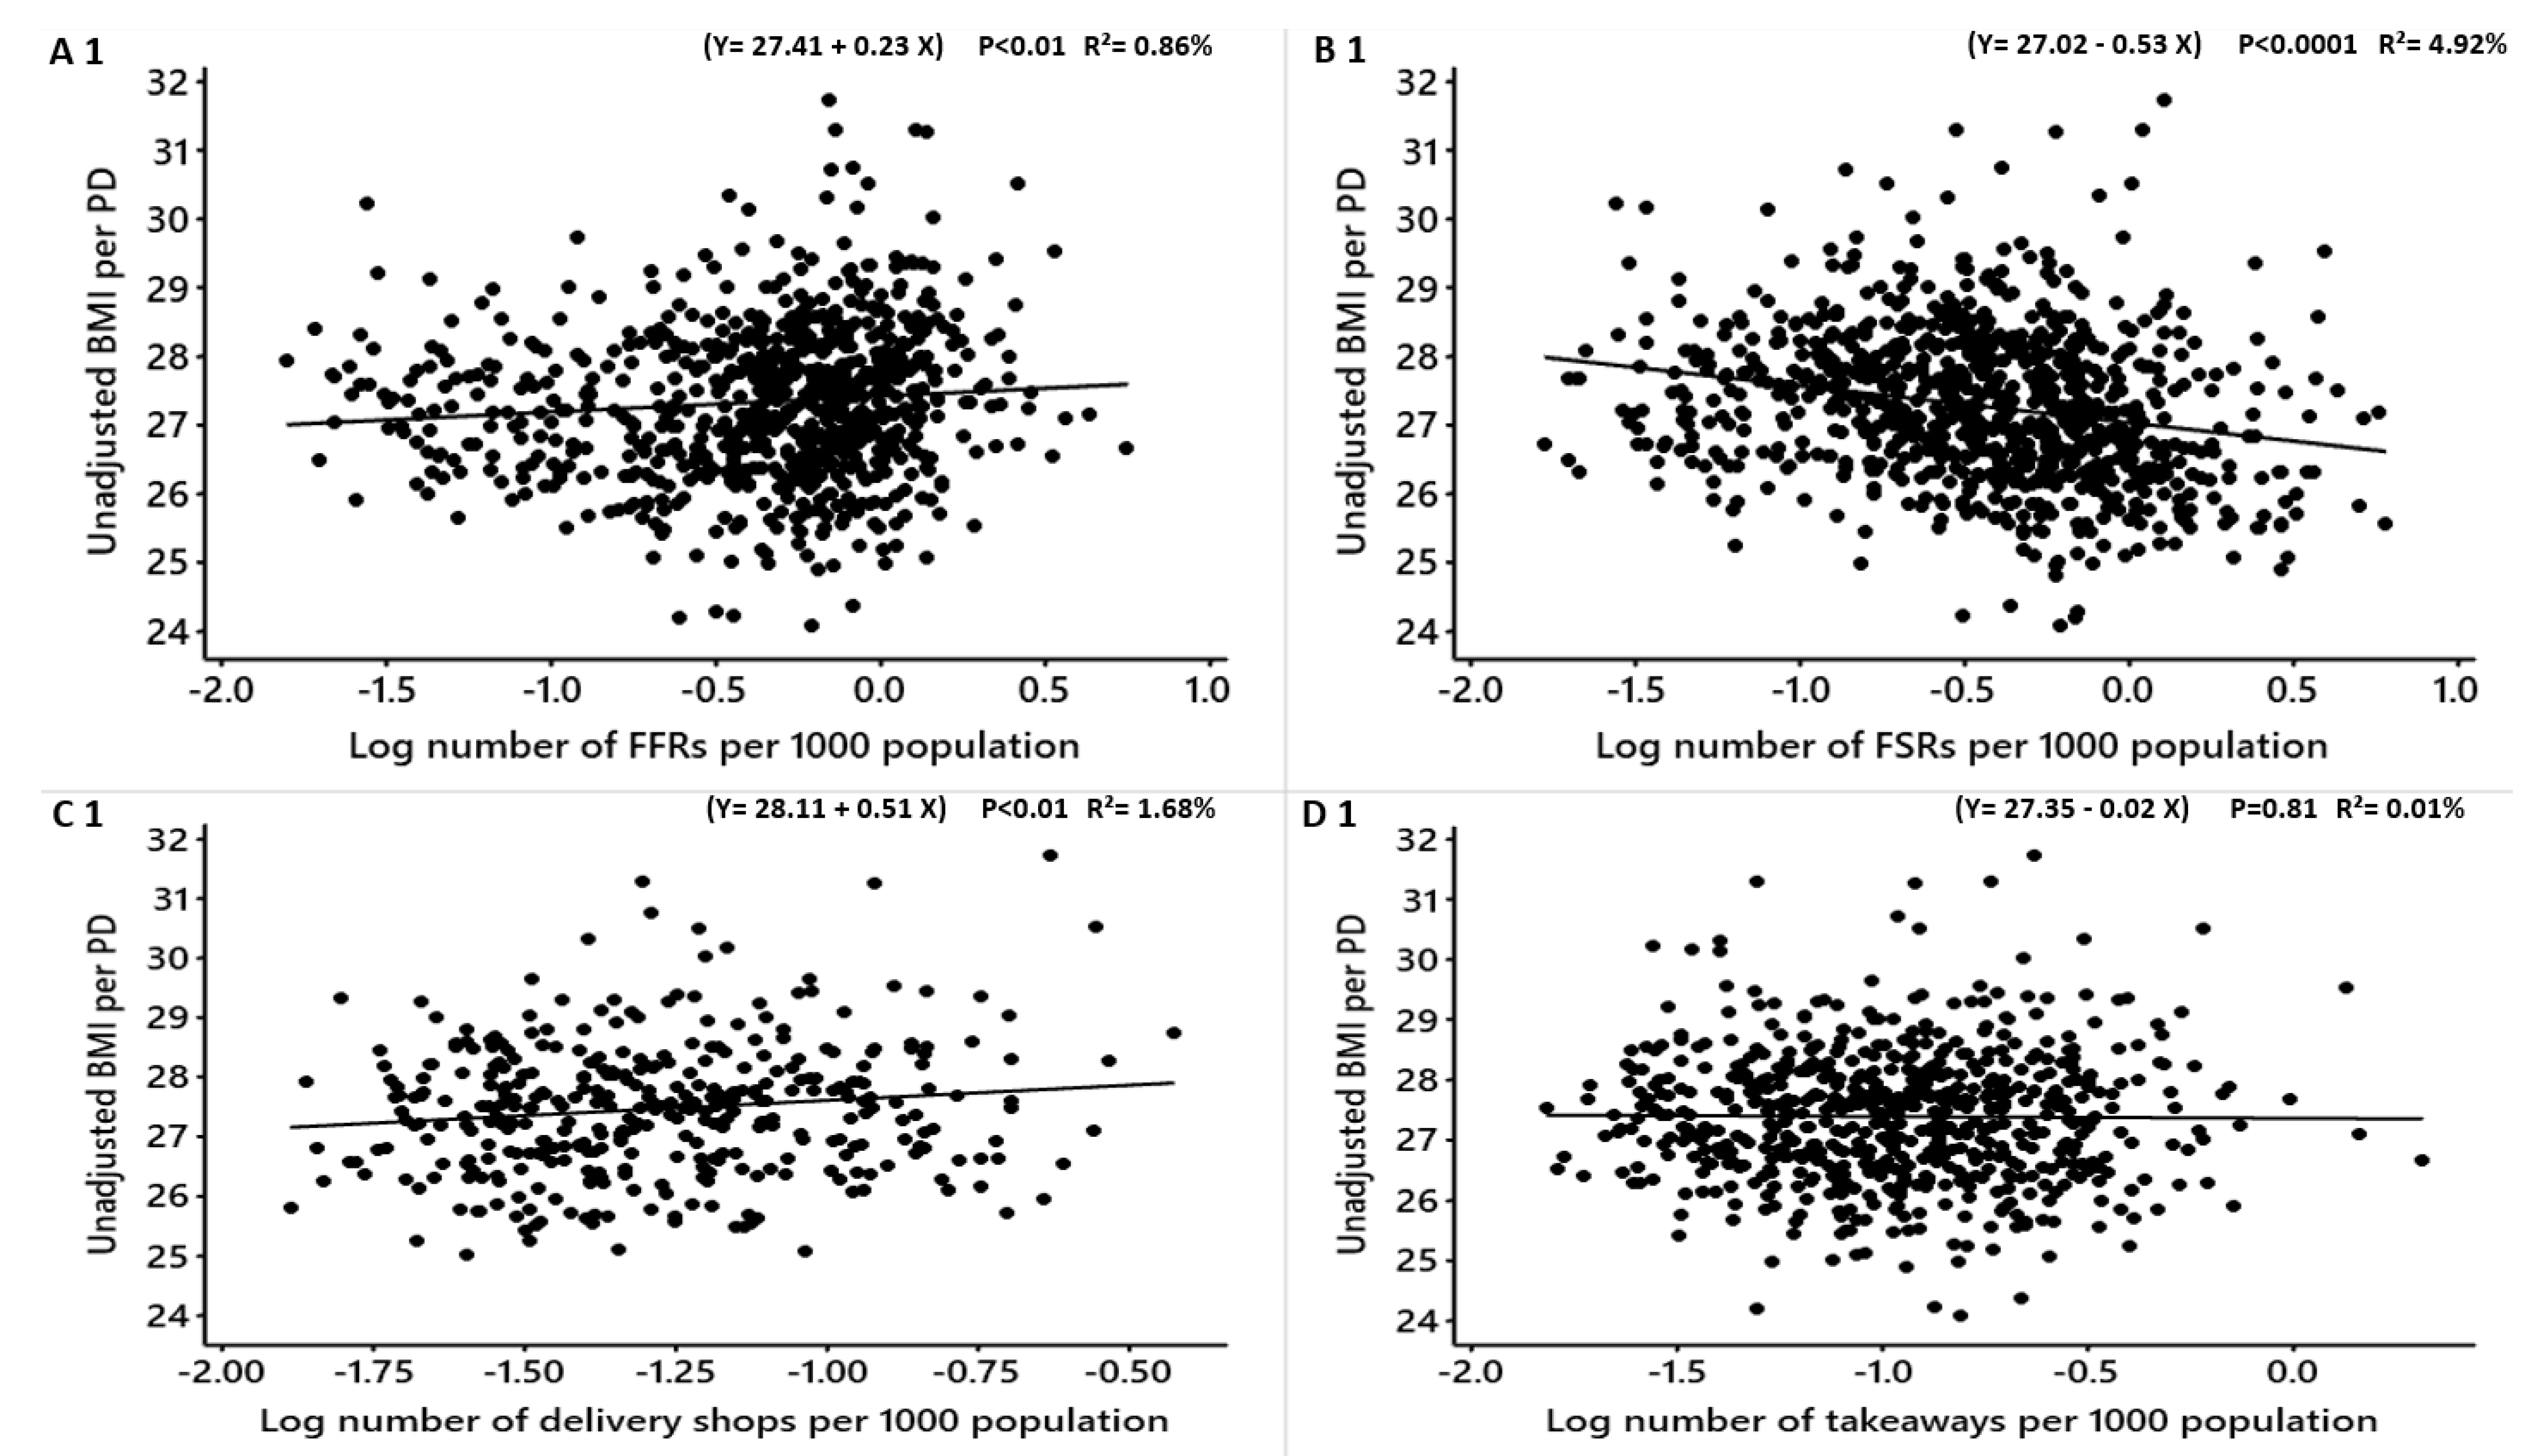
| Unadjusted mean BMI | FFRs | −0.07 | −0.06 | −0.18, −0.03 | 0.25 | −1.38 | 0.16 | A 1 |
| FSRs | −0.31 | −0.26 | −0.41, −0.21 | 4.27 | −6.16 | <0.0001 | B 1 | |
| Delivery shops | 0.17 | 0.18 | −0.05, 0.41 | 0.59 | 1.49 | 0.13 | C 1 | |
| Takeaways | −0.28 | −0.24 | −0.44, −0.13 | 2.12 | −3.72 | <0.0001 | D 1 | |
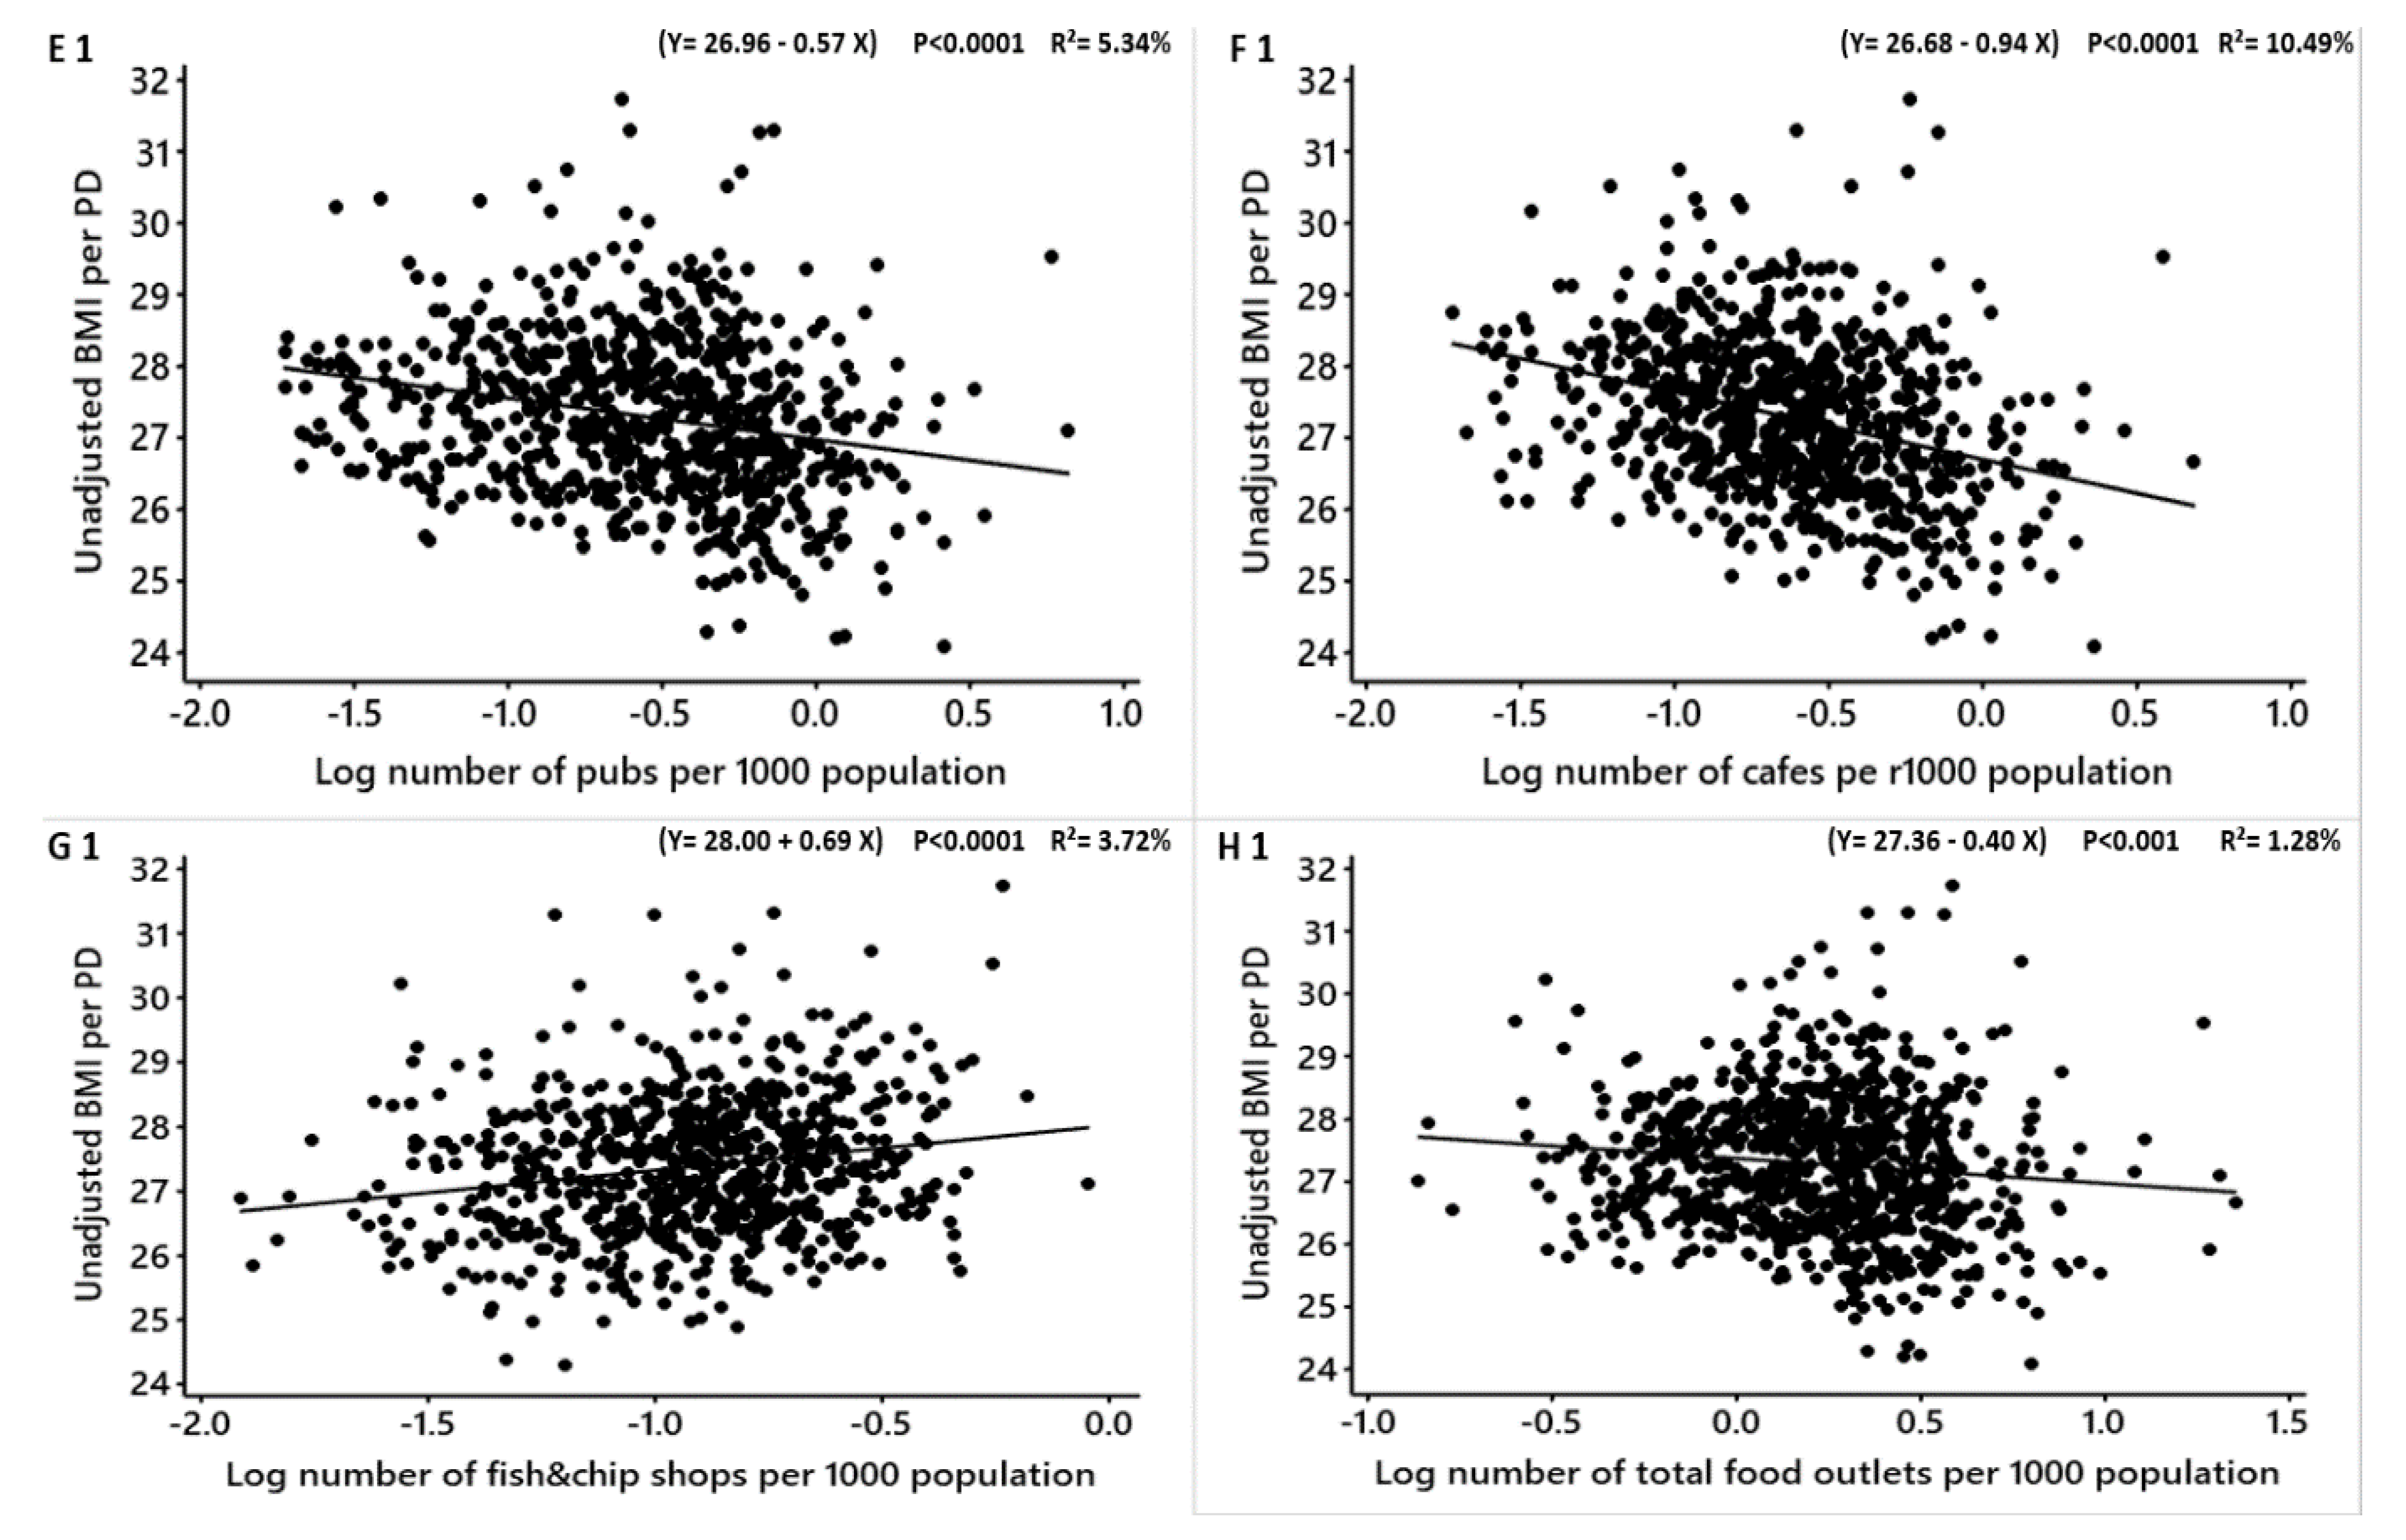
| Pubs | −0.37 | −0.30 | −0.48, −0.26 | 5.85 | −6.81 | <0.0001 | E 1 | |
| Cafes | −0.64 | −0.47 | −0.76, −0.52 | 12.69 | −10.79 | <0.0001 | F 1 | |
| Fish and chip shops | 0.54 | 0.71 | 0.38, 0.70 | 5.65 | 6.69 | <0.0001 | G 1 | |
| Total food outlets (combined) | −0.41 | −0.33 | −0.55, −0.27 | 3.64 | −5.67 | <0.0001 | H 1 | |
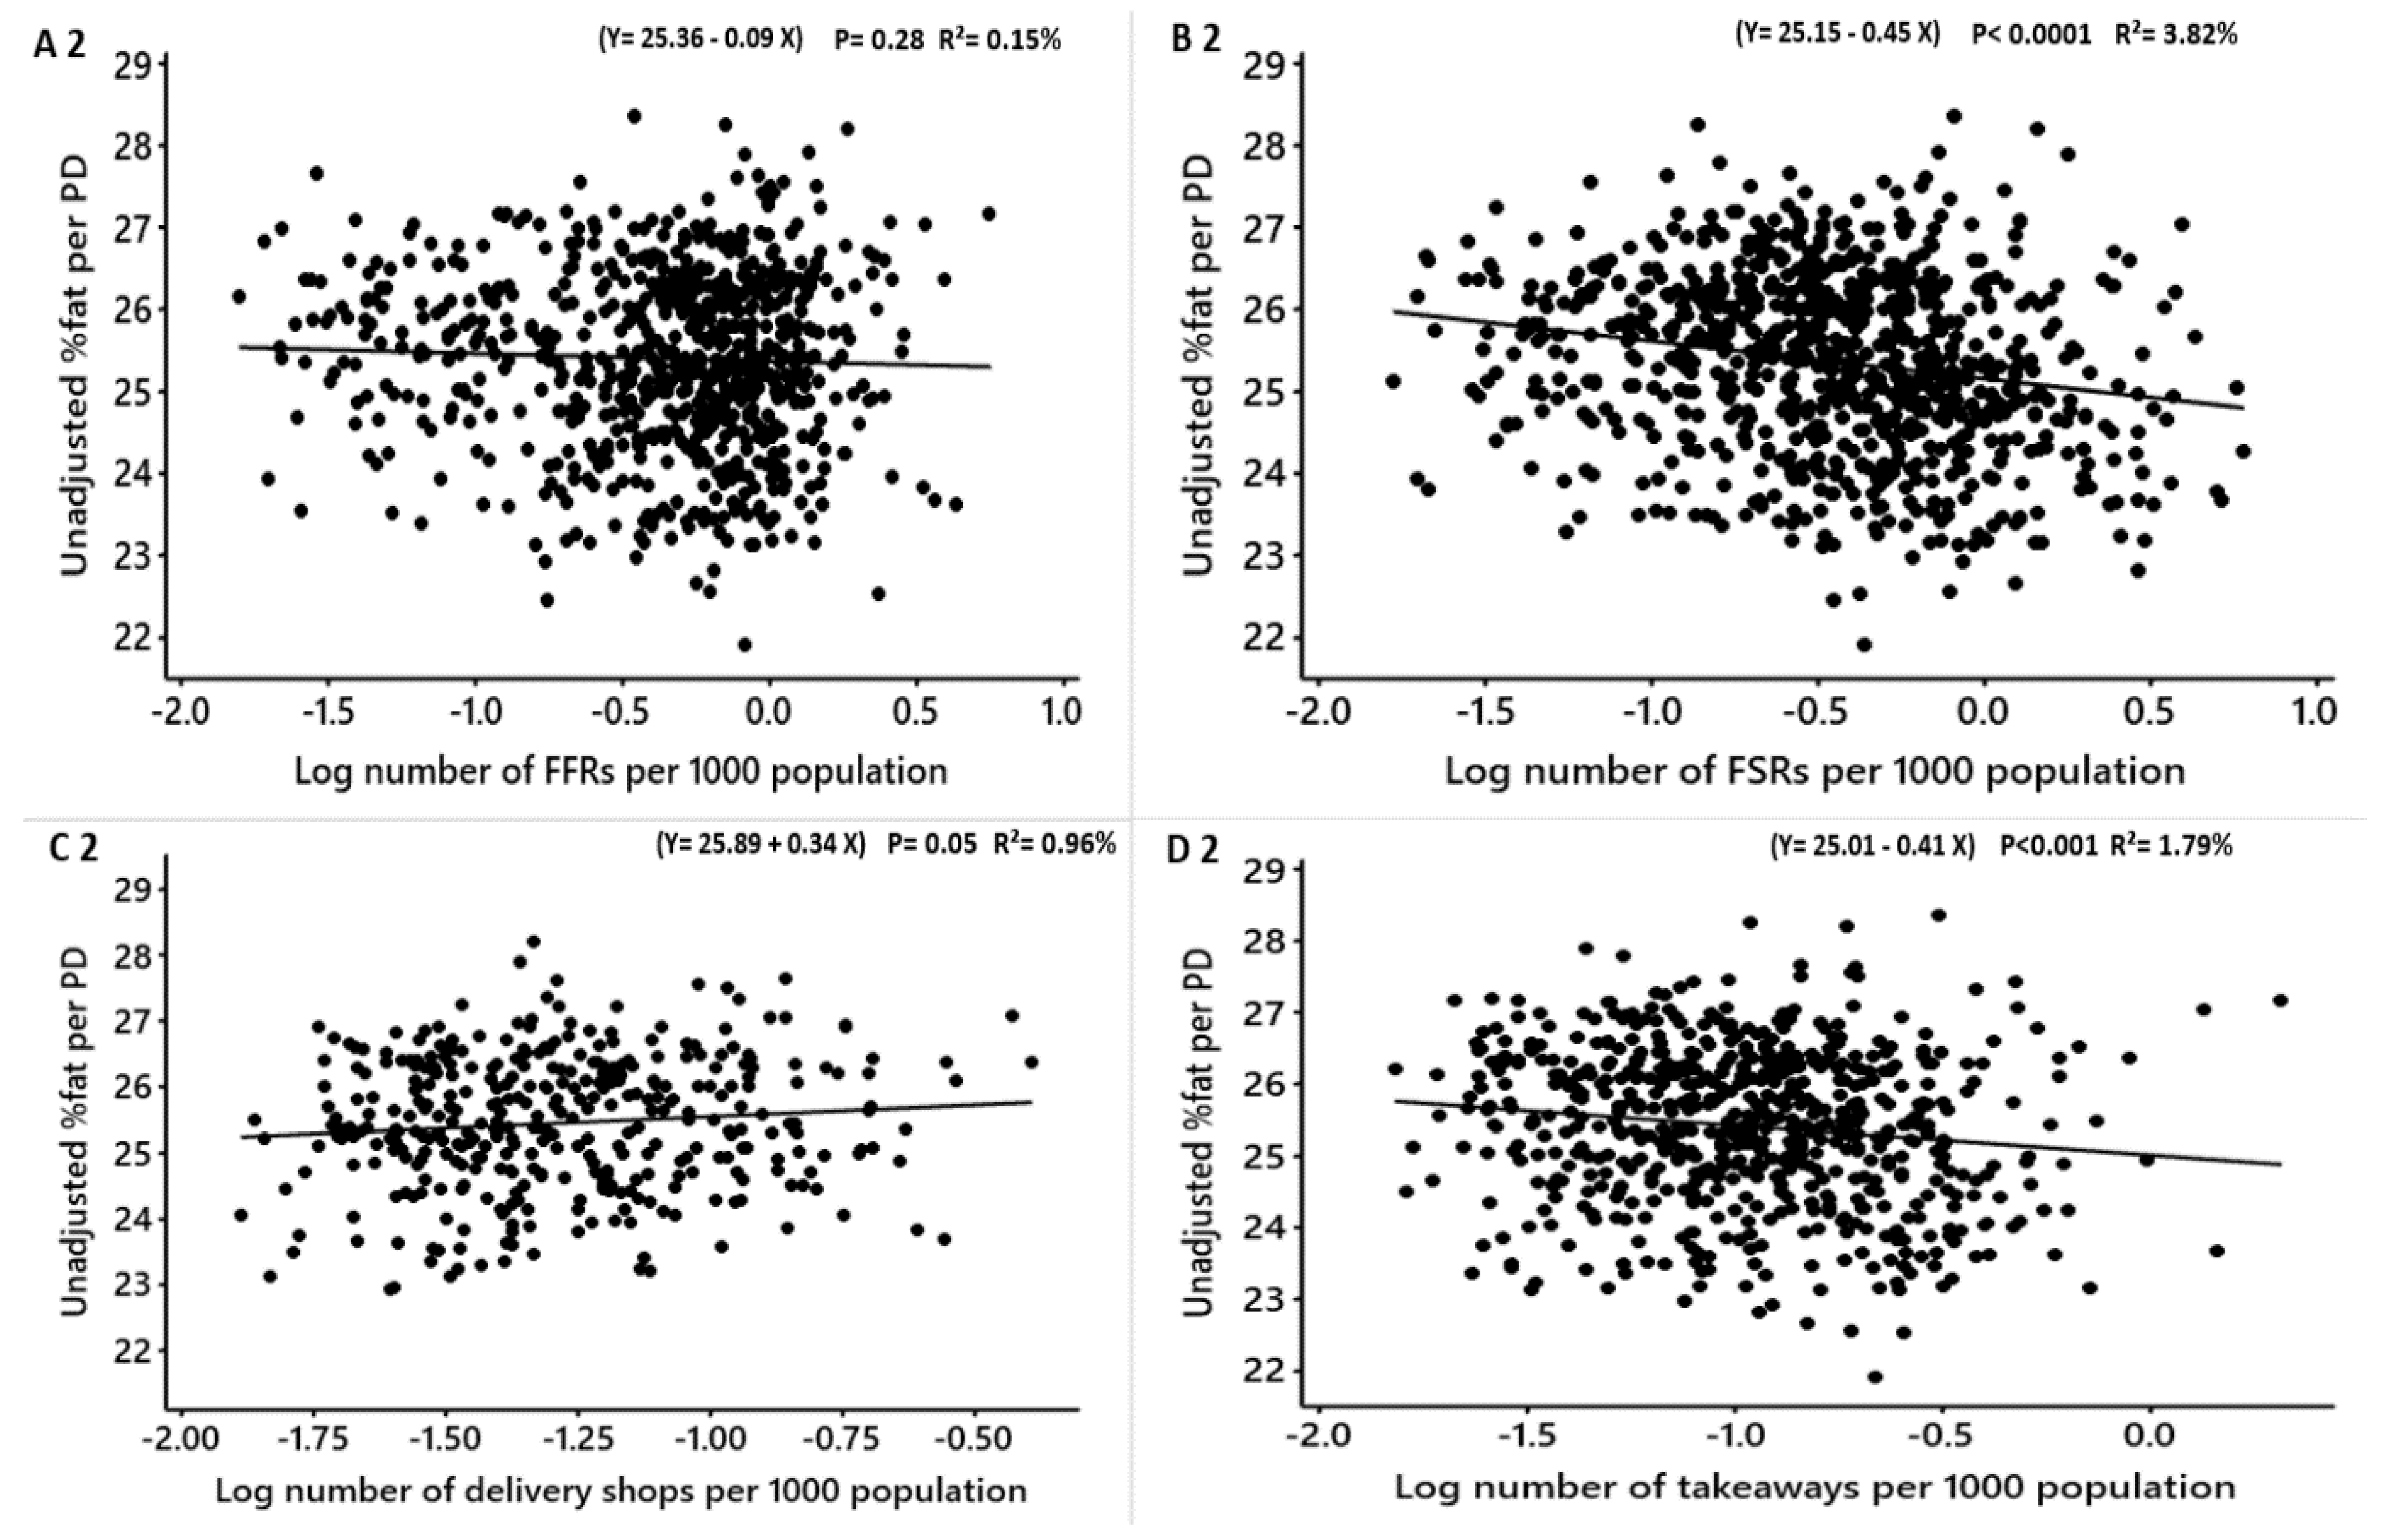
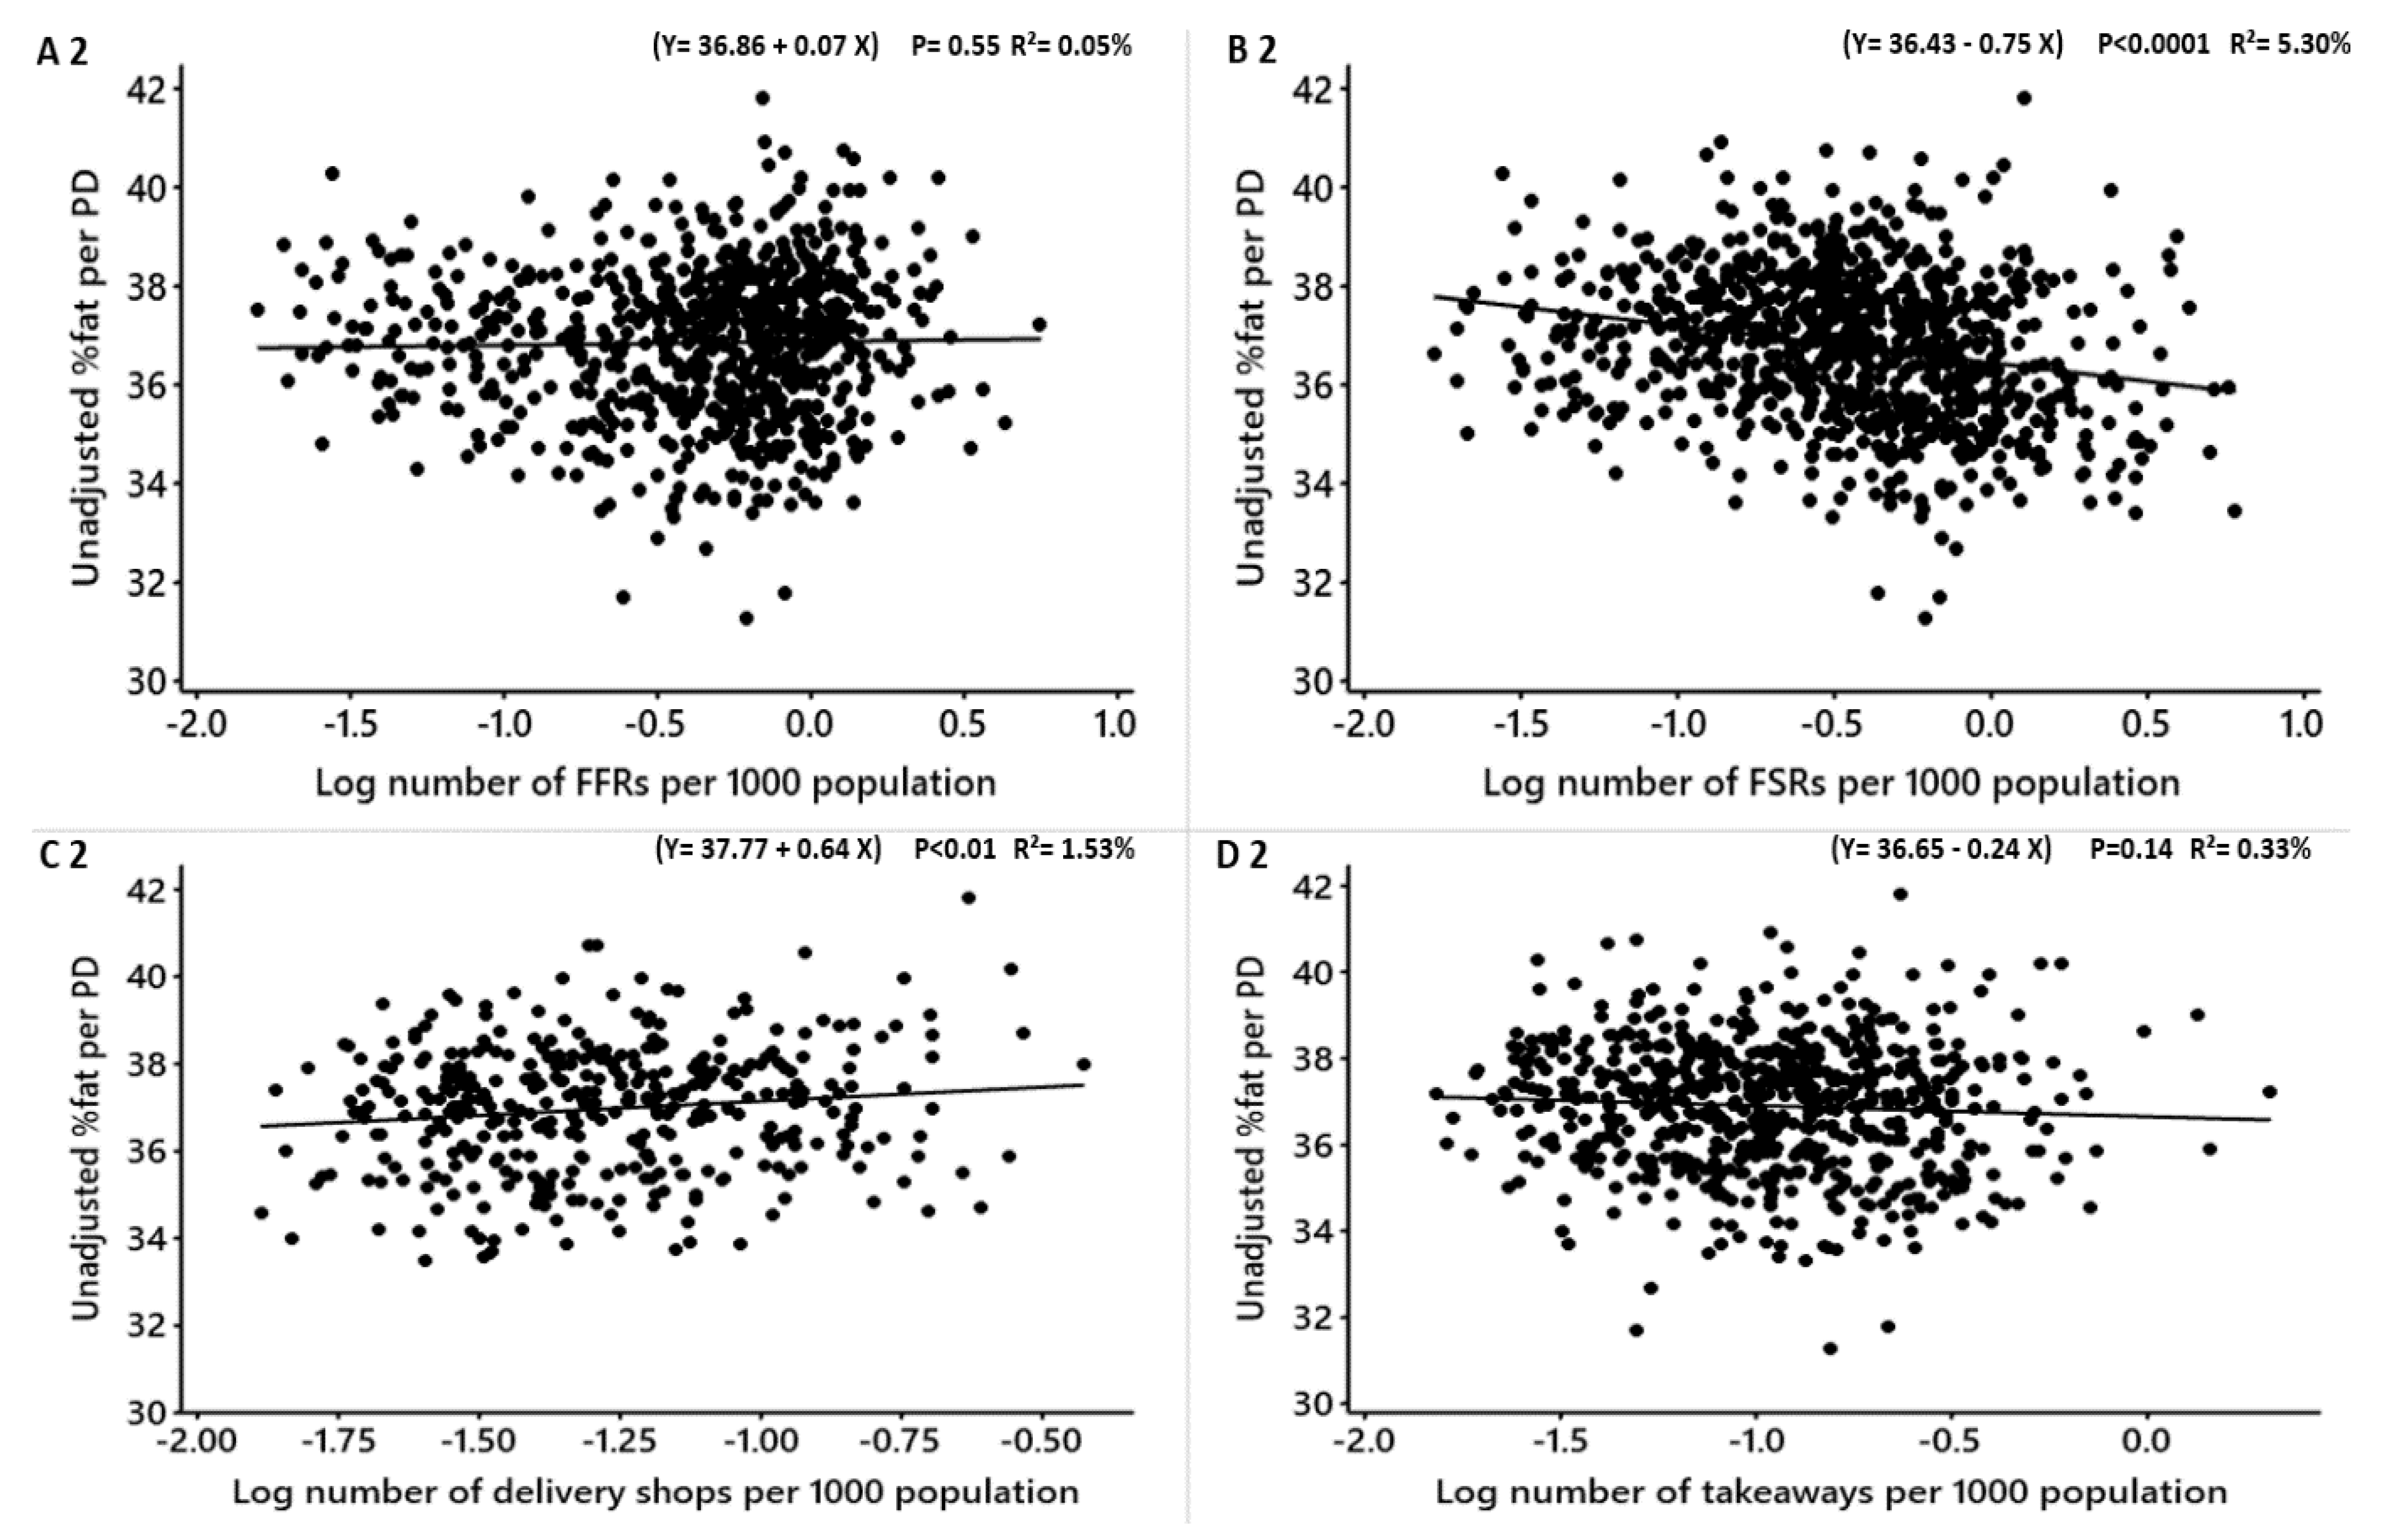
| Unadjusted mean %fat | FFRs | −0.09 | −0.08 | −0.26, 0.07 | 0.15 | −1.07 | 0.28 | A 2 |
| FSRs | −0.45 | −0.36 | −0.61, −0.30 | 3.82 | −5.82 | <0.0001 | B 2 | |
| Delivery shops | 0.34 | 0.40 | −0.01, 0.71 | 0.96 | 1.90 | 0.05 | C 2 | |
| Takeaways | −0.41 | −0.33 | −0.64, −0.17 | 1.79 | −3.42 | <0.001 | D 2 | |
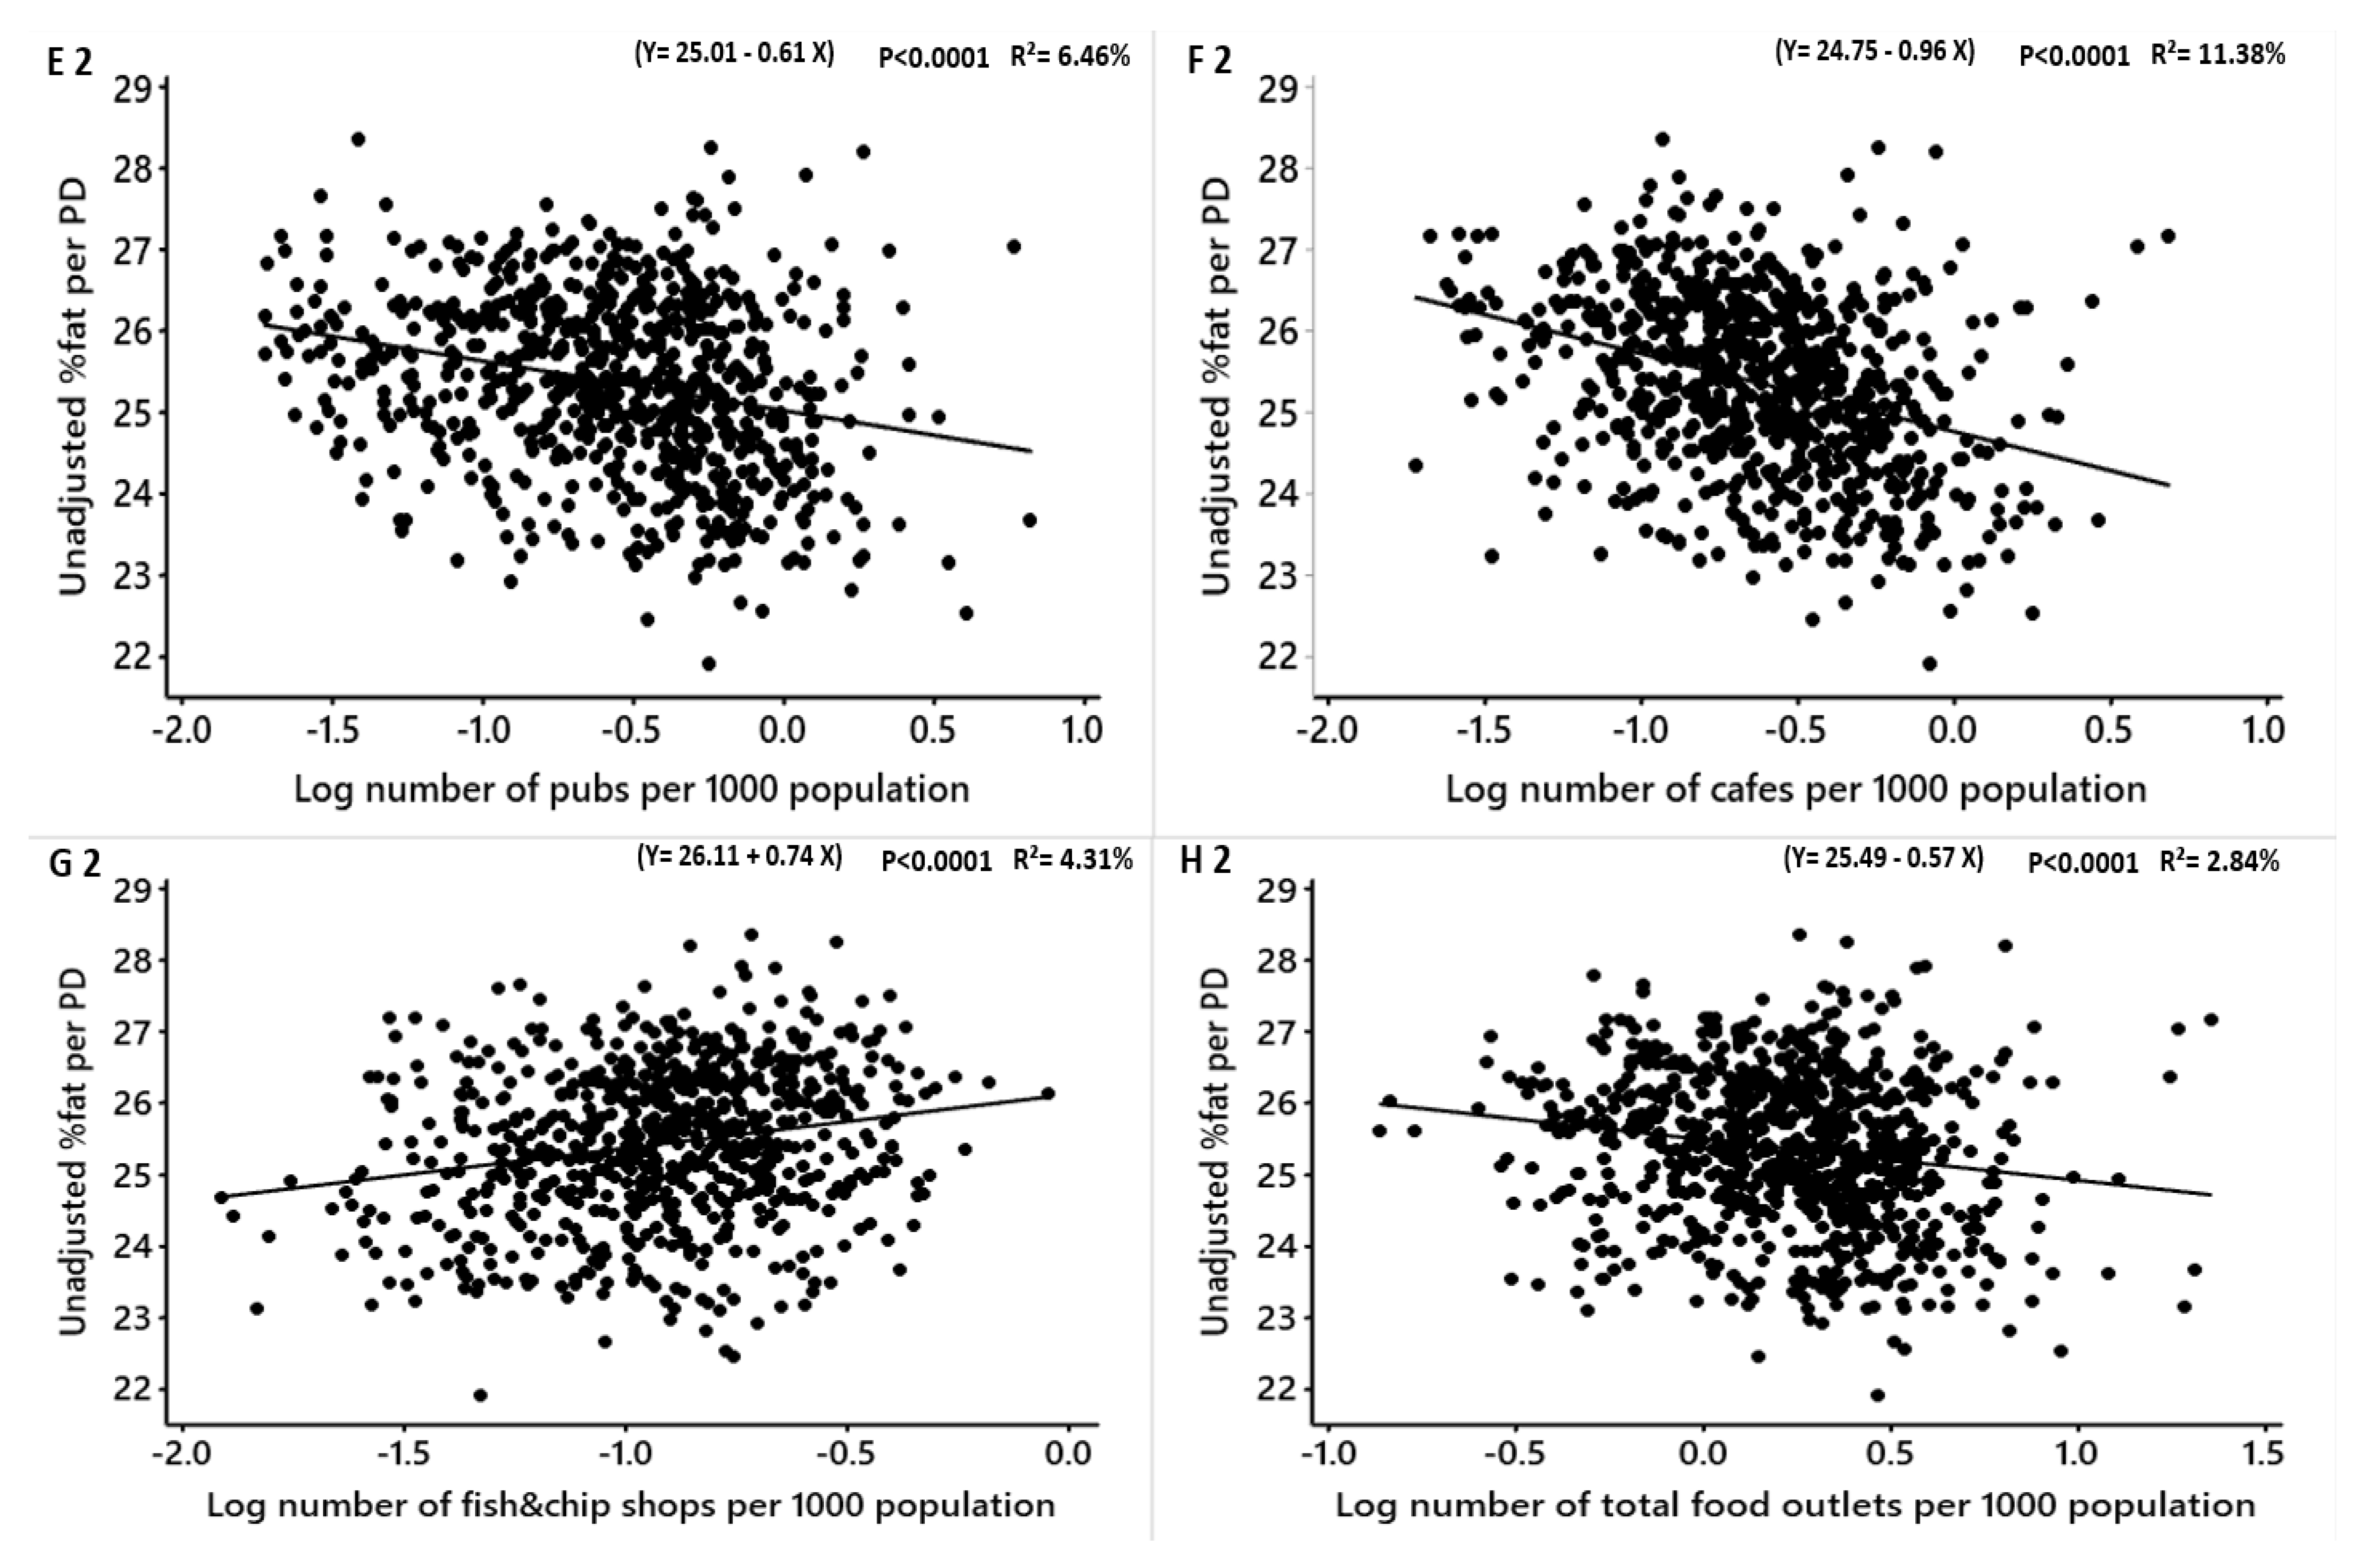
| Pubs | −0.61 | −0.45 | −0.77, −0.44 | 6.46 | −7.18 | <0.0001 | E 2 | |
| Cafes | −0.96 | −0.61 | −1.14, −0.77 | 11.38 | −10.15 | <0.0001 | F 2 | |
| Fish and chip shops | 0.74 | 1.09 | 0.49, 1.0 | 4.31 | 5.80 | <0.0001 | G 2 | |
| Total food outlets (combined) | −0.57 | −0.43 | −0.79, −0.34 | 2.84 | −4.99 | <0.0001 | H 2 | |
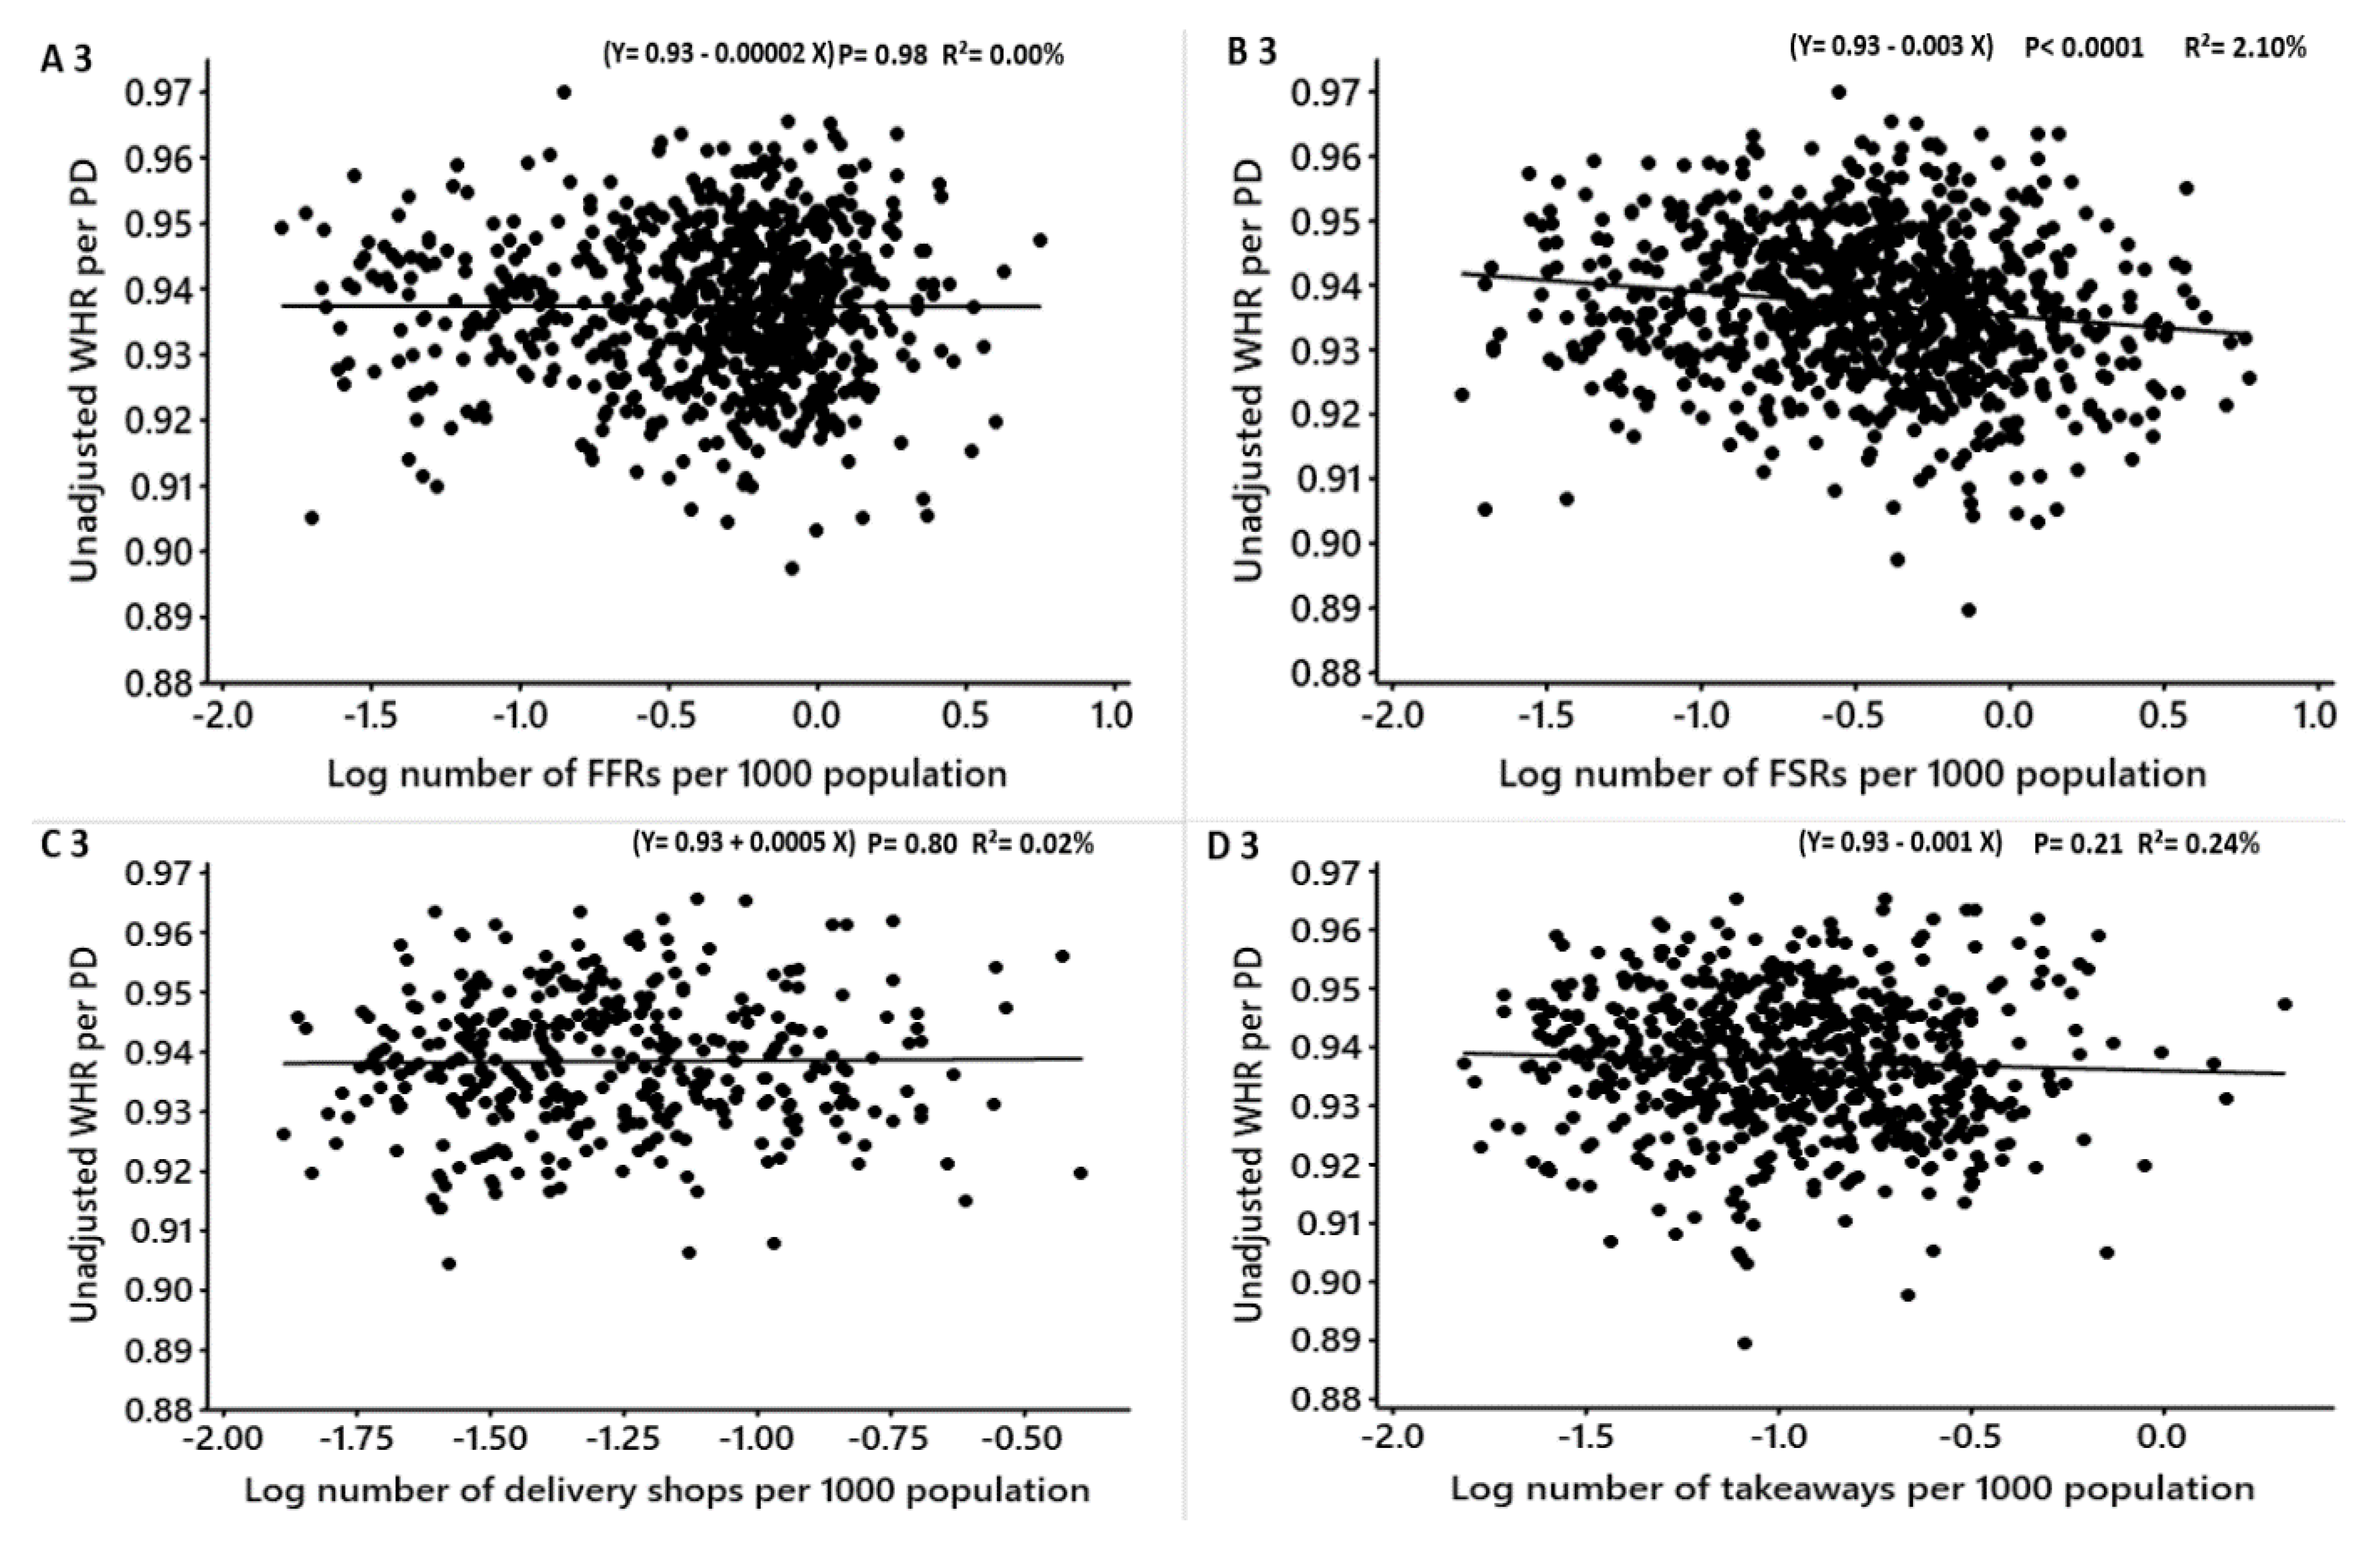
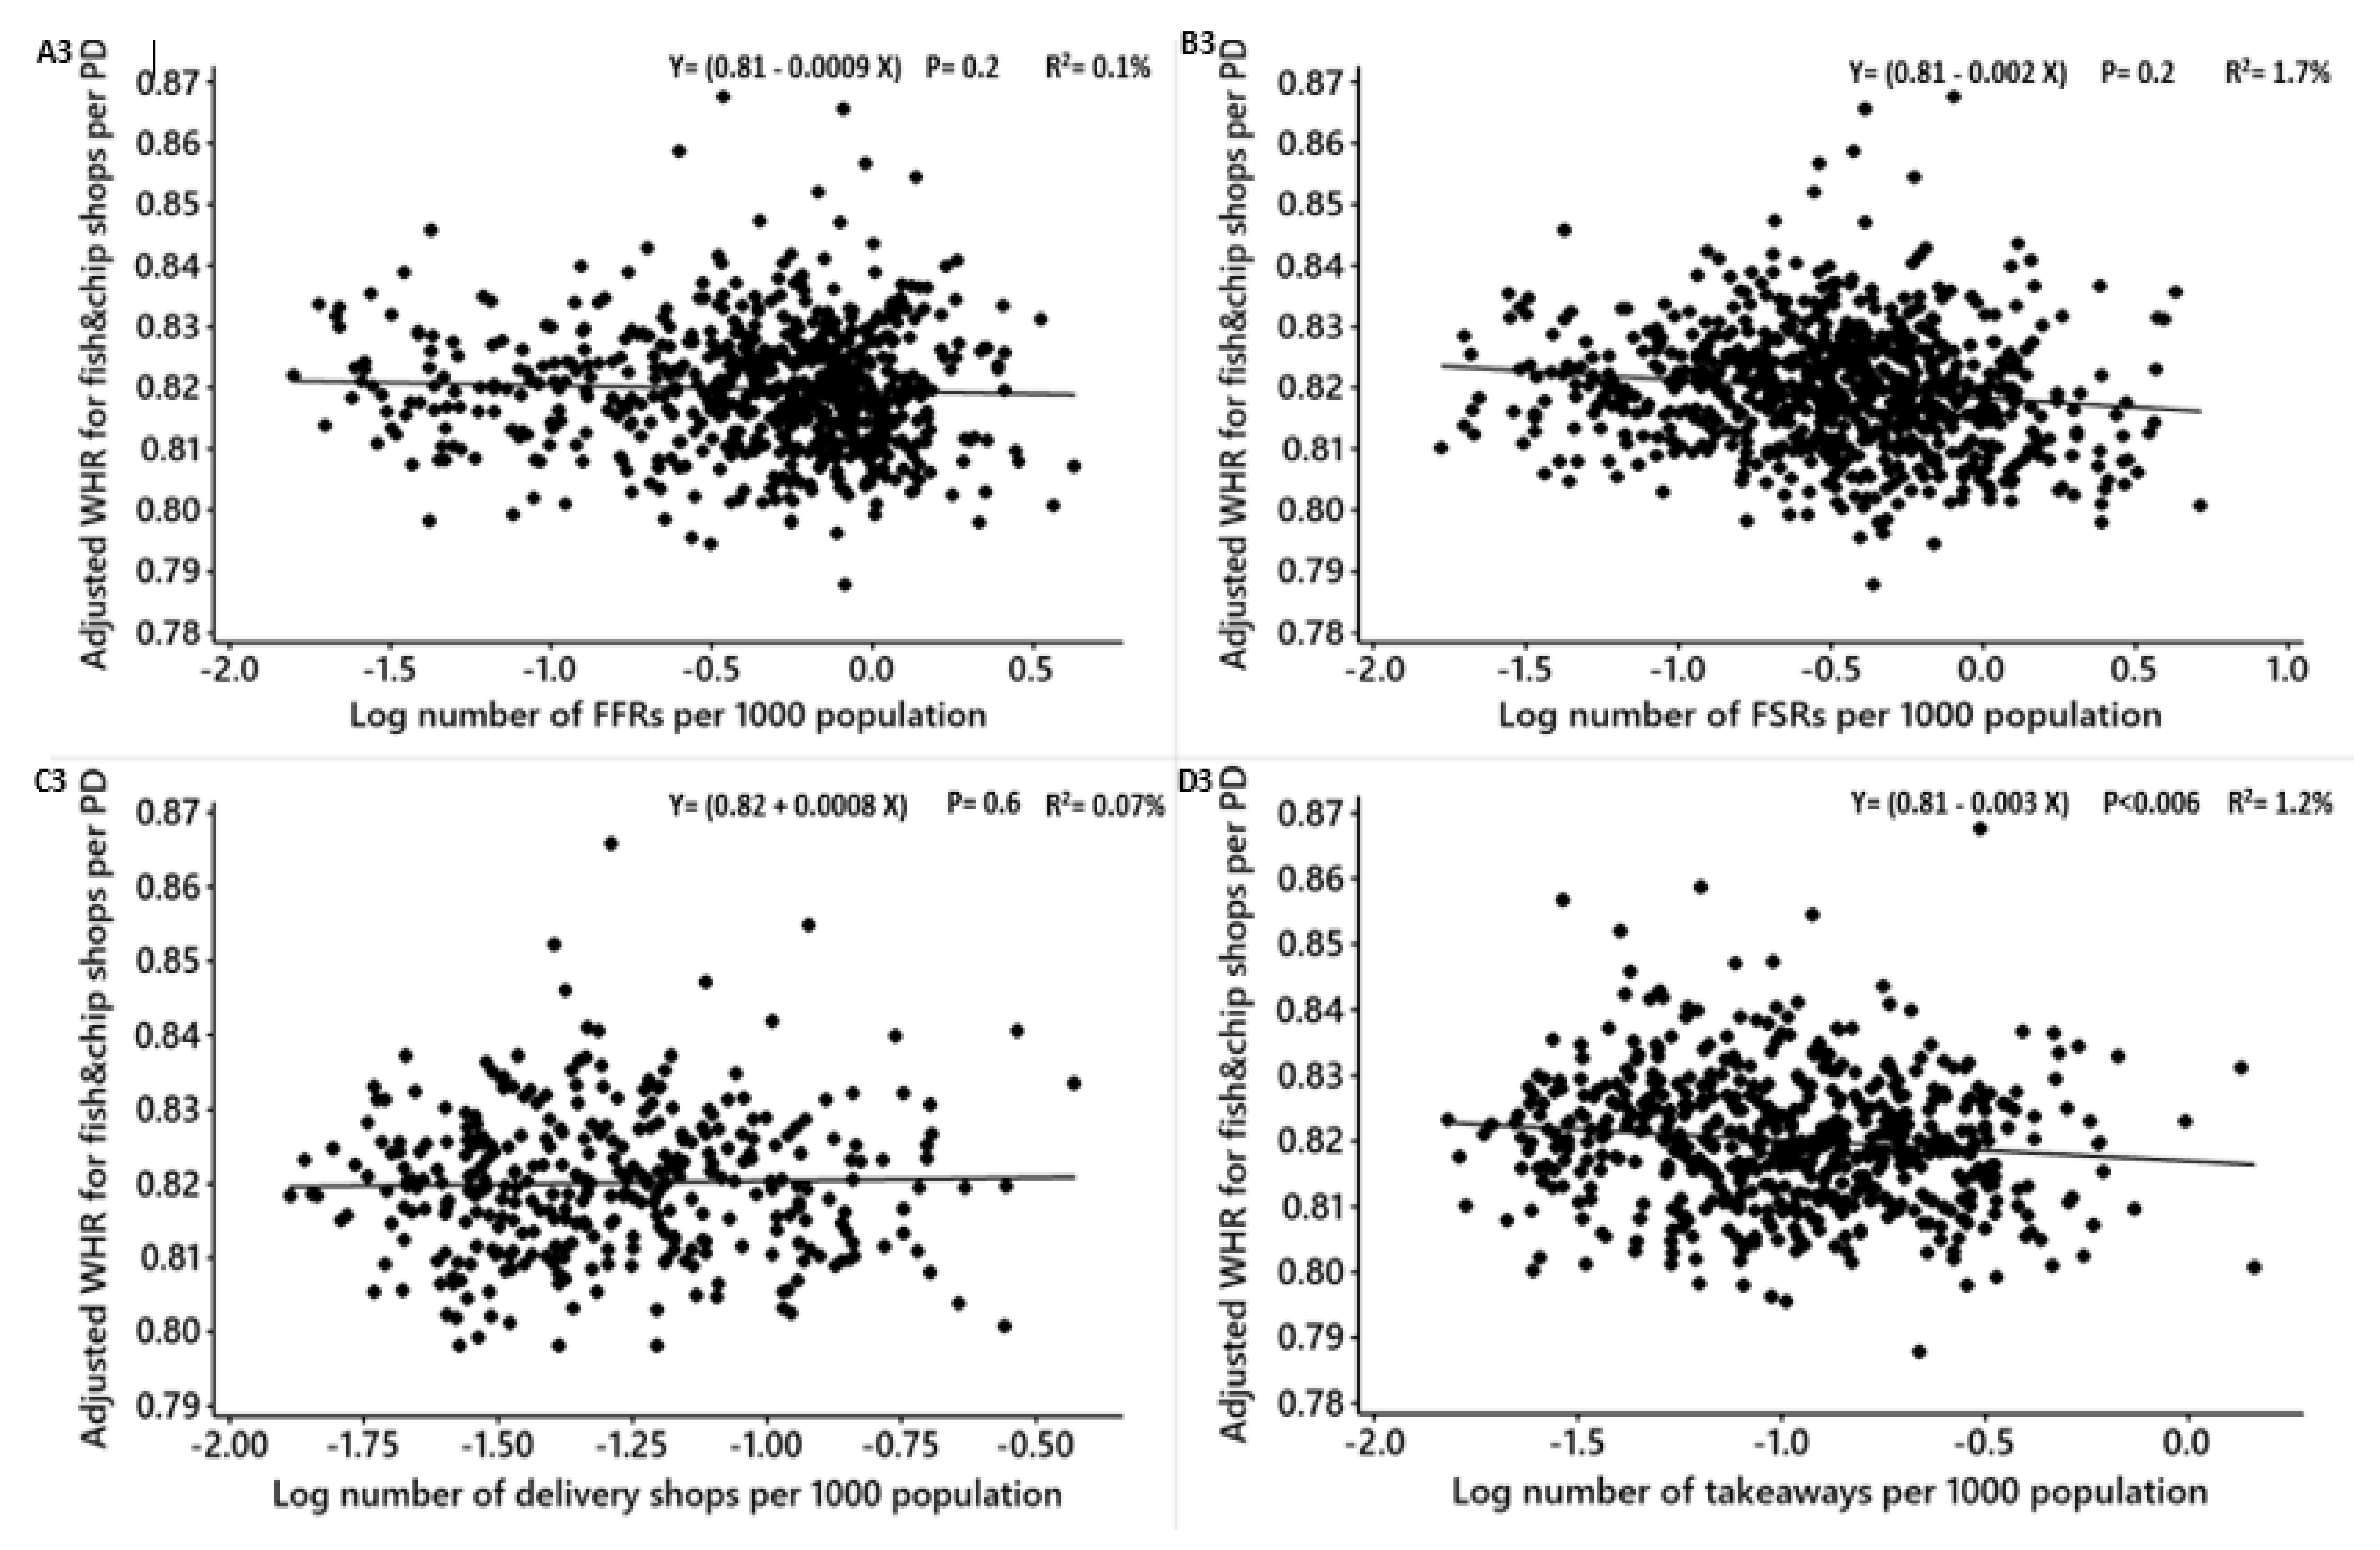
| Unadjusted mean WHR | FFRs | −0.00002 | −0.00002 | −0.0018, 0.0017 | 0.00 | −0.02 | 0.98 | A 3 |
| FSRs | −0.003 | −0.002 | −0.005, −0.001 | 2.10 | −4.27 | <0.0001 | B 3 | |
| Delivery shops | 0.0005 | 0.0005 | −0.003, 0.004 | 0.02 | 0.25 | 0.80 | C 3 | |
| Takeaways | −0.001 | −0.0009 | −0.004, 0.0009 | 0.24 | −1.25 | 0.21 | D 3 | |
| Pubs | −0.006 | −0.005 | −0.008, −0.005 | 7.17 | −7.60 | <0.0001 | E 3 | |
| Cafes | −0.009 | −0.008 | −0.01, −0.007 | 9.49 | −9.17 | <0.0001 | F 3 | |
| Fish and chip shops | 0.007 | 0.006 | 0.003, 0.009 | 2.90 | 2.29 | <0.0001 | G 3 | |
| Total food outlets (combined) | −0.004 | −0.003 | −0.007, −0.002 | 1.84 | −3.99 | <0.0001 | H 3 |
| Obesity Measure | Food Outlet Type | β | Converted β | 99% CI | R2 (%) | T | Adjusted P-Value | Figure 2 |
|---|---|---|---|---|---|---|---|---|
| Unadjusted mean BMI | FFRs | 0.23 | 0.25 | 0.05, 0.40 | 0.86 | 2.57 | 0.01 | A 1 |
| FSRs | −0.53 | −0.41 | −0.69, −0.37 | 4.92 | −6.65 | <0.0001 | B 1 | |
| Delivery shops | 0.51 | 0.66 | 0.11, 0.90 | 1.68 | 2.53 | 0.01 | C 1 | |
| Takeaways | −0.02 | −0.01 | −0.27, 0.21 | 0.01 | −0.23 | 0.81 | D 1 | |
| Pubs | −0.57 | −0.43 | −0.75, −0.40 | 5.34 | −6.51 | <0.0001 | E 1 | |
| Cafes | −0.94 | −0.60 | −1.13, −0.75 | 10.49 | −9.72 | <0.0001 | F 1 | |
| Fish and chip shops | 0.69 | 0.99 | 0.44, 0.94 | 3.72 | 5.37 | <0.0001 | G 1 | |
| Total food outlets (combined) | −0.40 | −0.32 | −0.63, −0.16 | 1.28 | −3.34 | <0.001 | H 1 | |
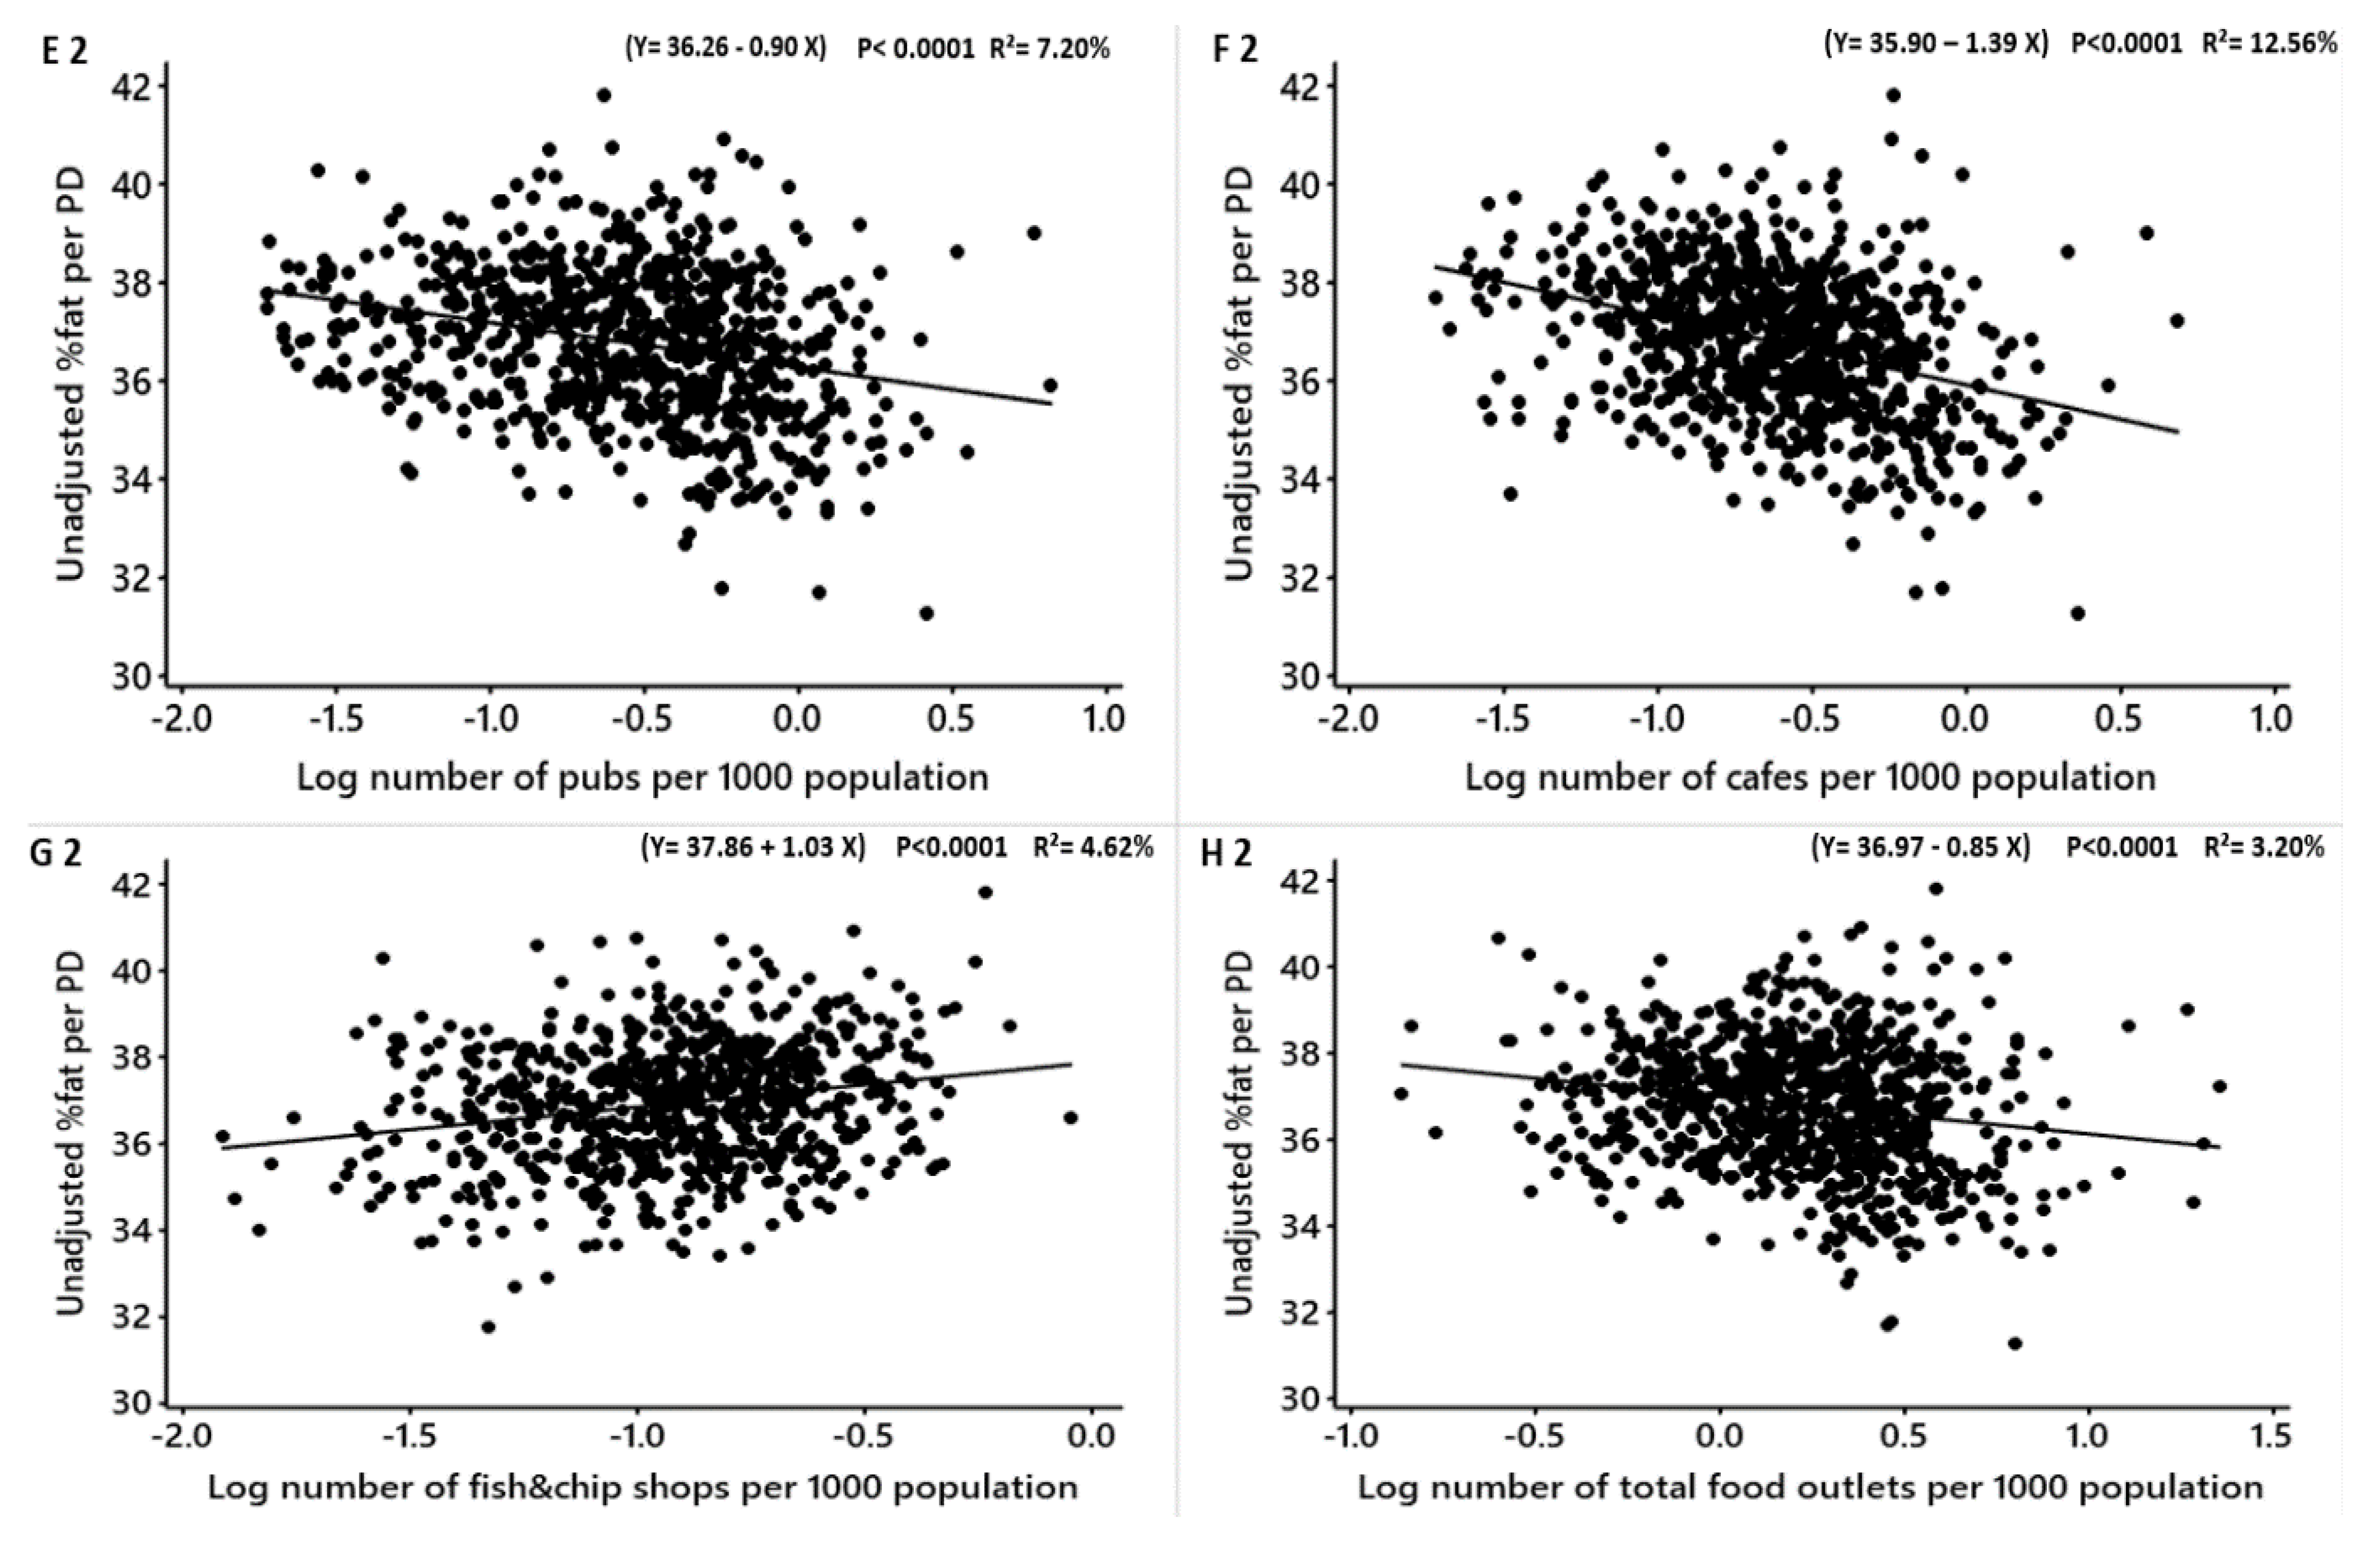
| Unadjusted mean %fat | FFRs | 0.07 | 0.072 | −0.16, 0.31 | 0.05 | 0.59 | 0.55 | A 2 |
| FSRs | −0.75 | −0.52 | −0.96, −0.54 | 5.30 | −6.92 | <0.0001 | B 2 | |
| Delivery shops | 0.64 | 0.89 | 0.11, 1.16 | 1.53 | 2.41 | 0.01 | C 2 | |
| Takeaways | −0.24 | −0.21 | −0.57, 0.083 | 0.33 | −1.47 | 0.14 | D 2 | |
| Pubs | −0.90 | −0.59 | −1.14, −0.67 | 7.20 | −7.64 | <0.0001 | E 2 | |
| Cafes | −1.39 | −0.75 | −1.65, −1.14 | 12.56 | −10.76 | <0.0001 | F 2 | |
| Fish and chip shops | 1.03 | 1.80 | 0.69, 1.36 | 4.62 | 6.02 | <0.0001 | G 2 | |
| Total food outlets (combined) | −0.85 | −0.57 | −1.14, −0.54 | 3.20 | −5.32 | <0.0001 | H 2 | |
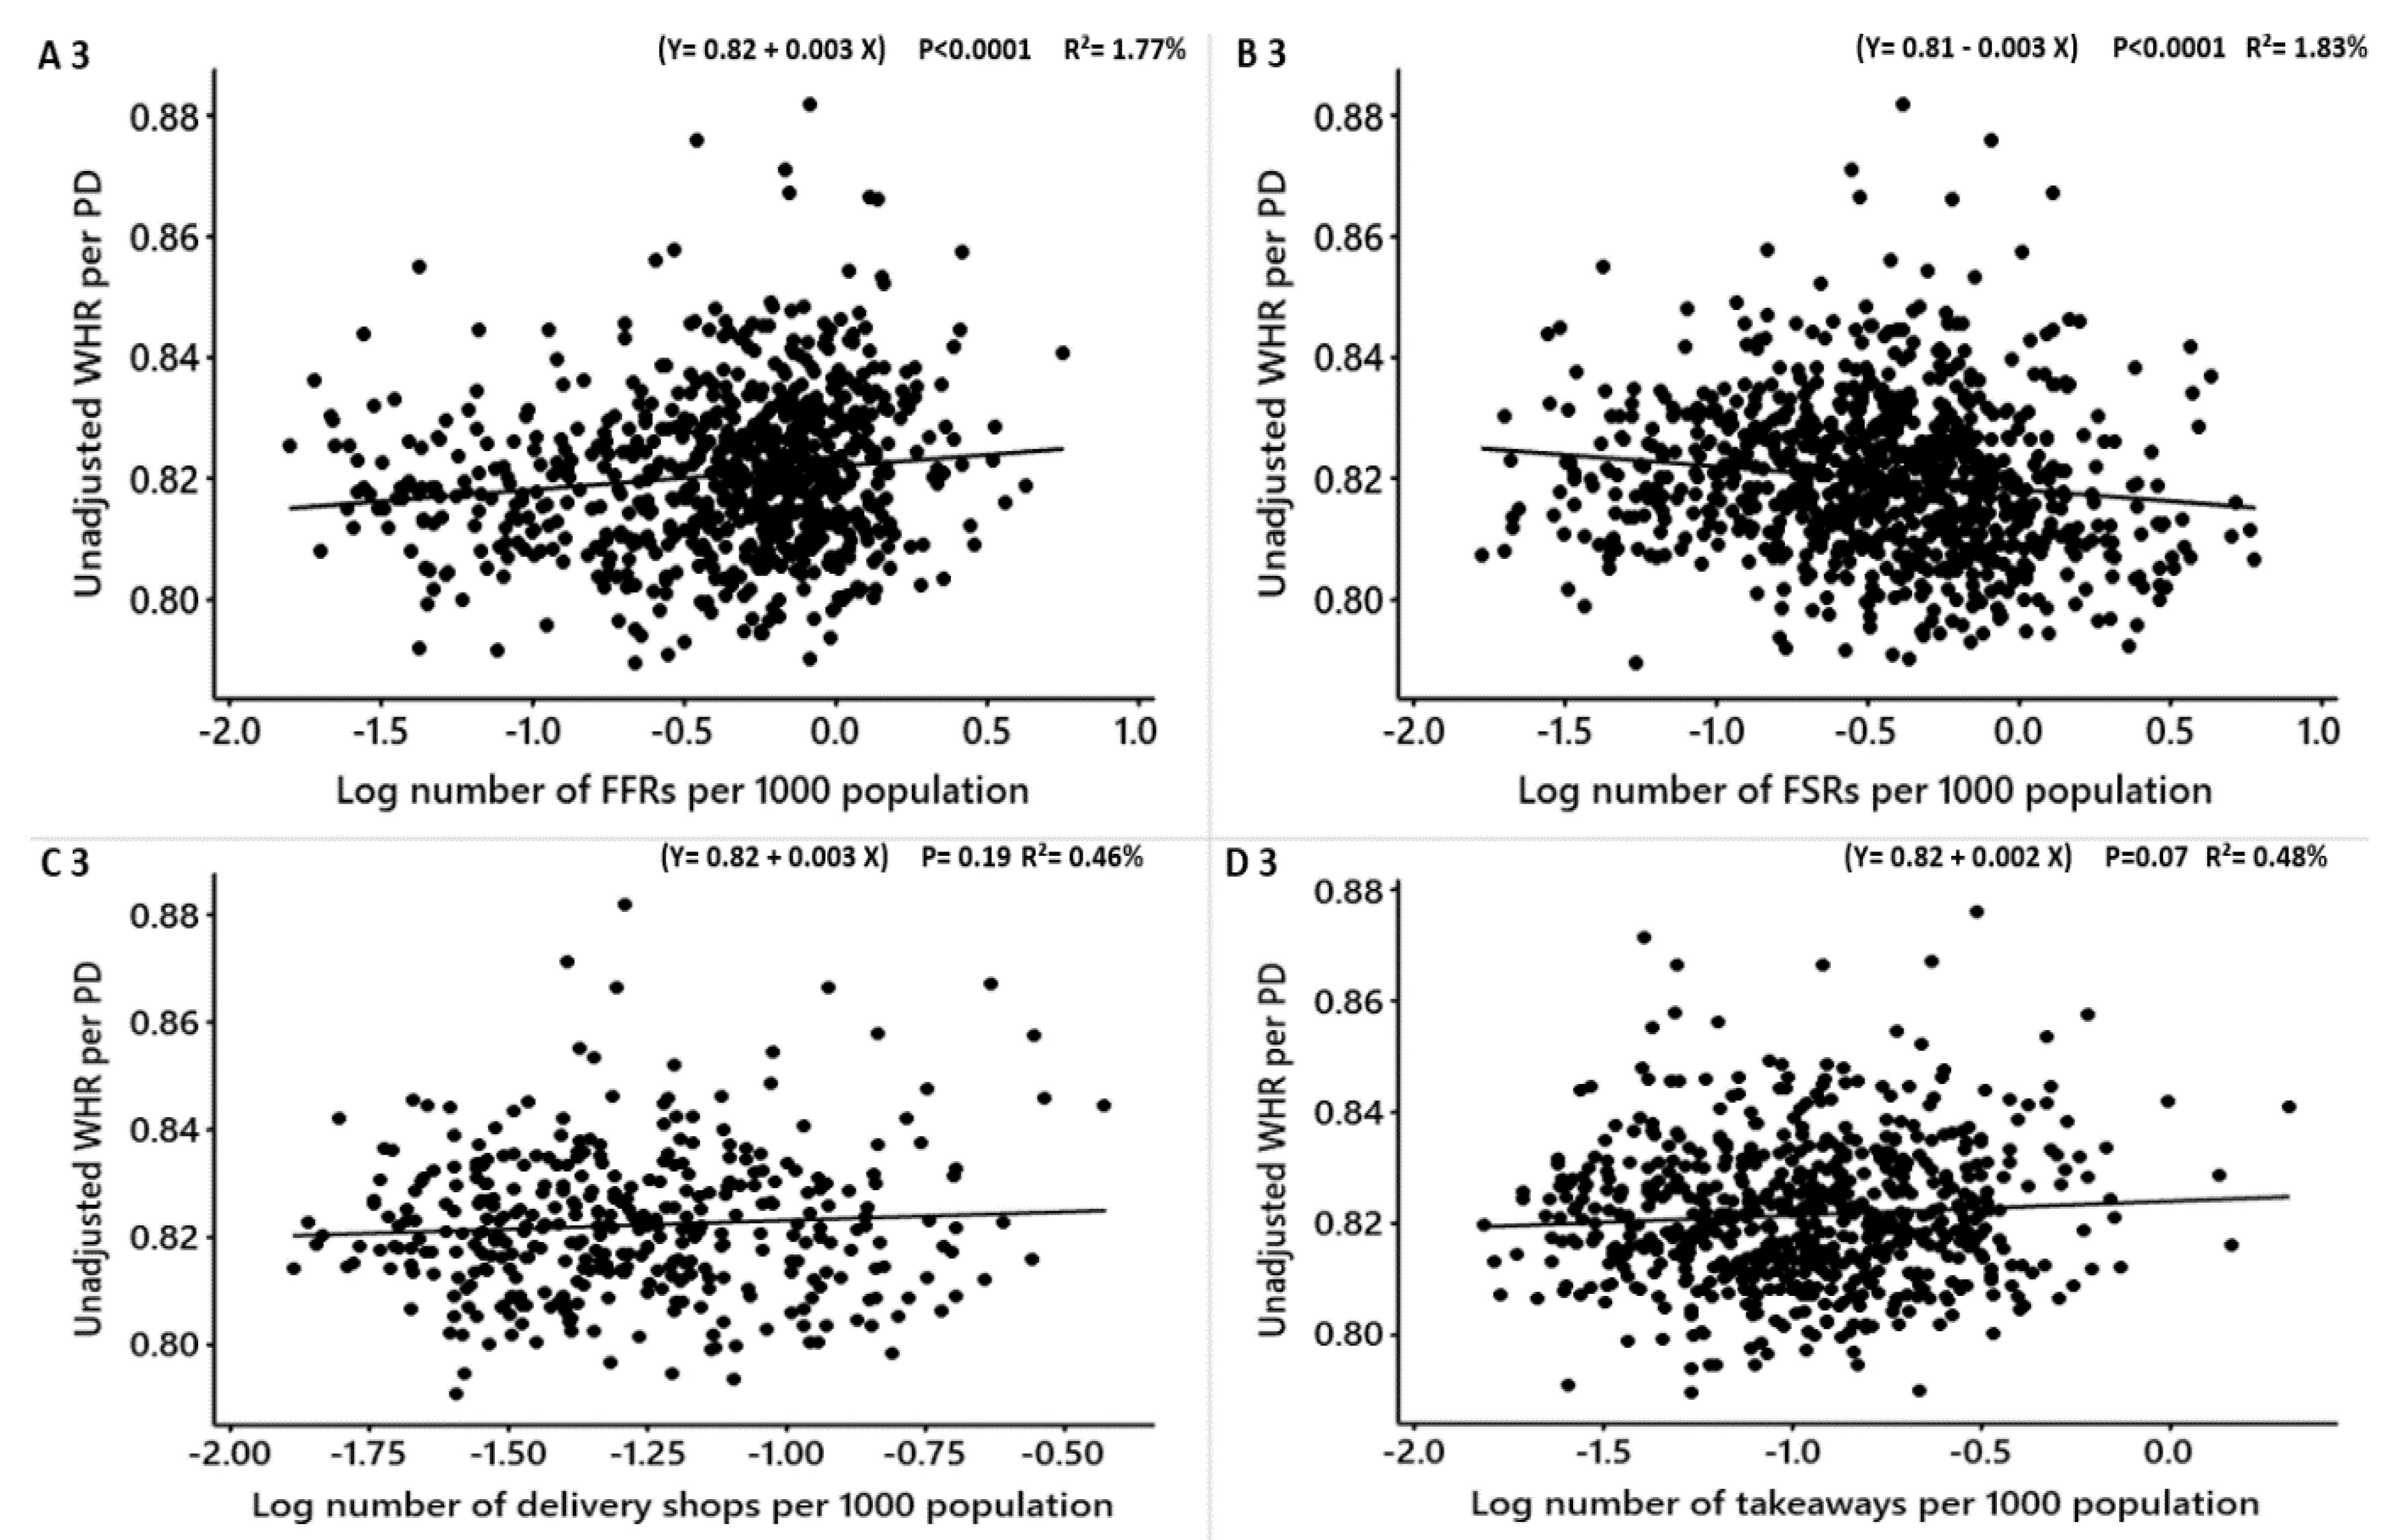
| Unadjusted mean WHR | FFRs | 0.004 | 0.003 | 0.001, 0.005 | 1.77 | 3.71 | <0.0001 | A 3 |
| FSRs | −0.003 | −0.002 | −0.005, −0.001 | 1.83 | −4.00 | <0.0001 | B 3 | |
| Delivery shops | 0.0032 | 0.003 | −0.001, 0.008 | 0.46 | 1.31 | 0.19 | C 3 | |
| Takeaways | 0.003 | 0.002 | −0.0002, 0.005 | 0.48 | 1.77 | 0.07 | D 3 | |
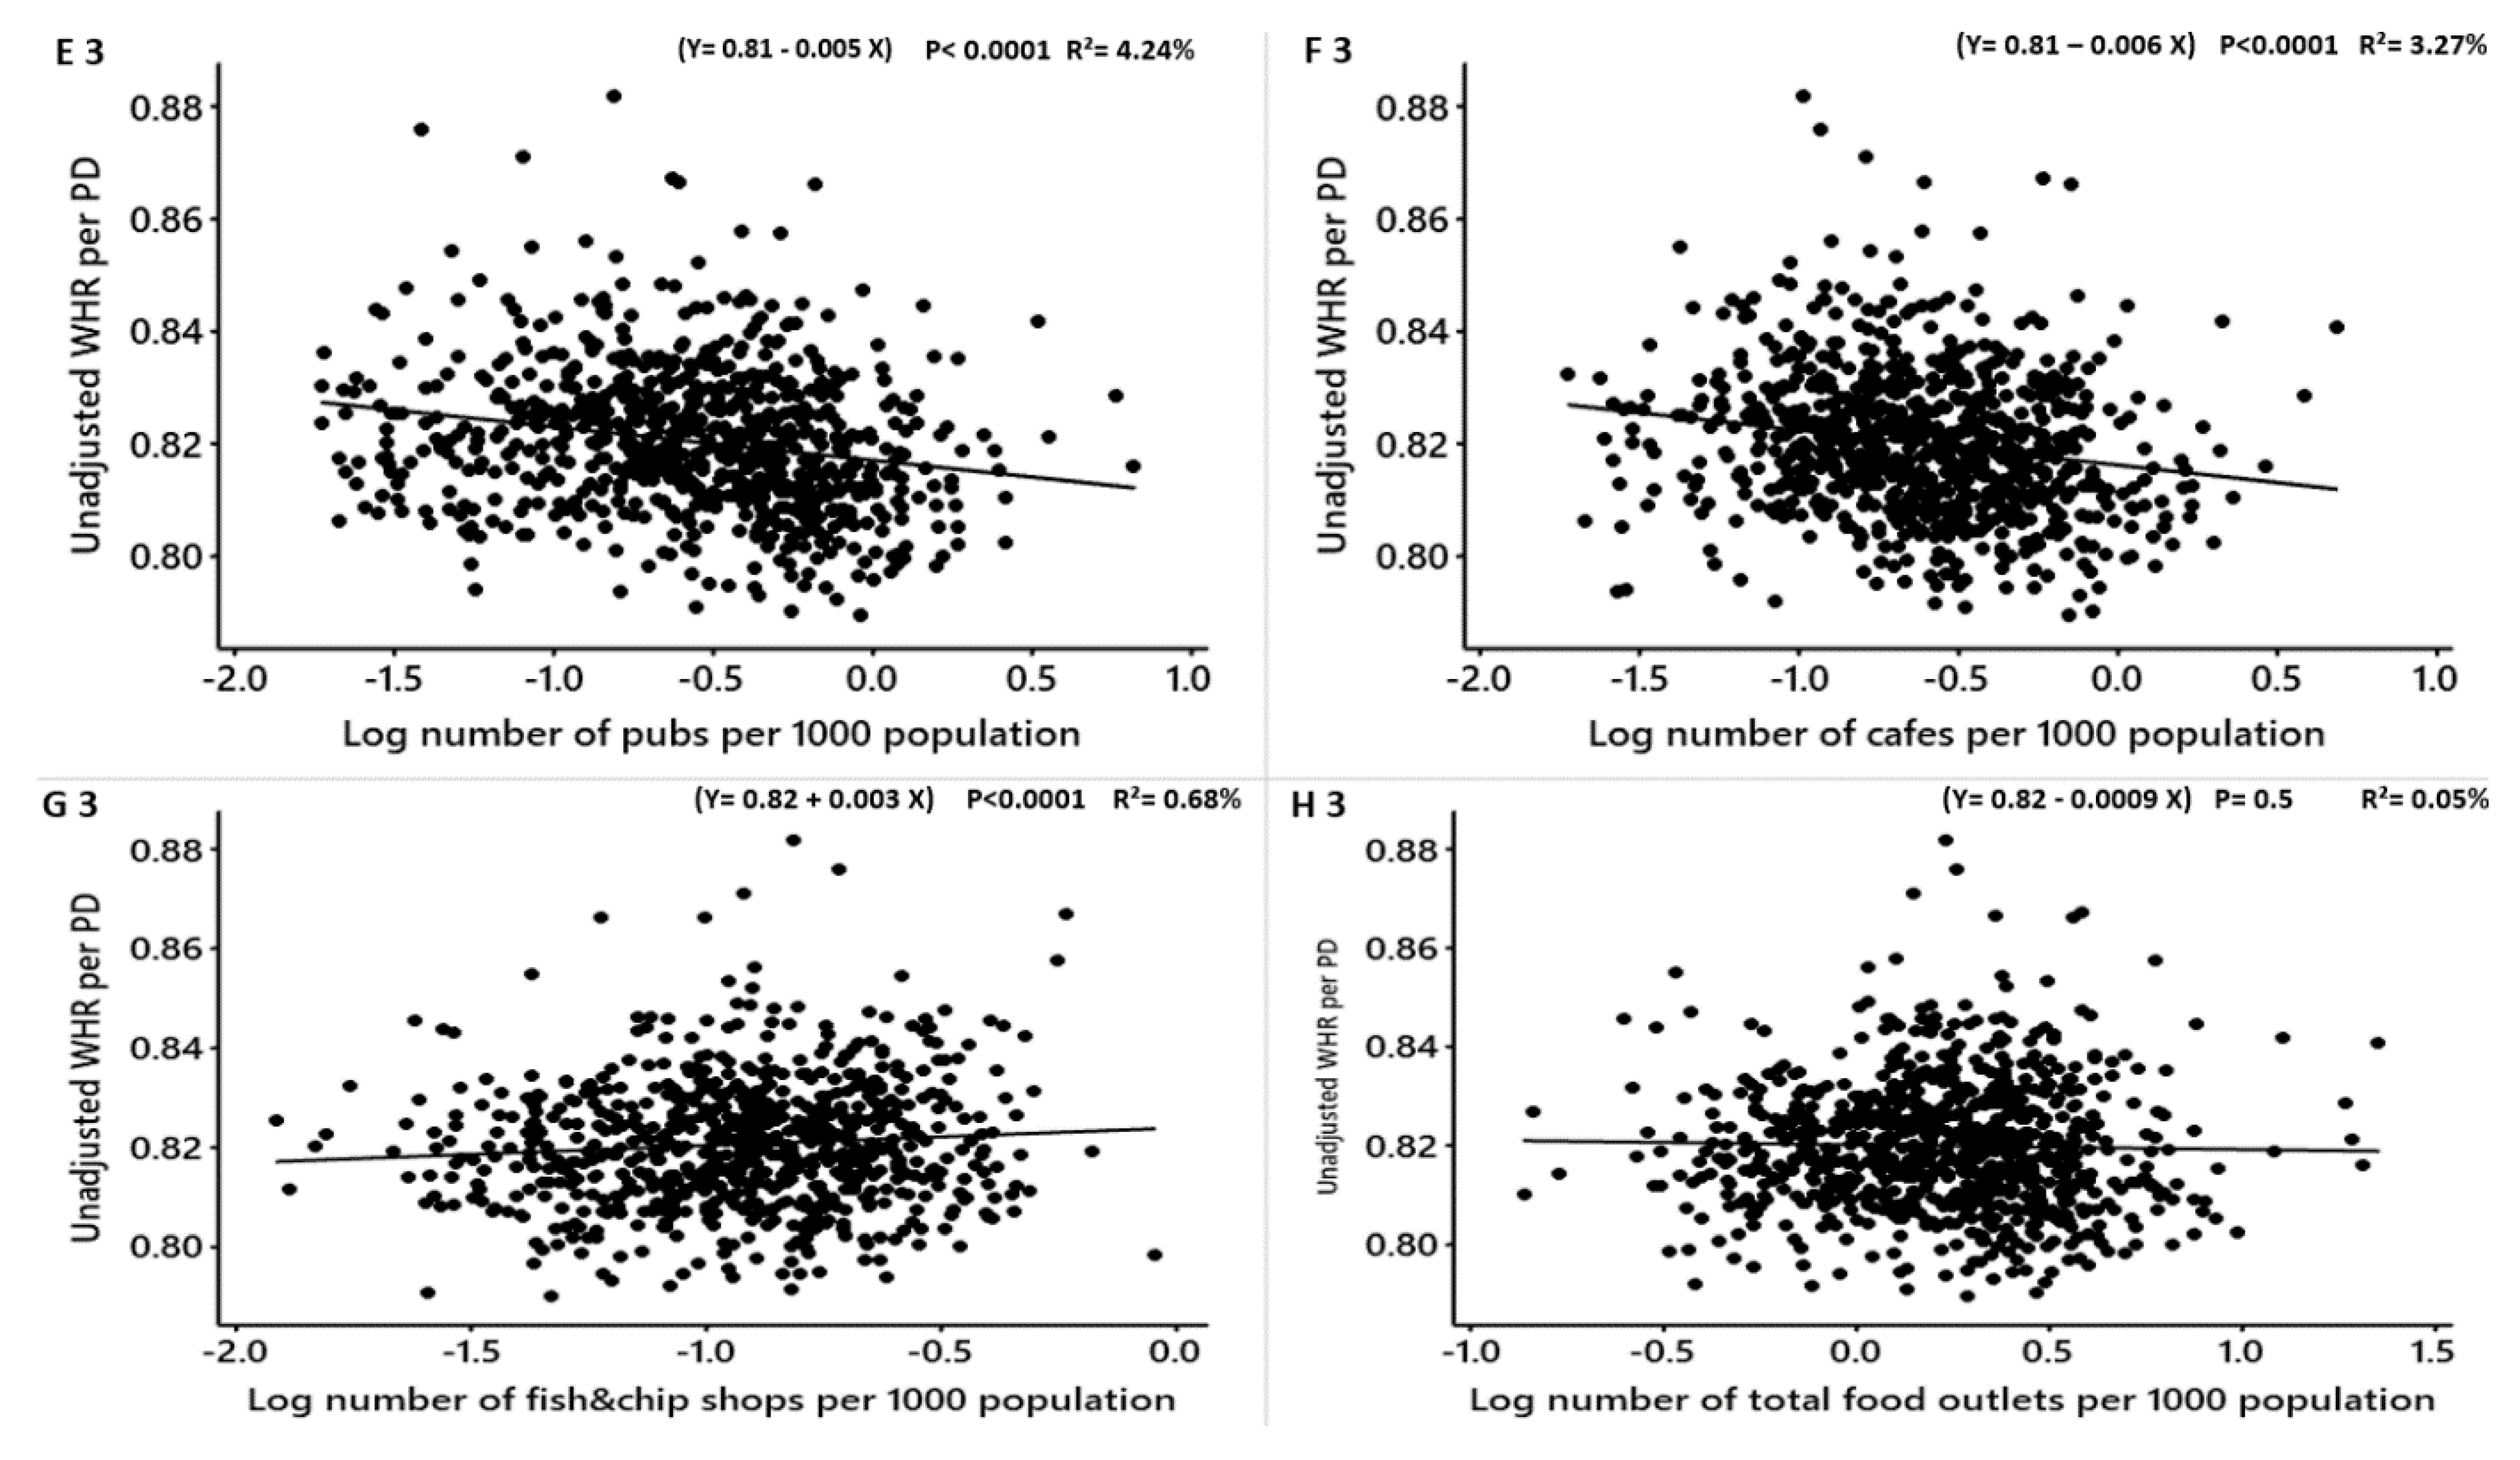
| Pubs | −0.005 | −0.004 | −0.008, −0.003 | 4.24 | −5.77 | <0.0001 | E 3 | |
| Cafes | −0.006 | −0.005 | −0.008, −0.003 | 3.27 | −5.22 | <0.0001 | F 3 | |
| Fish and chip shops | 0.004 | 0.003 | 0.0004, 0.006 | 0.68 | 2.26 | 0.02 | G 3 | |
| Total food outlets (combined) | −0.0009 | −0.0008 | −0.003, 0.001 | 0.05 | −0.68 | 0.50 | H 3 |
| Obesity Measure | Food Outlet Type | β | Converted β | 99% CI | R2 (%) | t | Adjusted P-Value | Figure 3 |
|---|---|---|---|---|---|---|---|---|
| Adjusted mean BMI | FFRs | −0.15 | −0.13 | −0.26, −0.05 | 1.18 | −3.01 | <0.003 | A 1 |
| FSRs | −0.22 | −0.19 | −0.32, −0.13 | 2.57 | −4.74 | <0.0001 | B 1 | |
| Delivery shops | 0.10 | 0.105 | −0.11, 0.33 | 0.24 | 0.95 | 0.34 | C 1 | |
| Takeaways | −0.31 | −0.26 | −0.46, −0.17 | 2.74 | −4.25 | <0.0001 | D 1 | |
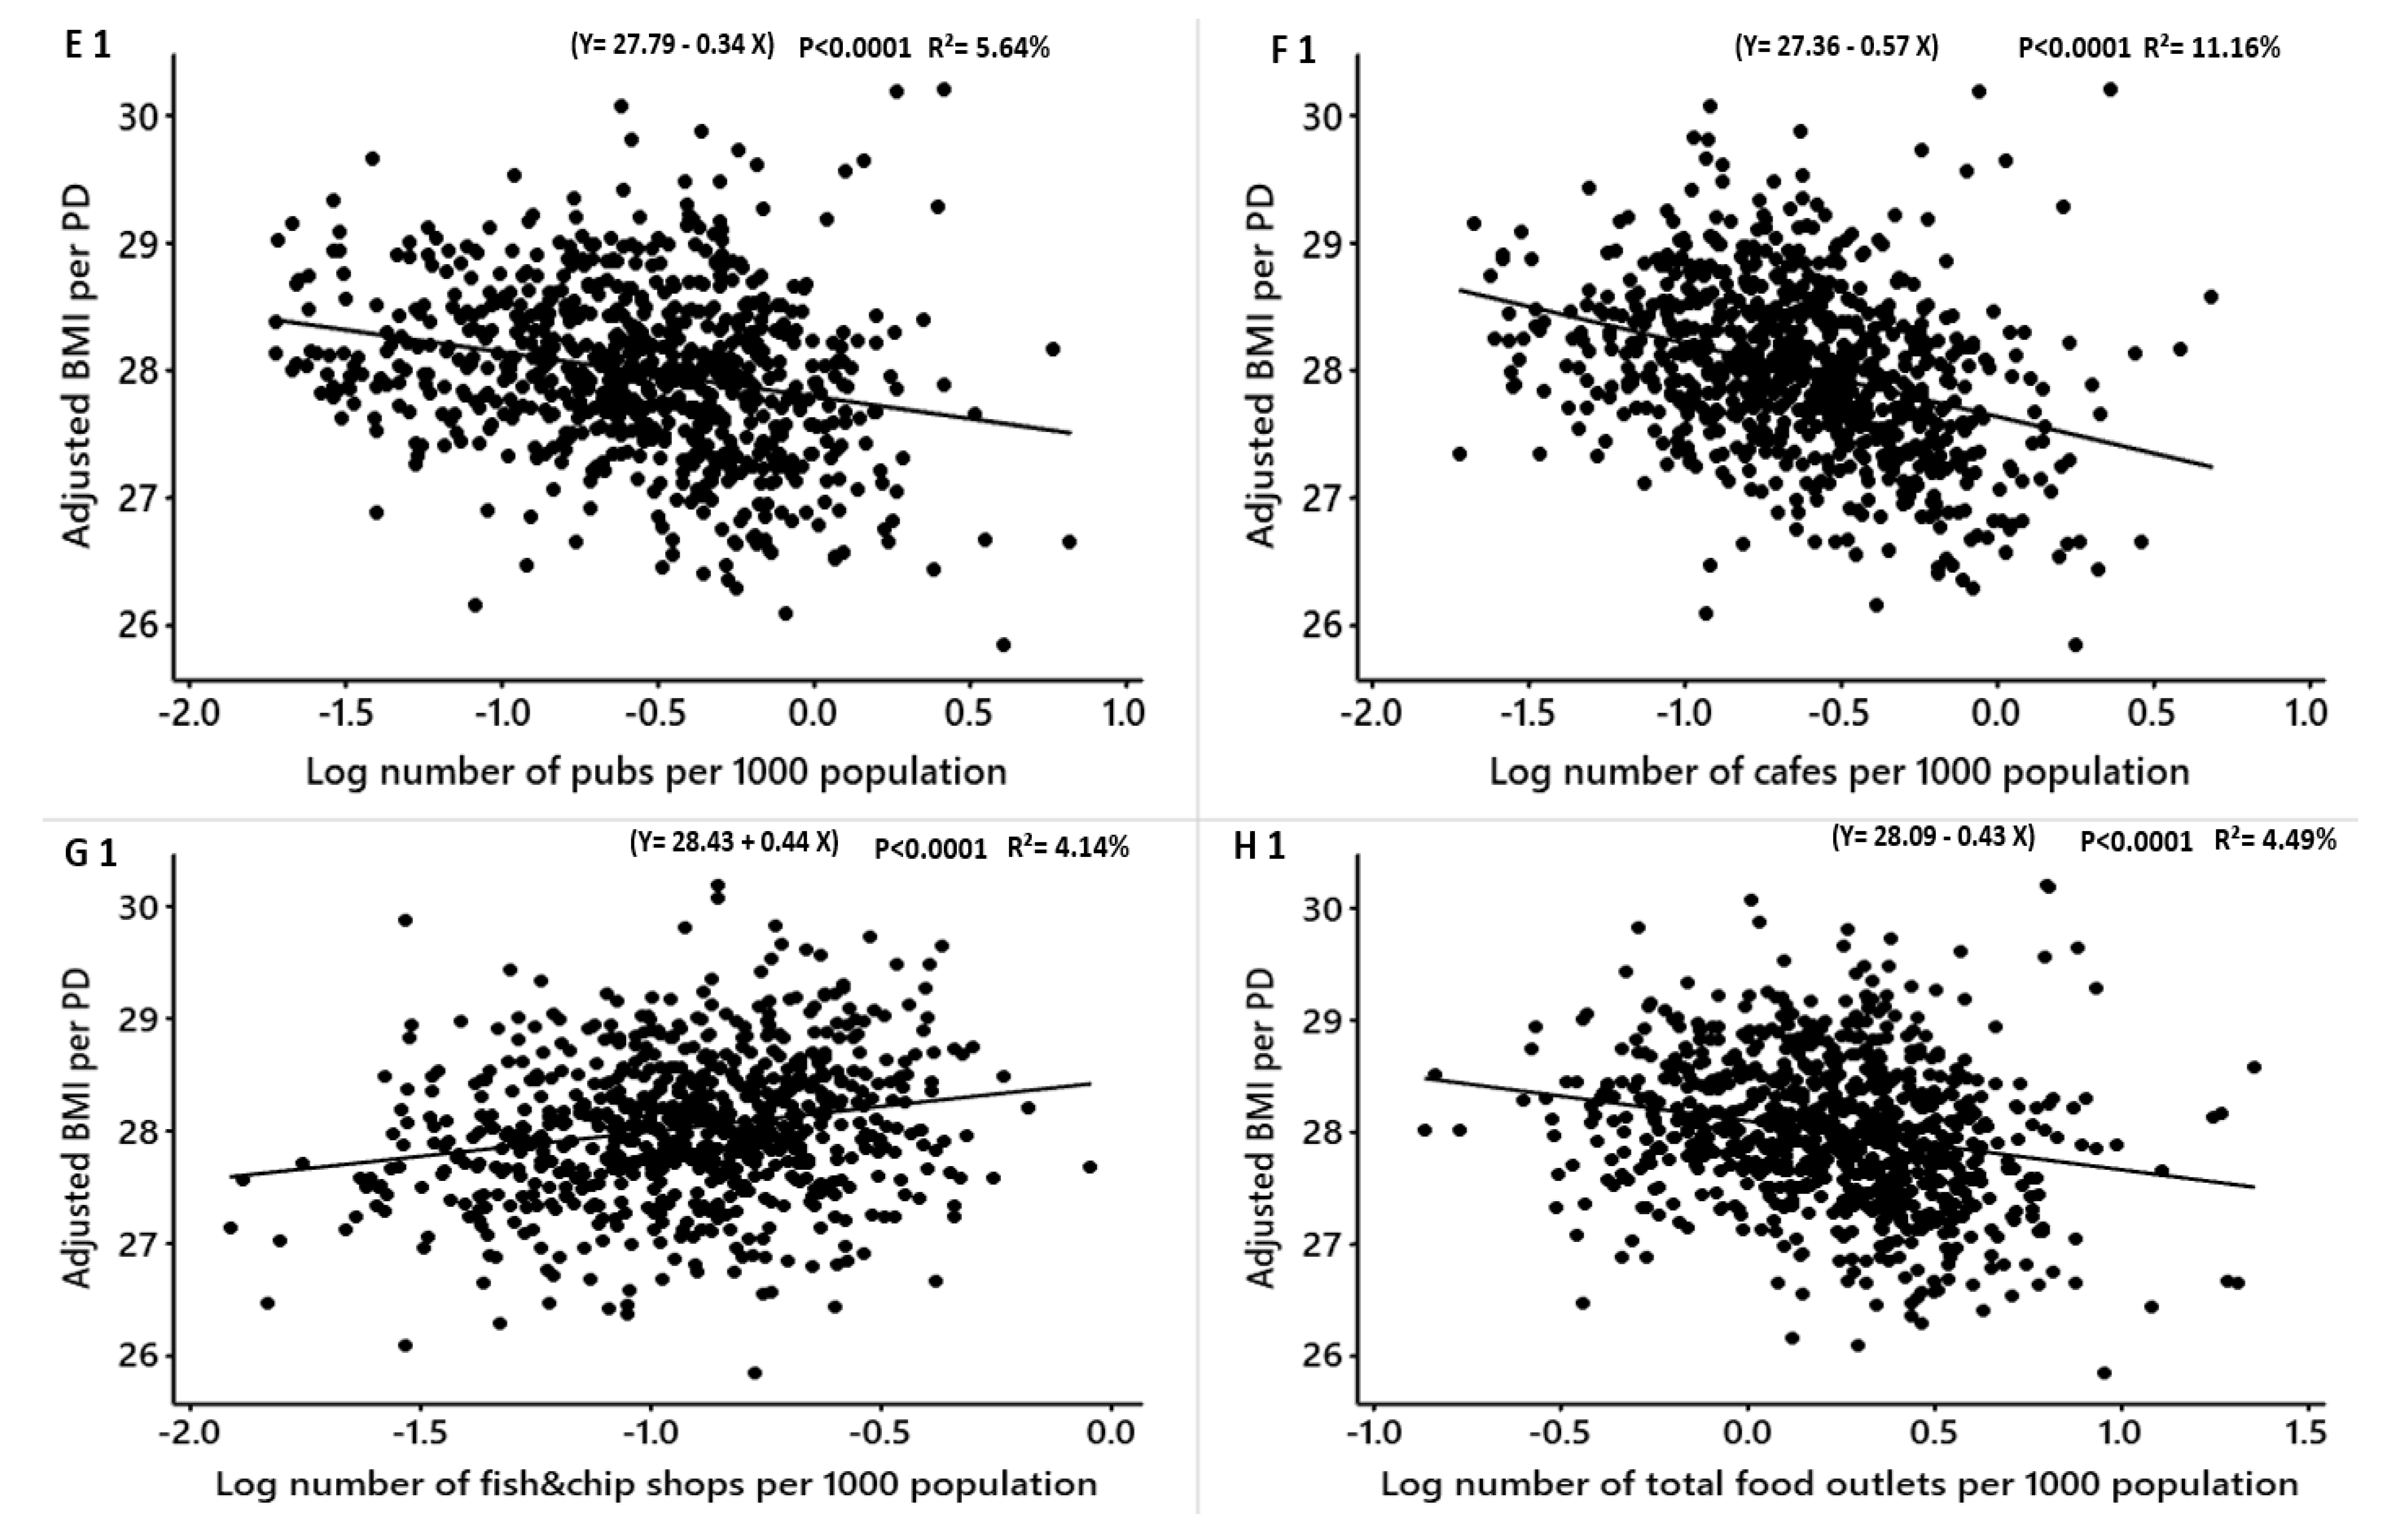
| Pubs | −0.34 | −0.28 | −0.45, −0.24 | 5.64 | −6.68 | <0.0001 | E 1 | |
| Cafes | −0.57 | −0.43 | −0.69, −0.46 | 11.16 | −10.04 | <0.0001 | F 1 | |
| Fish and chip shops | 0.44 | 0.55 | 0.28, 0.59 | 4.14 | 5.68 | <0.0001 | G 1 | |
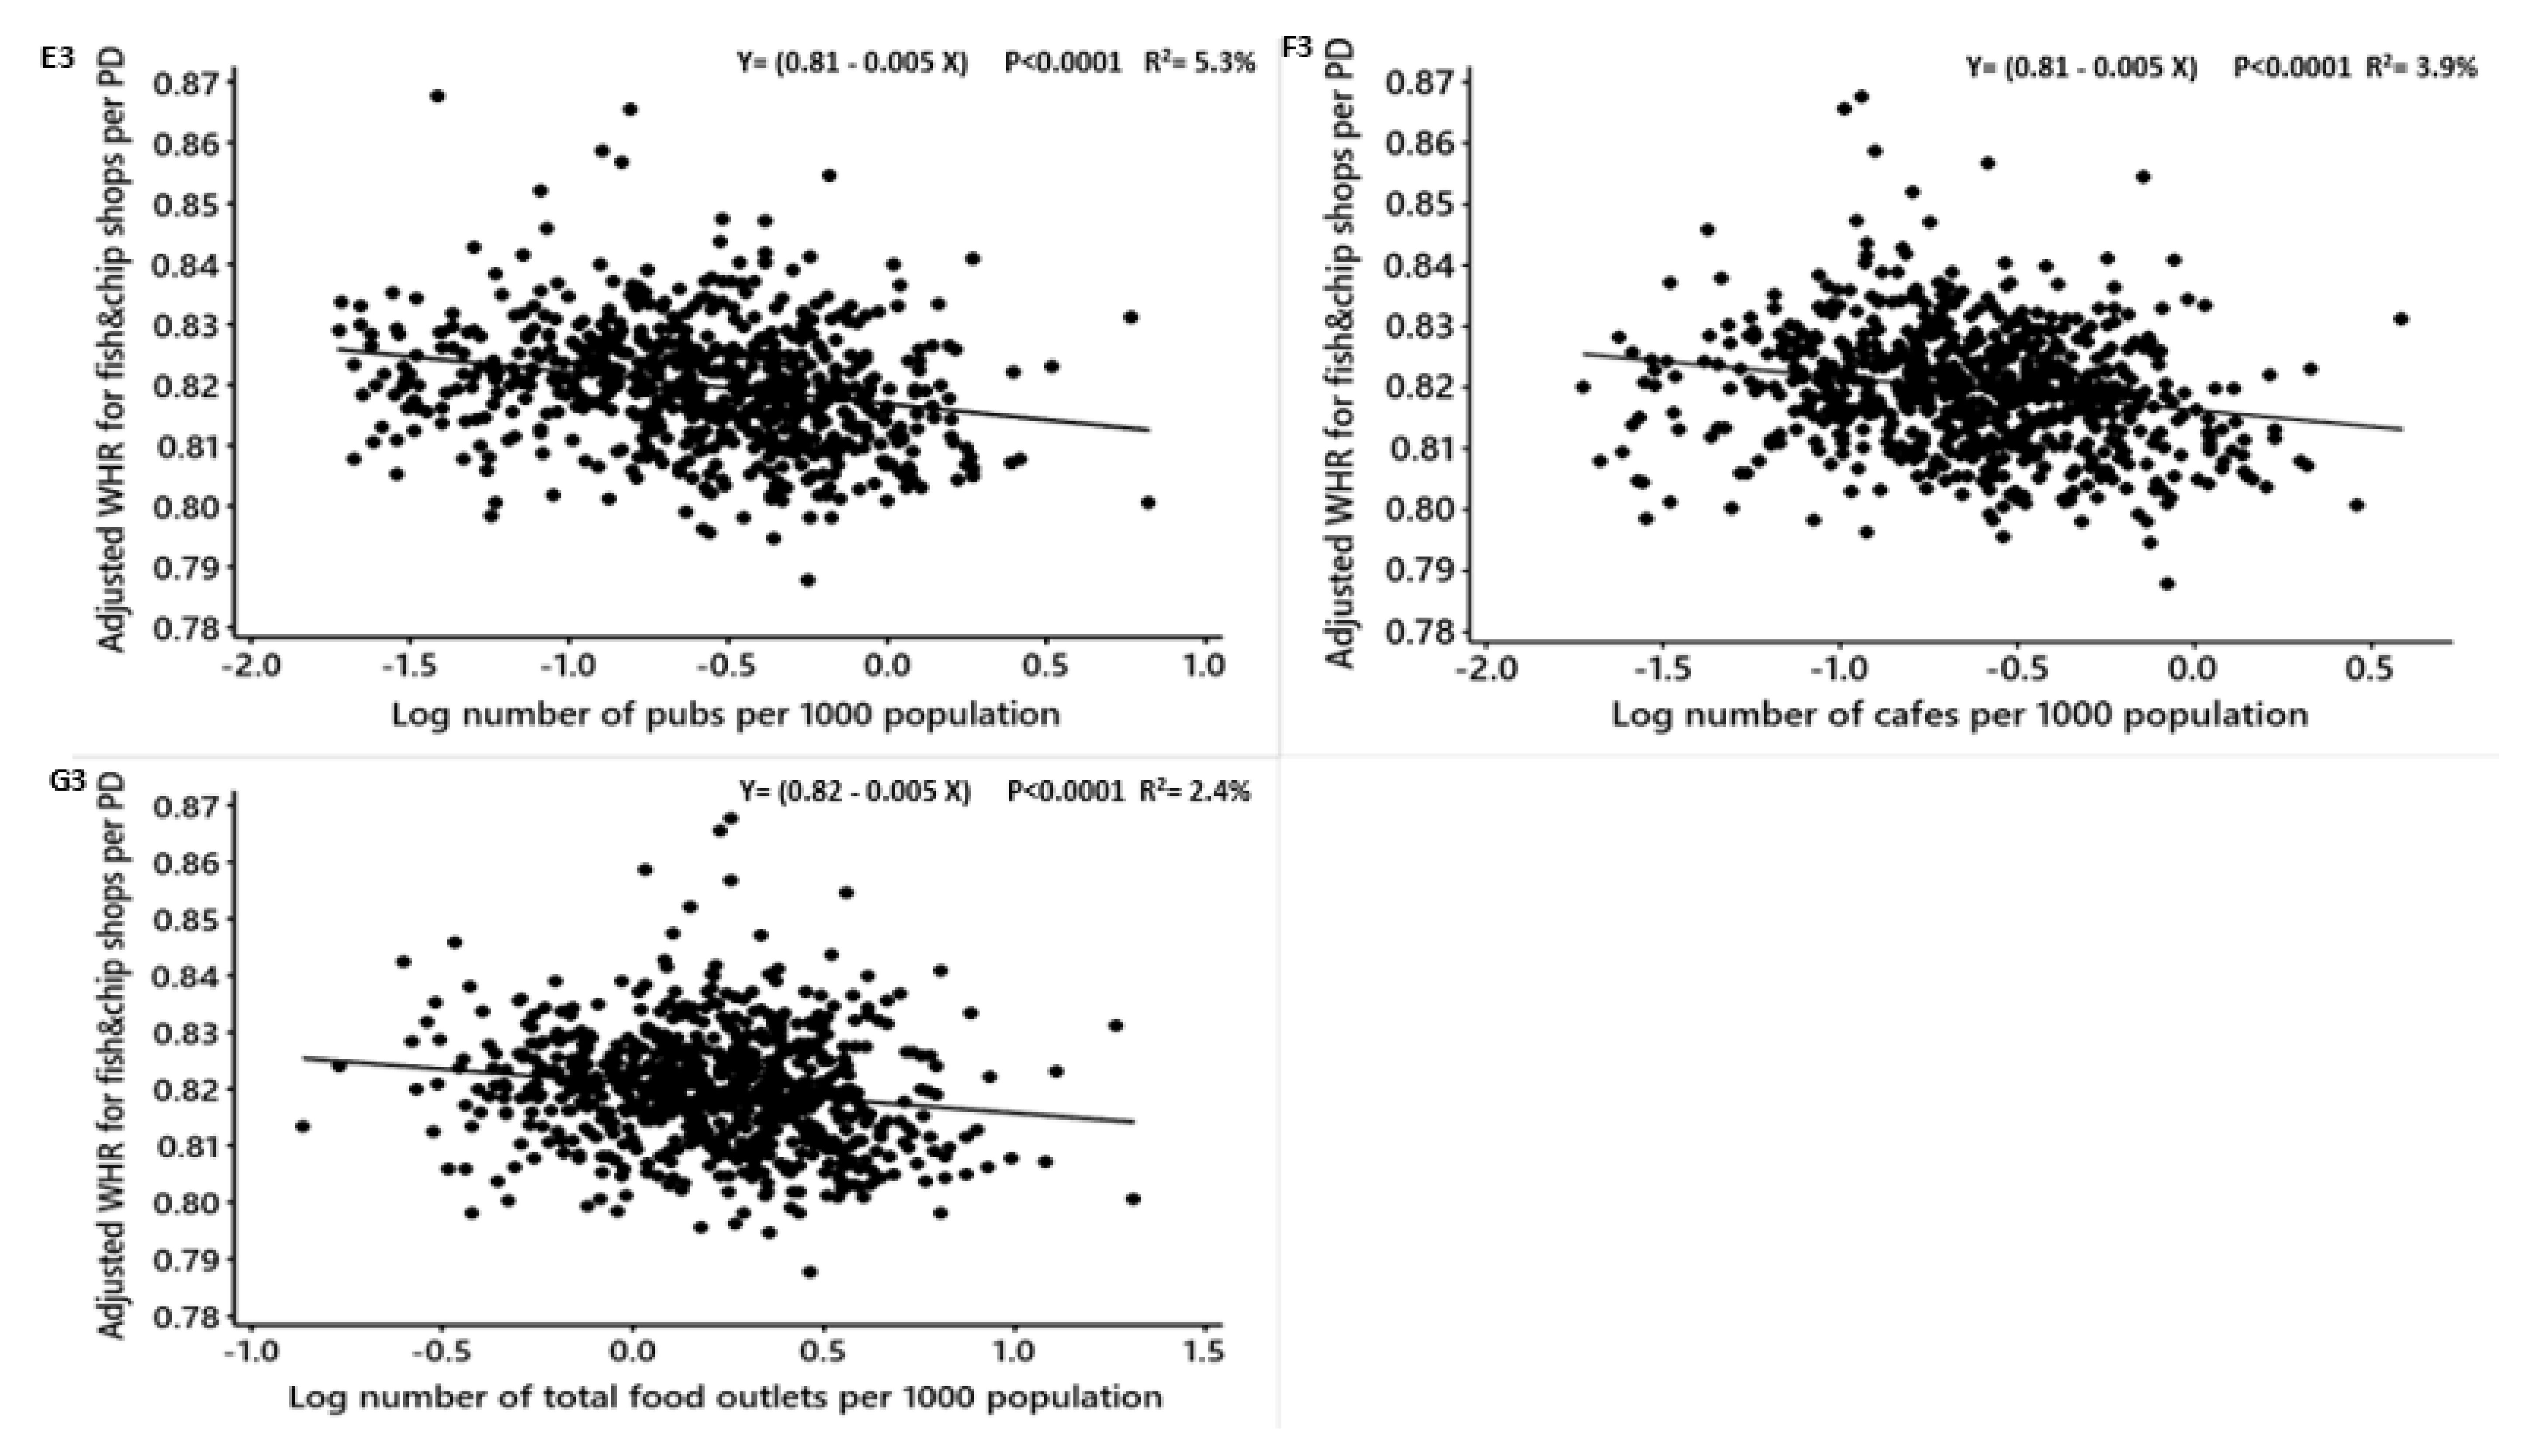
| Total food outlets (combined) | −0.43 | −0.34 | −0.57, −0.30 | 4.49 | −6.33 | <0.0001 | H 1 | |
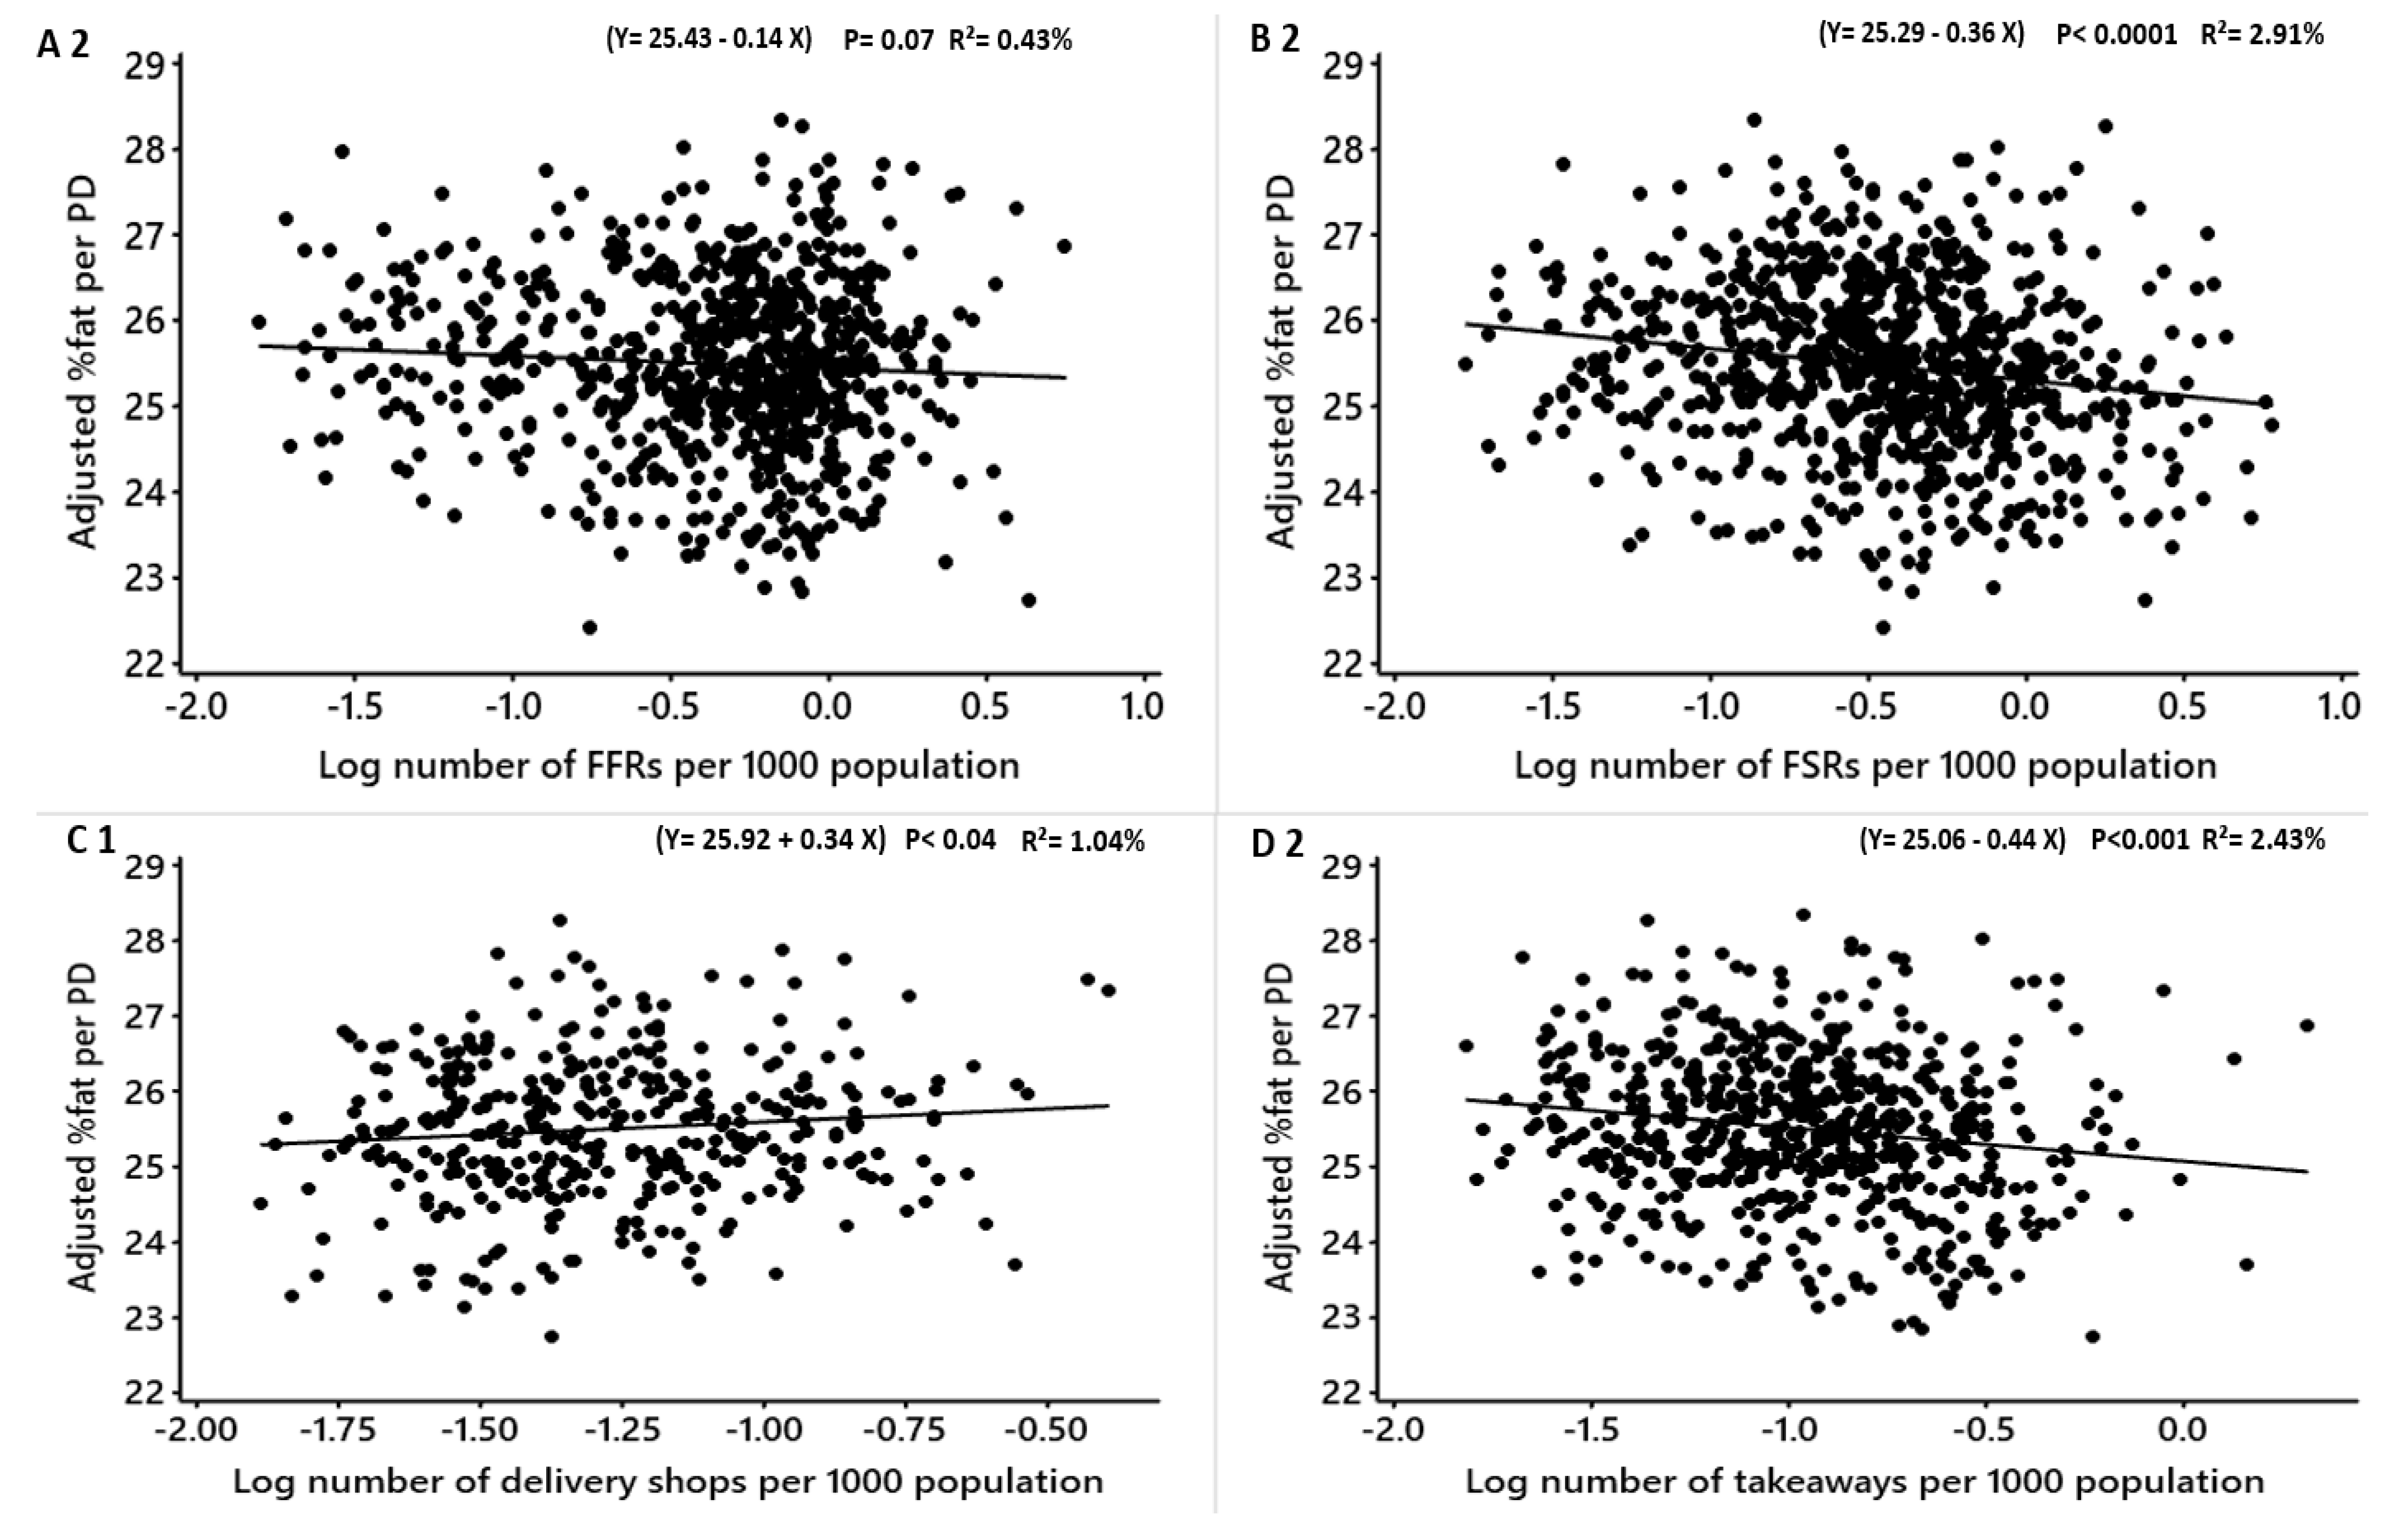
| Adjusted mean %fat | FFRs | −0.14 | −0.13 | −0.30, 0.01 | 0.43 | −1.82 | 0.07 | A 2 |
| FSRs | −0.36 | −0.30 | −0.51, −0.22 | 2.91 | −5.06 | <0.0001 | B 2 | |
| Delivery shops | 0.34 | 0.40 | 0.002, 0.67 | 1.04 | 1.98 | 0.04 | C 2 | |
| Takeaways | −0.44 | −0.35 | −0.66, −0.22 | 2.43 | −4.00 | <0.0001 | D 2 | |
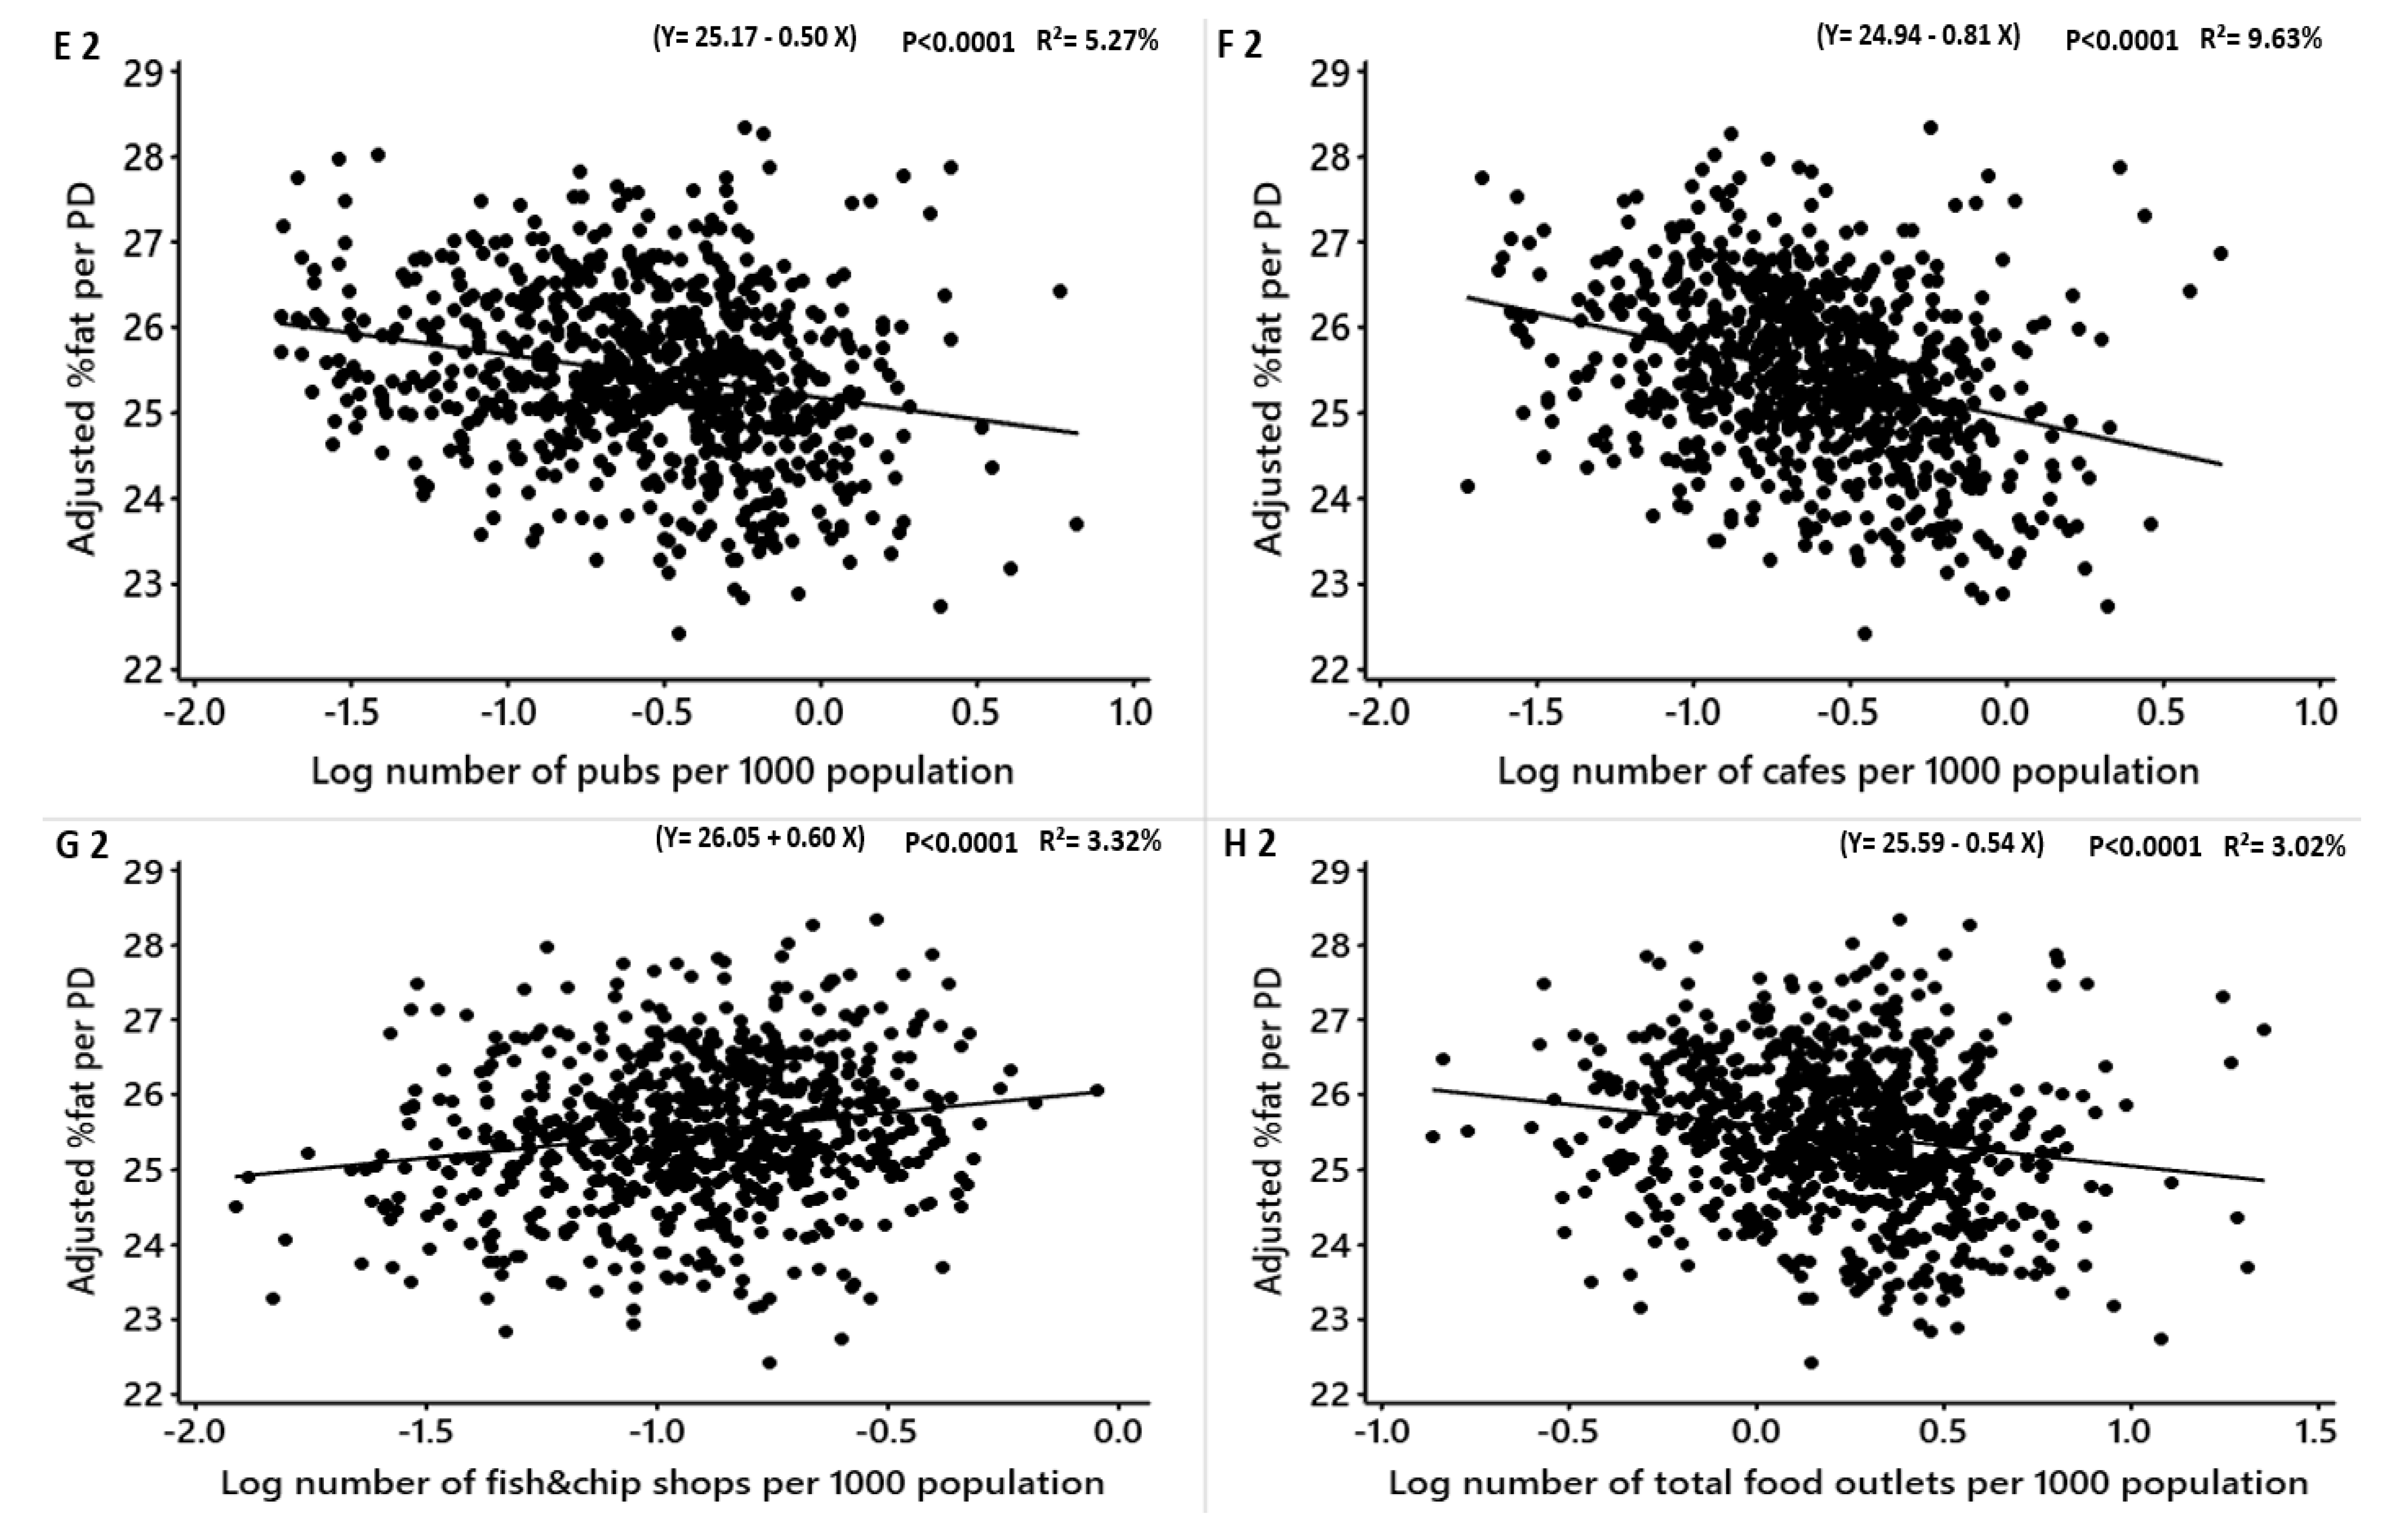
| Pubs | −0.50 | −0.39 | −0.66, −0.35 | 5.27 | −6.45 | <0.0001 | E 2 | |
| Cafes | −0.81 | −0.55 | −0.98, −0.64 | 9.63 | −9.24 | <0.0001 | F 2 | |
| Fish and chip shops | 0.60 | 0.82 | 0.36, 0.83 | 3.32 | 5.07 | <0.0001 | G 2 | |
| Total food outlets (combined) | −0.54 | −0.41 | −0.75, −0.33 | 3.02 | −5.15 | <0.0001 | H 2 | |
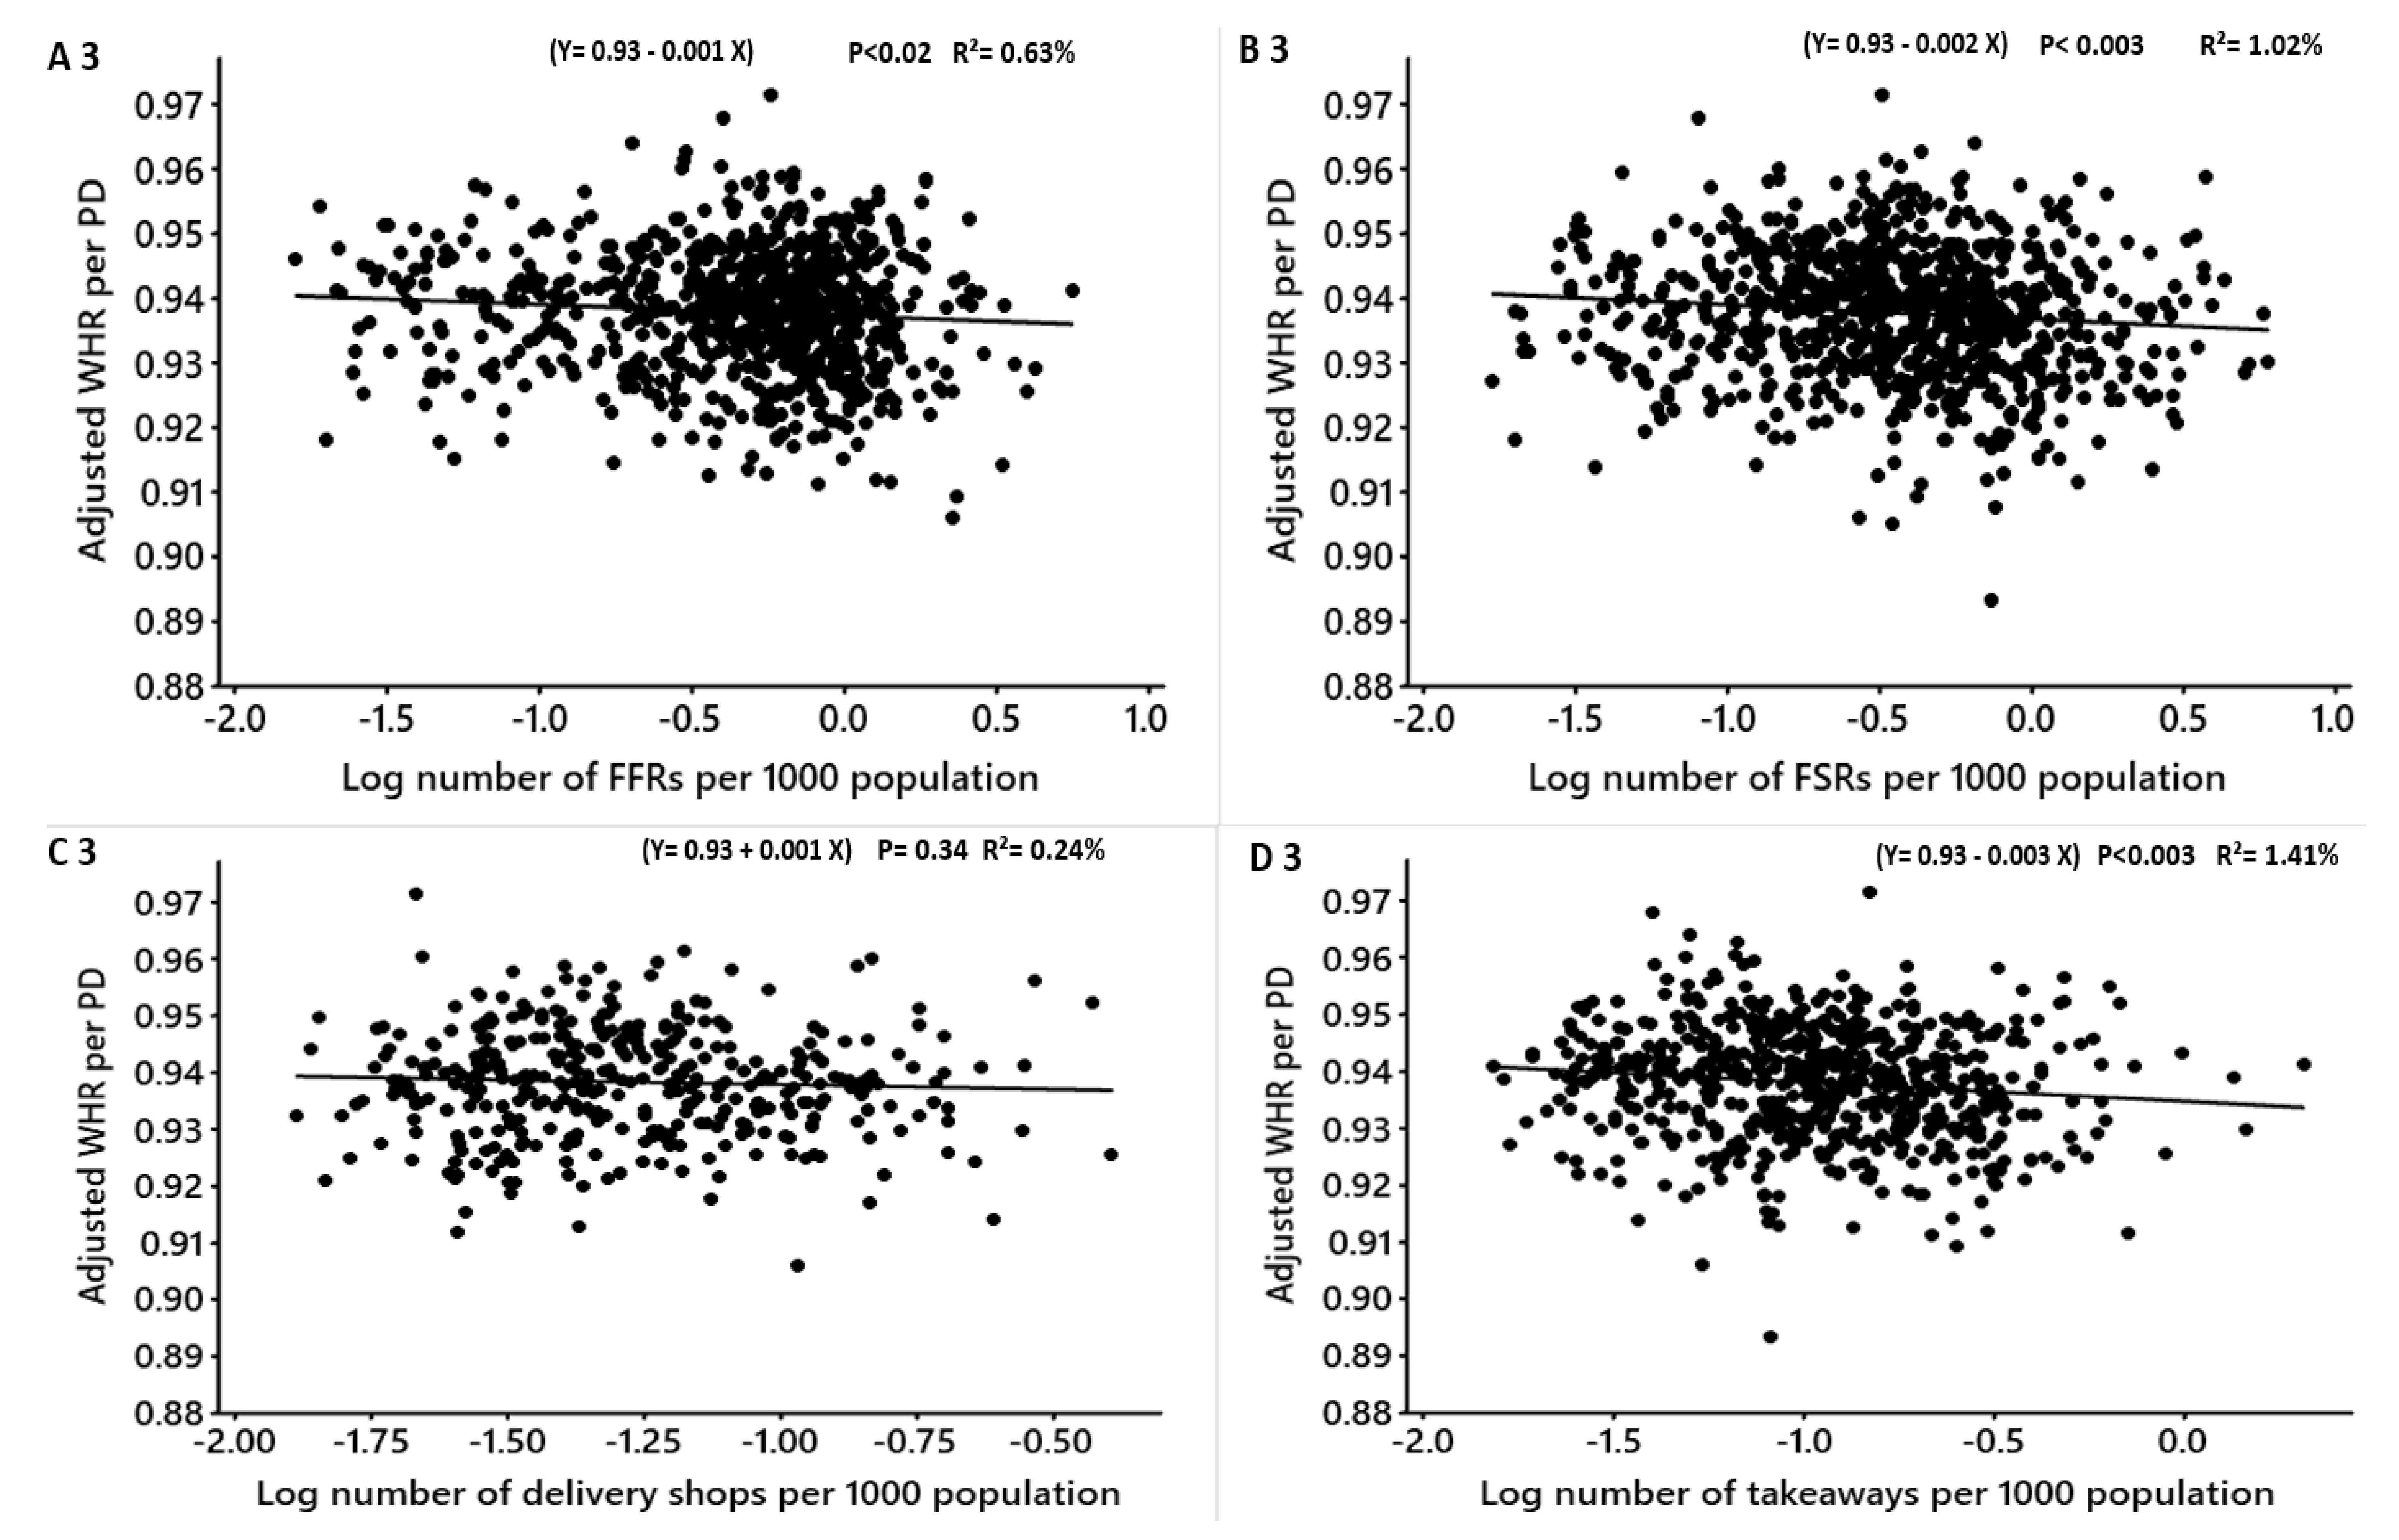
| Adjusted mean WHR | FFRs | −0.001 | −0.0009 | −0.003, −0.0001 | 0.63 | −2.19 | 0.02 | A 3 |
| FSRs | −0.002 | −0.001 | −0.003, −0.0007 | 1.02 | −2.96 | <0.003 | B 3 | |
| Delivery shops | −0.001 | −0.0009 | −0.005, 0.001 | 0.24 | −0.95 | 0.34 | C 3 | |
| Takeaways | −0.003 | −0.002 | −0.005, −0.001 | 1.41 | −3.03 | <0.003 | D 3 | |
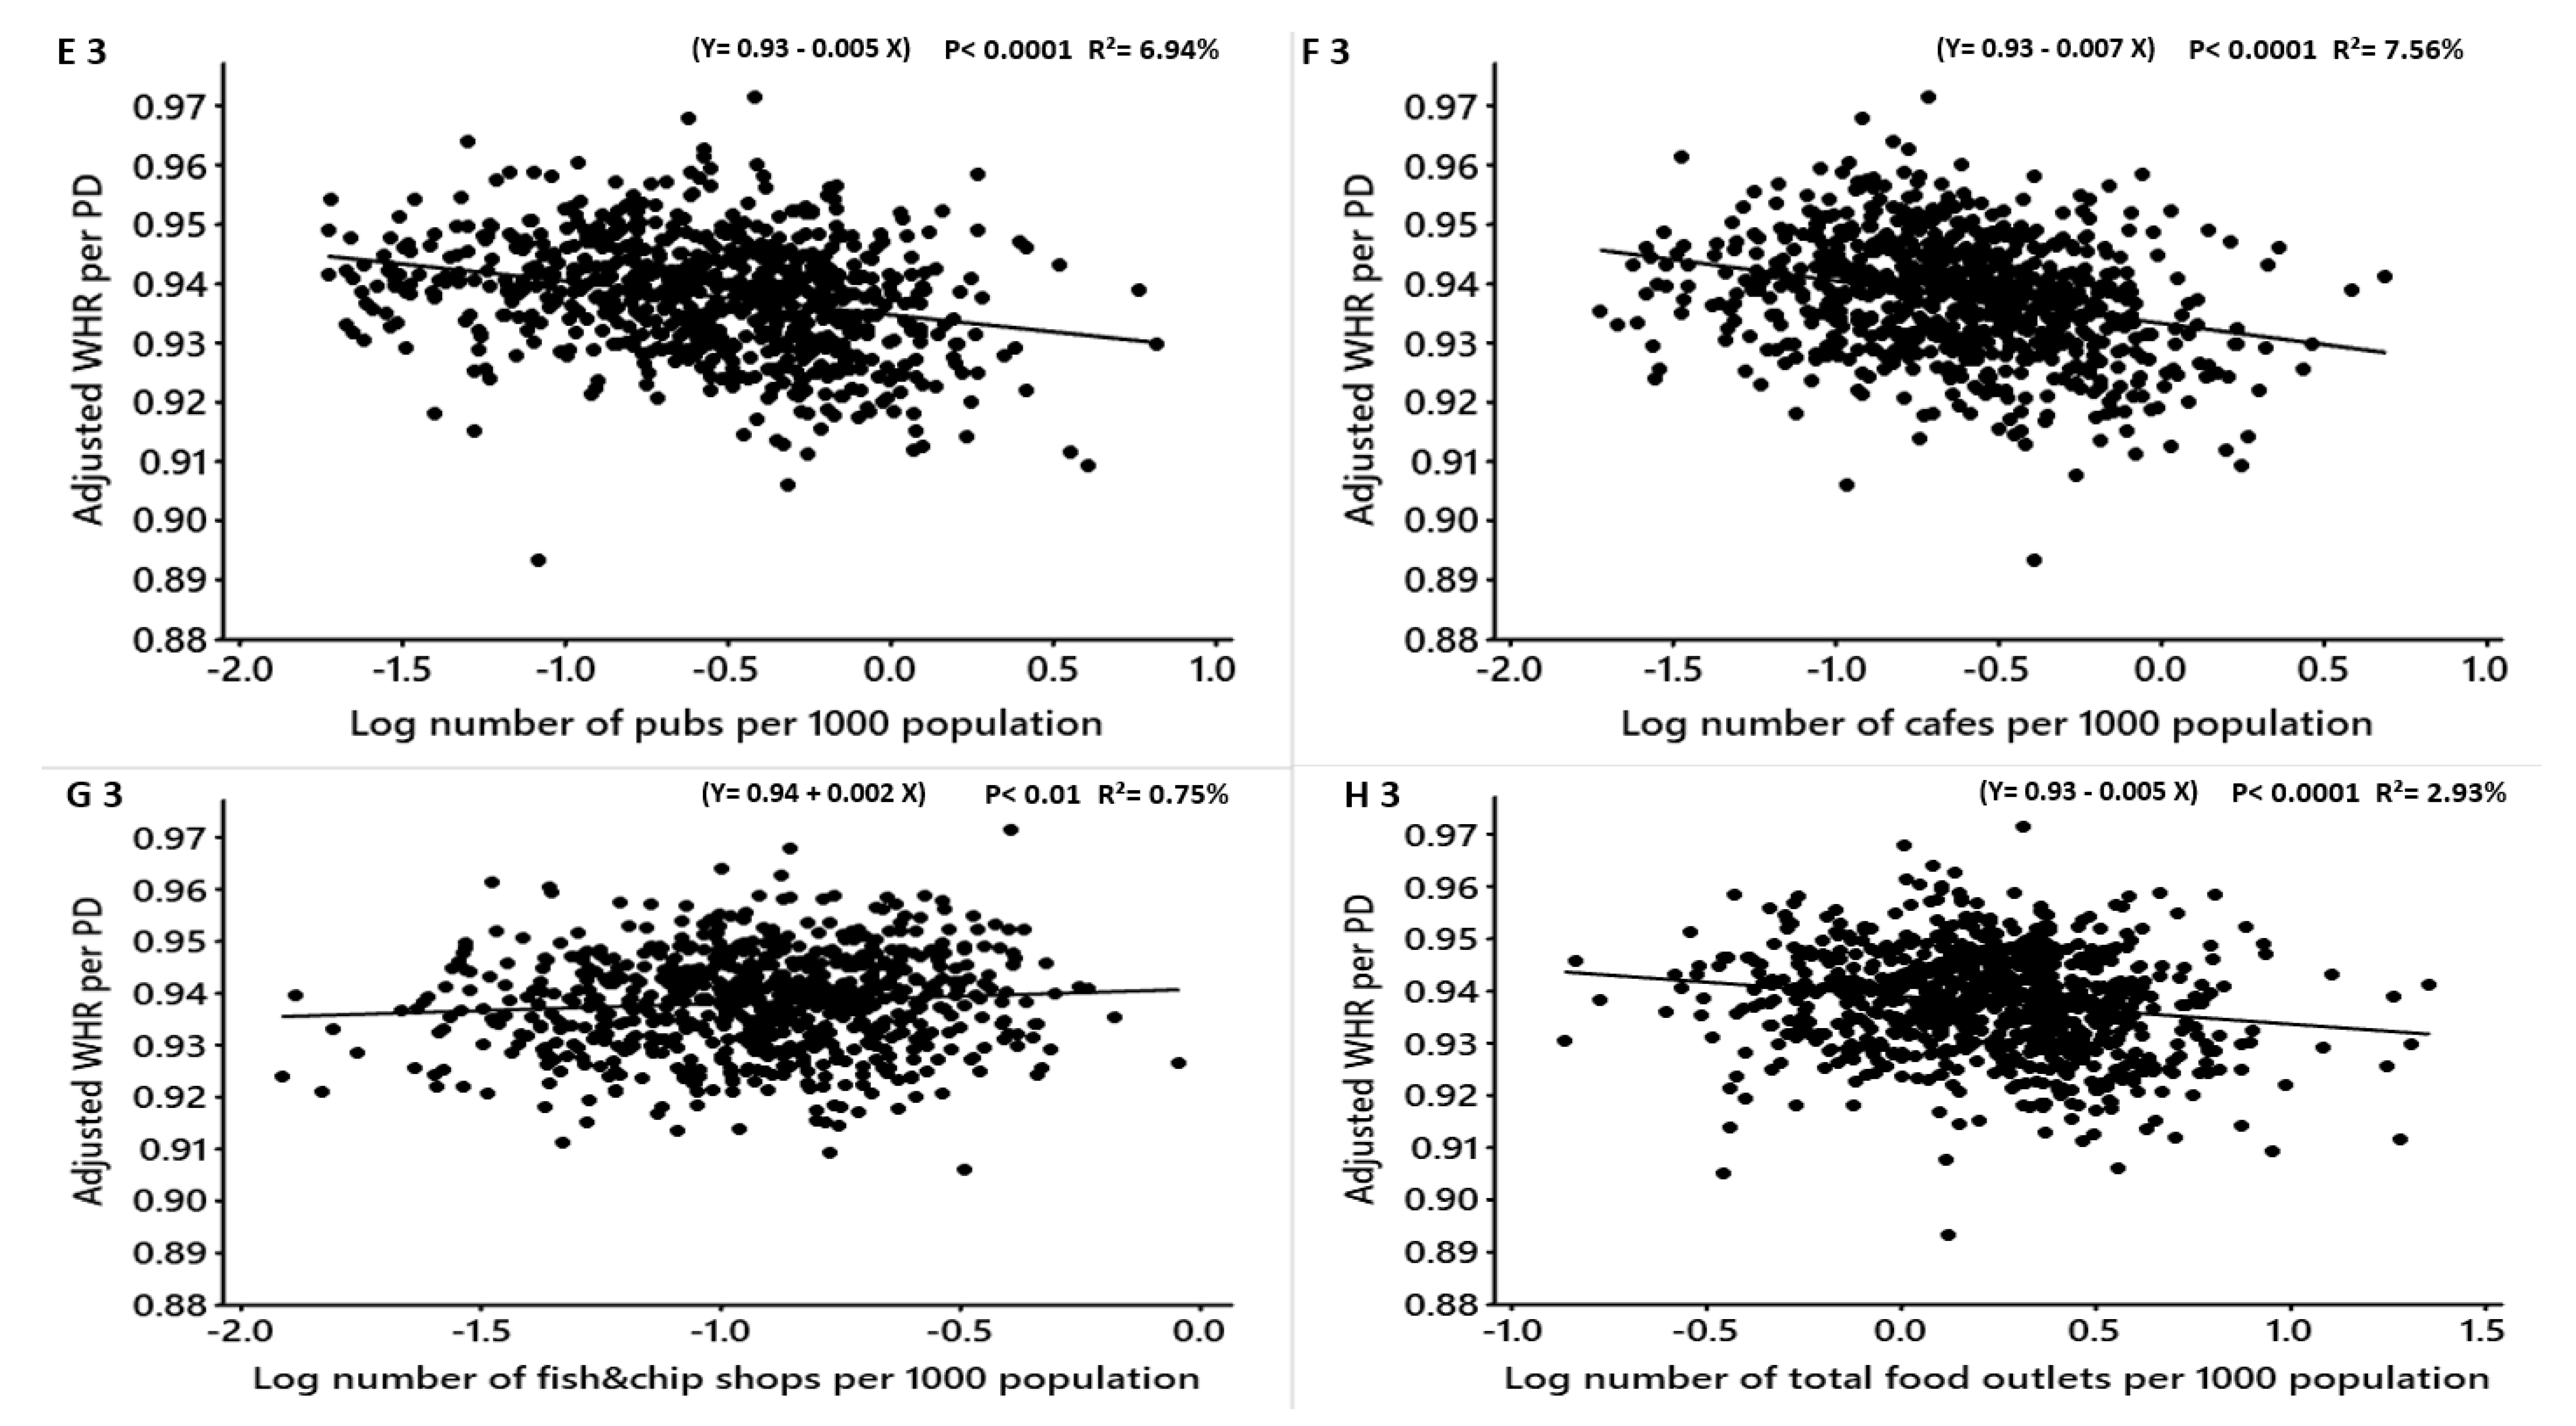
| Pubs | −0.005 | −0.004 | −0.007, −0.004 | 6.94 | −7.46 | <0.0001 | E 3 | |
| Cafes | −0.007 | −0.006 | −0.008, −0.005 | 7.56 | −8.10 | <0.0001 | F 3 | |
| Fish and chip shops | 0.003 | 0.002 | 0.0004, 0.005 | 0.75 | 2.38 | 0.01 | G 3 | |
| Total food outlets (combined) | −0.005 | −0.004 | −0.007, −0.003 | 2.93 | −5.07 | <0.0001 | H 3 |
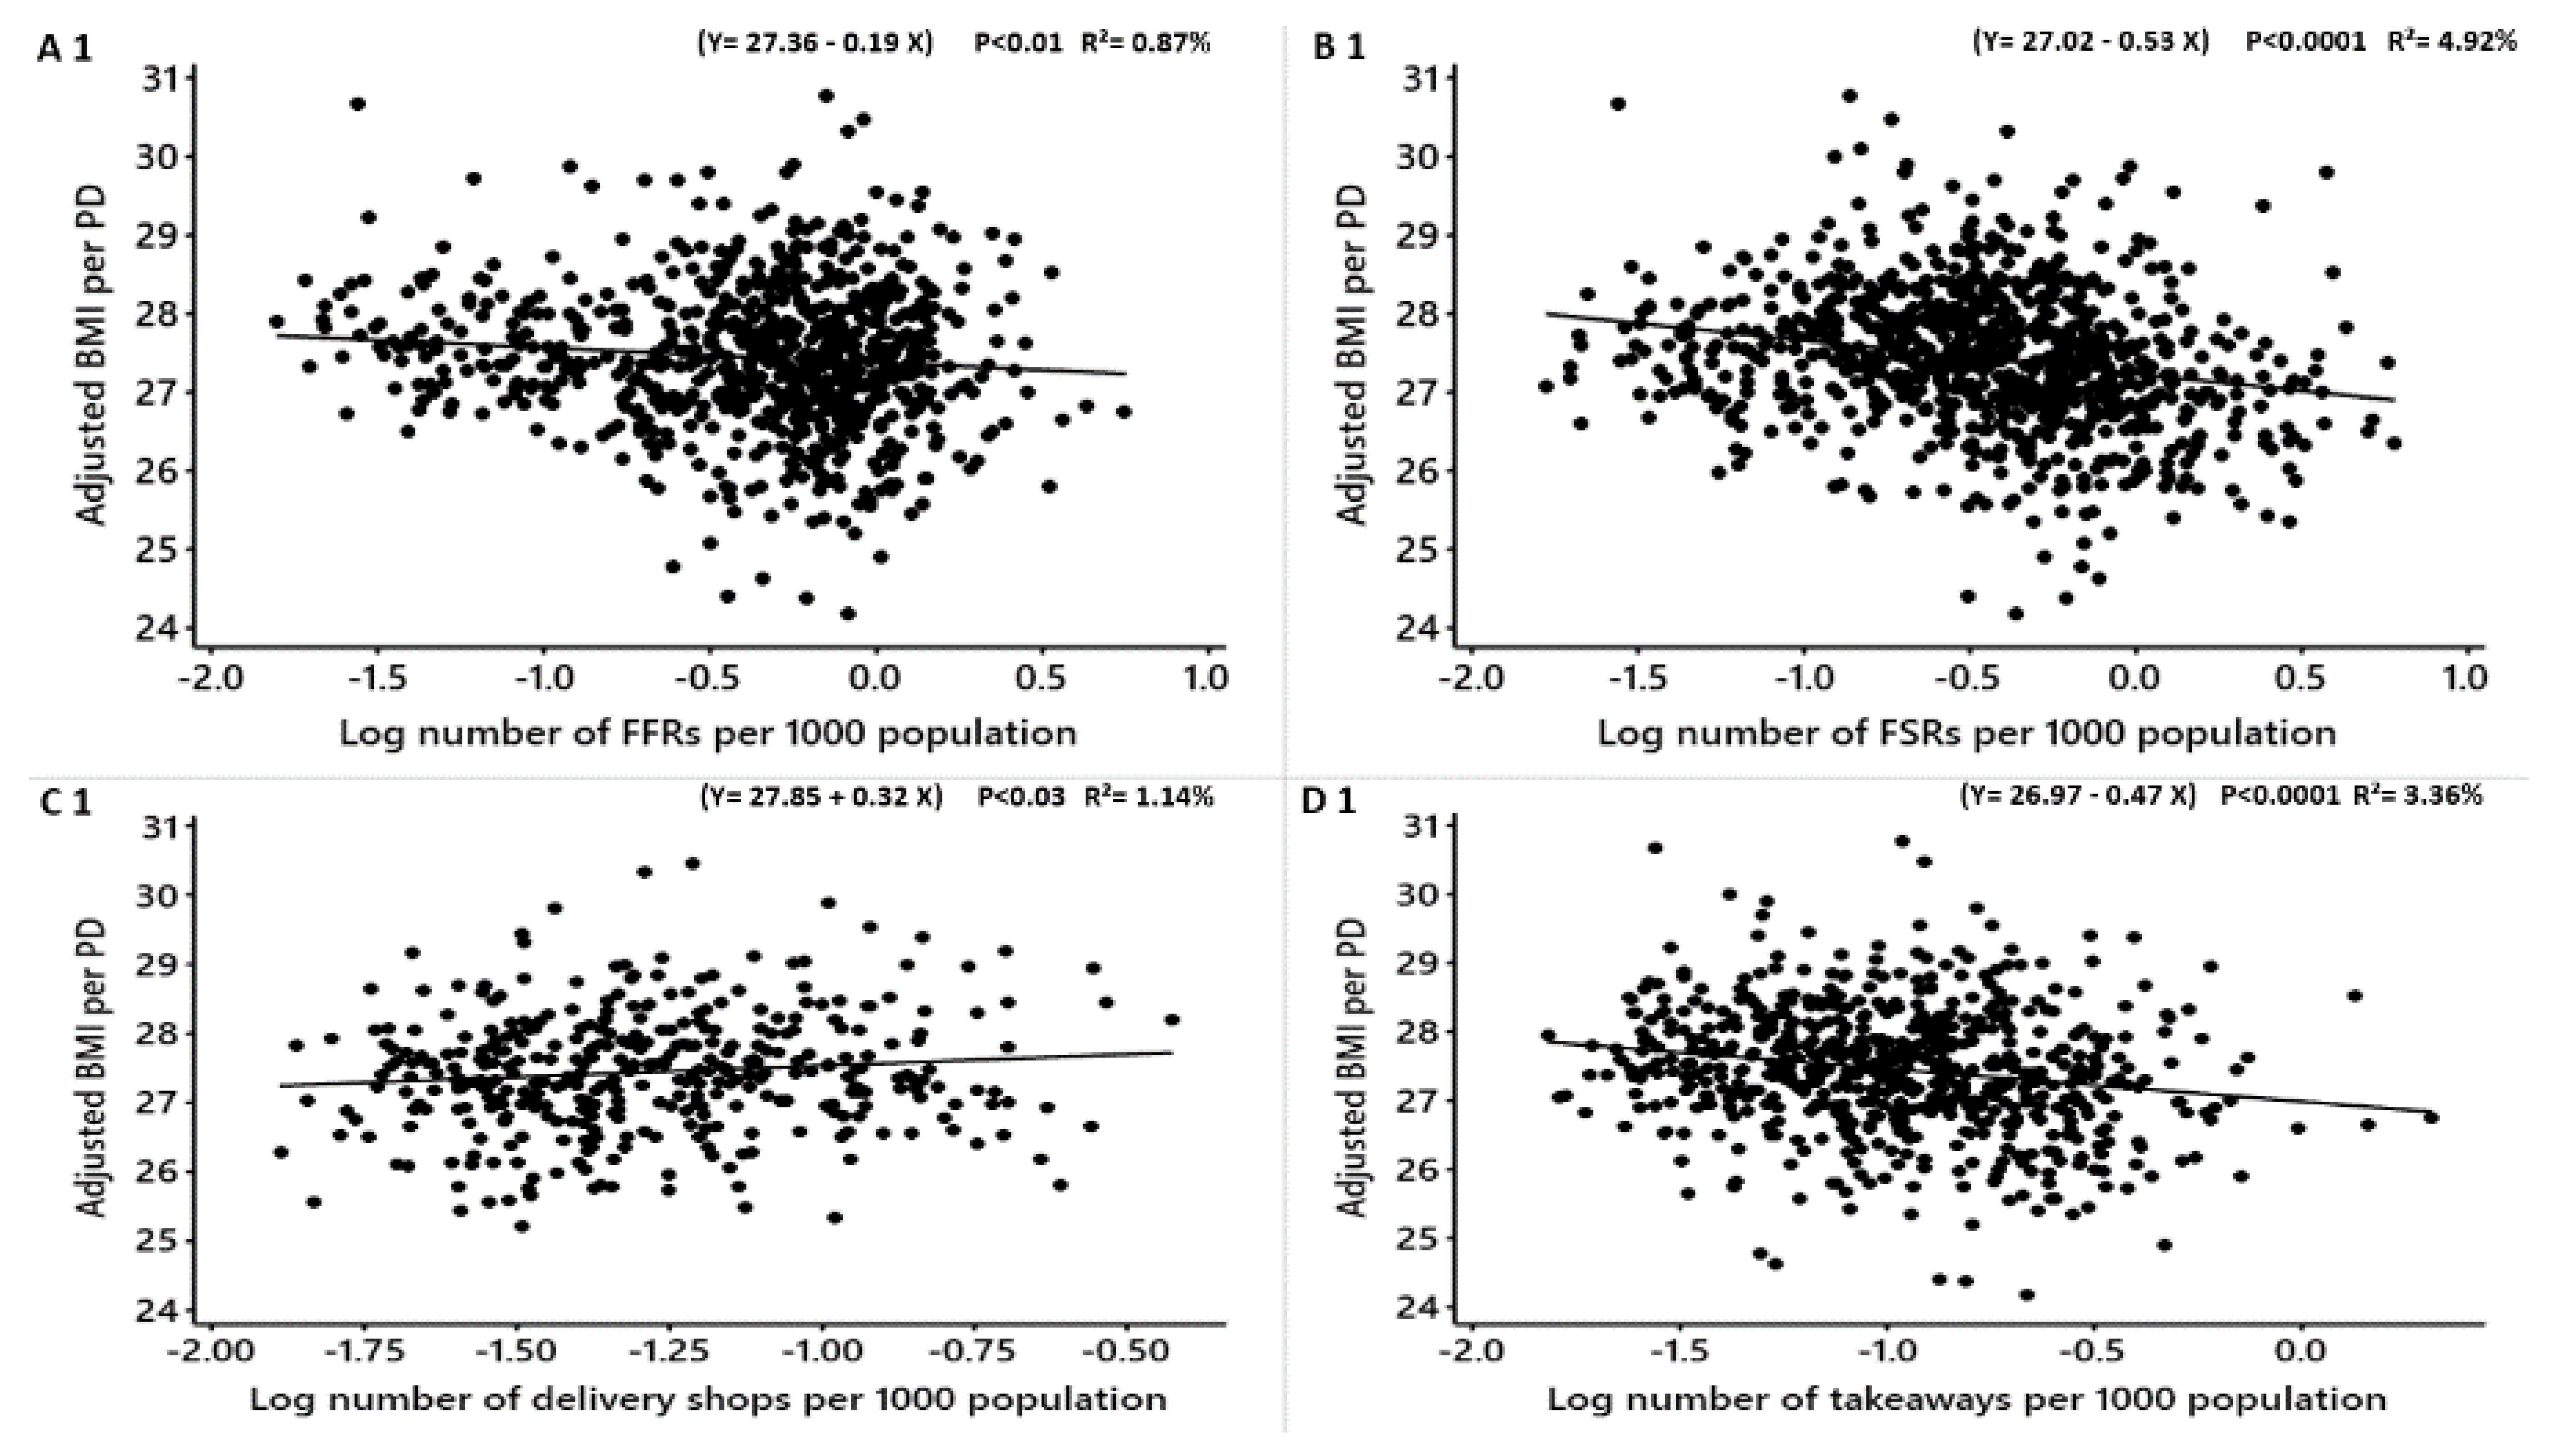
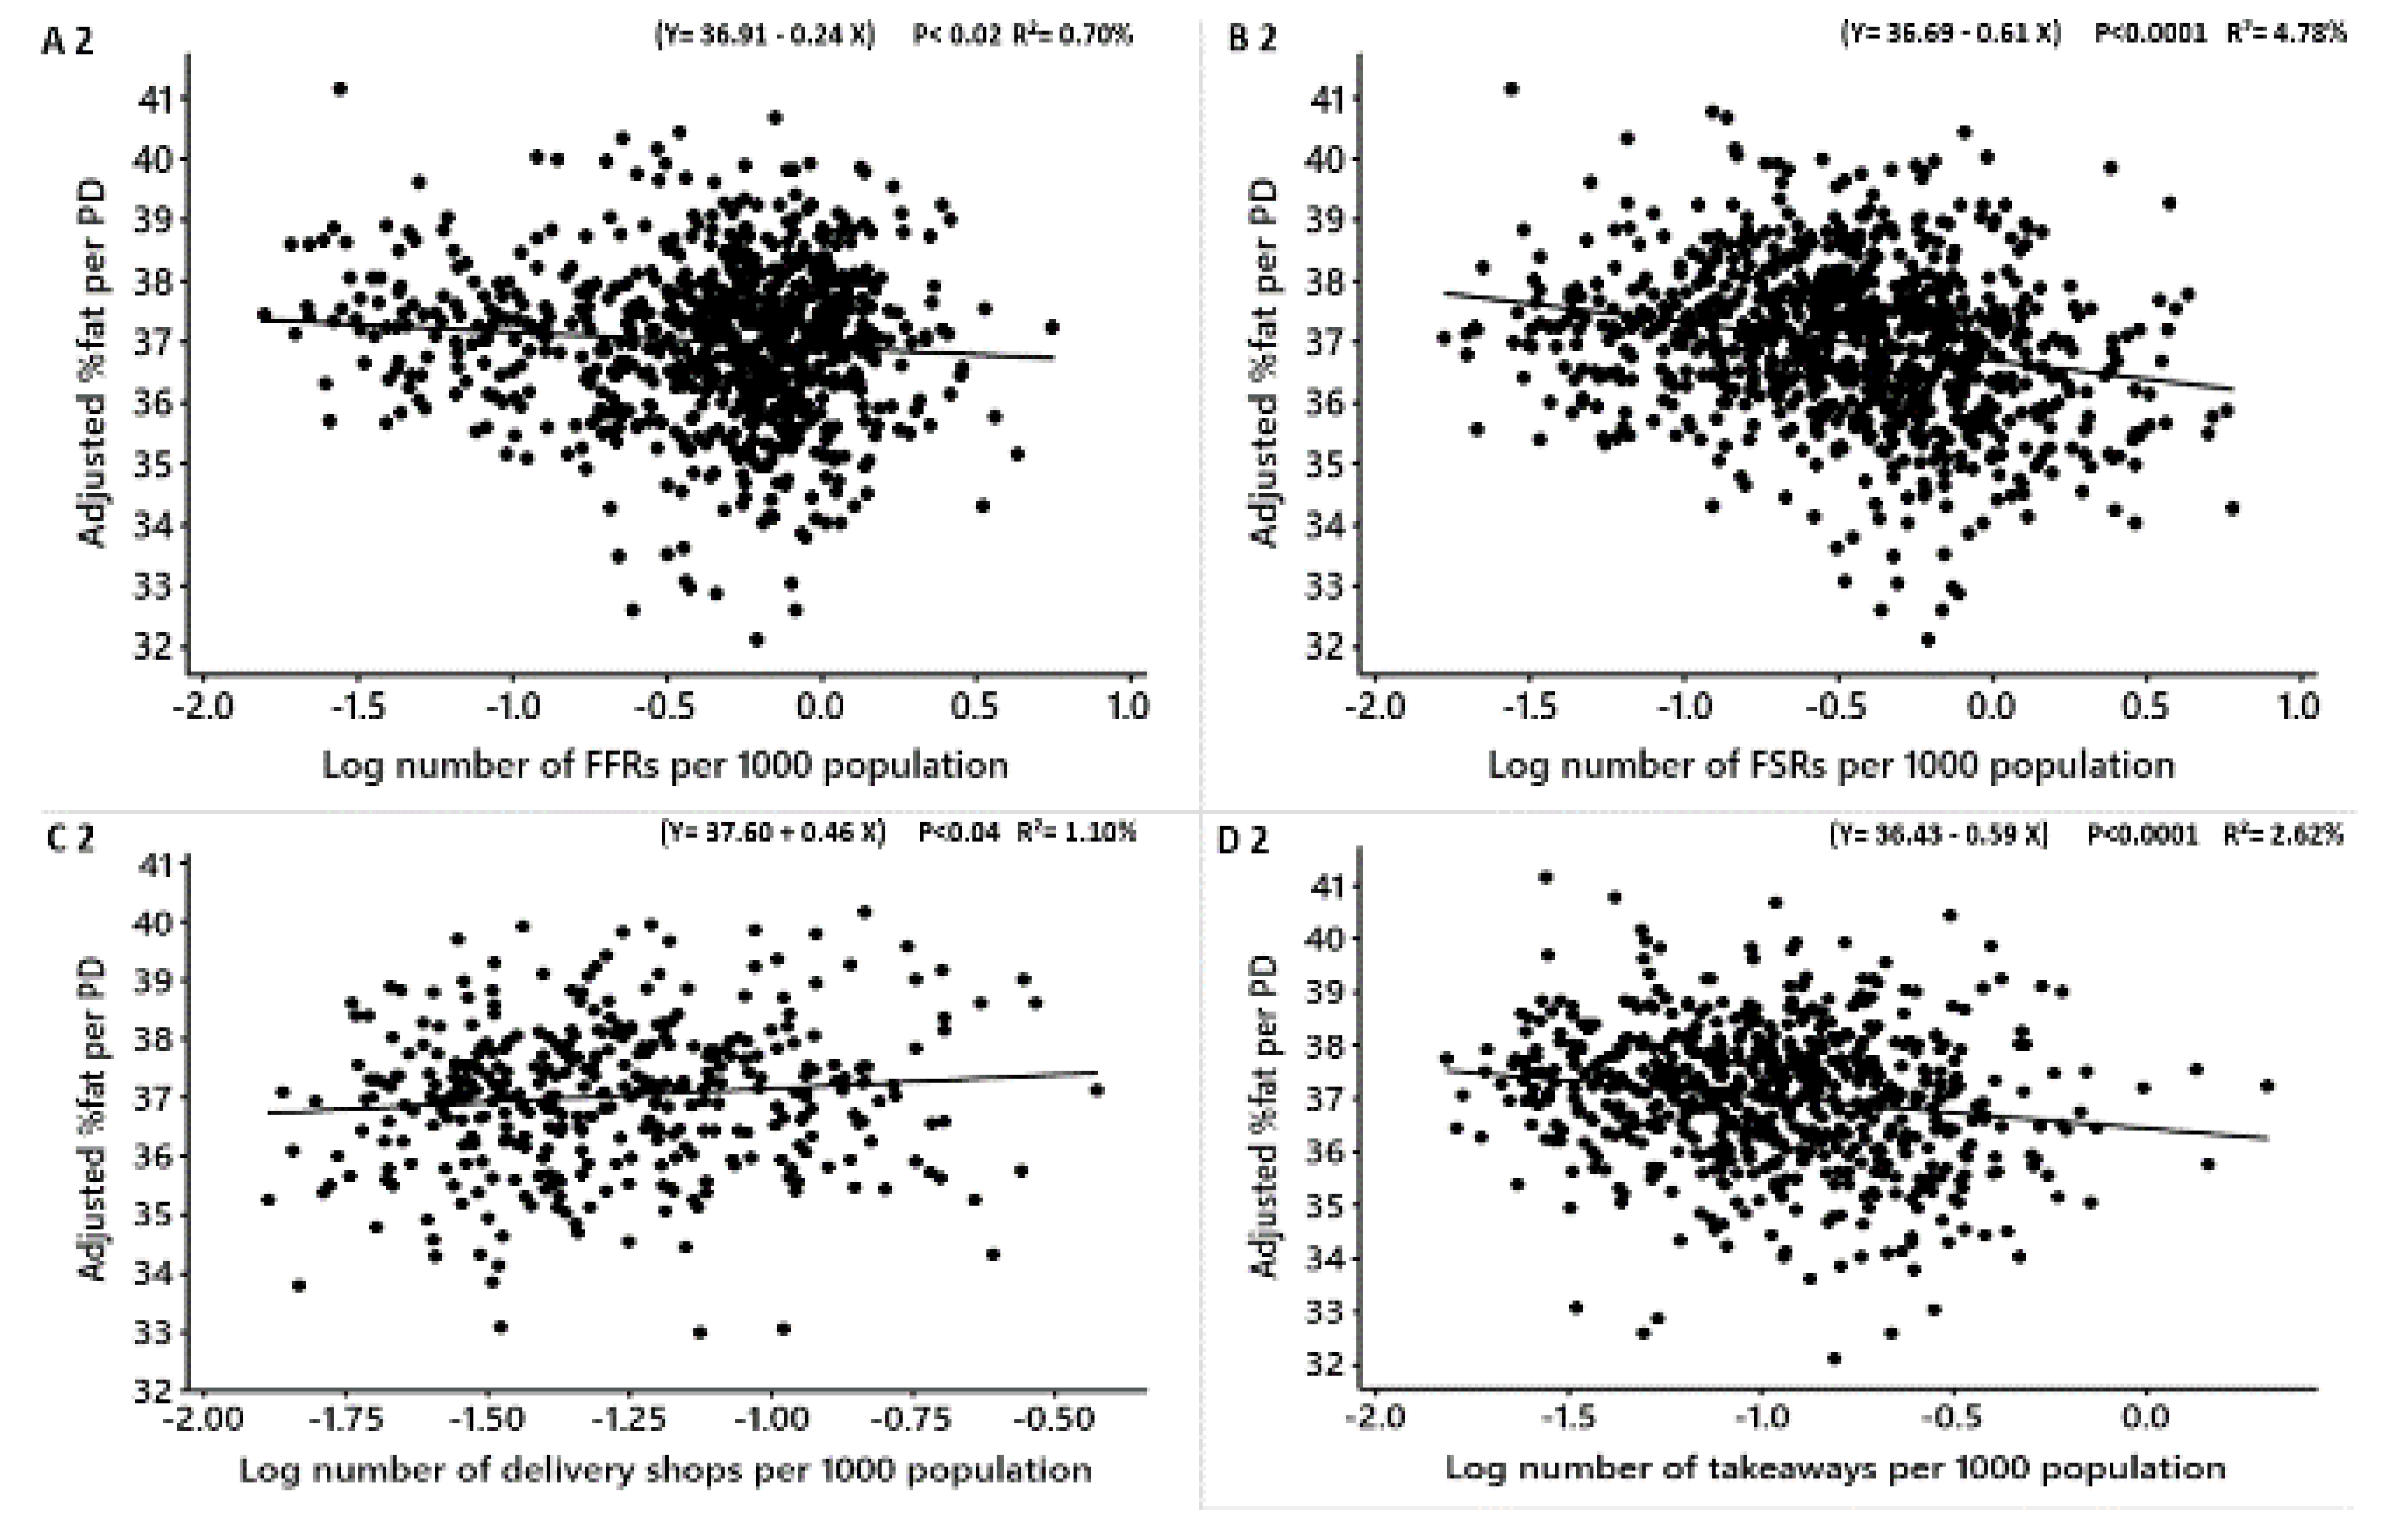
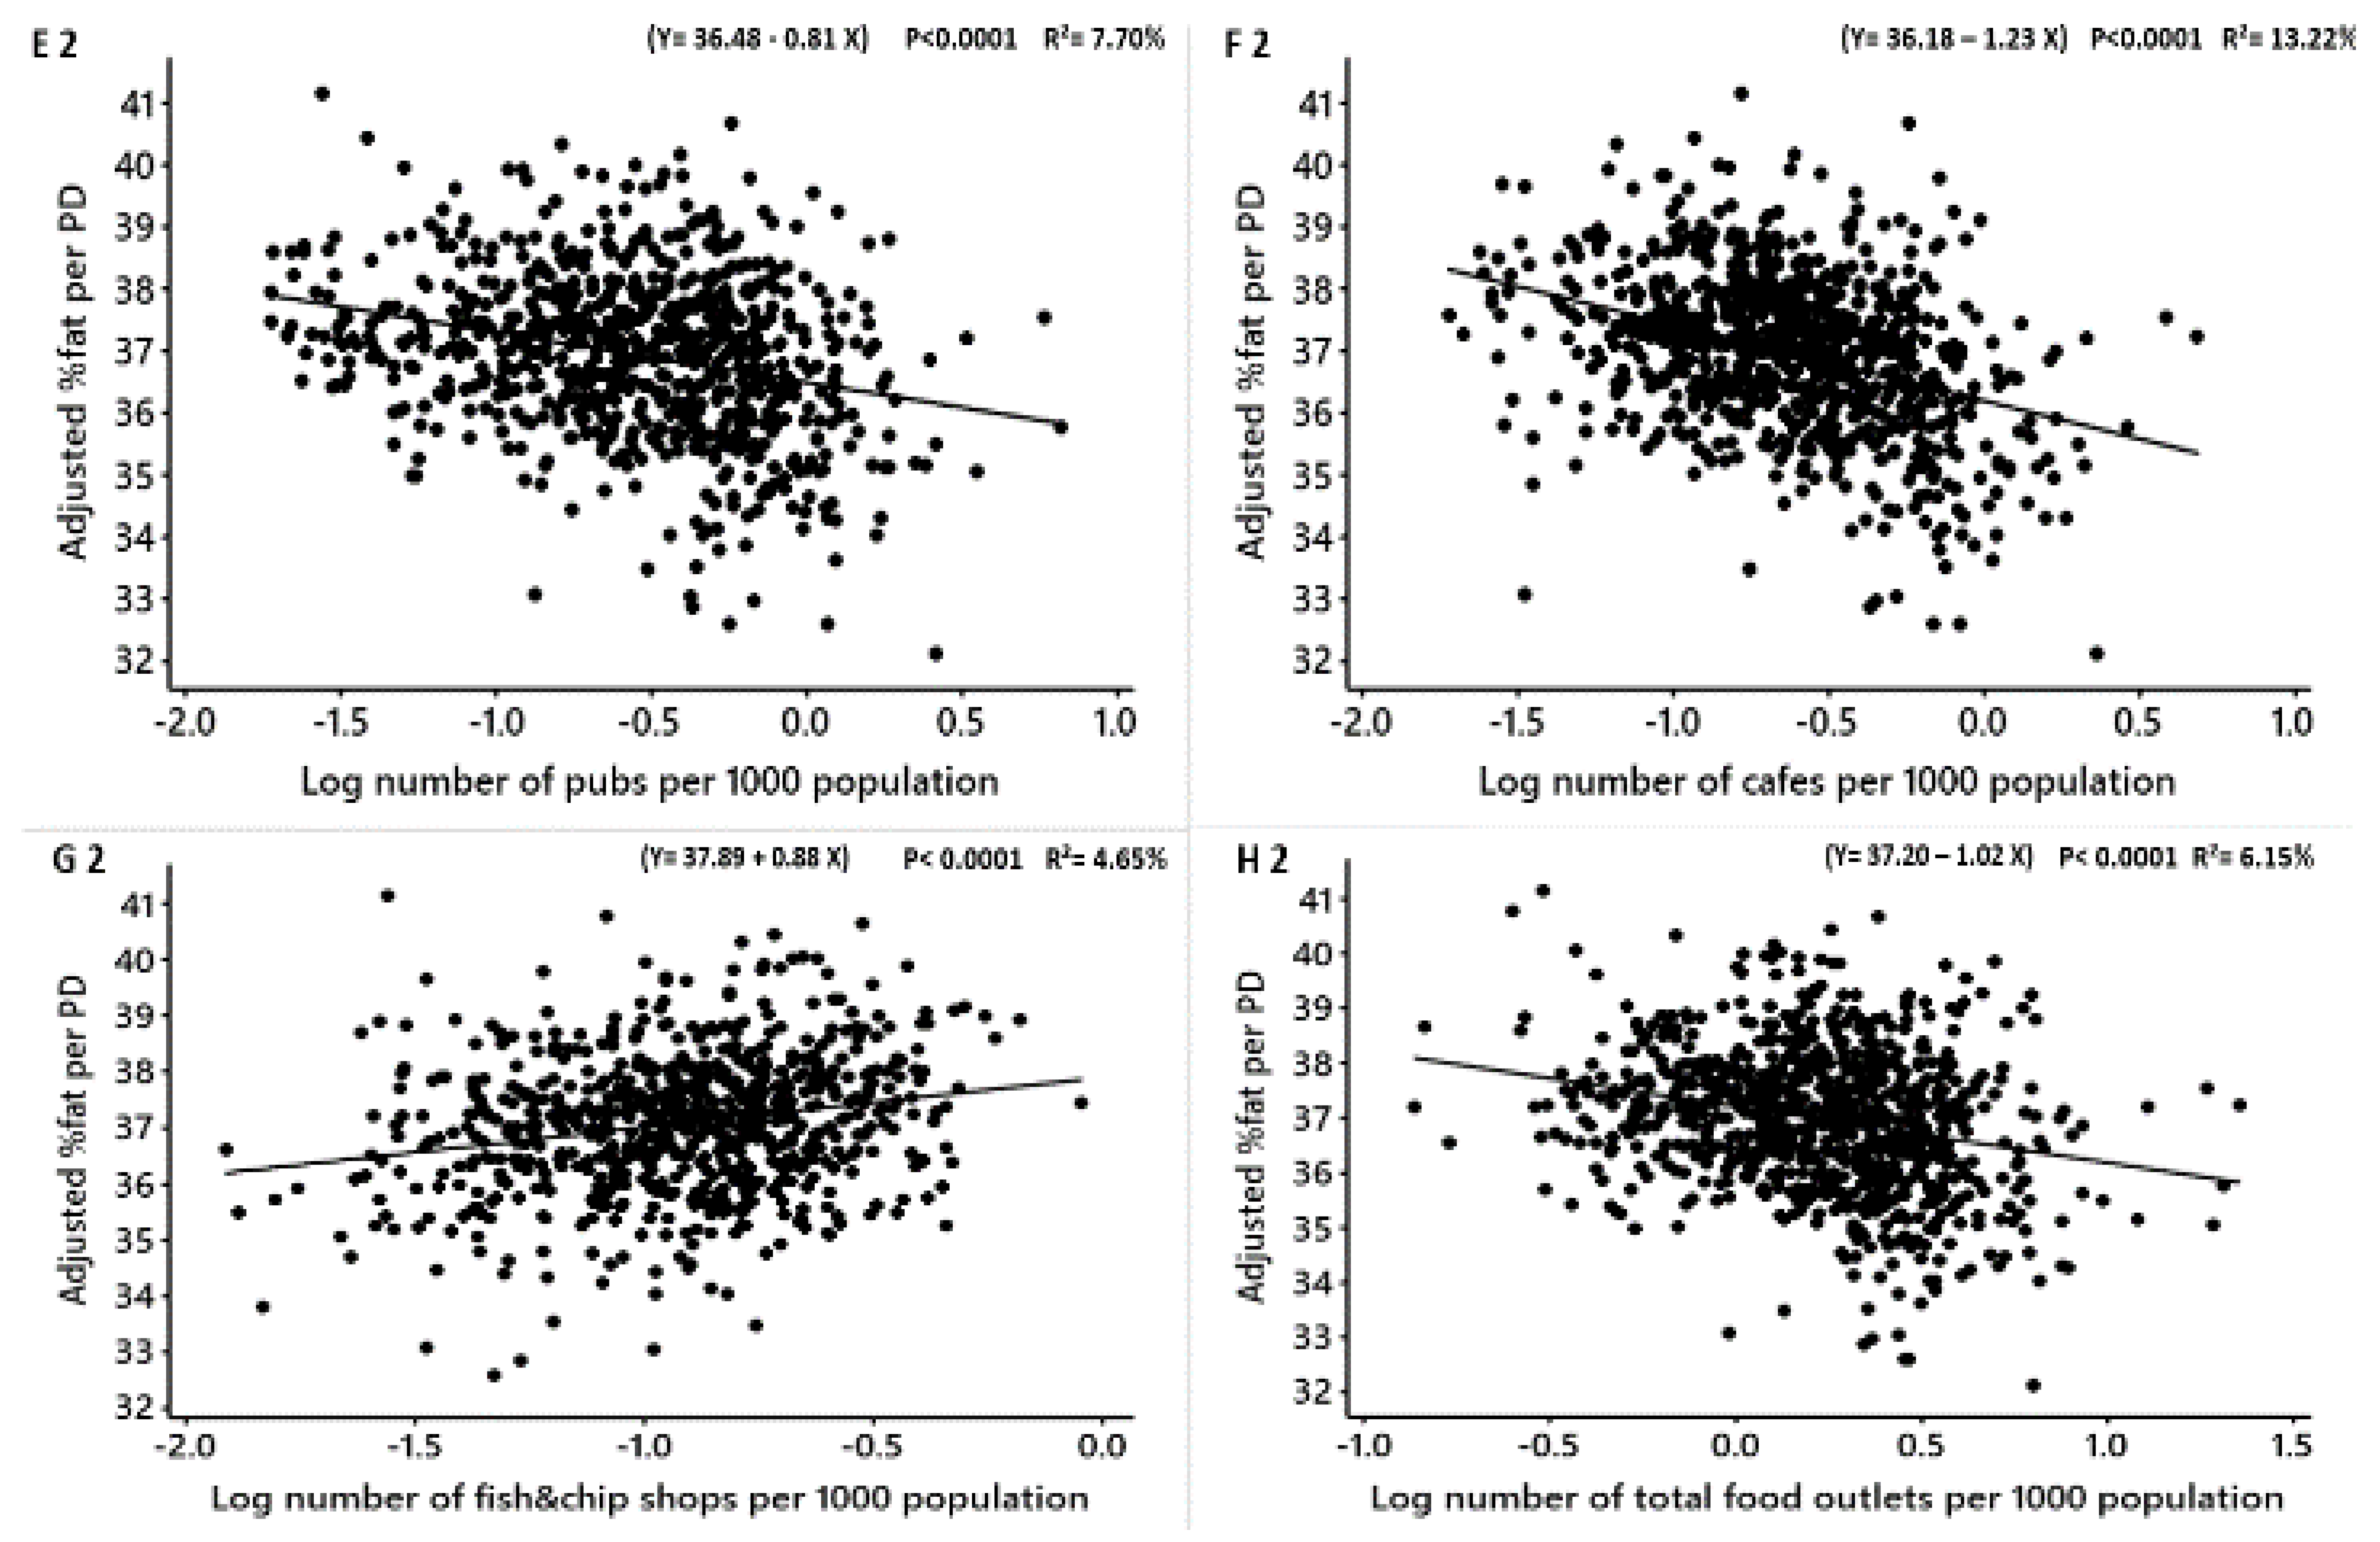
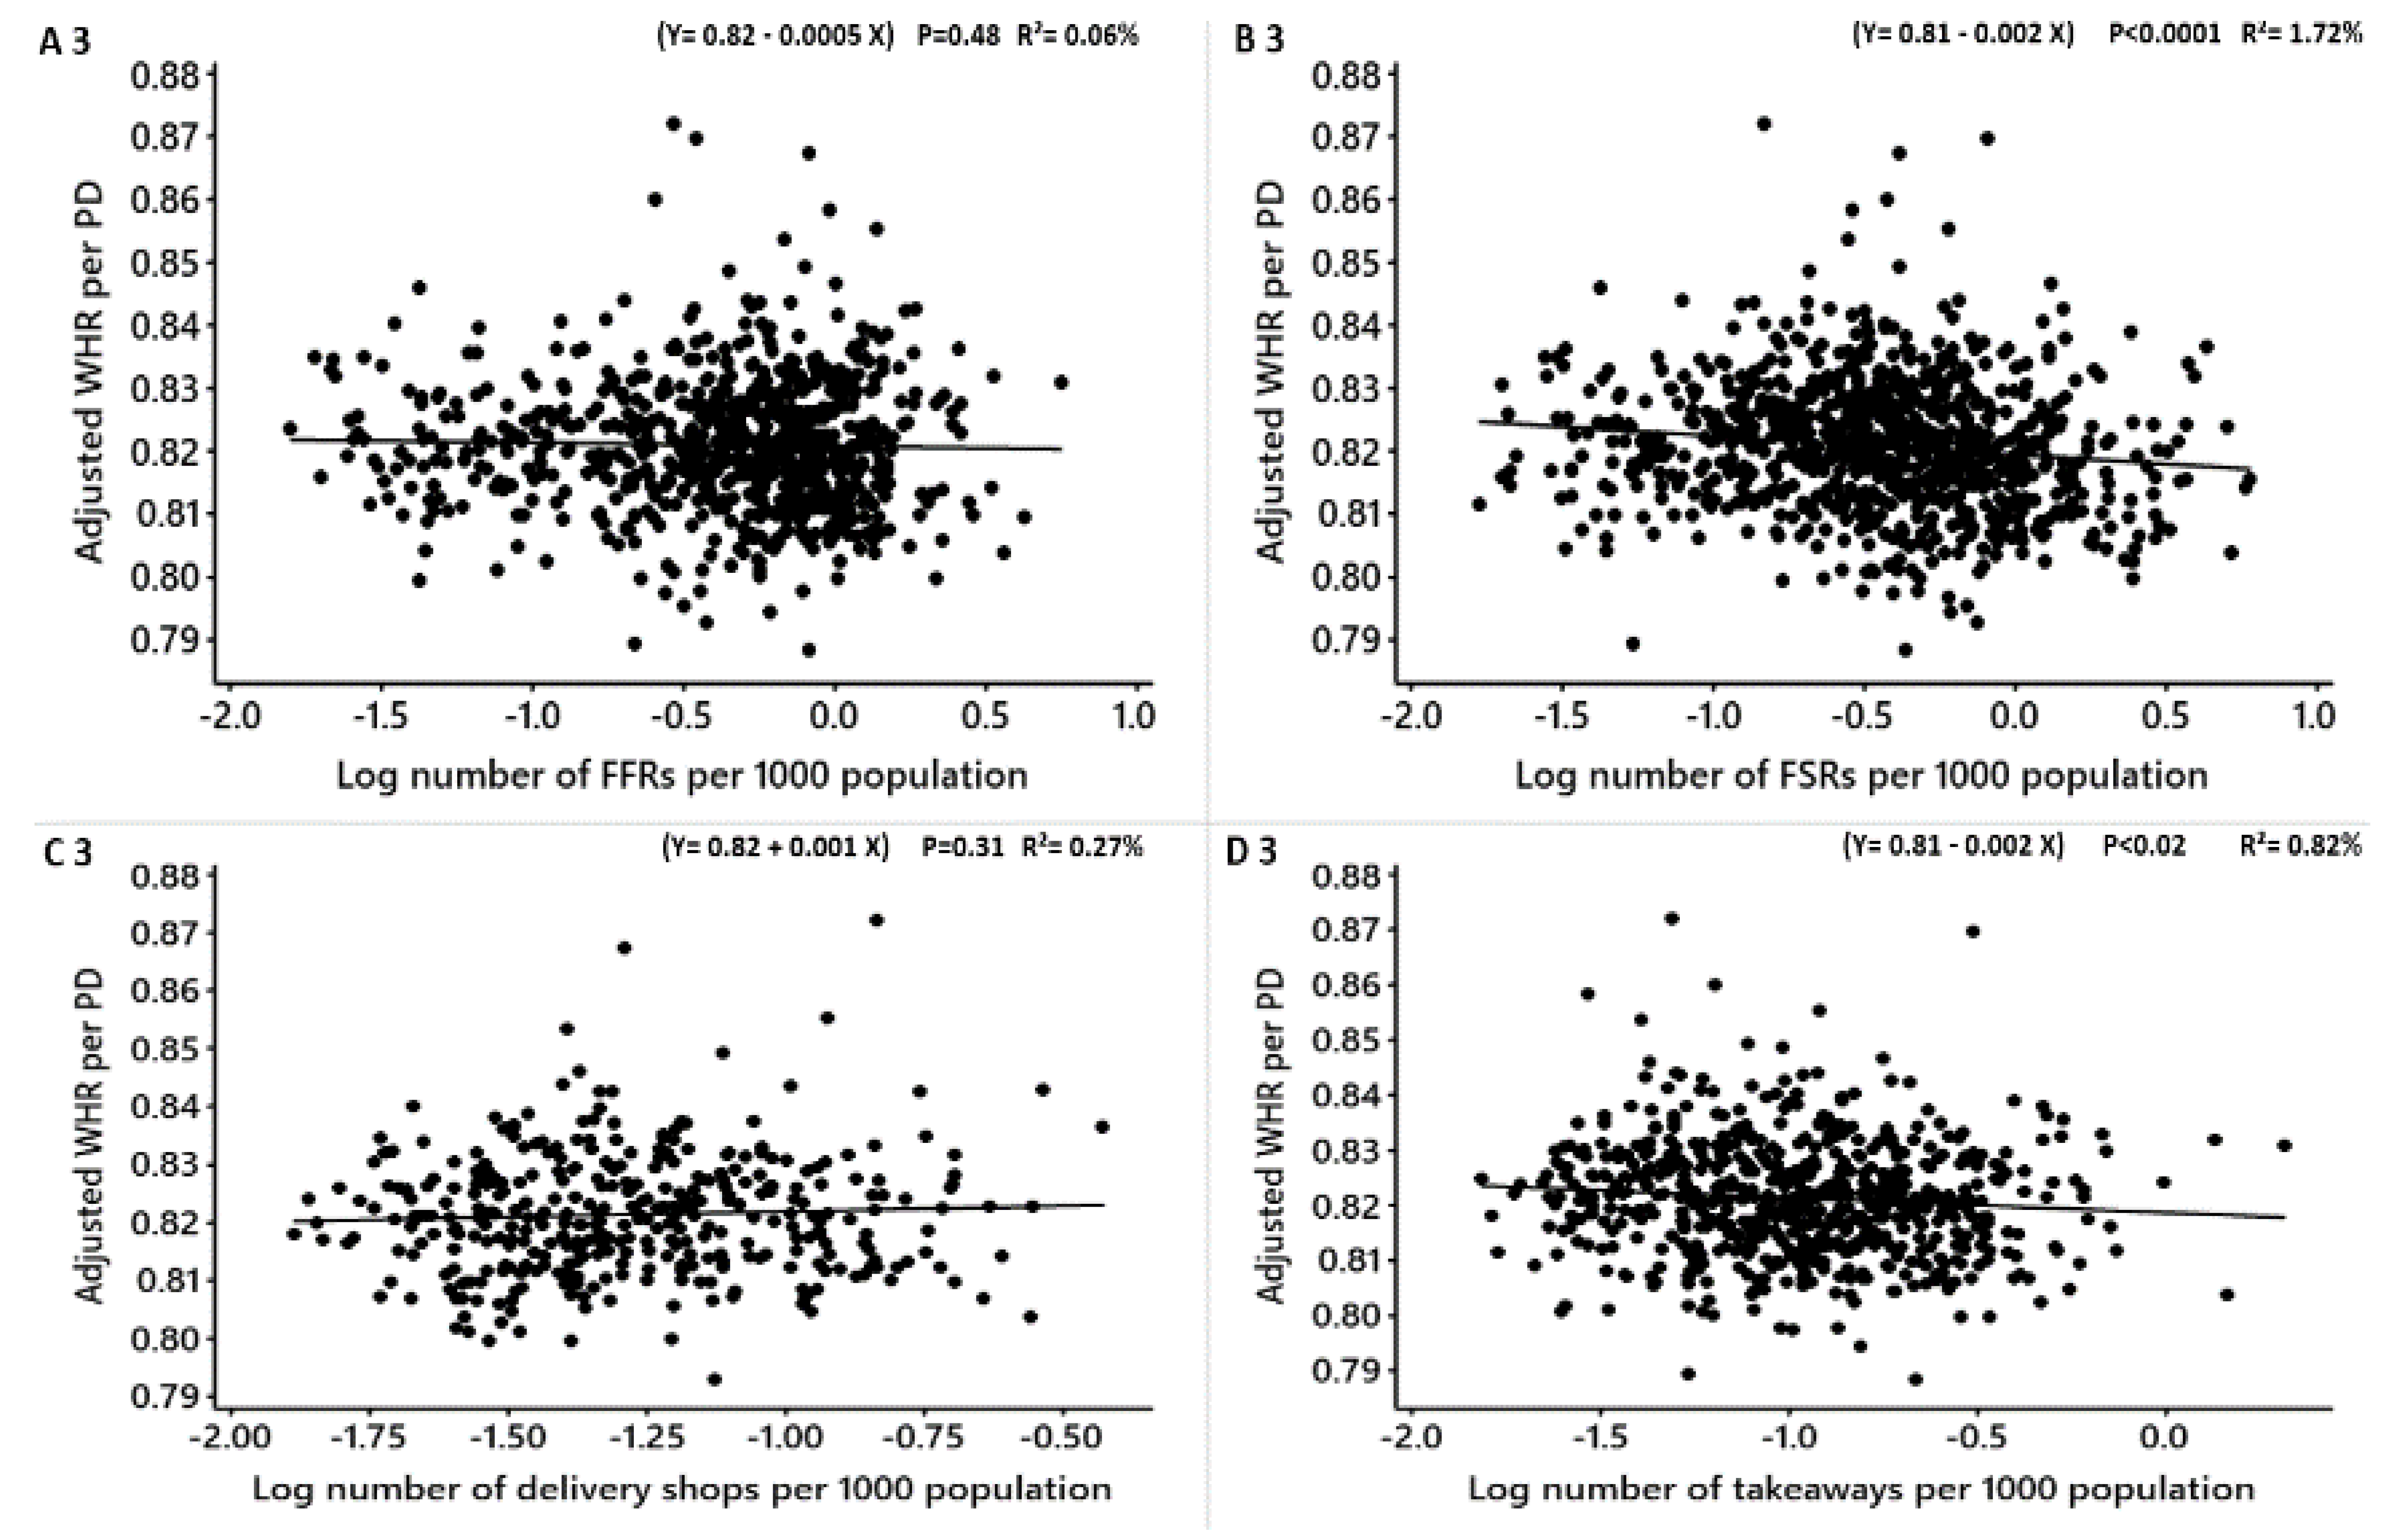
| Obesity Measure | Food Outlet Type | β | Converted β | 99% CI | R2 (%) | t | Adjusted P-Value | Figure 4 |
|---|---|---|---|---|---|---|---|---|
| Adjusted mean BMI | FFRs | −0.19 | −0.17 | −0.33, −0.04 | 0.87 | −2.59 | 0.01 | A 1 |
| FSRs | −0.42 | −0.34 | −0.55, −0.29 | 4.73 | −6.52 | <0.0001 | B 1 | |
| Delivery shops | 0.32 | 0.37 | 0.01, 0.63 | 1.14 | 2.08 | 0.03 | C 1 | |
| Takeaways | −0.47 | −0.37 | −0.67, −0.27 | 3.36 | −4.73 | <0.0001 | D 1 | |
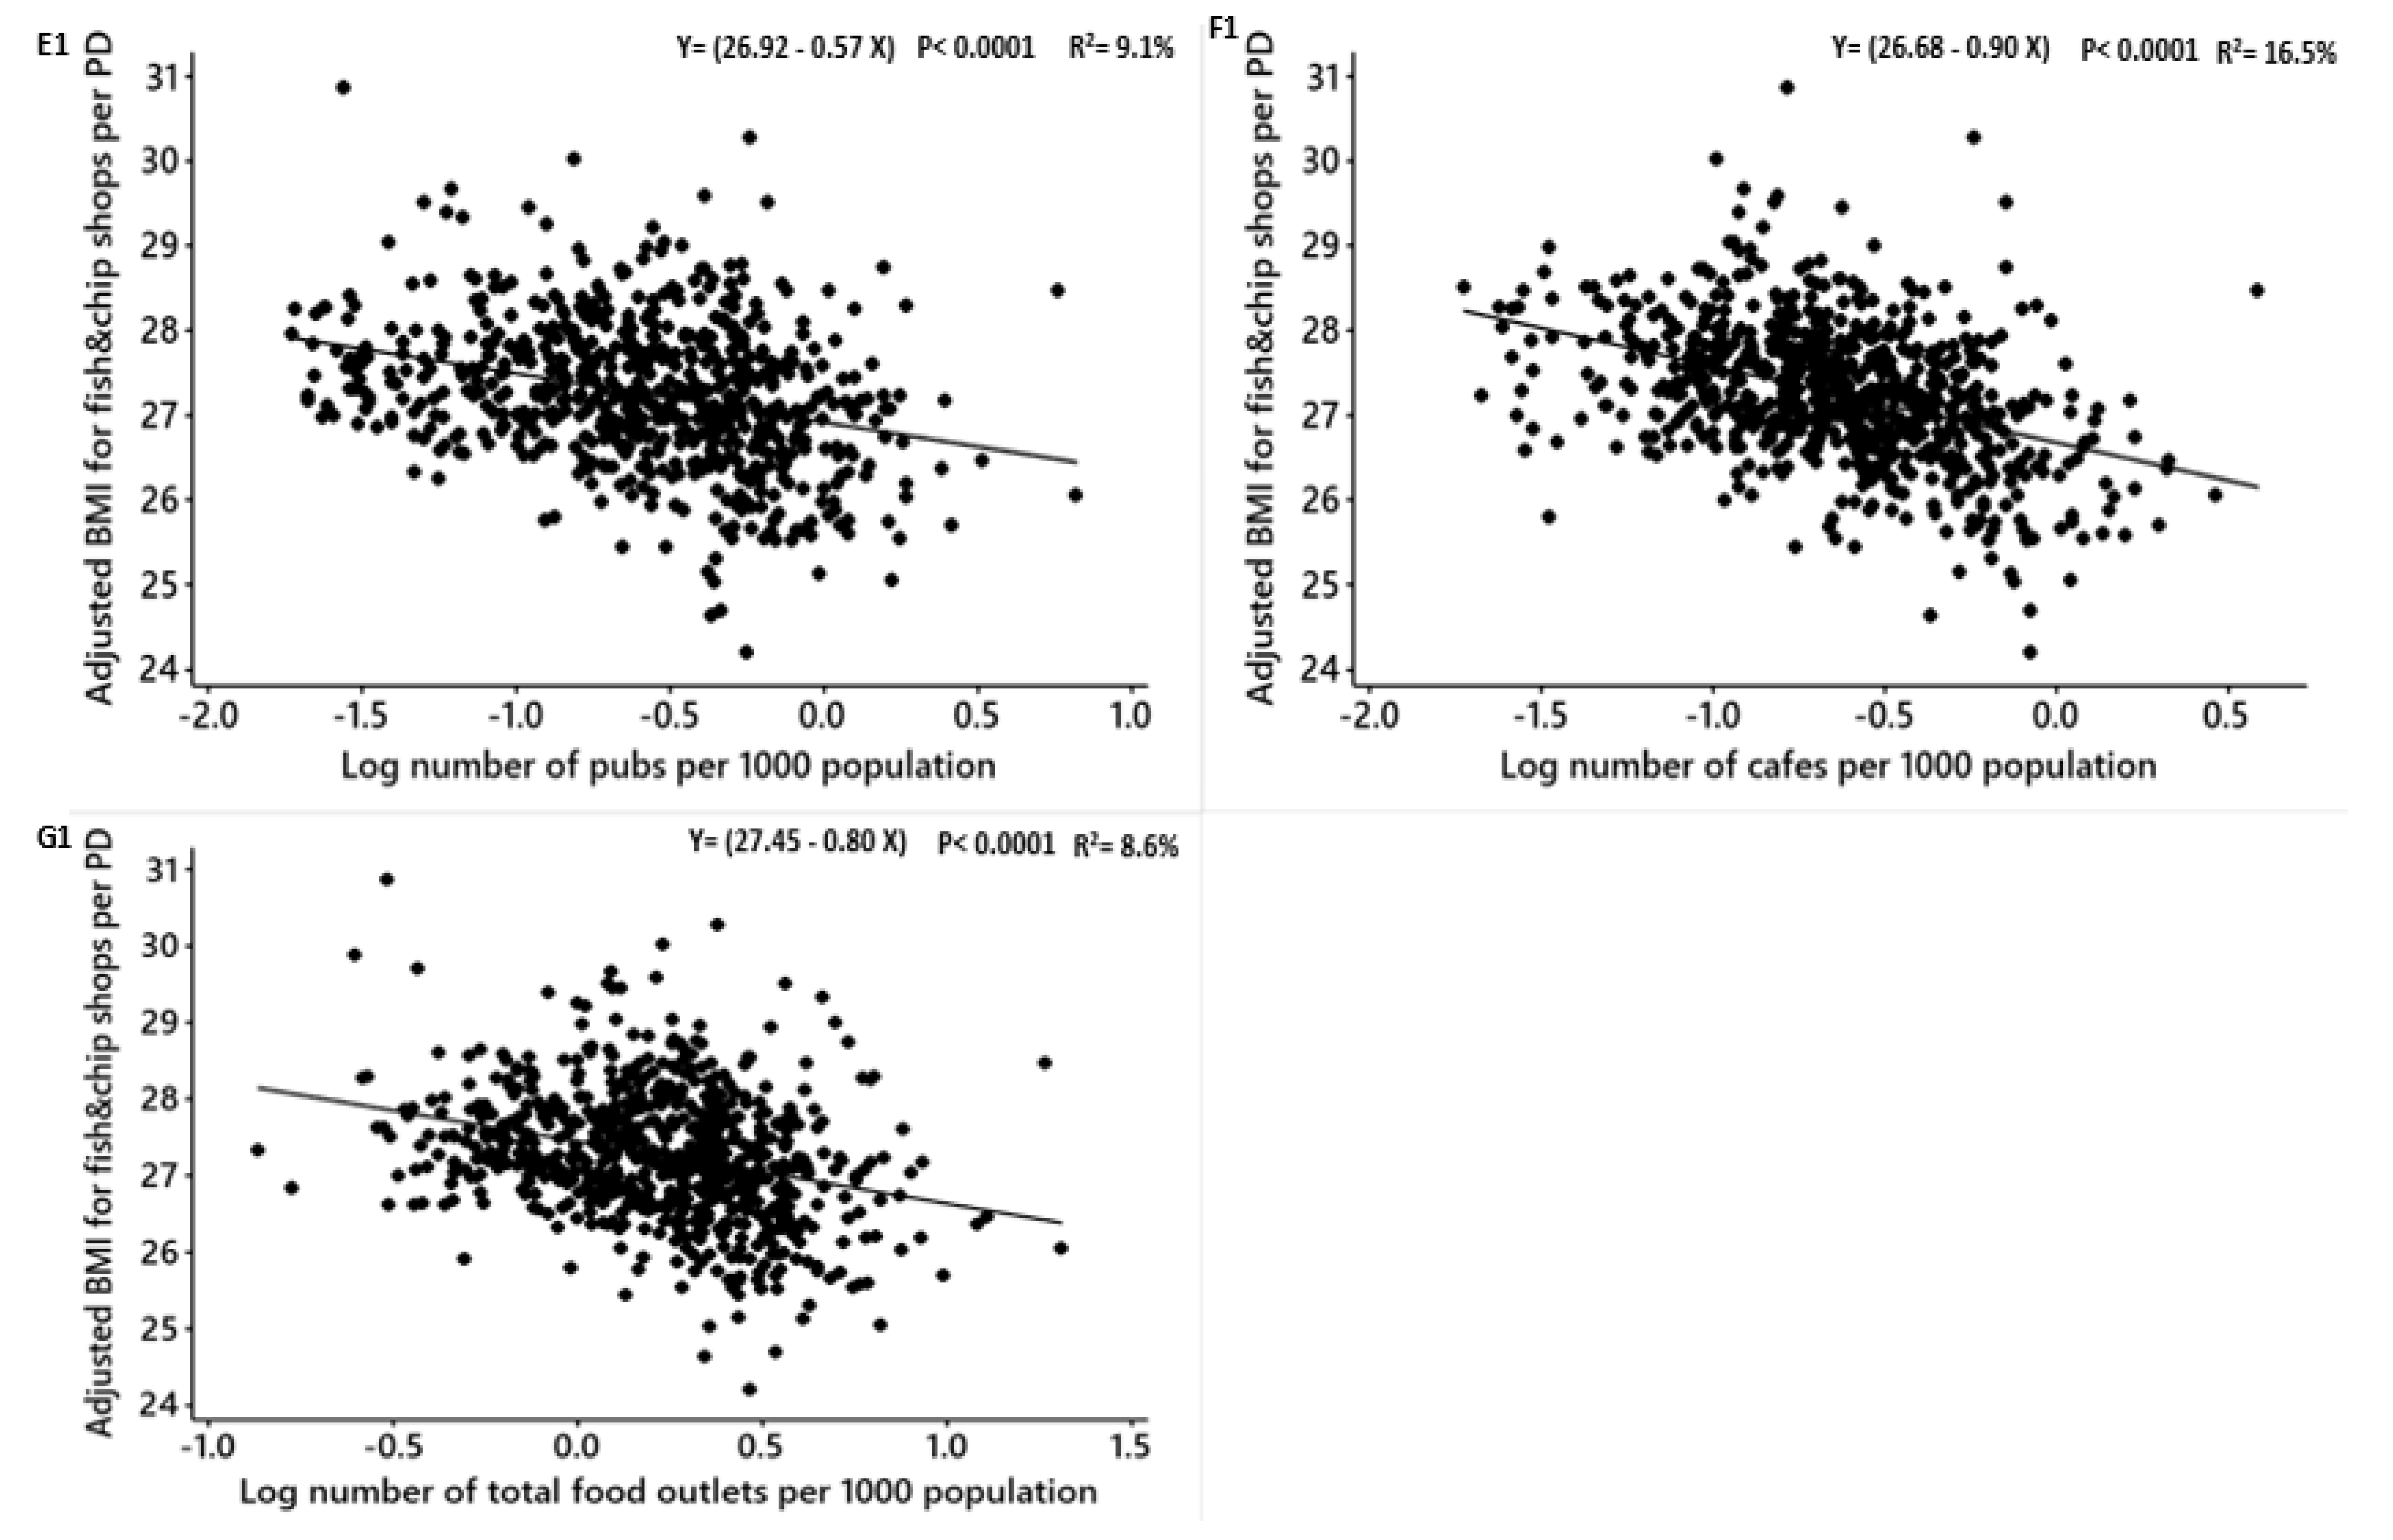
| Pubs | −0.59 | −0.44 | −0.73, −0.45 | 8.48 | −8.35 | <0.0001 | E 1 | |
| Cafes | −0.96 | −0.61 | −1.11, −0.81 | 16.5 | −12.66 | <0.0001 | F 1 | |
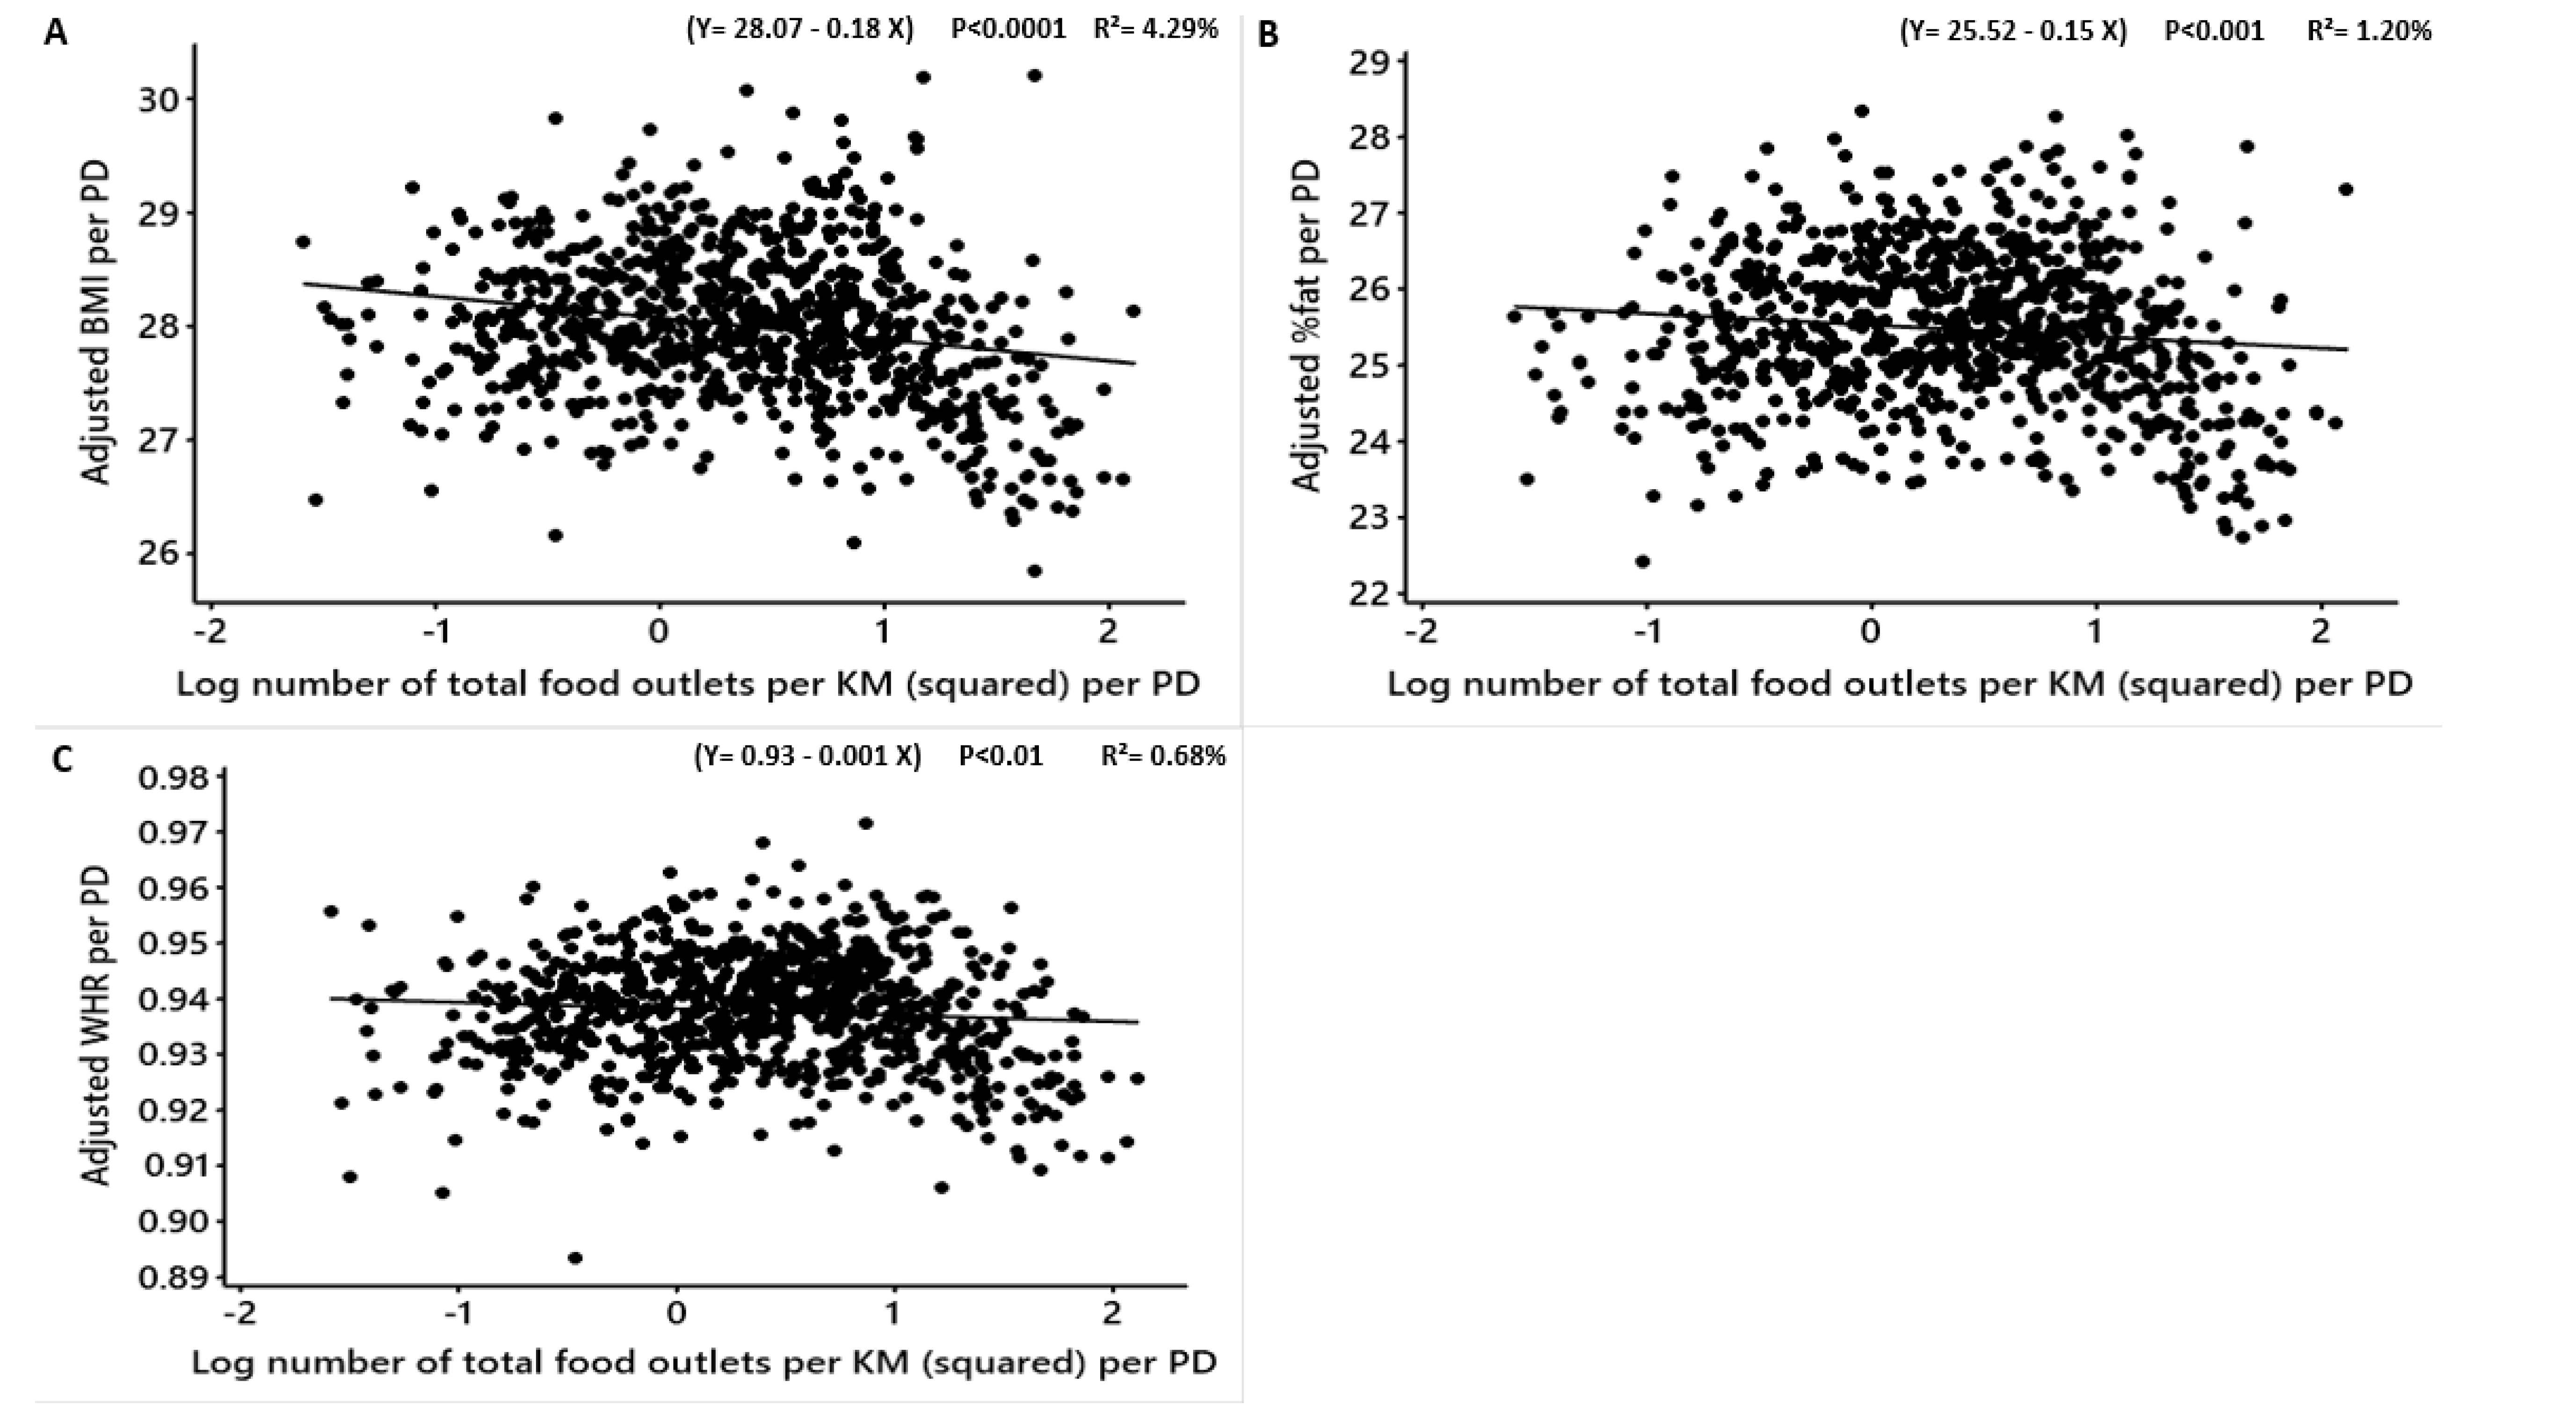
| Fish and chip shops | 0.66 | 0.93 | 0.44, 0.87 | 5.31 | 6.47 | <0.0001 | G 1 | |
| Total food outlets (combined) | −0.72 | −0.51 | −0.91, −0.54 | 6.40 | −7.65 | <0.0001 | H 1 | |
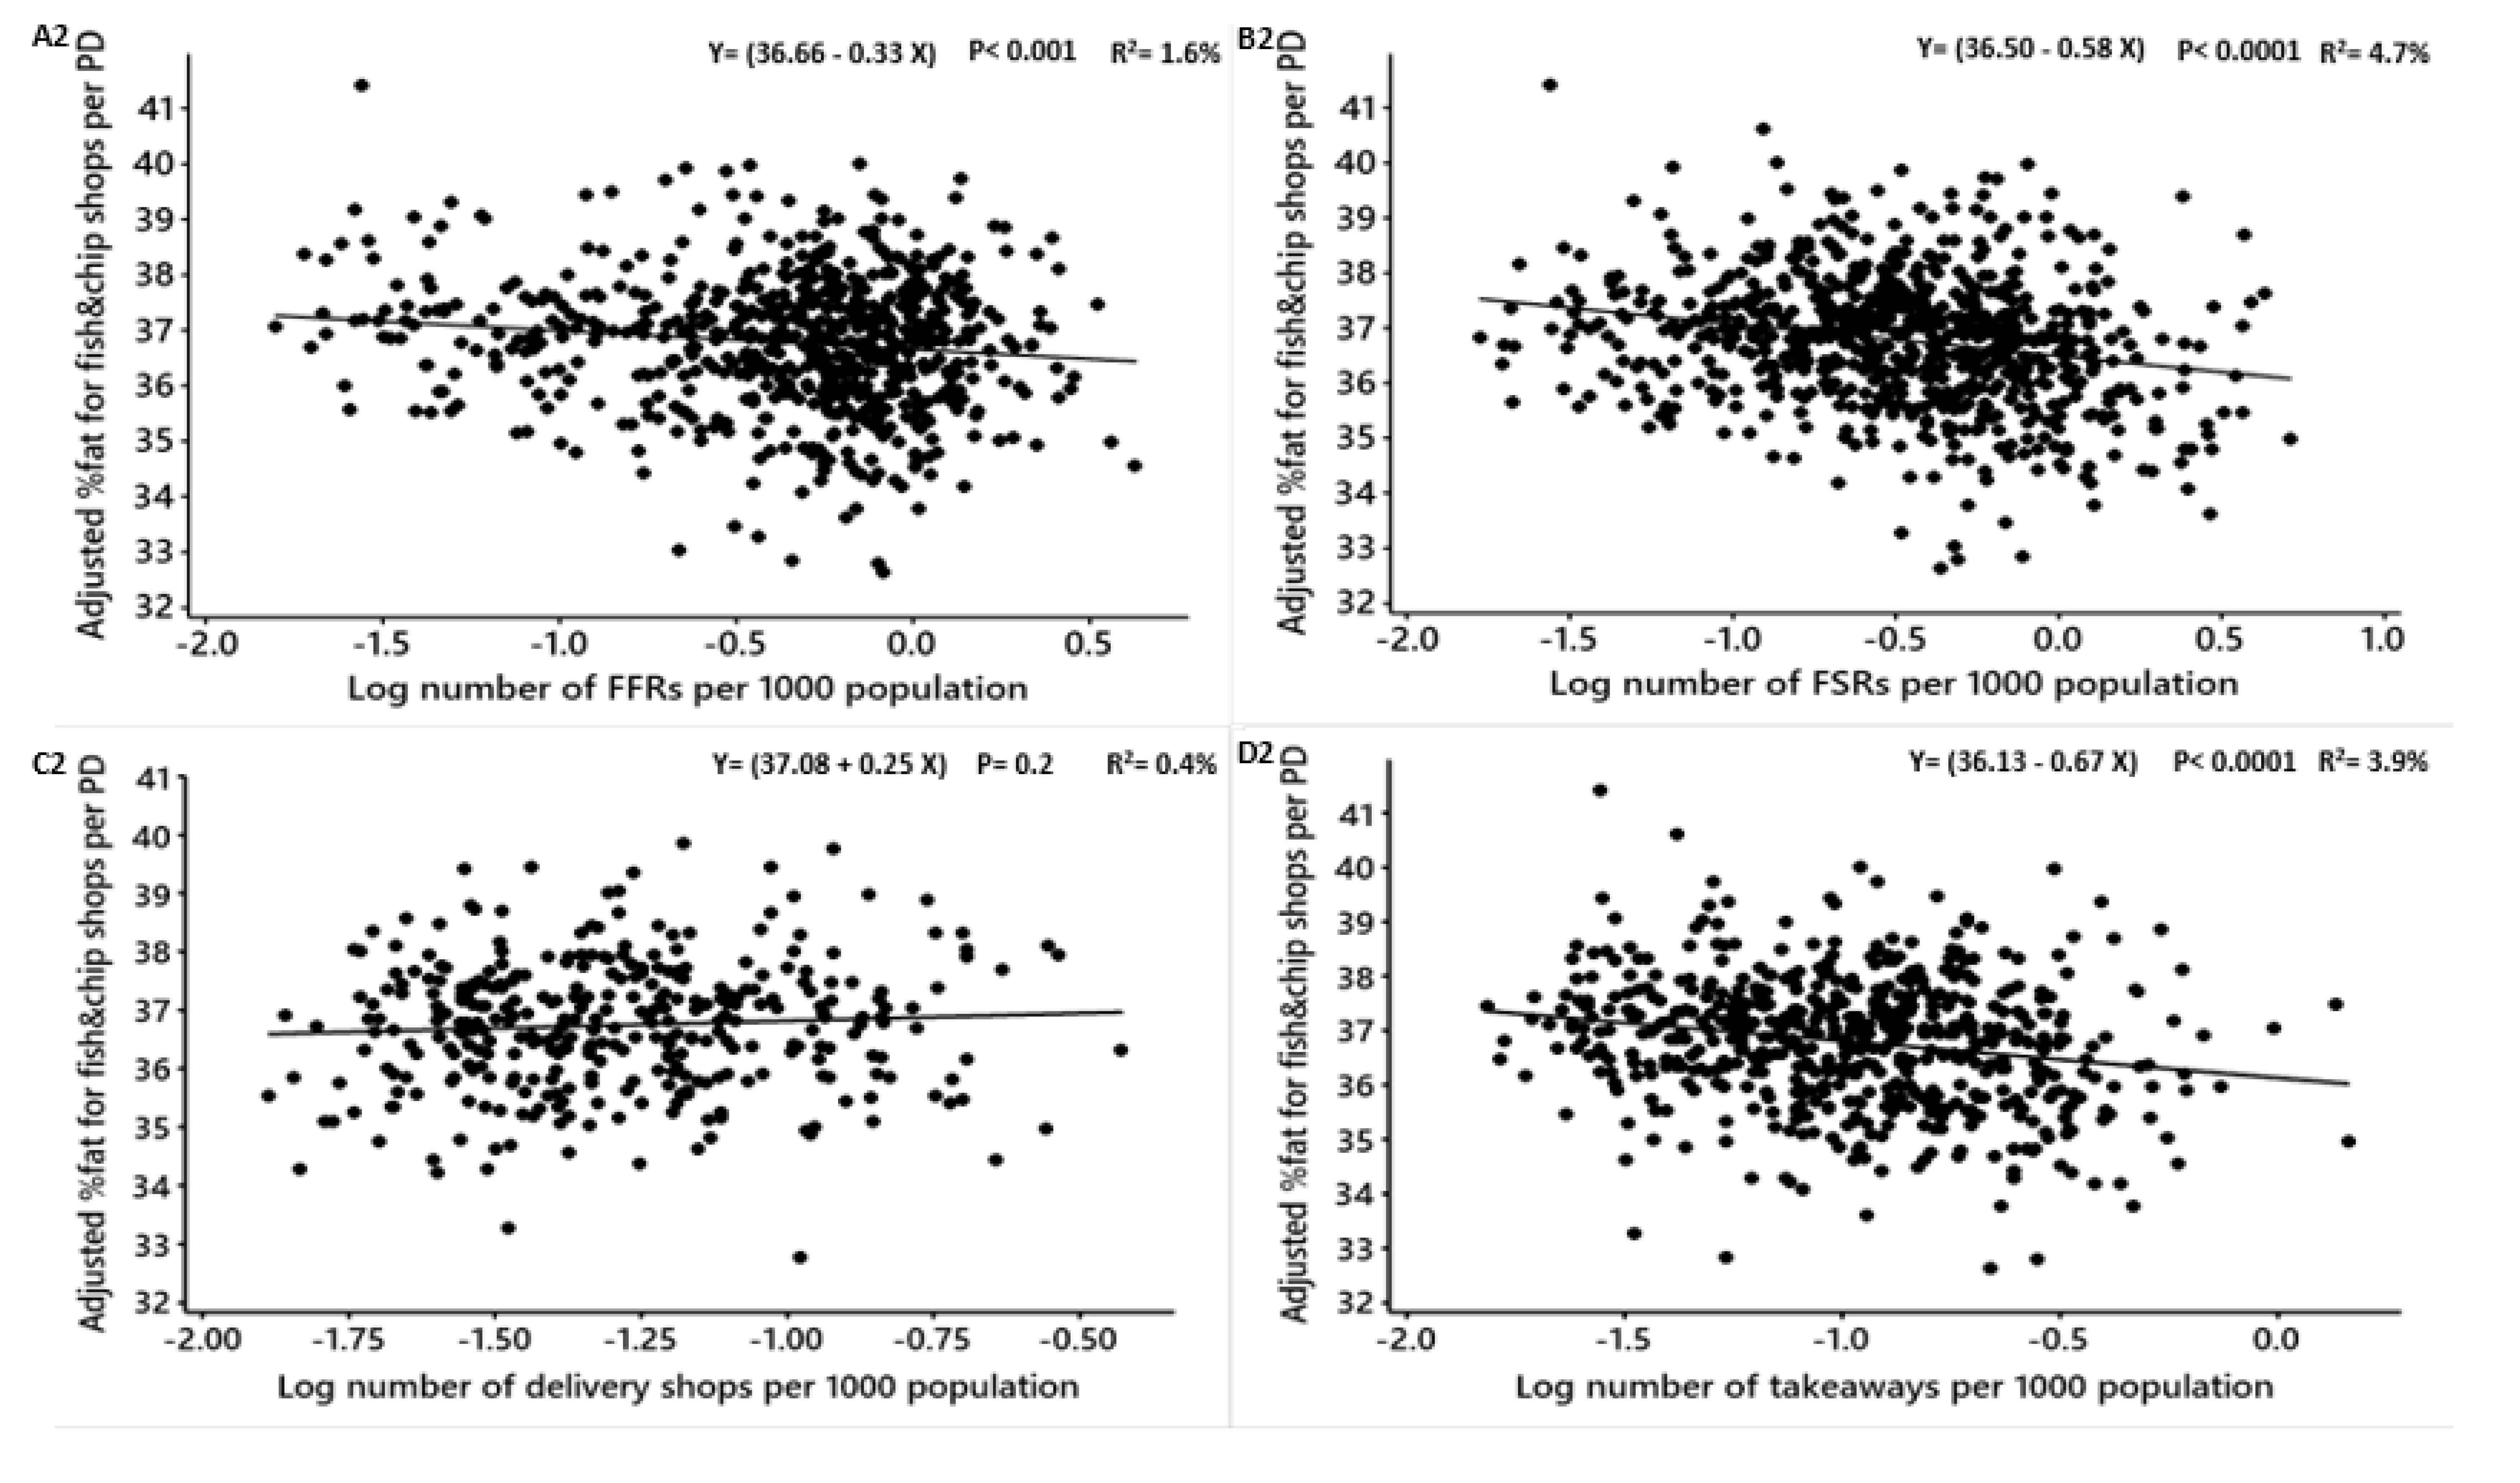
| Adjusted mean %fat | FFRs | −0.24 | −0.21 | −0.45, −0.03 | 0.70 | −2.32 | 0.02 | A 2 |
| FSRs | −0.61 | −0.45 | −0.80, −0.43 | 4.78 | −6.56 | <0.0001 | B 2 | |
| Delivery shops | 0.46 | 0.58 | 0.01, 0.90 | 1.10 | 2.04 | 0.04 | C 2 | |
| Takeaways | −0.59 | −0.44 | −0.87, −0.31 | 2.62 | −4.16 | <0.0001 | D 2 | |
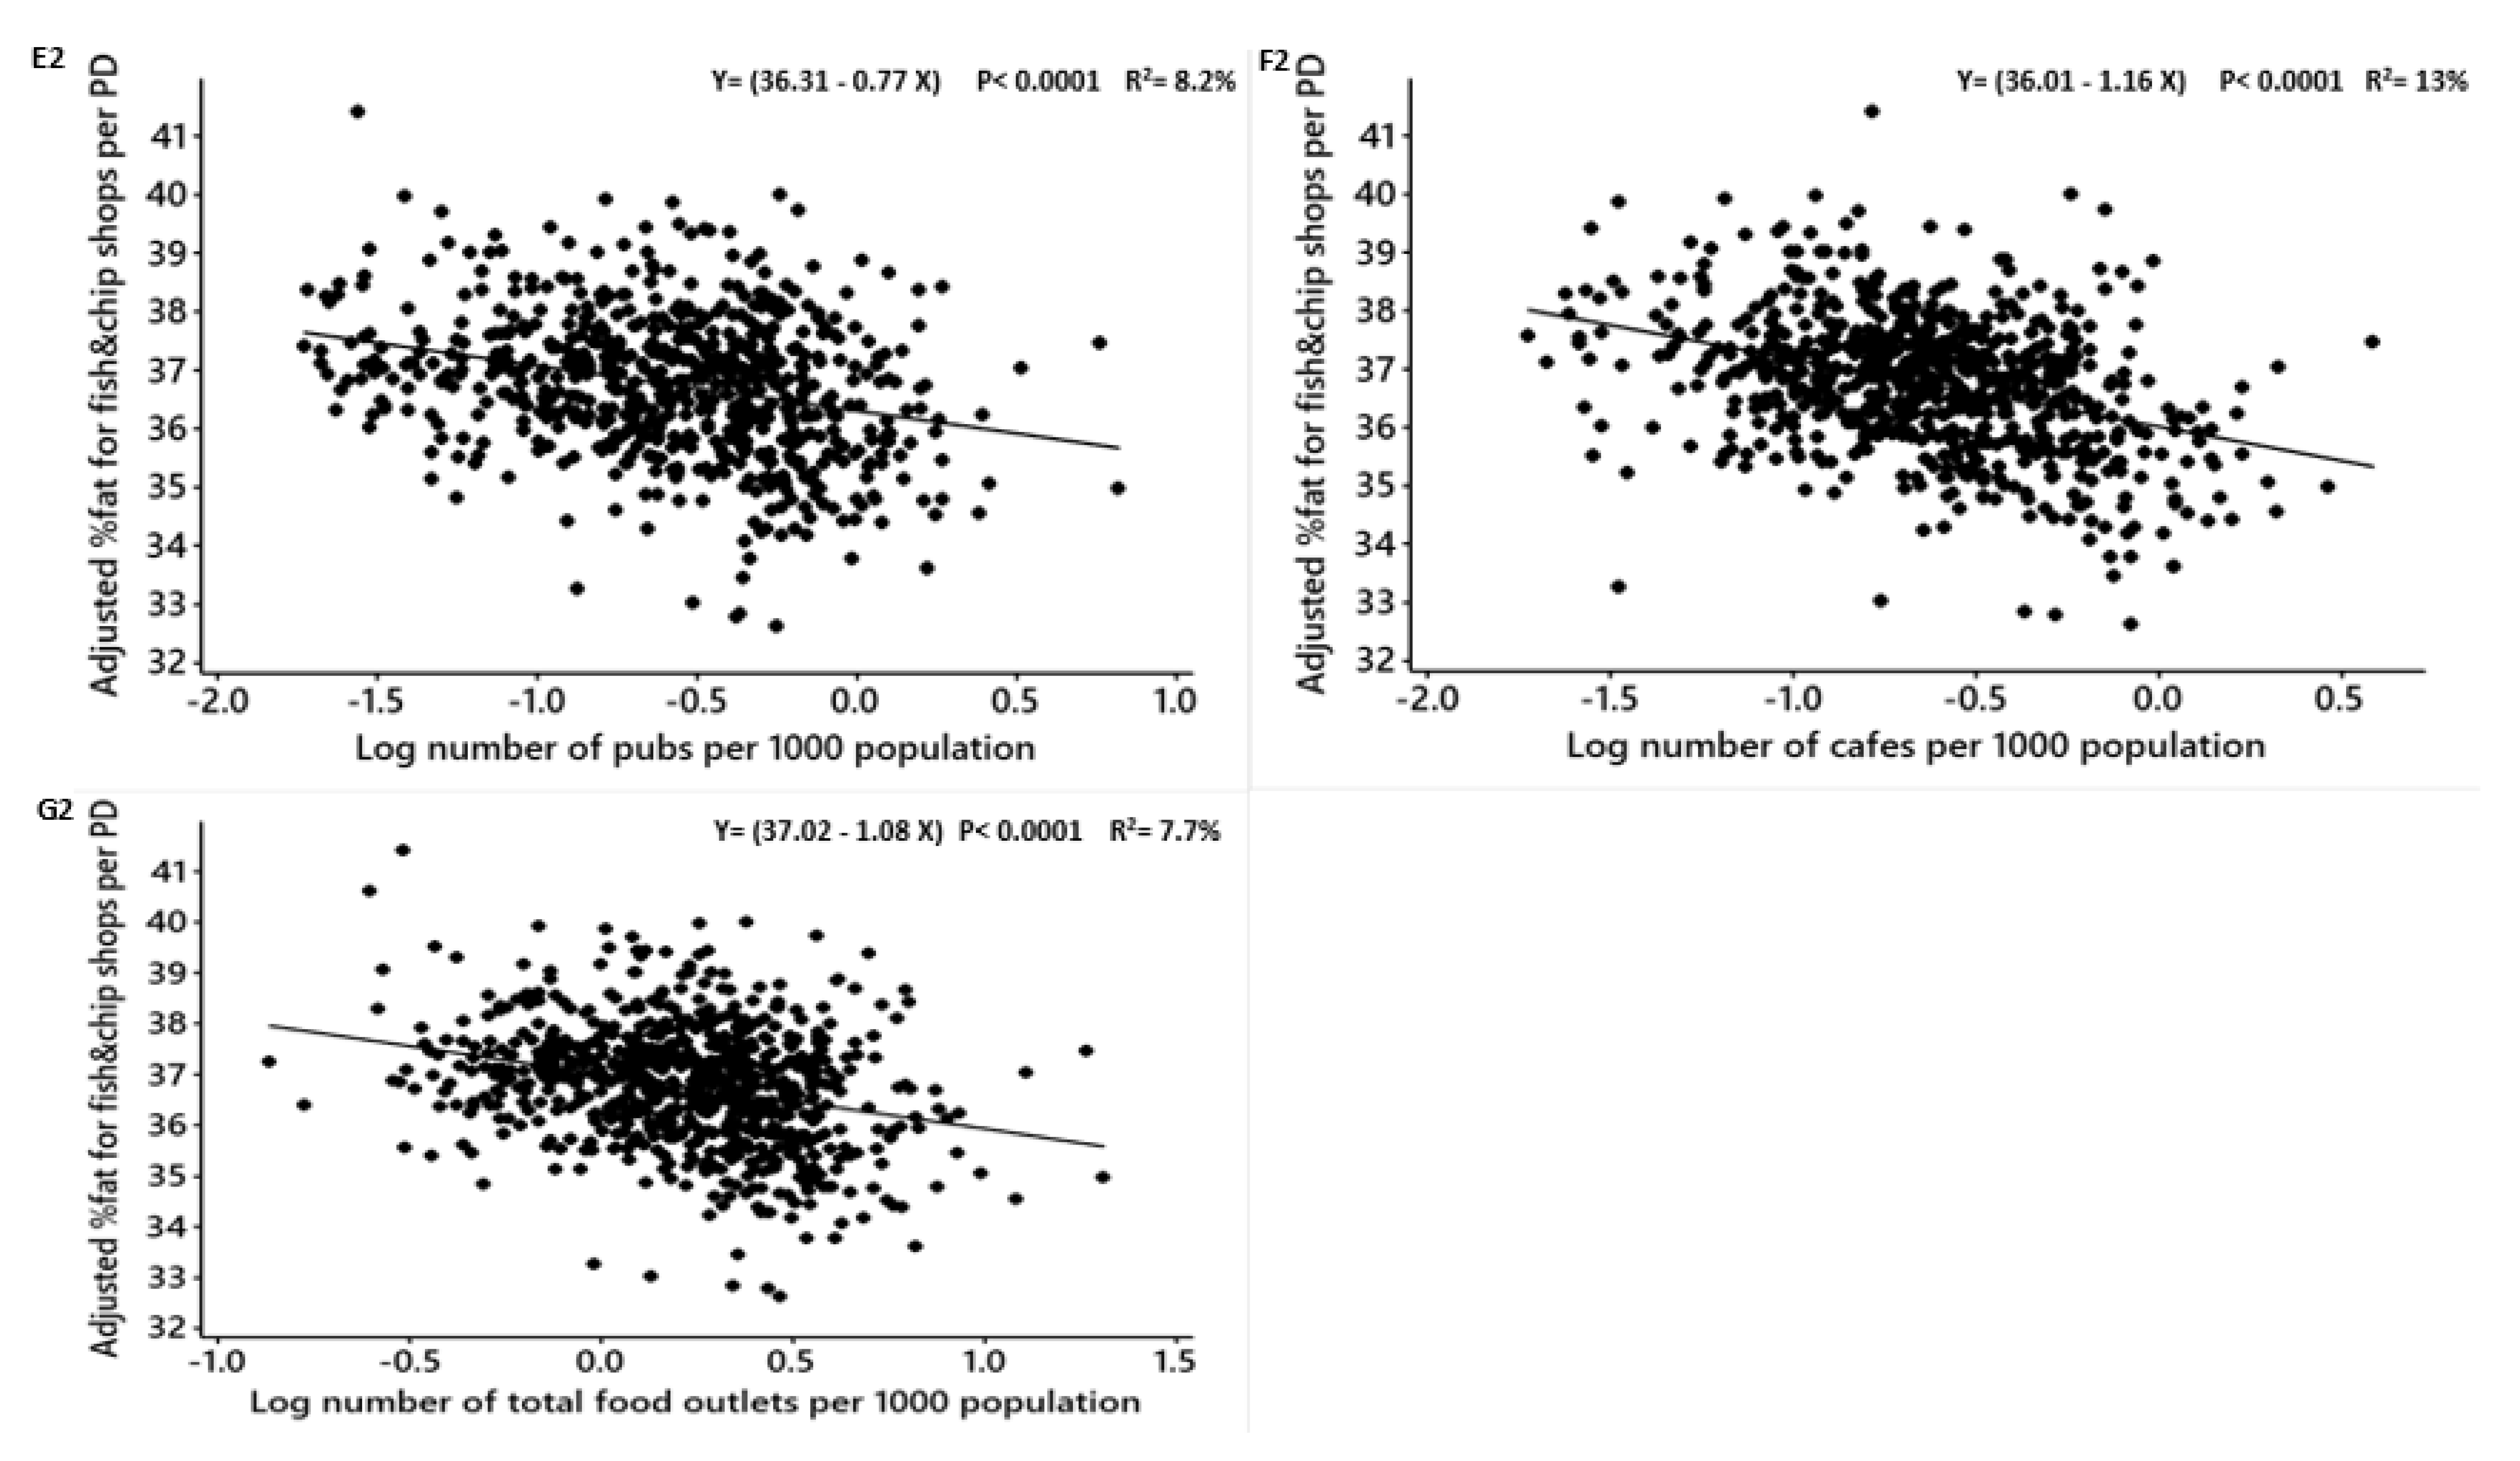
| Pubs | −0.81 | −0.55 | −1.01, −0.61 | 7.70 | −7.92 | <0.0001 | E 2 | |
| Cafes | −1.23 | −0.70 | −1.45, −1.01 | 13.22 | −11.08 | <0.0001 | F 2 | |
| Fish and chip shops | 0.88 | 1.41 | 0.59, 1.17 | 4.65 | 6.04 | <0.0001 | G 2 | |
| Total food outlets (combined) | −1.02 | −0.63 | −1.29, −0.75 | 6.15 | −7.49 | <0.0001 | H 2 | |
| Adjusted mean WHR | FFRs | −0.0005 | −0.0004 | −0.002, 0.001 | 0.06 | −0.70 | 0.48 | A 3 |
| FSRs | −0.002 | −0.001 | −0.004, −0.001 | 1.72 | −3.87 | <0.0001 | B 3 | |
| Delivery shops | 0.001 | 0.001 | −0.001, 0.005 | 0.27 | 1.00 | 0.31 | C 3 | |
| Takeaways | −0.002 | −0.001 | −0.005, −0.0004 | 0.82 | −2.31 | 0.02 | D 3 | |
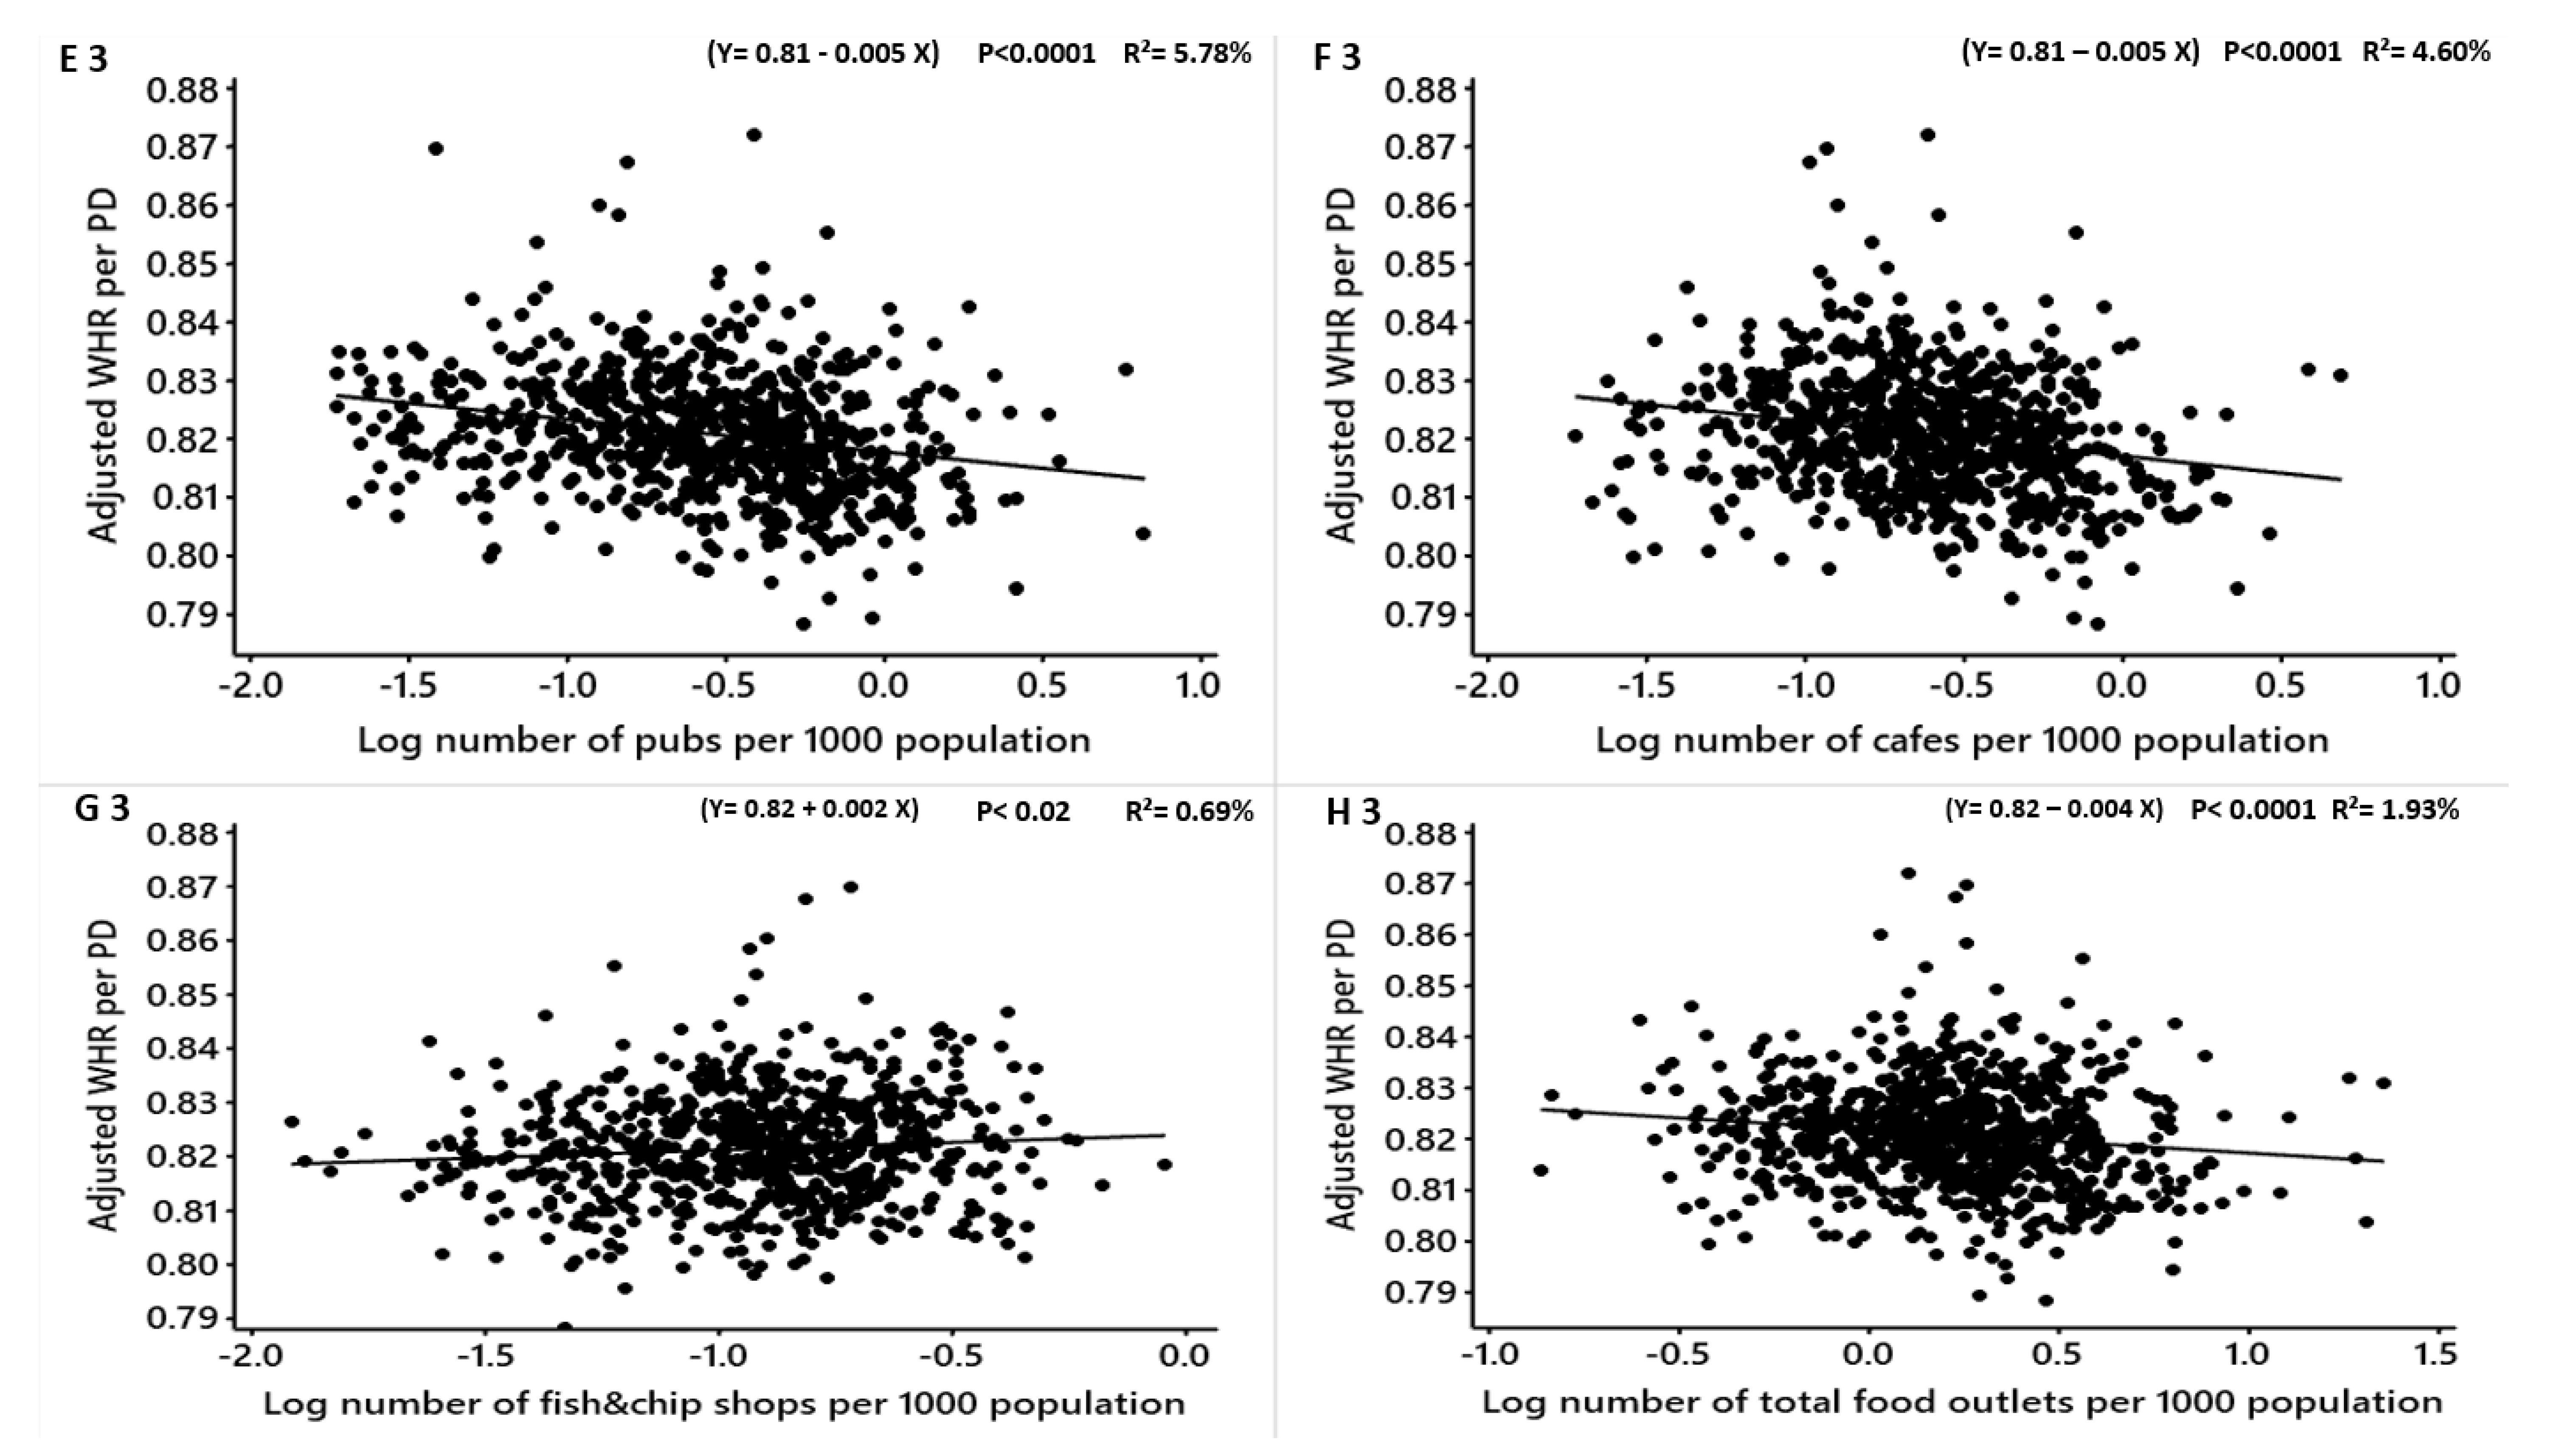
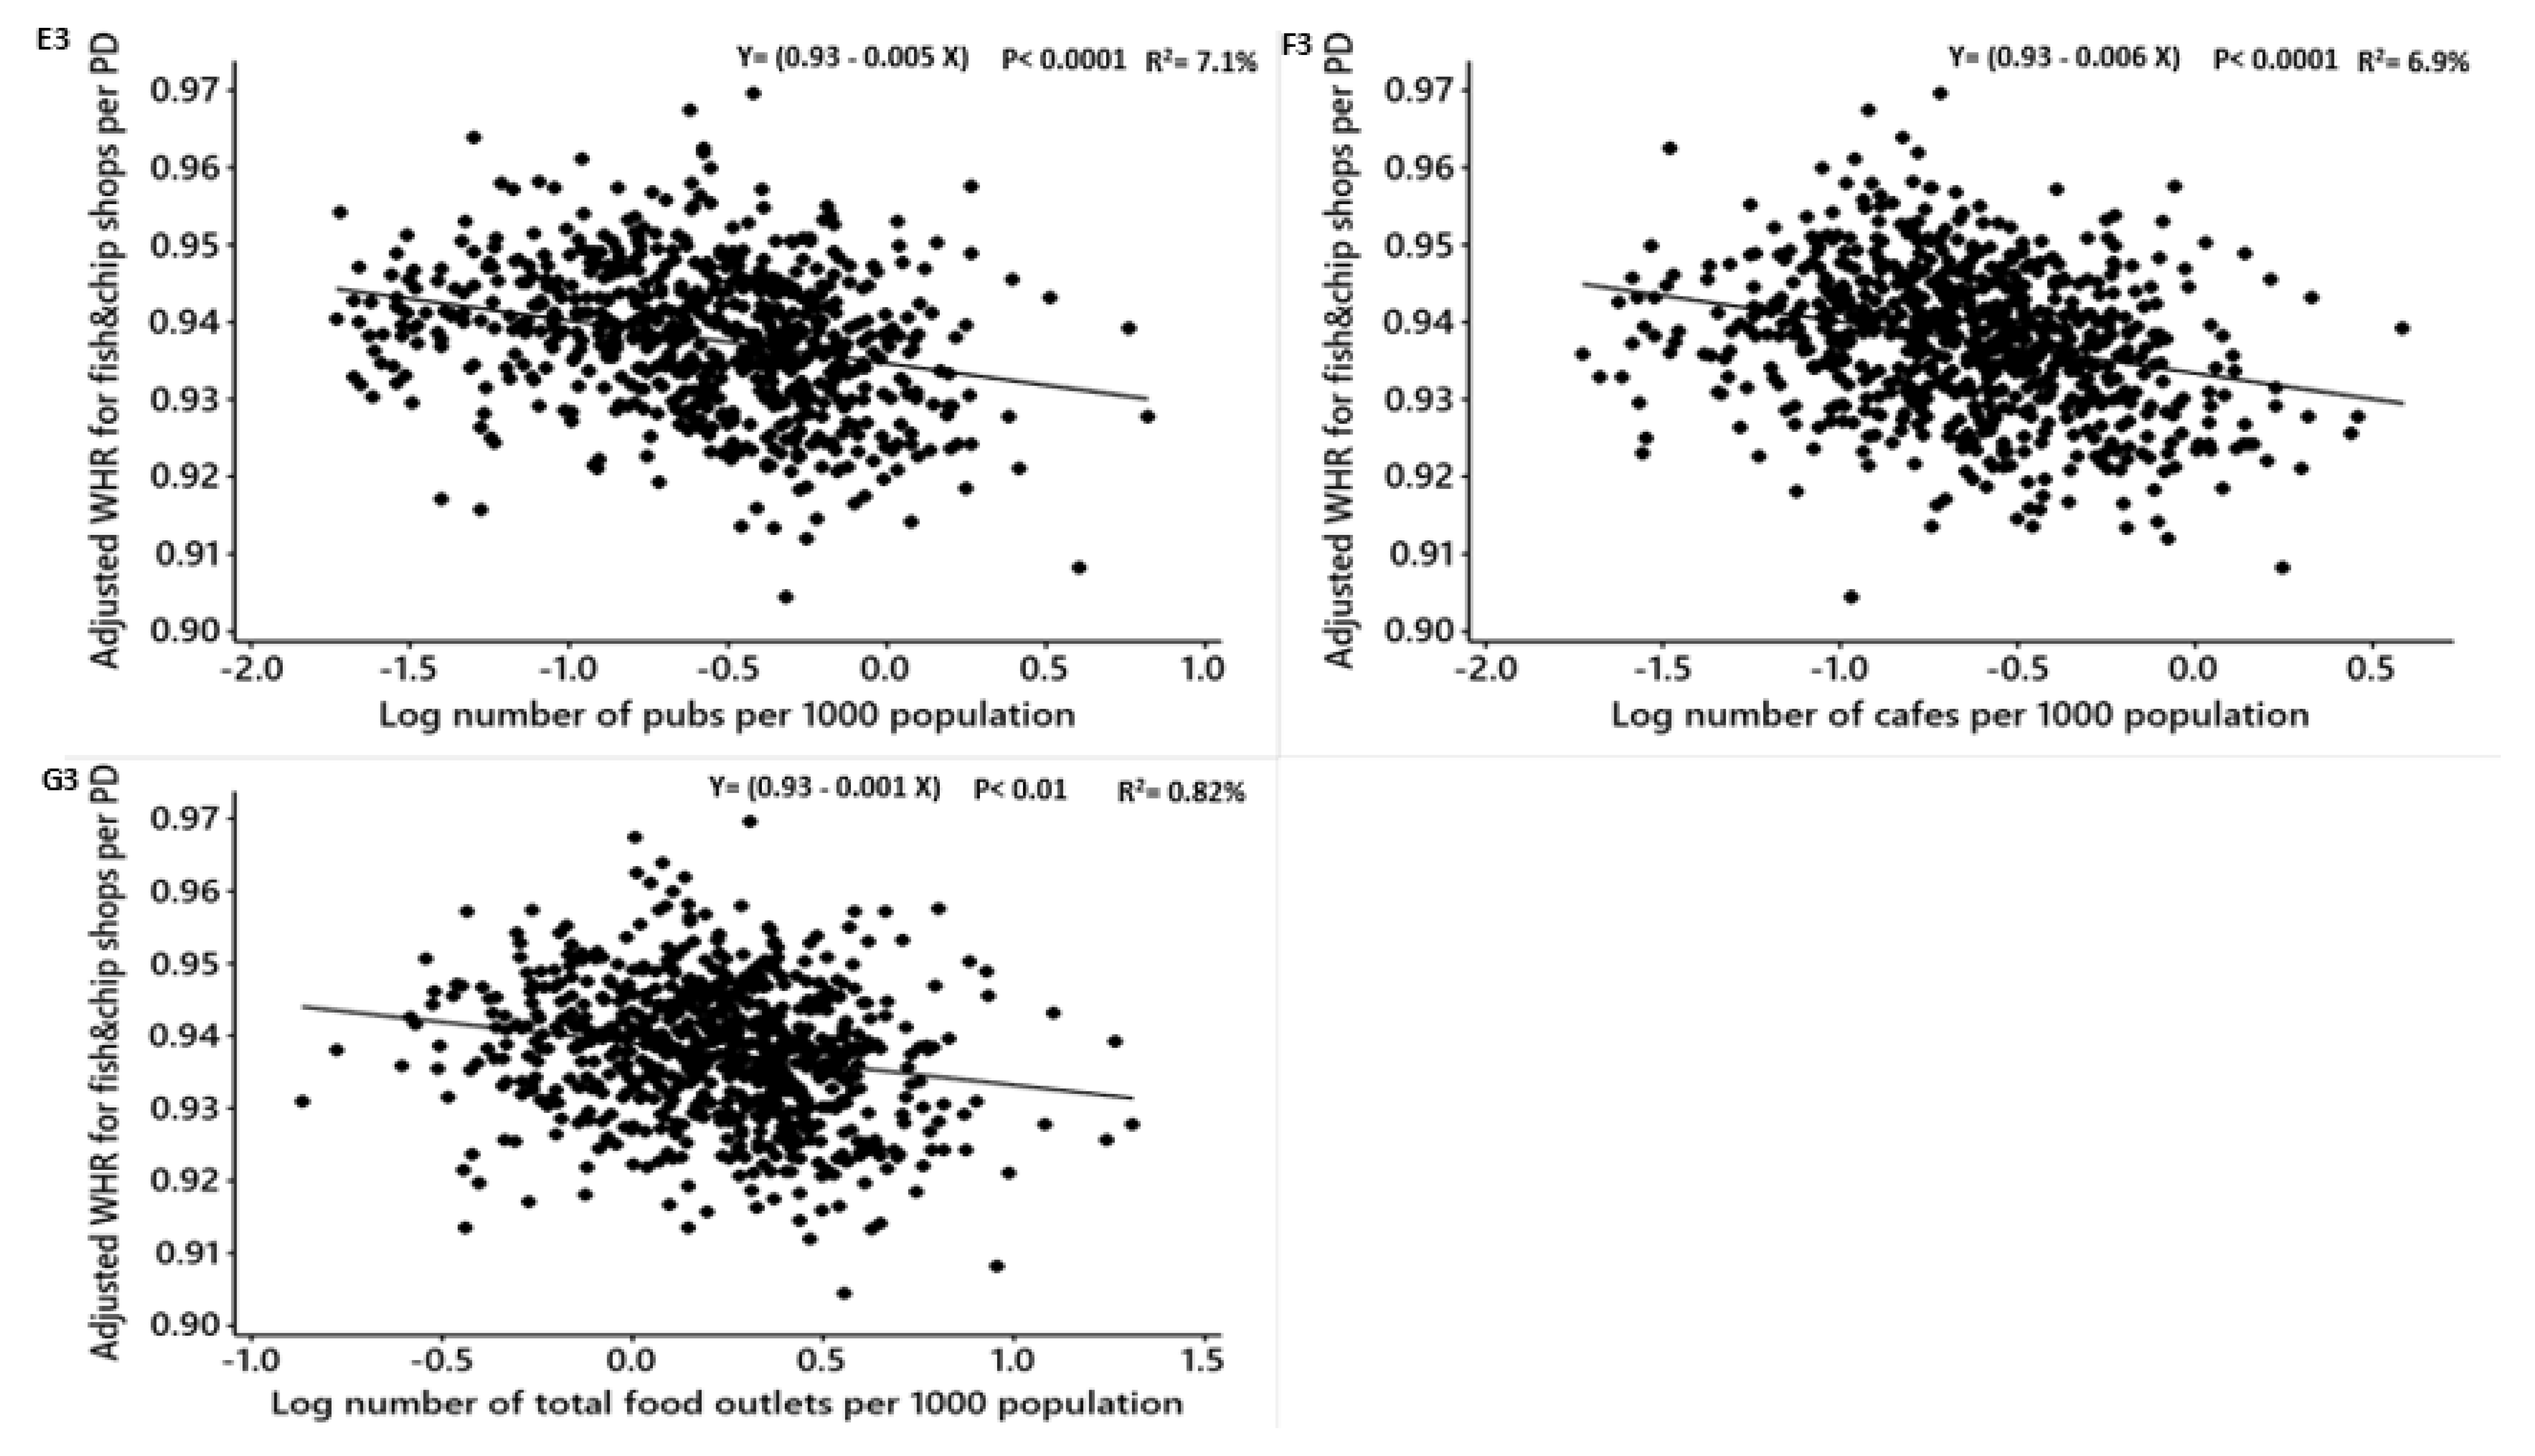
| Pubs | −0.006 | −0.0059 | −0.007, −0.003 | 5.78 | −6.79 | <0.0001 | E 3 | |
| Cafes | −0.0059 | −0.0058 | −0.007, −0.004 | 4.60 | −6.23 | <0.0001 | F 3 | |
| Fish and chip shops | 0.003 | 0.002 | 0.0003, 0.005 | 0.69 | 2.27 | 0.02 | G 3 | |
| Total food outlets (combined) | −0.004 | −0.003 | −0.006, −0.002 | 1.93 | −4.10 | <0.0001 | H 3 |
| Obesity Measure Adjusted for Fish and Chip Shops | Type of Food Outlet | β | Converted β | 99% CI | R2 (%) | t | Adjusted P-Value | Figure 5 |
|---|---|---|---|---|---|---|---|---|
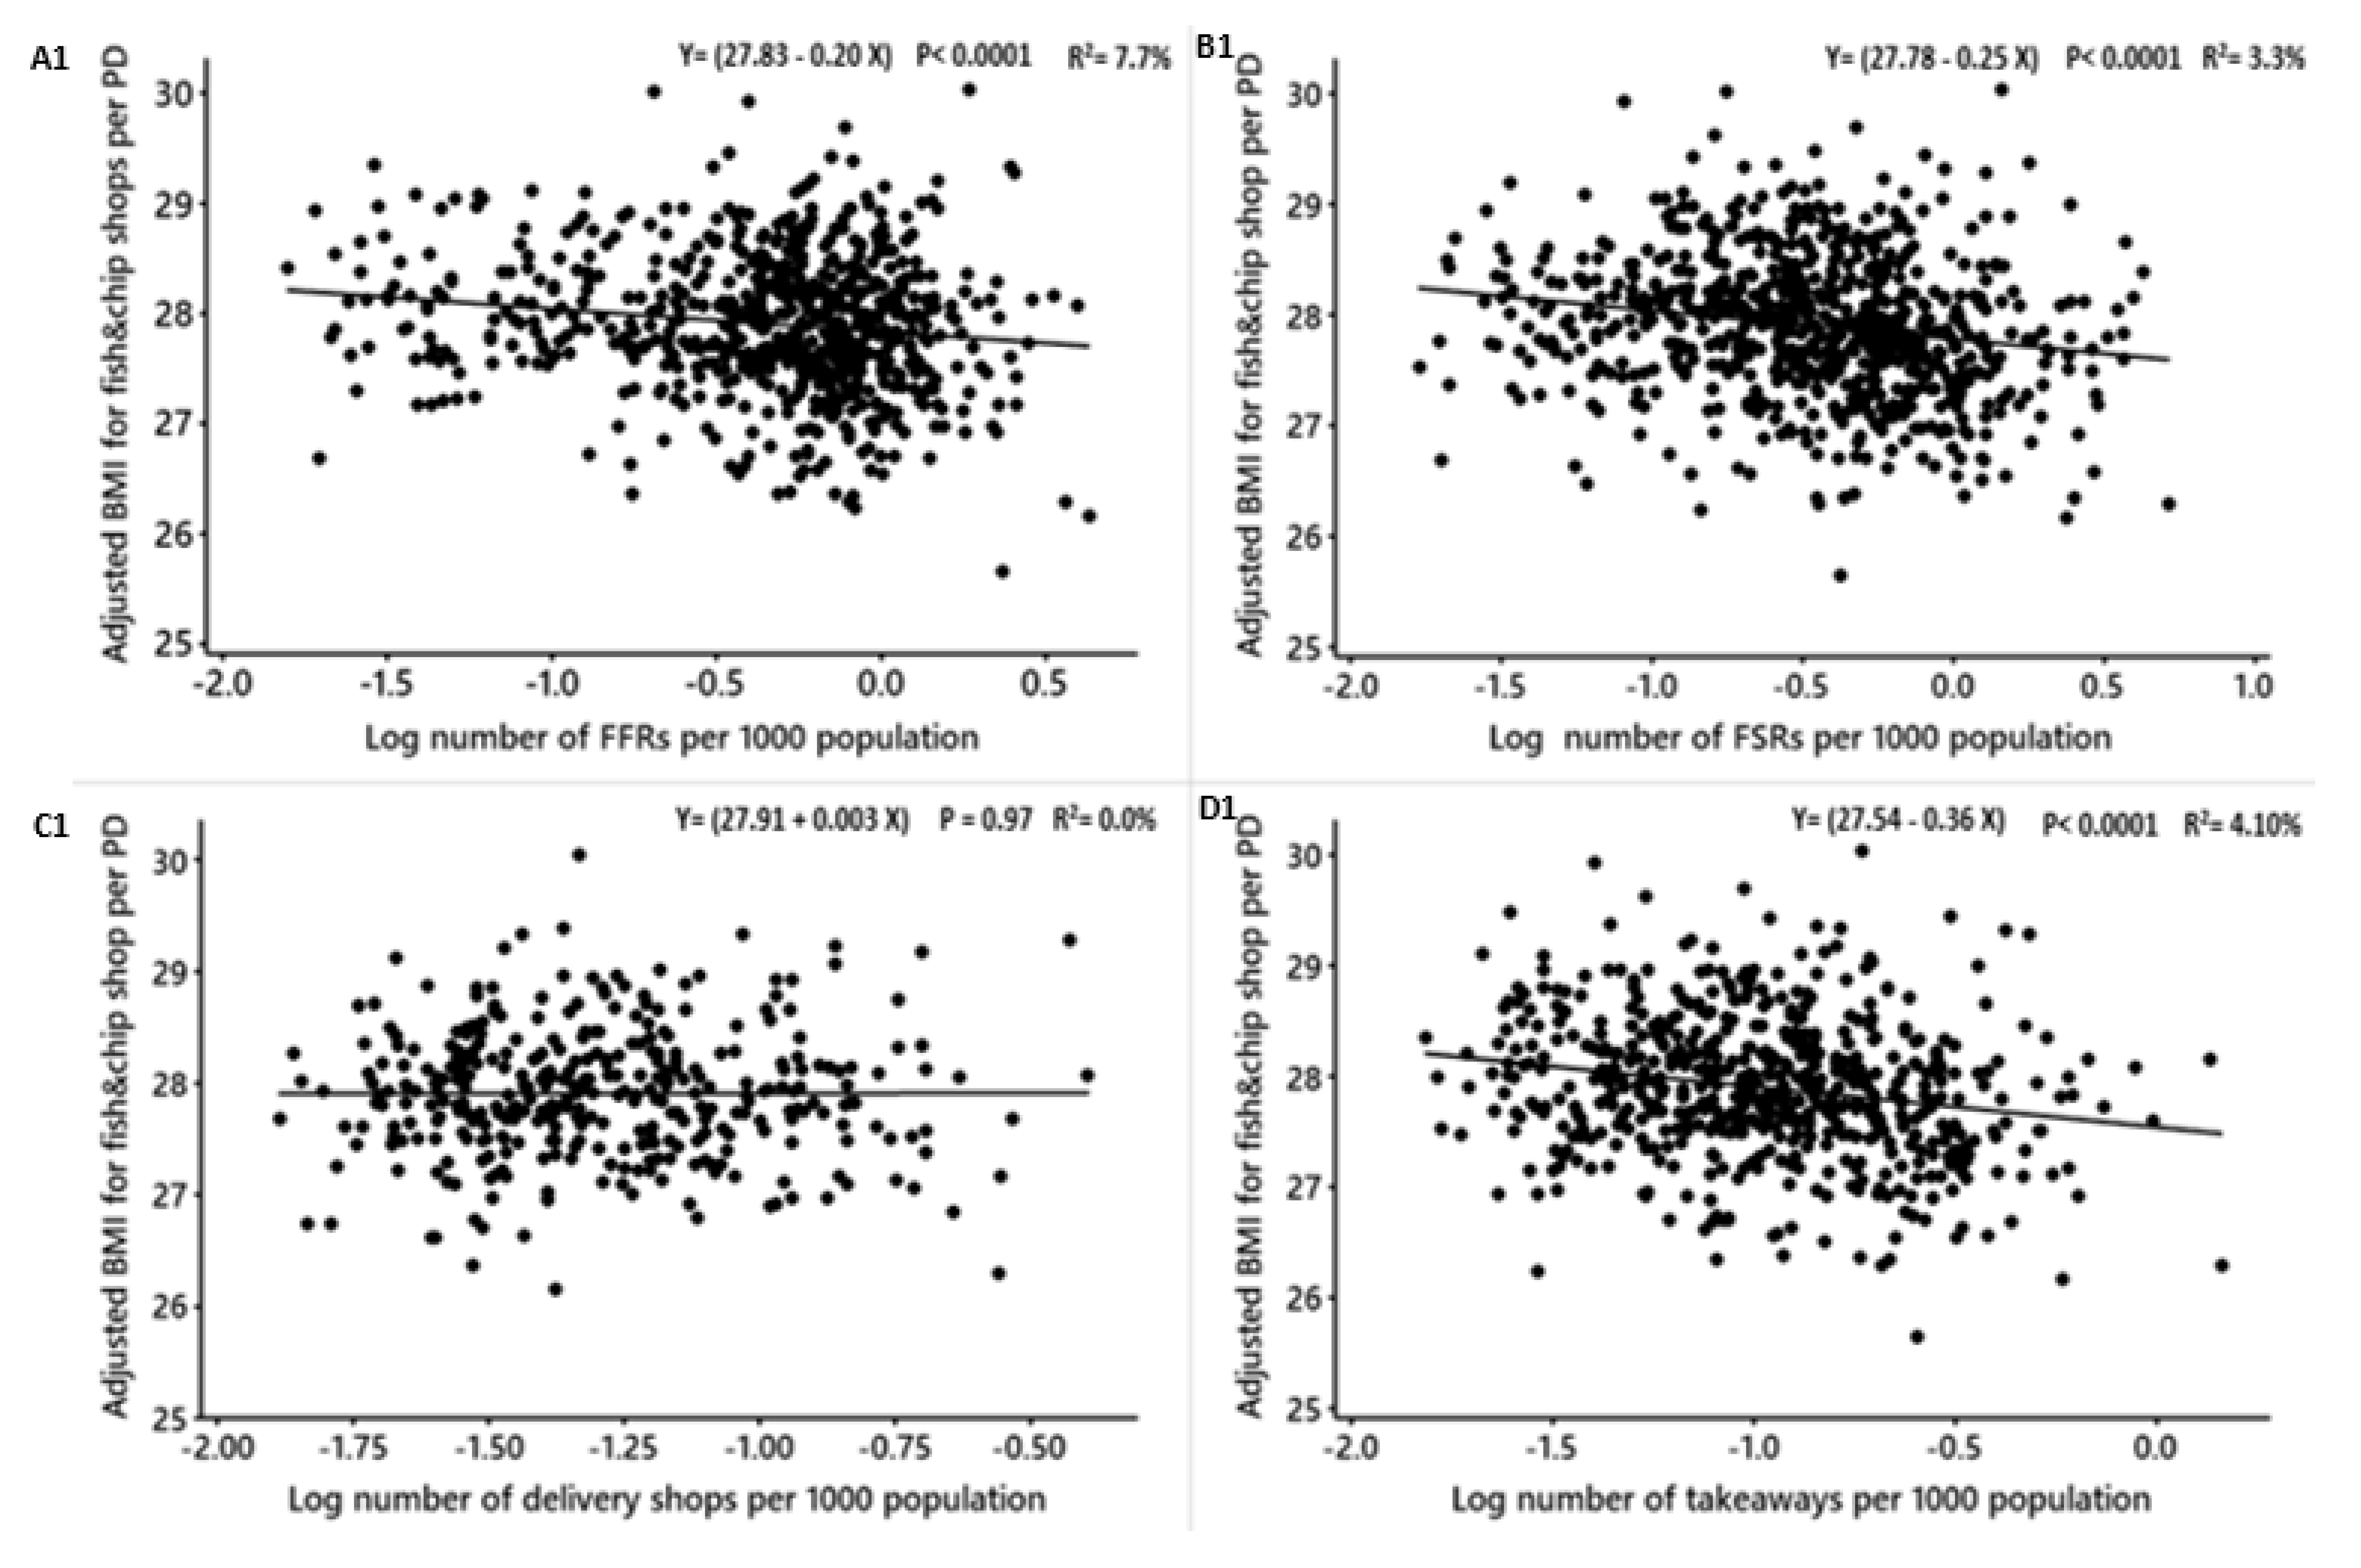
| Adjusted mean BMI | FFRs | −0.20 | −0.181 | −0.31, −0.10 | 2.2 | −3.94 | 0.0001 | A1 |
| FSRs | −0.2 | −0.181 | −0.35, −0.15 | 3.3 | −5.11 | 0.0001 | B1 | |
| Delivery | 0.003 | 0.0030 | −0.21, 0.21 | 0 | 0.03 | 0.9 | C1 | |
| Takeaways | −0.3 | −0.25 | −0.50, −0.22 | 4.1 | −5.02 | 0.0001 | D1 | |
| Pubs | −0.3 | −0.25 | −0.49, −0.28 | 7.4 | −7.30 | 0.0001 | E1 | |
| Cafes | −0.6 | −0.45 | −0.71, −0.48 | 12.8 | −10.28 | 0.0001 | F1 | |
| Total food outlets (combined) | −0.5 | −0.39 | −0.69, −0.41 | 7.3 | −7.67 | 0.0001 | G1 | |
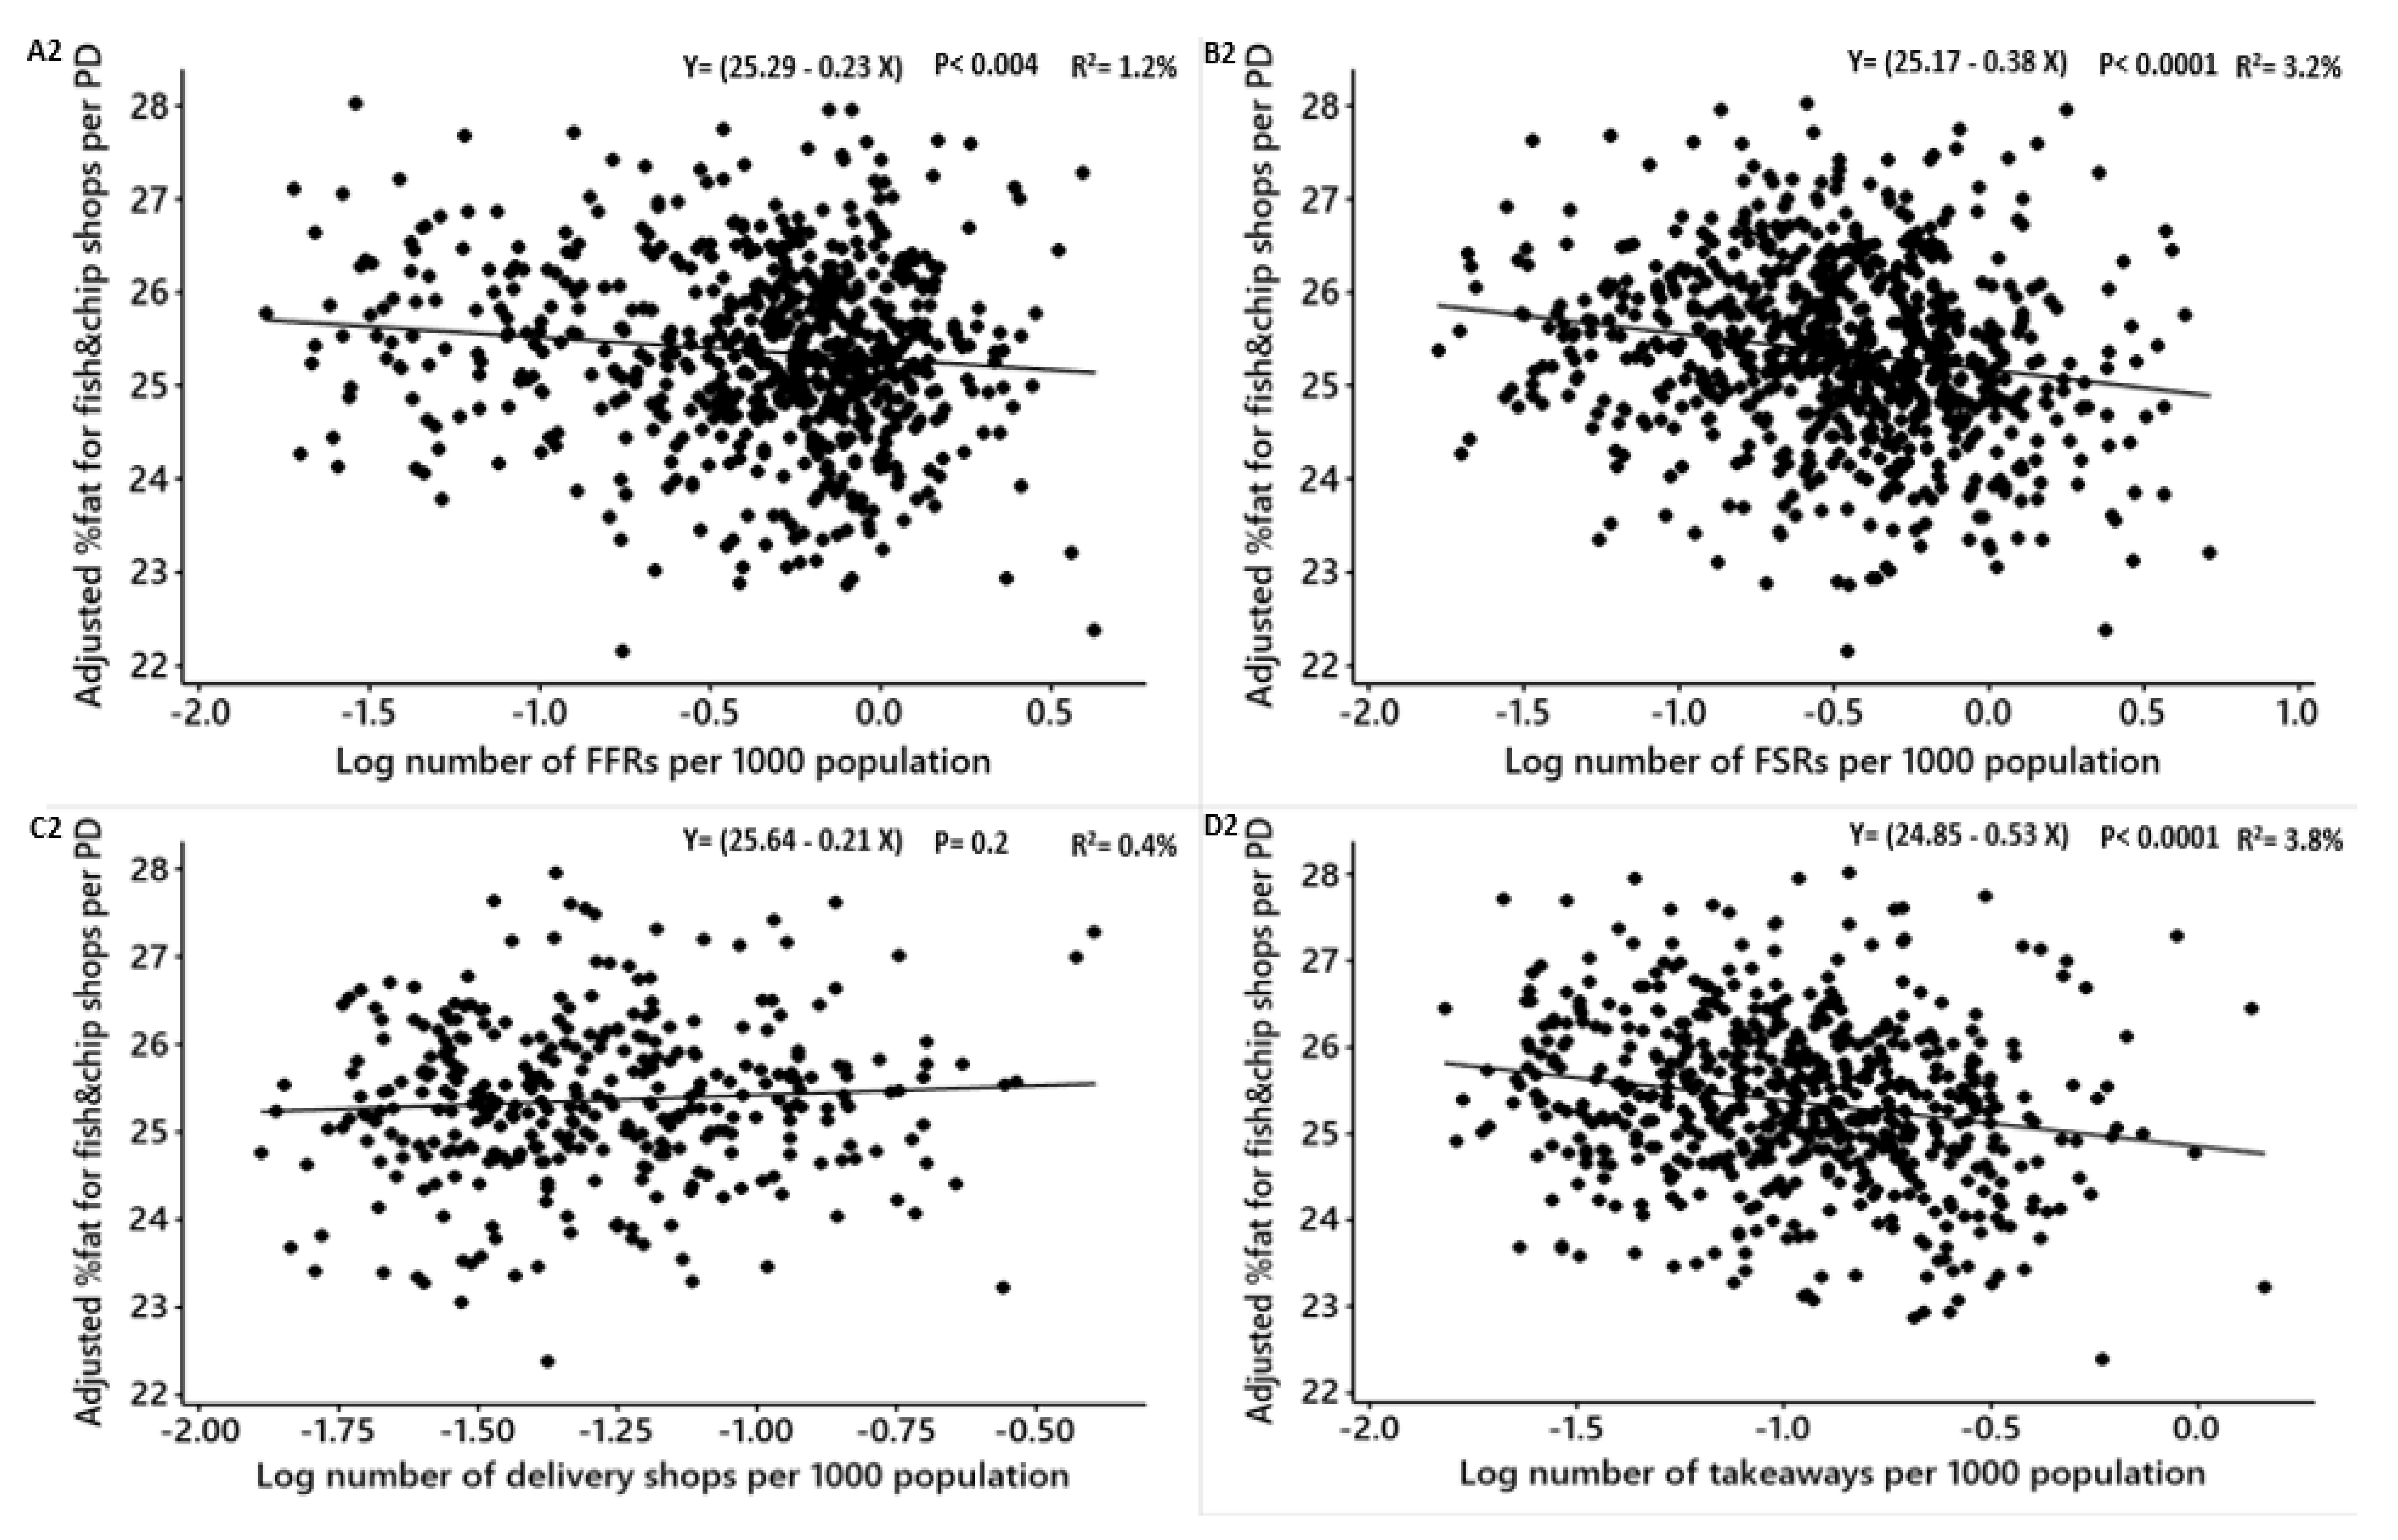
| Adjusted mean %fat | FFRs | −0.2 | −0.18 | −0.39, −0.07 | 1.2 | −2.88 | 0.004 | A2 |
| FSRs | −0.3 | −0.25 | −0.54, −0.23 | 3.2 | −5.03 | 0.0001 | B2 | |
| Delivery | 0.2 | 0.22 | −0.11, 0.55 | 0.4 | 1.27 | 0.2 | C2 | |
| Takeaways | −0.5 | −0.39 | −0.74, −0.31 | 3.8 | −4.84 | 0.0001 | D2 | |
| Pubs | −0.5 | −0.39 | −0.71, −0.40 | 6.8 | −7.00 | 0.0001 | E2 | |
| Cafes | −0.8 | −0.55 | −1.03, −0.67 | 11.1 | −9.48 | 0.0001 | F2 | |
| Total food outlets (combined) | −0.7 | −0.50 | −0.92, −0.49 | 5.1 | −6.37 | 0.0001 | G2 | |
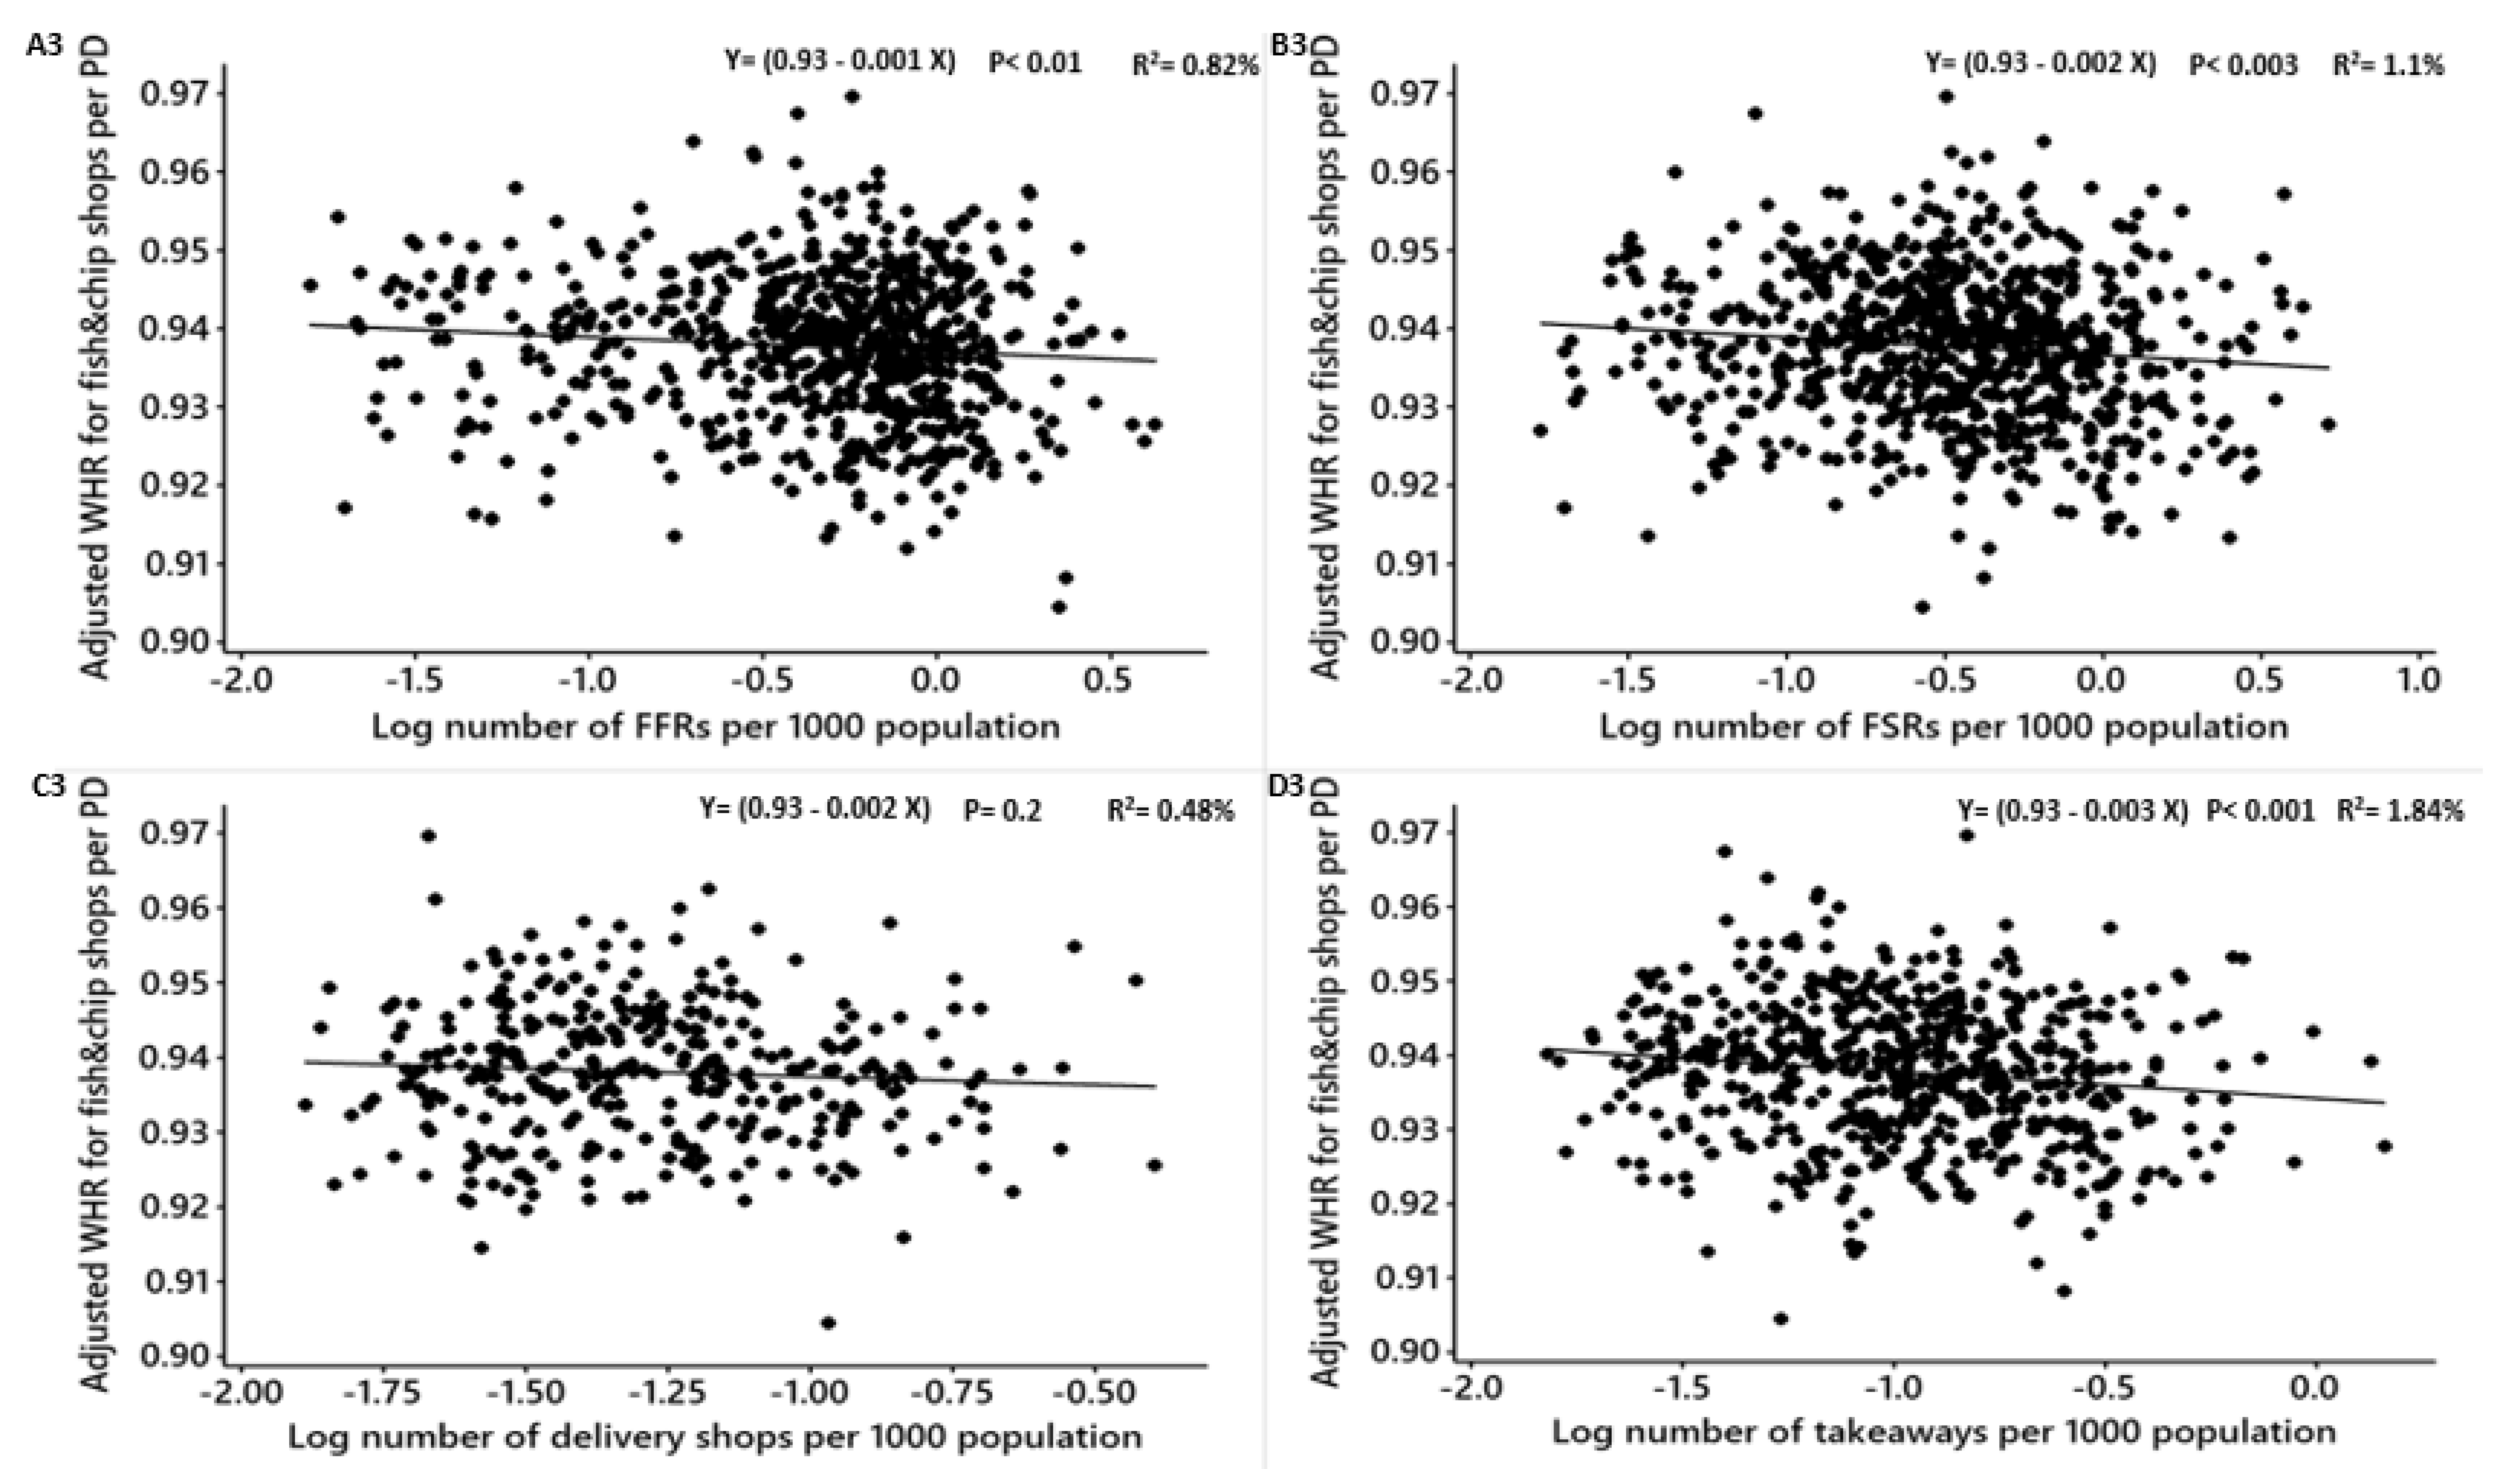
| Adjusted mean WHR | FFRs | −0.001 | −0.0009 | −0.0034, −0.00032 | 0.82 | −2.37 | 0.01 | A3 |
| FSRs | −0.002 | −0.0019 | −0.0034, −0.0007 | 1.17 | −2.98 | 0.003 | B3 | |
| Delivery | 0.002 | 0.0020 | −0.005, 0.001 | 0.48 | −1.28 | 0.20 | C3 | |
| Takeaways | −0.003 | −0.0029 | −0.005, −0.0001 | 1.84 | −3.32 | 0.001 | D3 | |
| Pubs | −0.005 | −0.0049 | −0.007, −0.004 | 7.1 | −7.13 | 0.0001 | E3 | |
| Cafes | −0.006 | −0.0059 | −0.008, −0.004 | 6.9 | −7.33 | 0.0001 | F3 | |
| Total food outlets (combined) | −0.005 | −0.0049 | −0.007, −0.003 | 3.6 | −5.29 | 0.0001 | G3 |
| Obesity Measure Adjusted for Fish and Chip Shops | Type of Food Outlet | β | Converted β | 99% CI | R2 (%) | t | Adjusted P-Value | Figure 6 |
|---|---|---|---|---|---|---|---|---|
| Adjusted mean BMI | FFRs | −0.26 | −0.22 | −0.44, −0.07 | 1.9 | −3.6 | 0.0001 | A1 |
| FSRs | −0.44 | −0.32 | −0.61, −0.26 | 5.5 | −6.6 | 0.0001 | B1 | |
| Delivery | 0.14 | 0.15 | −0.23, 0.52 | 0.30 | 1.01 | 0.3 | C1 | |
| Takeaways | −0.5 | −0.39 | −0.75, −0.25 | 4.4 | −5.25 | 0.0001 | D1 | |
| Pubs | −0.5 | −0.39 | −0.33, −0.04 | 9.1 | −8.20 | 0.0001 | E1 | |
| Cafes | −0.9 | −0.59 | −1.09, −0.70 | 16.5 | −11.92 | 0.0001 | F1 | |
| Total food outlets (combined) | −0.8 | −0.55 | −0.1.05, −0.55 | 8.6 | −8.42 | 0.0001 | G1 | |
| Adjusted mean %fat | FFRs | −0.3 | −0.25 | −0.60, −0.07 | 1.6 | −3.33 | 0.001 | A2 |
| FSRs | −0.5 | −0.39 | −0.8, −0.33 | 4.7 | −6.12 | 0.0001 | B2 | |
| Delivery | 0.2 | 0.22 | −0.28, −0.80 | 0.4 | 1.22 | 0.2 | C2 | |
| Takeaways | −0.6 | −0.45 | −1.03, −0.32 | 3.9 | −4.93 | 0.0001 | D2 | |
| Pubs | −0.7 | −0.50 | −1.03, −0.51 | 8.7 | −7.71 | 0.0001 | E2 | |
| Cafes | −1.1 | −0.66 | −1.44, −0.87 | 13.4 | −10.58 | 0.0001 | F2 | |
| Total food outlets (combined) | −1.08 | −0.66 | −1.44, 0.73 | 7.7 | −7.93 | 0.0001 | G2 | |
| Adjusted mean WHR | FFRs | −0.0009 | −0.0009 | −0.003, −0.001 | 0.17 | −1.08 | 0.28 | A3 |
| FSRs | −0.002 | −0.0019 | −0.005, −0.0008 | 1.75 | −3.65 | 0.0001 | B3 | |
| Delivery | 0.0008 | −0.003, 0.005 | 0.07 | 0.47 | 0.63 | C3 | ||
| Takeaways | −0.003 | −0.0029 | −0.006, 0.0001 | 1.26 | −2.74 | 0.006 | D3 | |
| Pubs | −0.005 | −0.0049 | −0.007, −0.003 | 5.33 | −6.12 | 0.0001 | E3 | |
| Cafes | −0.005 | −0.0049 | −0.007, −0.002 | 3.91 | −5.40 | 0.0001 | F3 | |
| Total food outlets (combined) | −0.005 | −0.0049 | −0.008, −0.002 | 2.4 | −4.31 | 0.0001 | G3 |
© 2020 by the authors. Licensee MDPI, Basel, Switzerland. This article is an open access article distributed under the terms and conditions of the Creative Commons Attribution (CC BY) license (http://creativecommons.org/licenses/by/4.0/).
Share and Cite
Albalawi, A.; Hambly, C.; Speakman, J. Associations of Food Outlet Densities with Obesity Measures Identify Fish and Chip Shops as a Uniquely Important Problem. Nutrients 2020, 12, 890. https://doi.org/10.3390/nu12040890
Albalawi A, Hambly C, Speakman J. Associations of Food Outlet Densities with Obesity Measures Identify Fish and Chip Shops as a Uniquely Important Problem. Nutrients. 2020; 12(4):890. https://doi.org/10.3390/nu12040890
Chicago/Turabian StyleAlbalawi, Ahmad, Catherine Hambly, and John Speakman. 2020. "Associations of Food Outlet Densities with Obesity Measures Identify Fish and Chip Shops as a Uniquely Important Problem" Nutrients 12, no. 4: 890. https://doi.org/10.3390/nu12040890
APA StyleAlbalawi, A., Hambly, C., & Speakman, J. (2020). Associations of Food Outlet Densities with Obesity Measures Identify Fish and Chip Shops as a Uniquely Important Problem. Nutrients, 12(4), 890. https://doi.org/10.3390/nu12040890