Metabolic Effects of Resistant Starch Type 2: A Systematic Literature Review and Meta-Analysis of Randomized Controlled Trials

 ,
, 
Abstract
1. Introduction
1.1. Methods
1.1.1. Study Identification
1.1.2. Screening and Eligibility
1.1.3. Risk of Bias Assessment
1.1.4. Data Extraction and Statistical Methods
2. Results
2.1. Description of Selected Trials
2.2. Study Risk of Bias
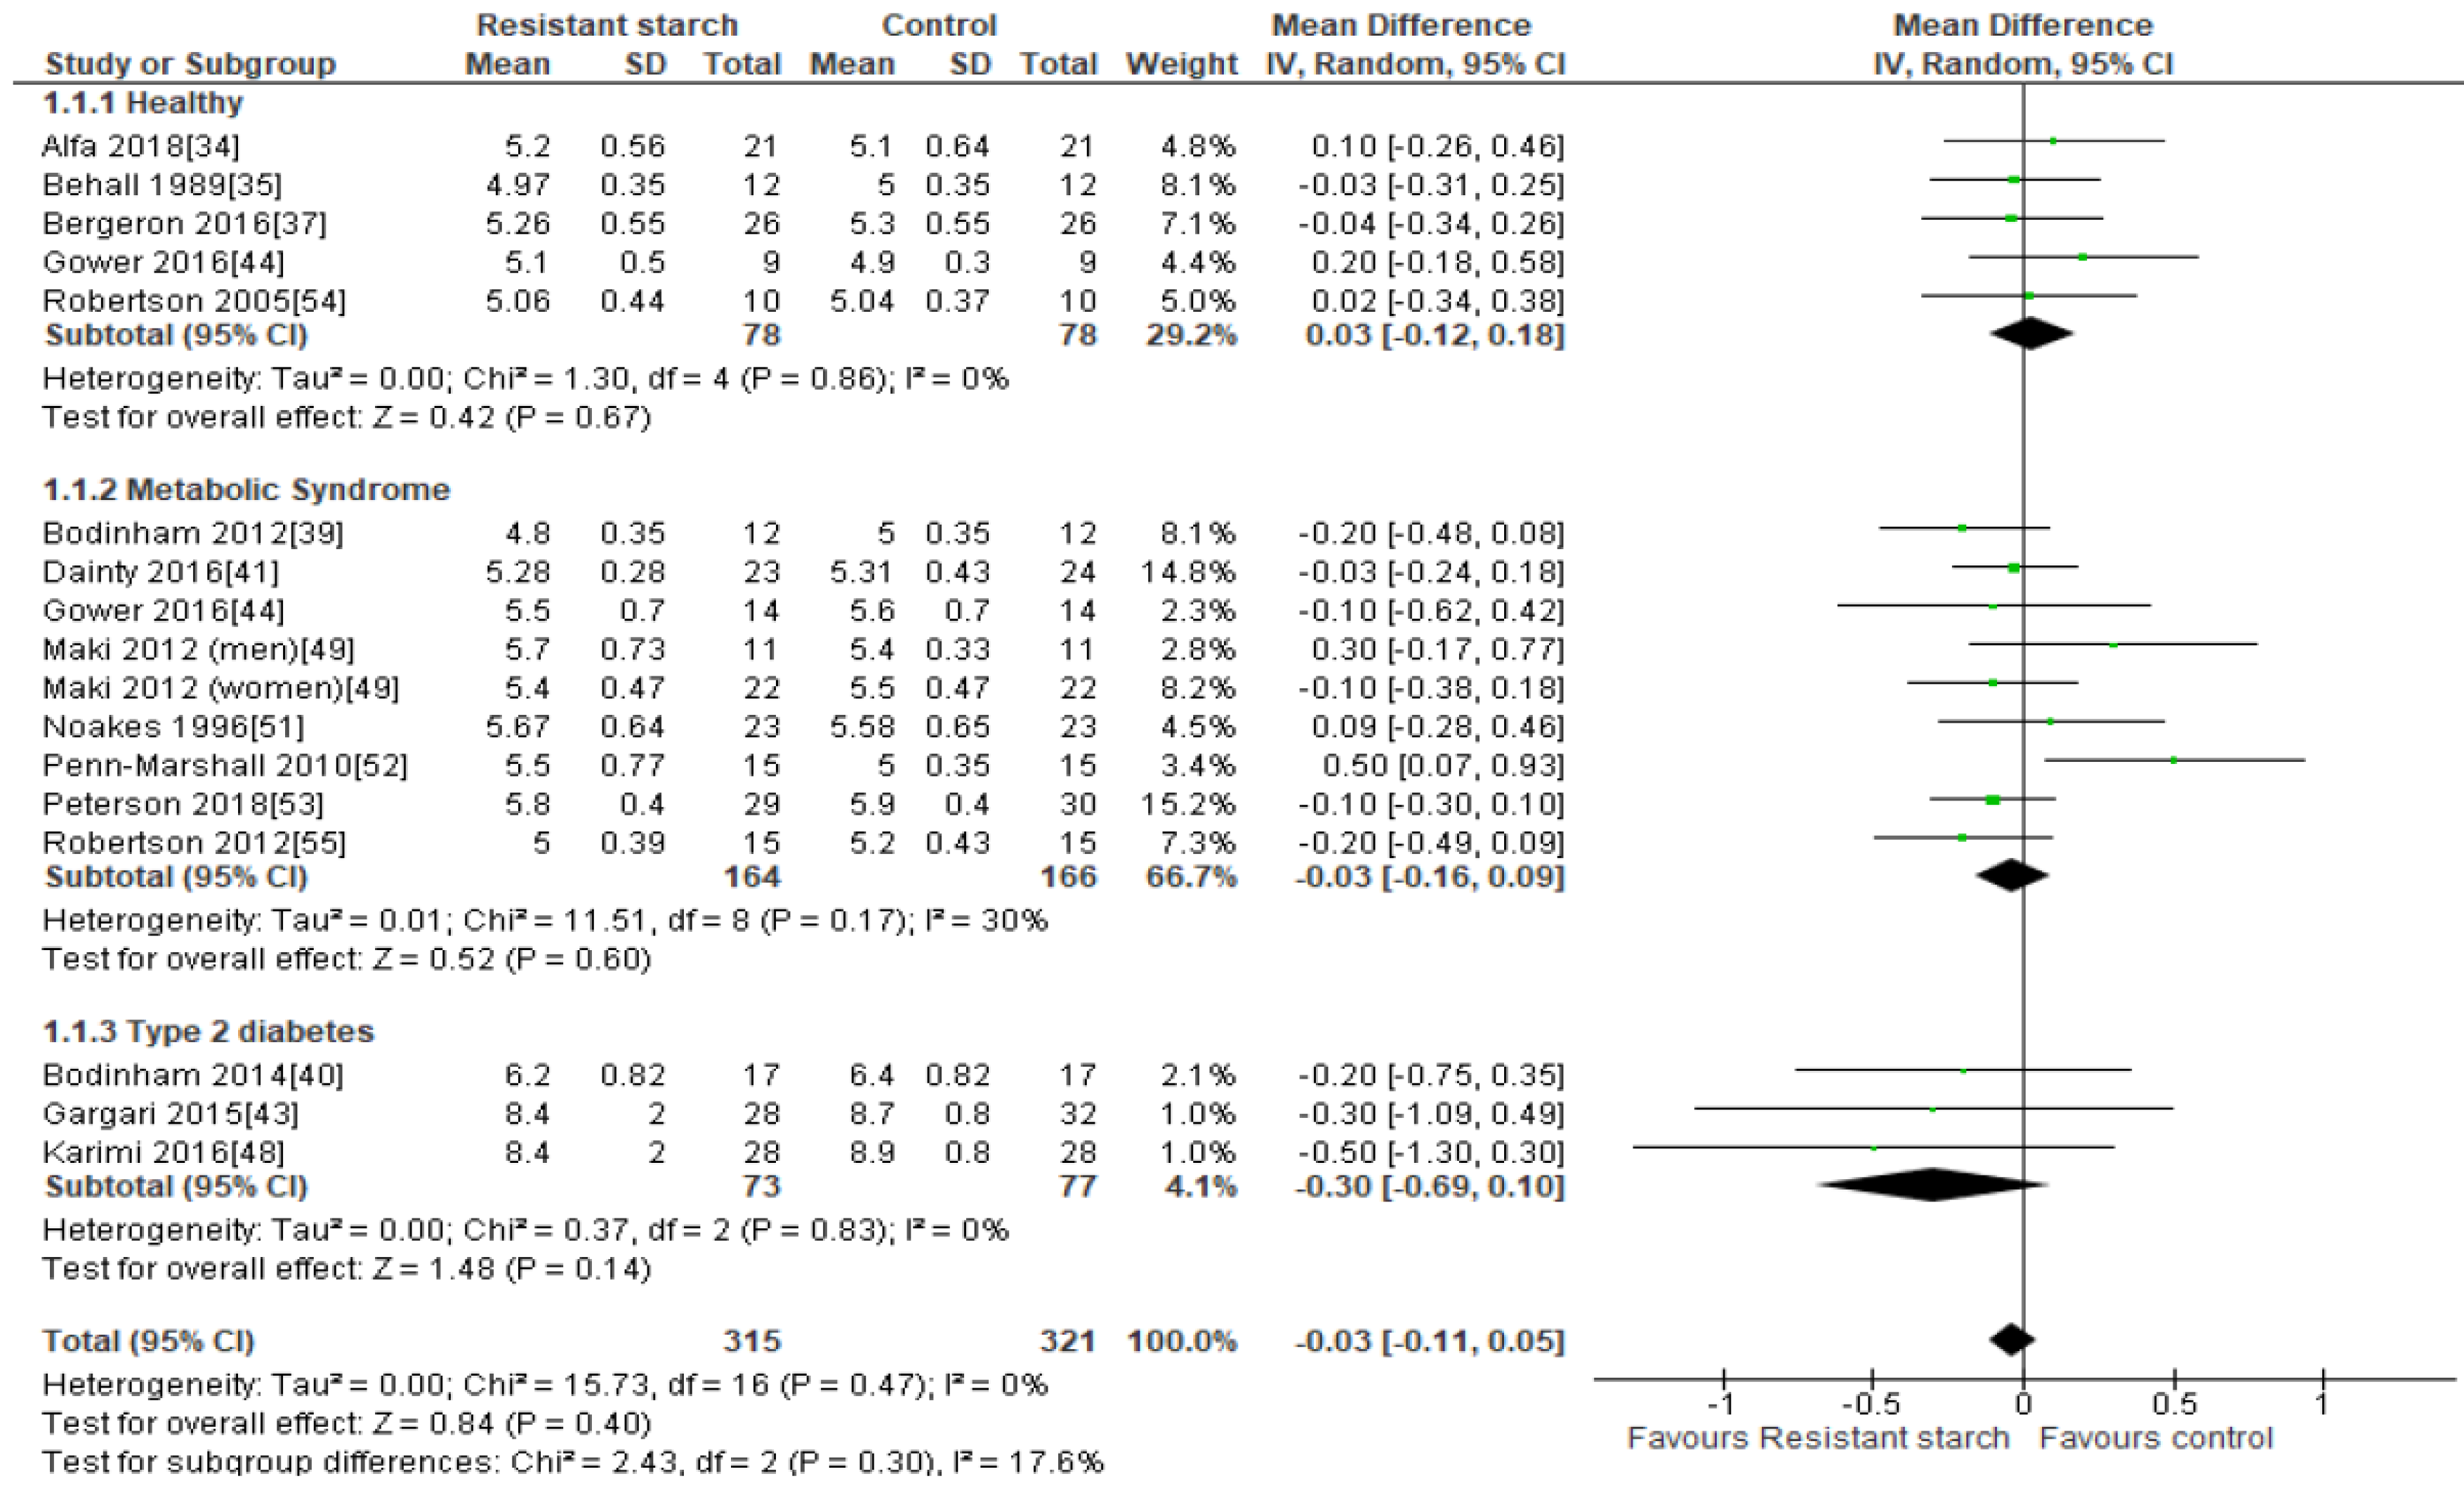
2.3. Fasting Plasma Glucose
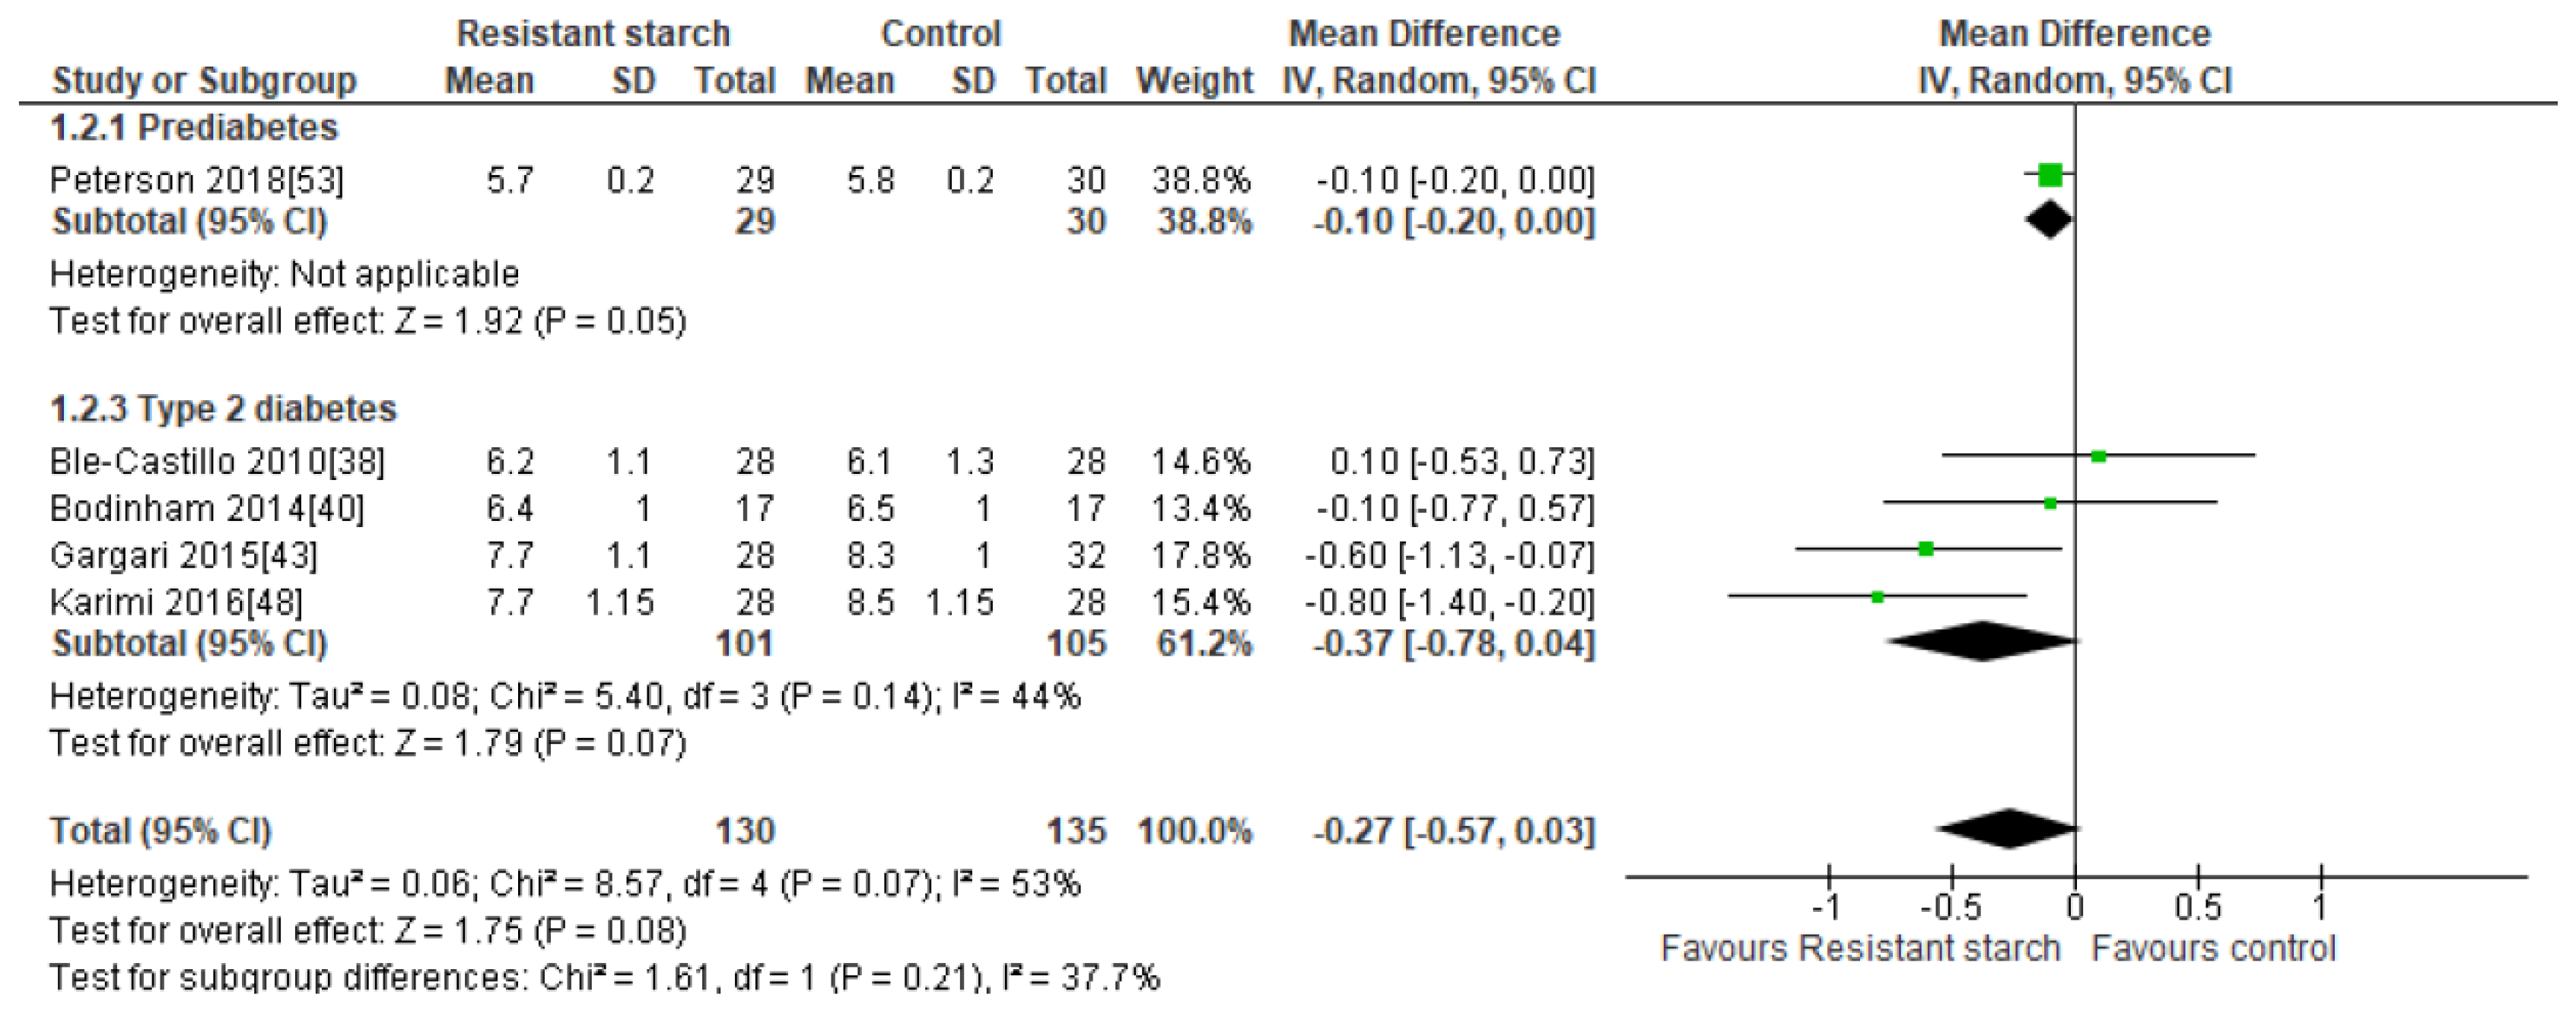
2.4. HbA1c
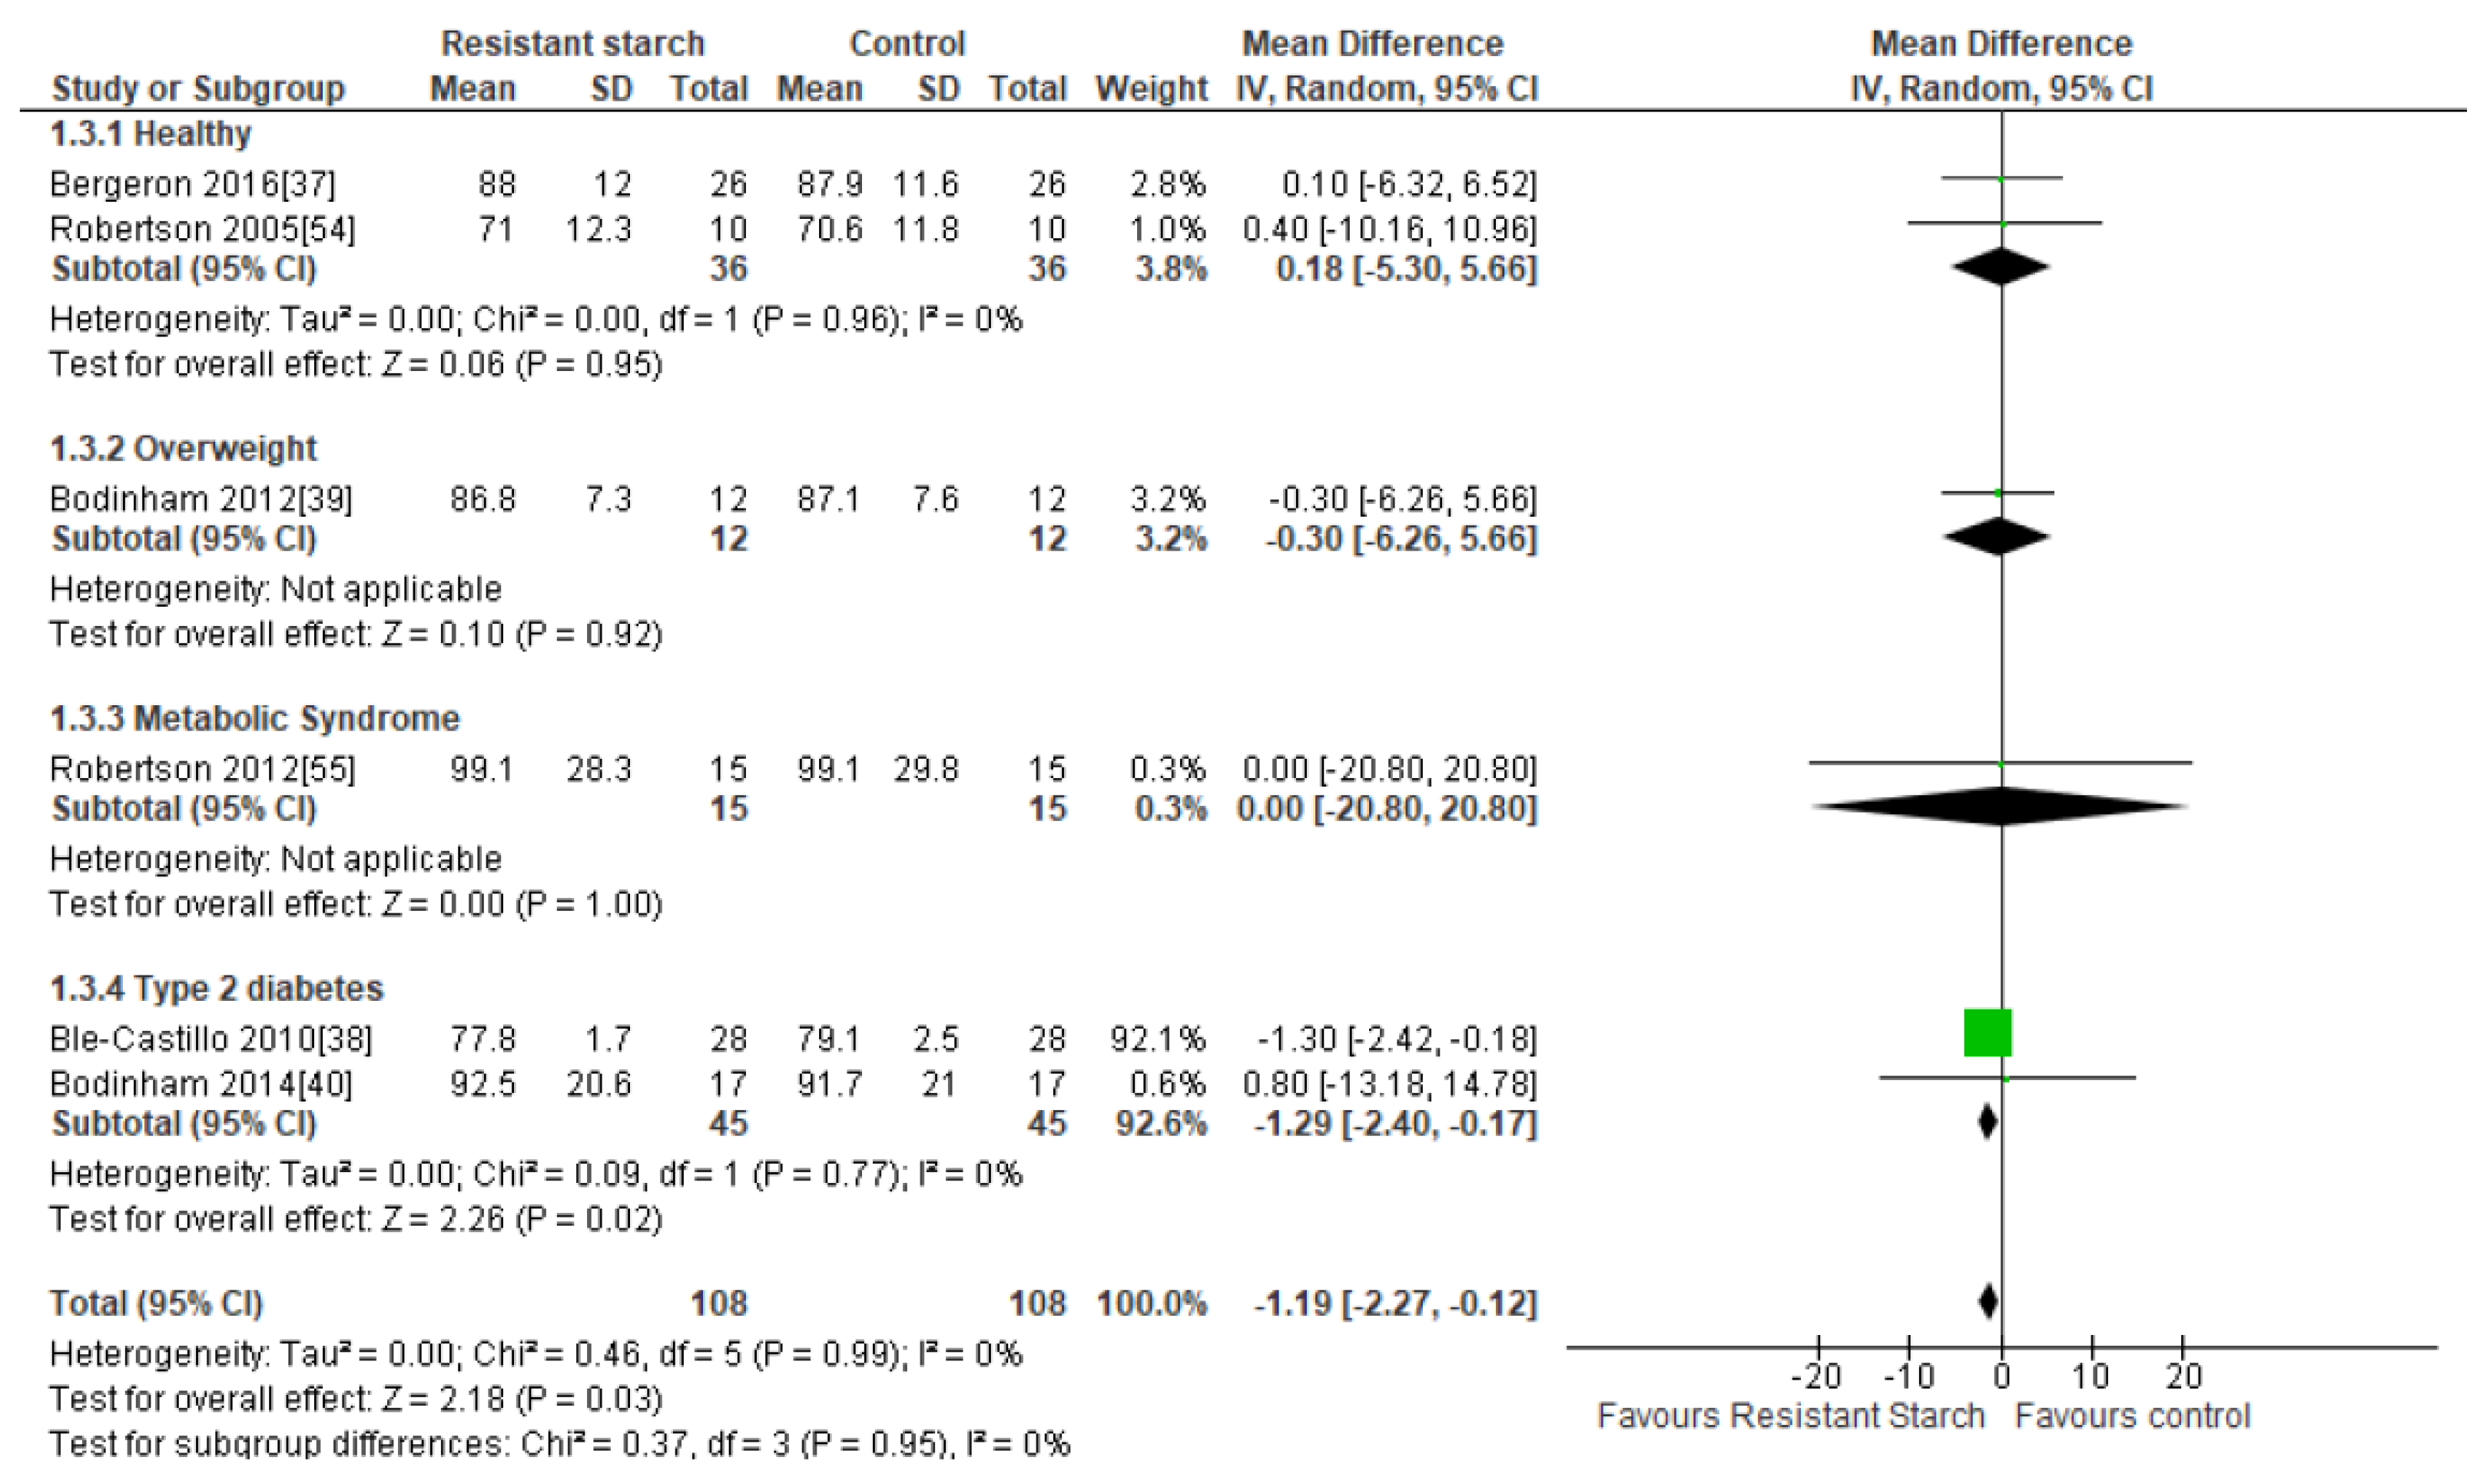
2.5. Body Weight
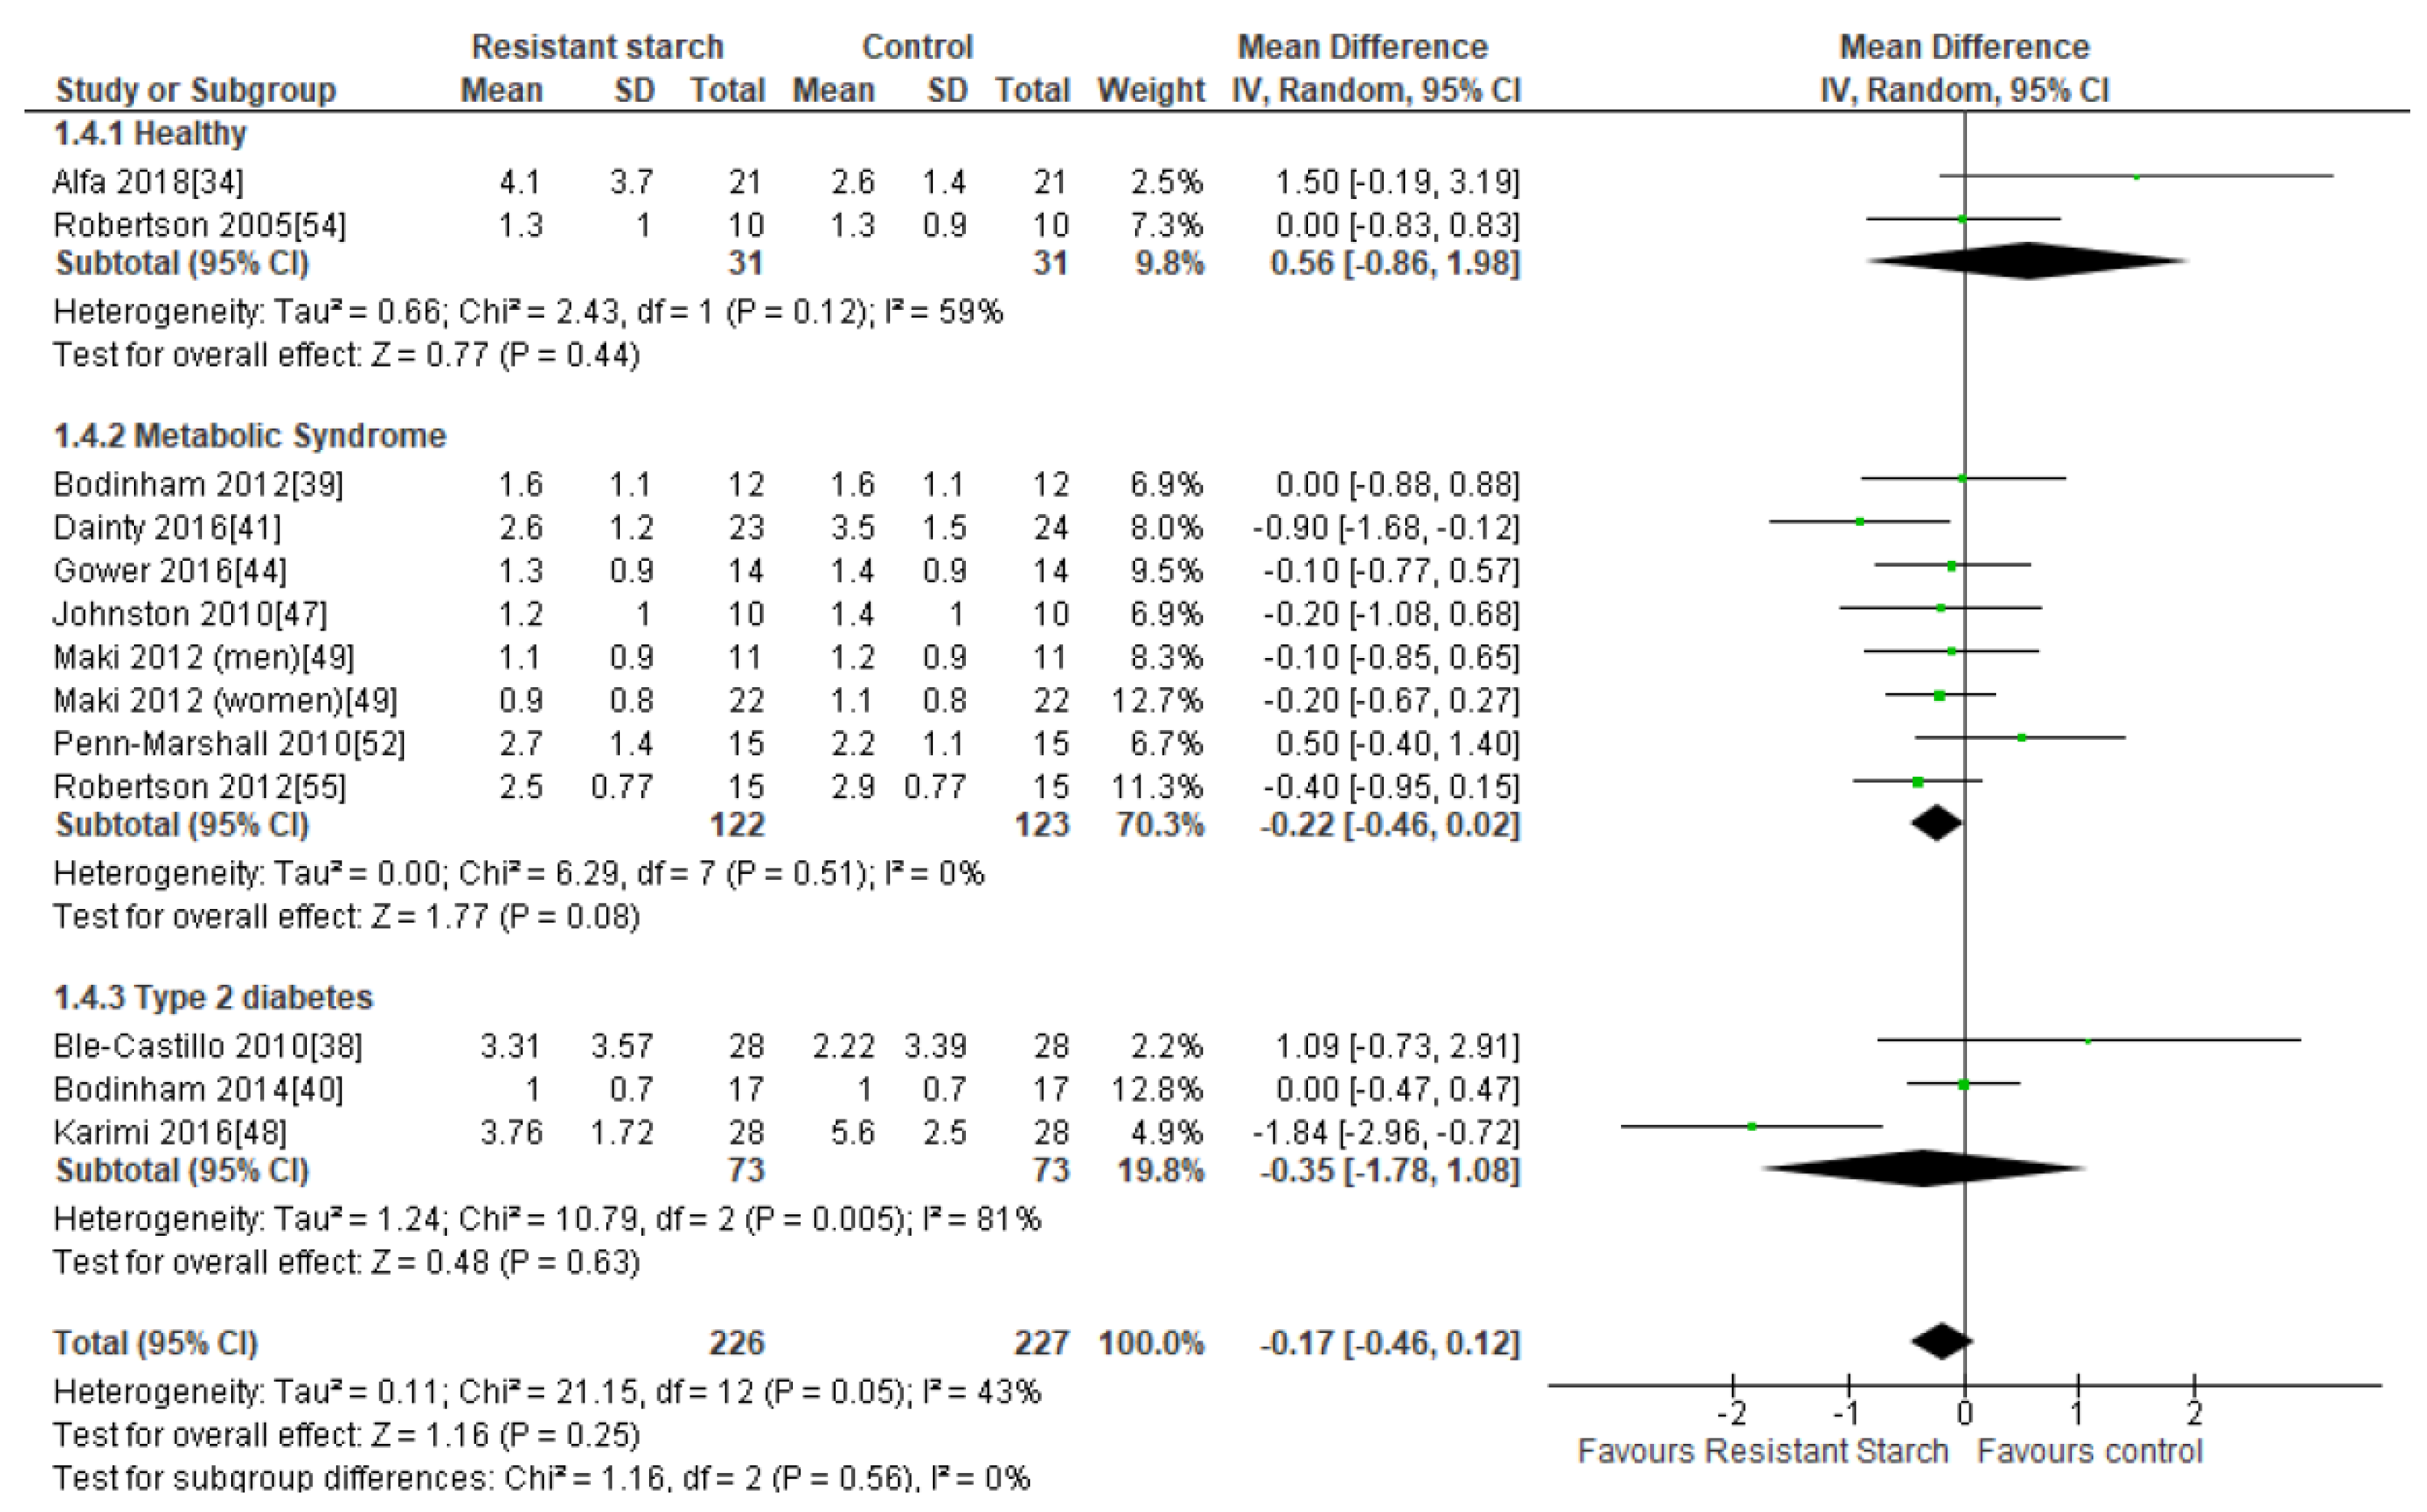
2.6. HOMA-IR
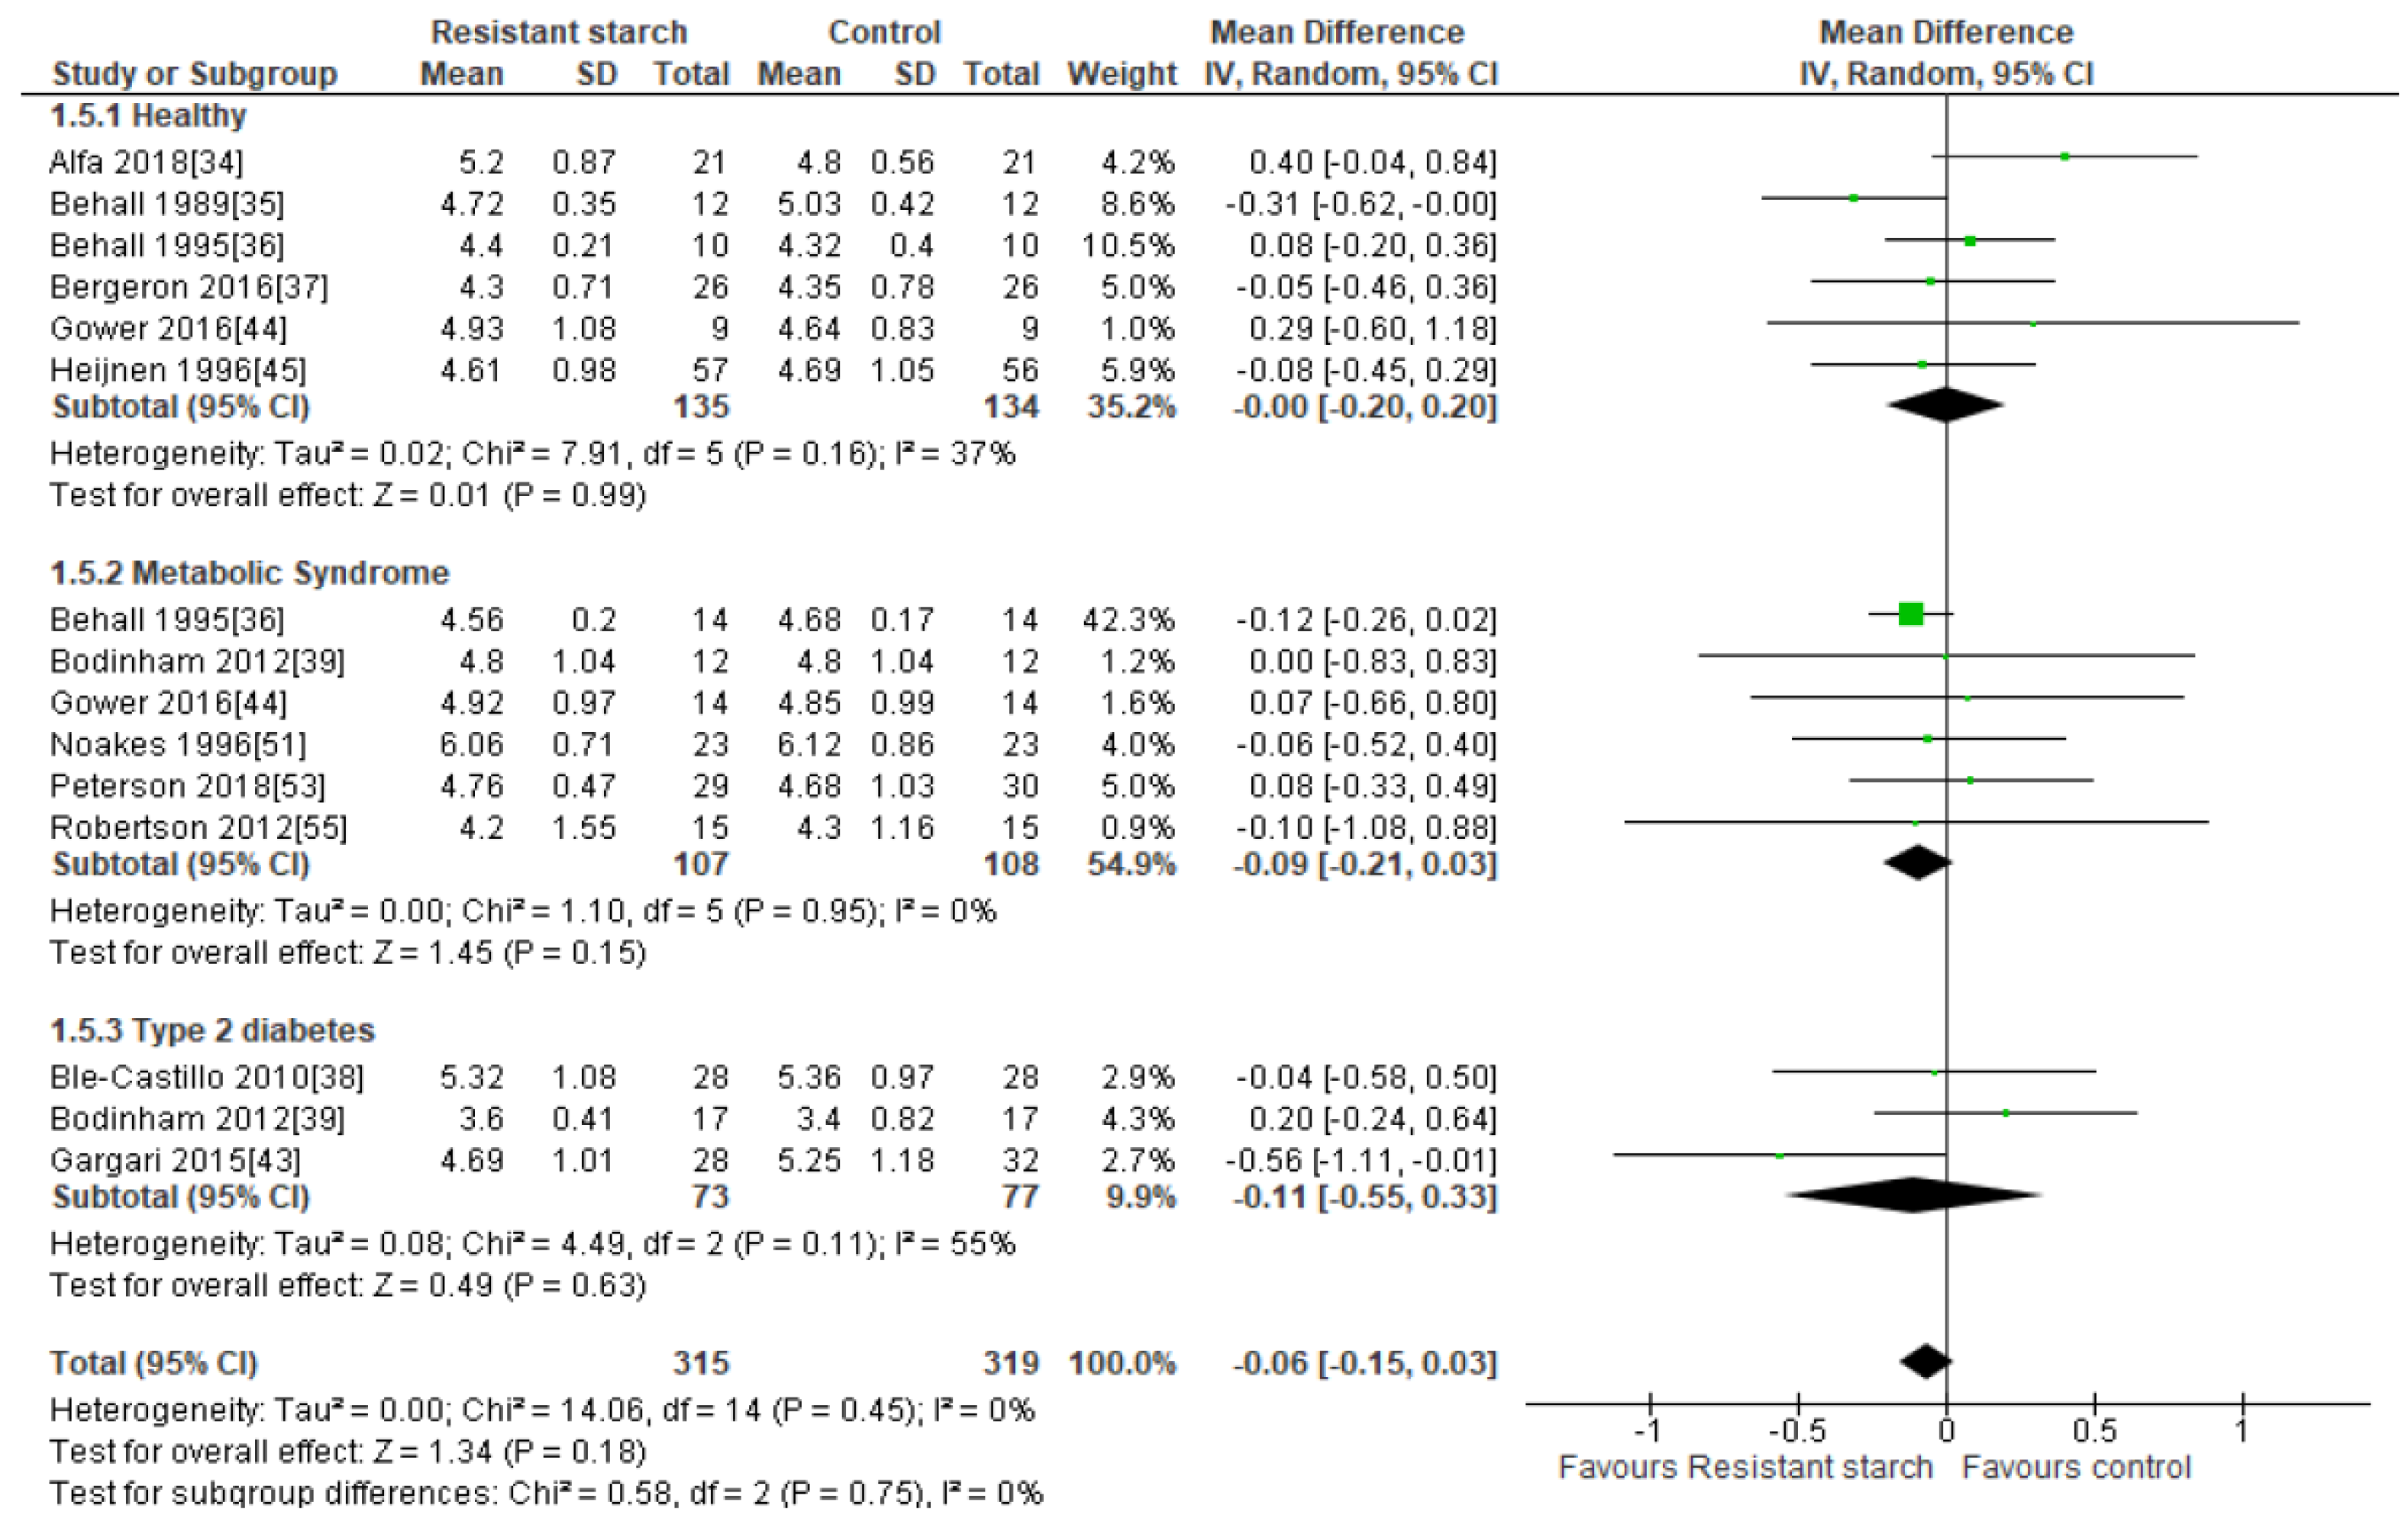
2.7. Total Cholesterol
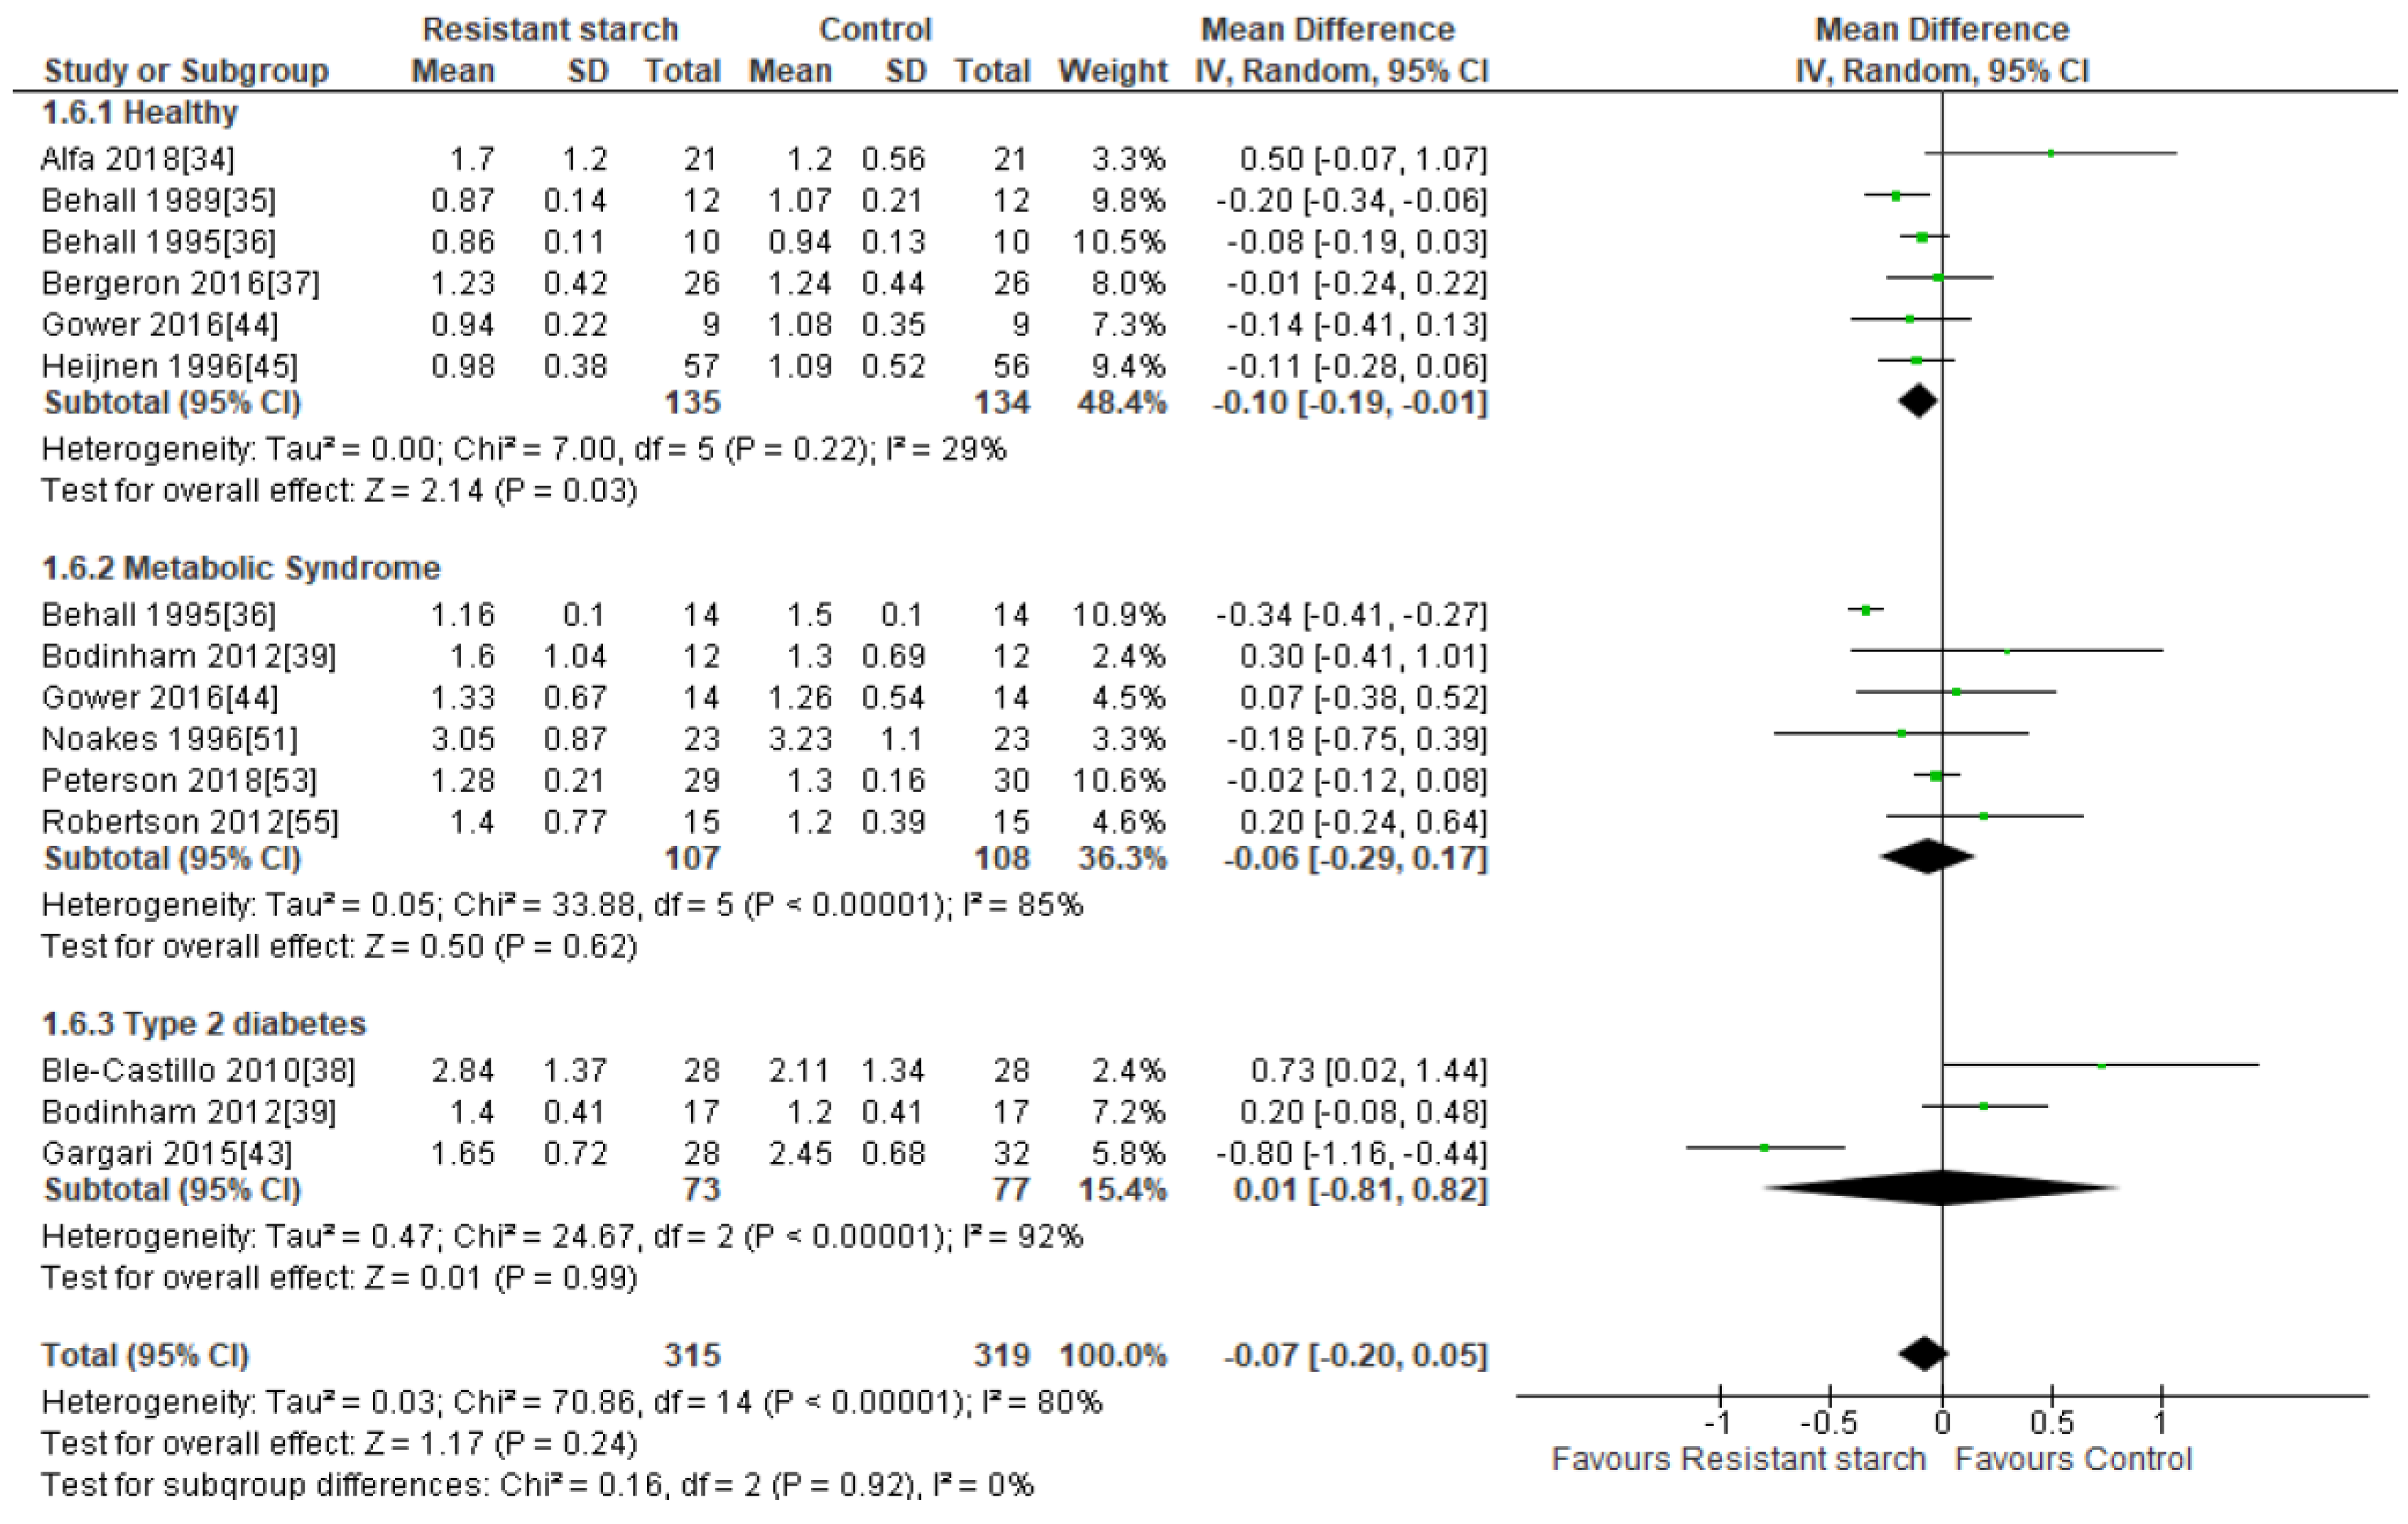
2.8. LDL Cholesterol
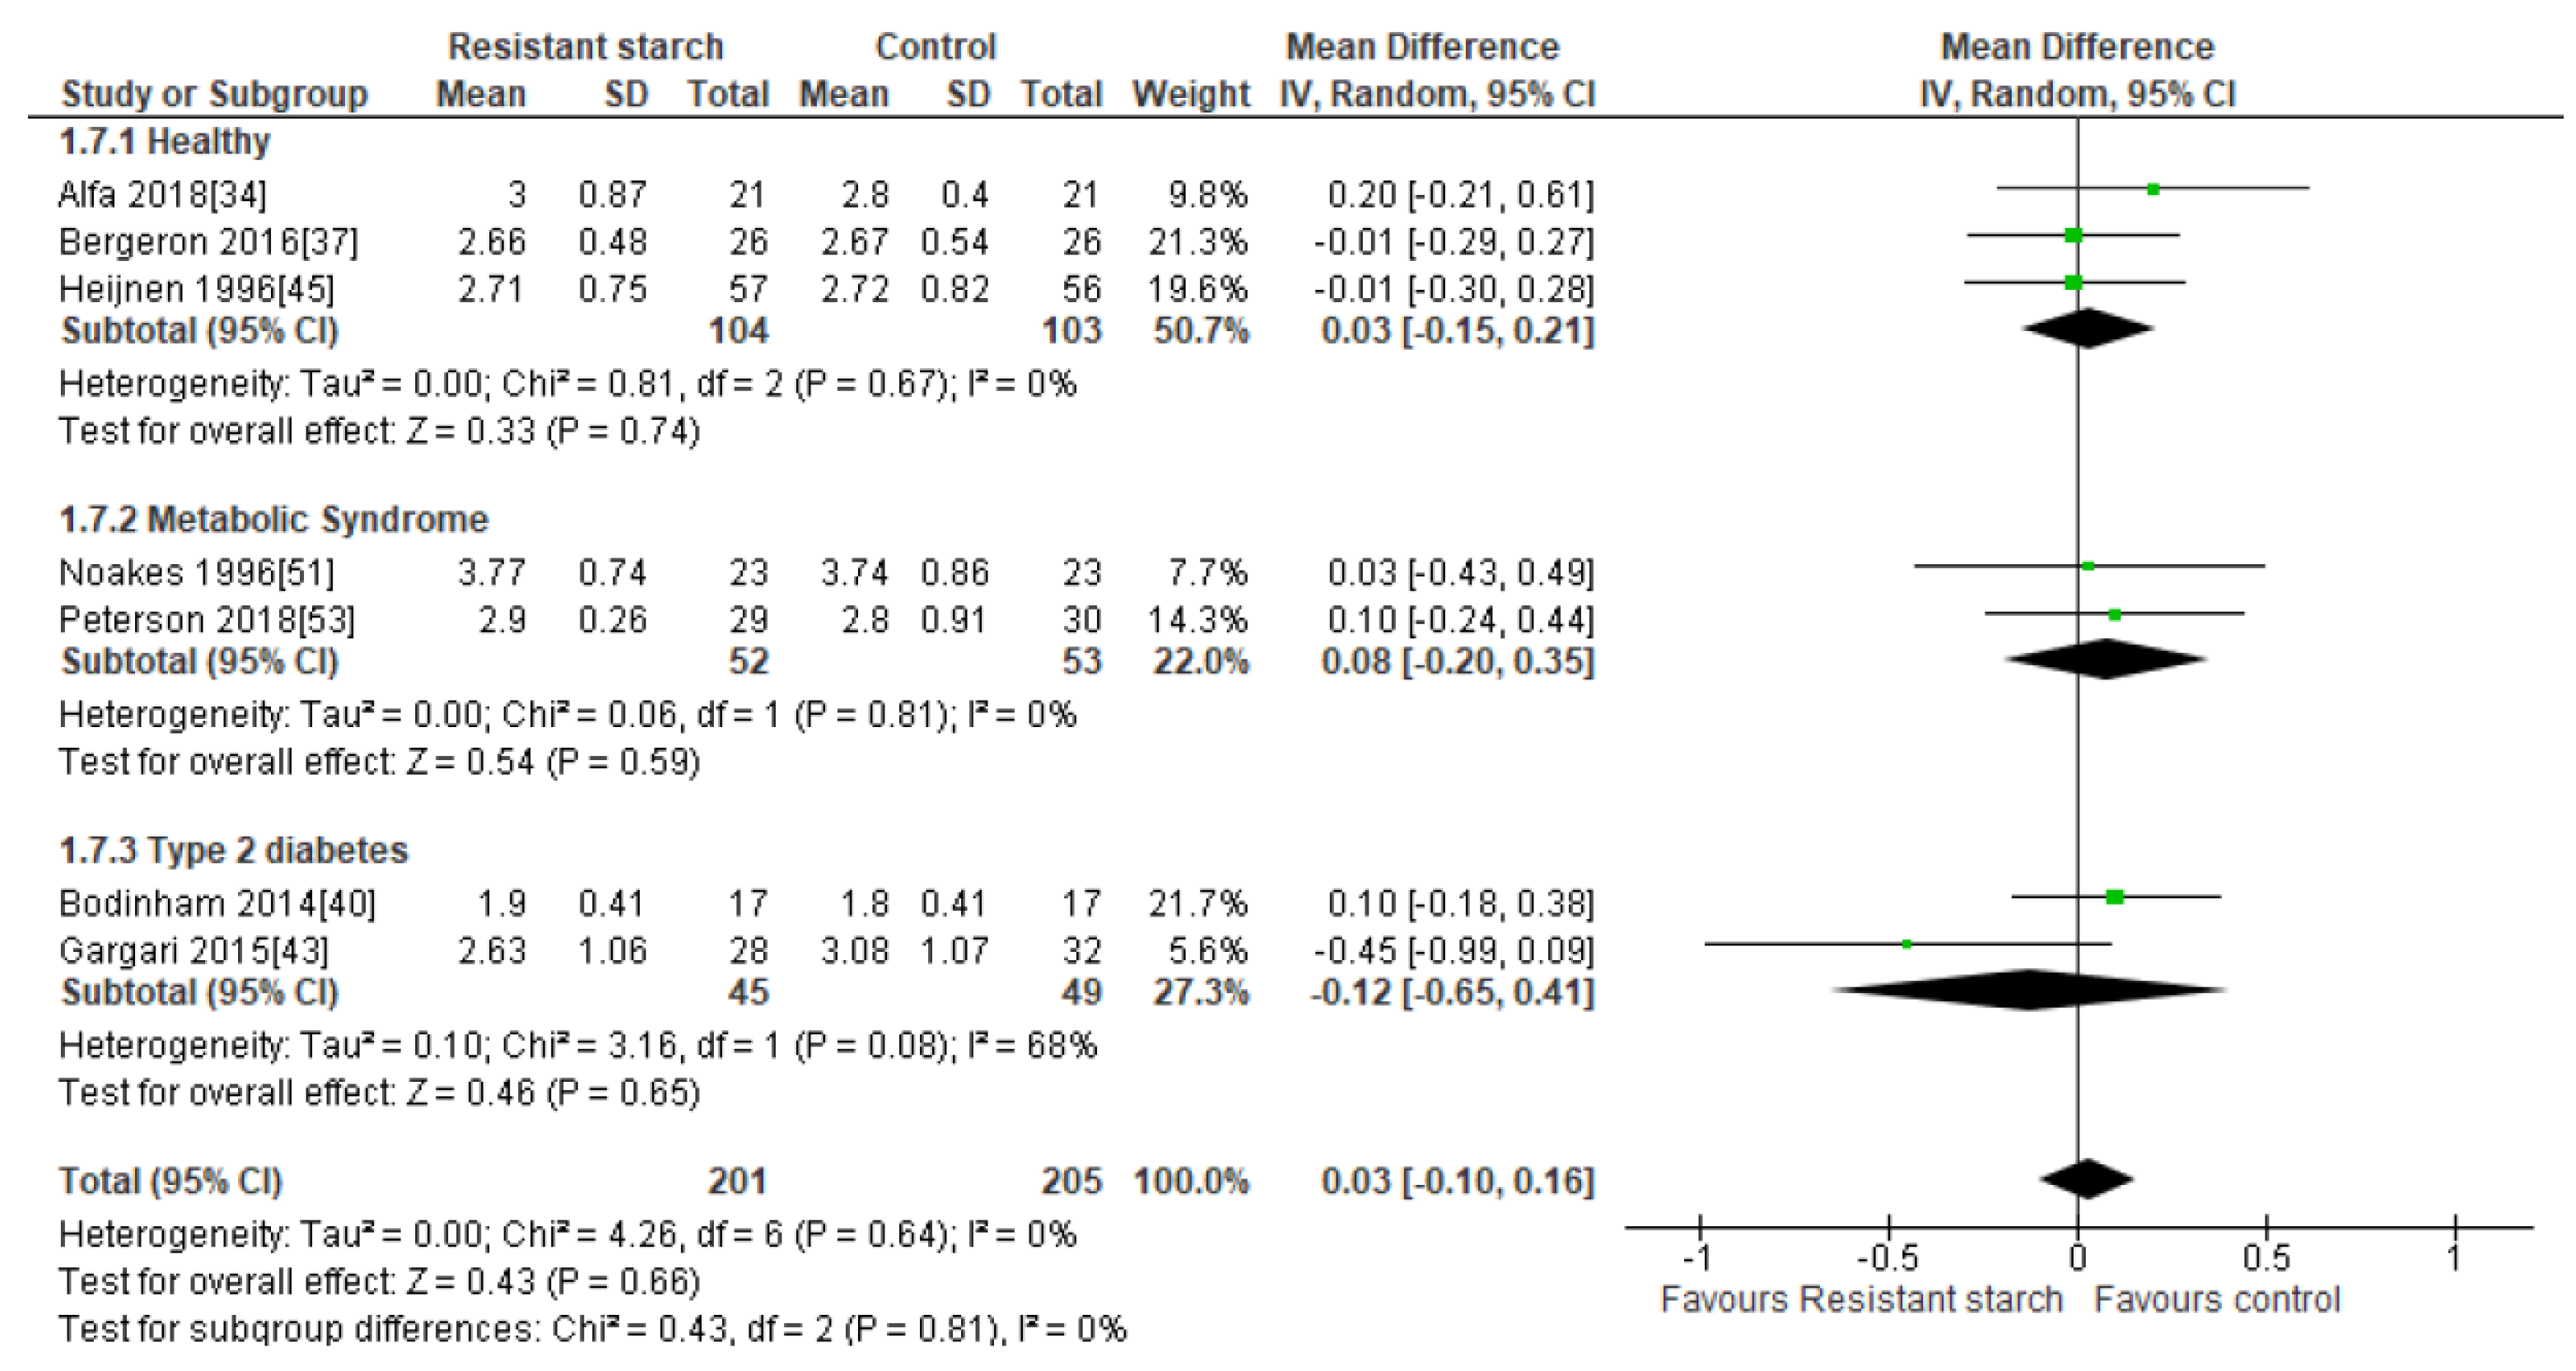
2.9. HDL Cholesterol
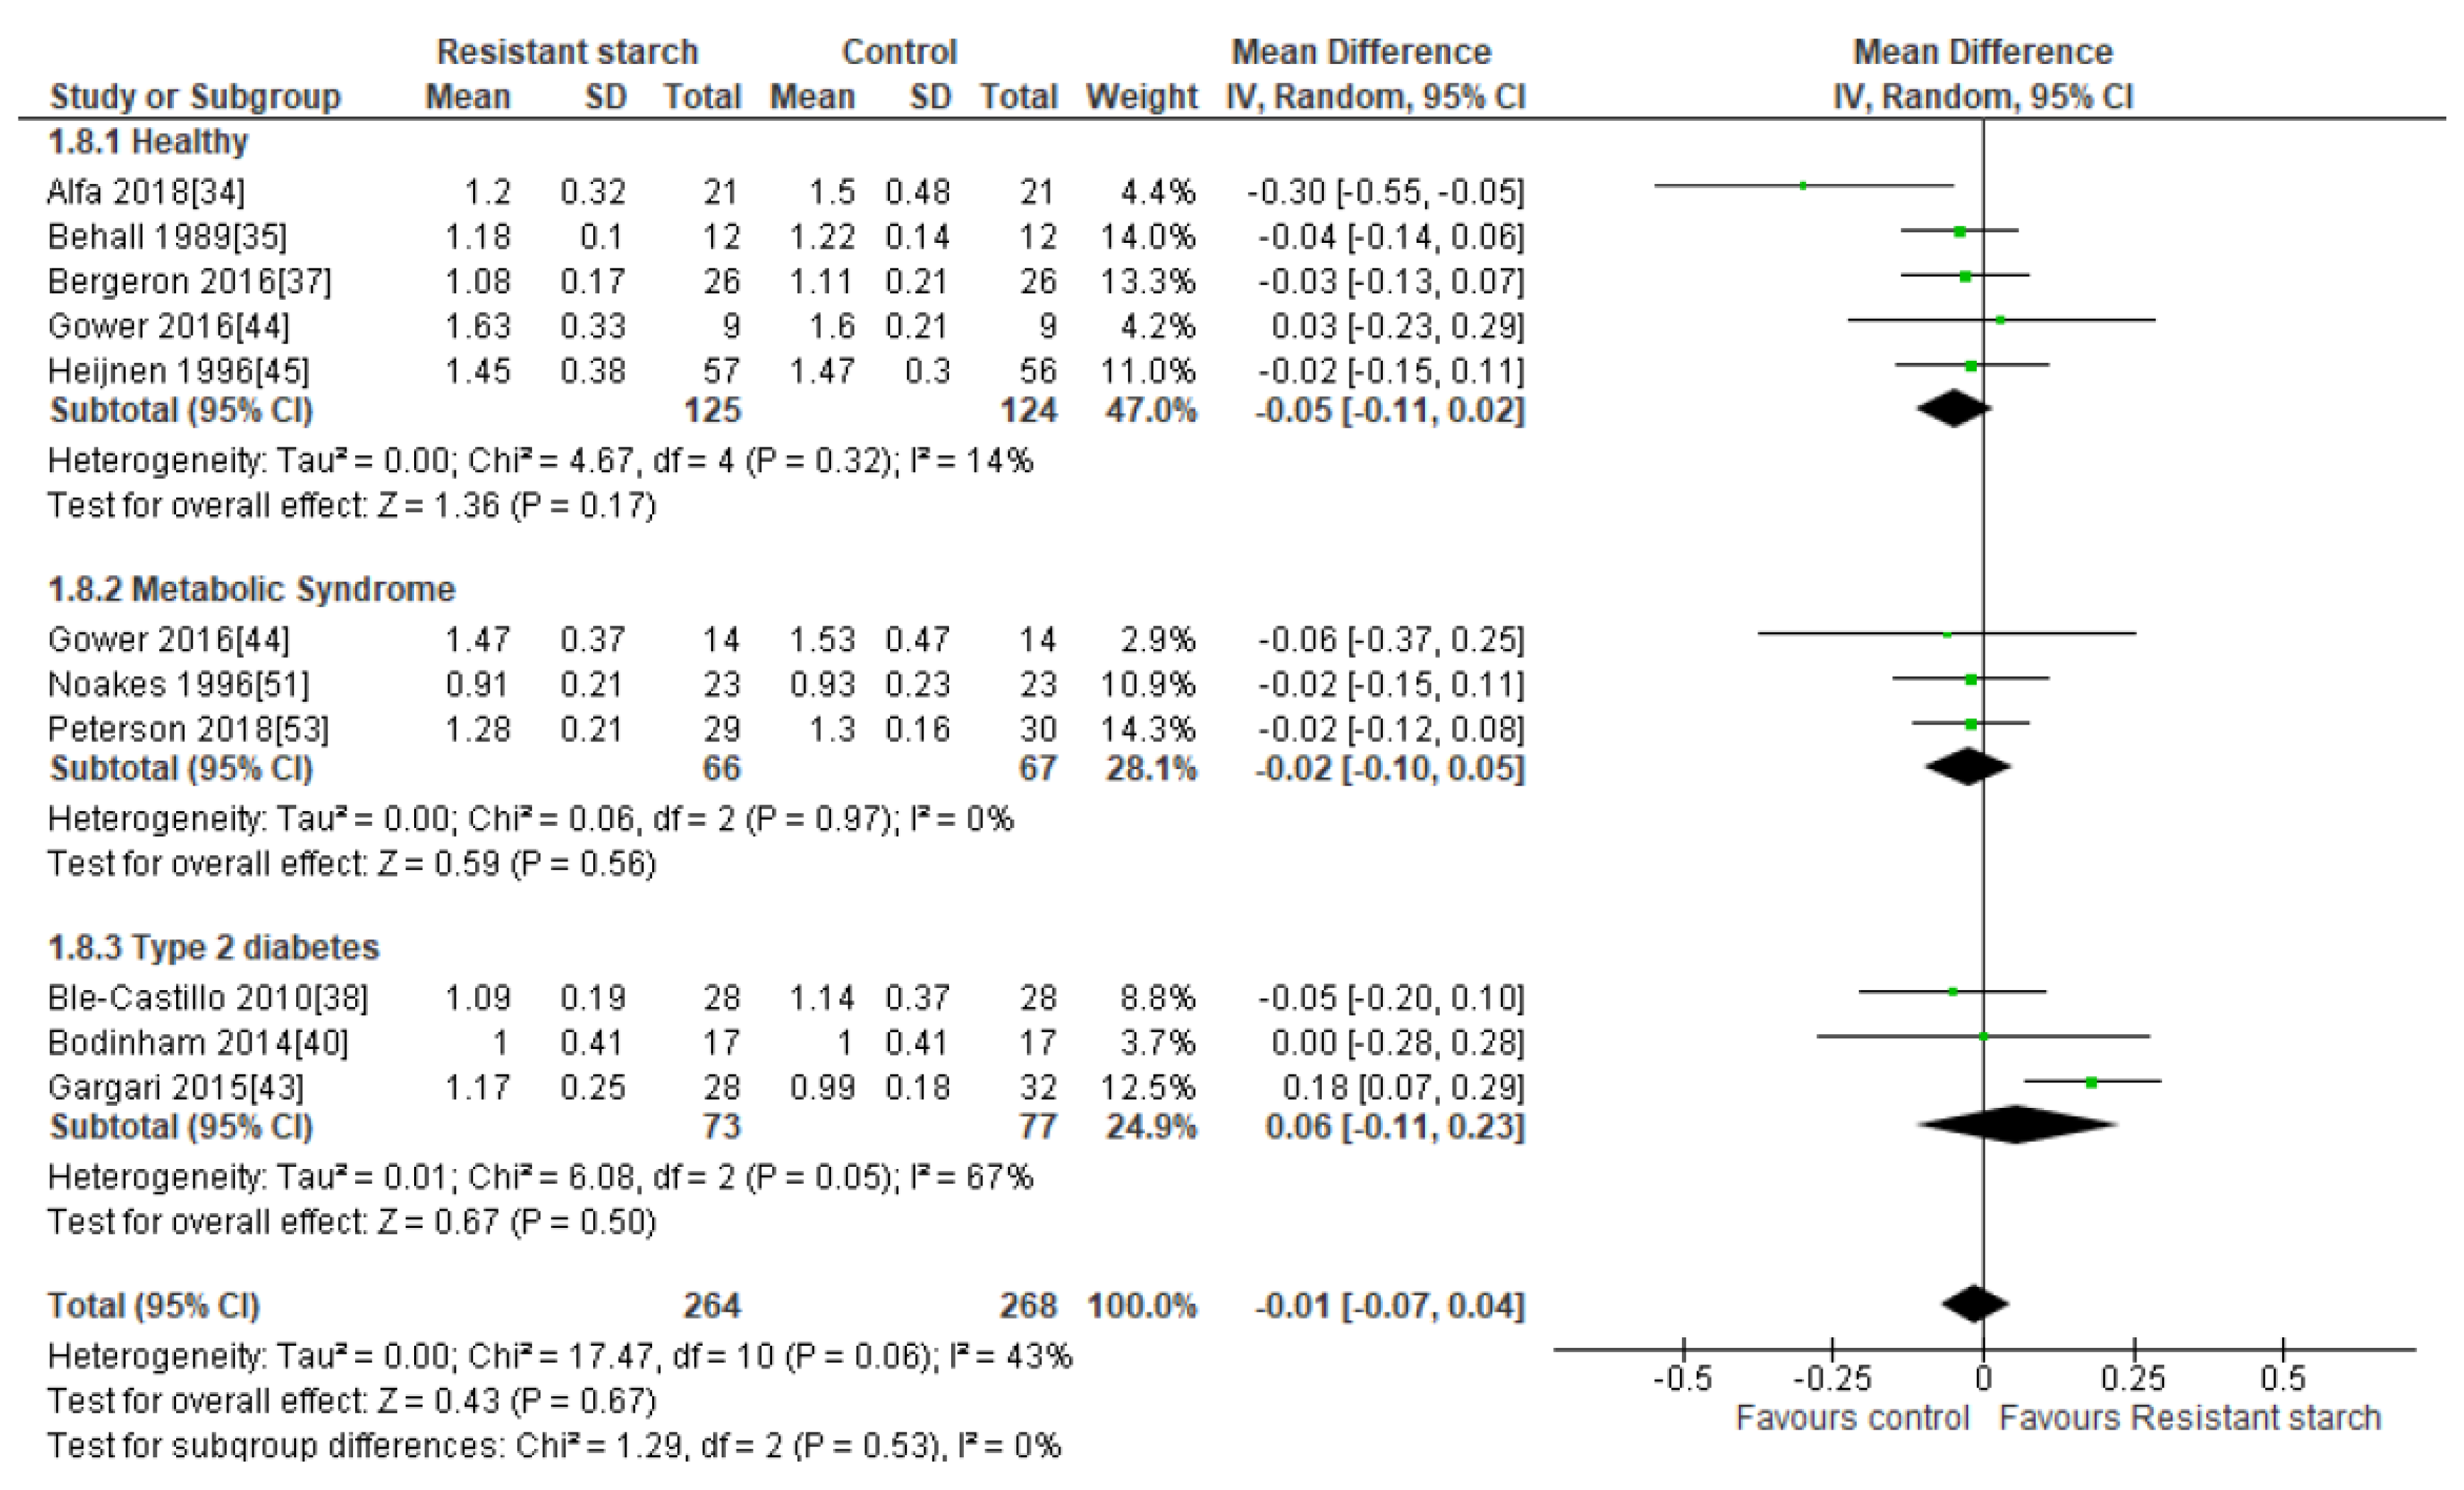
2.10. Triacylglycerol (TAG)
2.11. Appetite
3. Discussion
Supplementary Materials
Author Contributions
Funding
Conflicts of Interest
References
- Caballero, B. The global epidemic of obesity: An overview. Epidemiol. Rev. 2007, 29, 1–5. [Google Scholar] [CrossRef] [PubMed]
- Alberti, K.G.; Zimmet, P.; Shaw, J. Metabolic syndrome—A new world-wide definition. A Consensus Statement from the International Diabetes Federation. Diabet. Med. 2006, 23, 469–480. [Google Scholar] [CrossRef] [PubMed]
- Hu, F.B.; Manson, J.E.; Stampfer, M.J.; Colditz, G.; Liu, S.; Soloman, C.G.; Willett, W.C. Diet, lifestyle, and the risk of type 2 diabetes mellitus in women. N. Engl. J. Med. 2001, 345, 790–797. [Google Scholar] [CrossRef] [PubMed]
- Beagley, J.; Guariguata, L.; Weil, C.; Motala, A.A. Global estimates of undiagnosed diabetes in adults. Diabetes Res. Clin. Pract. 2014, 103, 150–160. [Google Scholar] [CrossRef] [PubMed]
- Zheng, Y.; Ley, S.H.; Hu, F.B. Global aetiology and epidemiology of type 2 diabetes mellitus and its complications. Nat. Rev. Endocrinol. 2018, 14, 88–98. [Google Scholar] [CrossRef] [PubMed]
- Fayet-Moore, F.; Cassettari, T.; Tuck, K.; McConnell, A.; Petocz, P. Dietary Fibre Intake in Australia. Paper I: Associations with Demographic, Socio-Economic, and Anthropometric Factors. Nutrients 2018, 10, 599. [Google Scholar] [CrossRef]
- Jones, J.M. Dietary fiber future directions: Integrating new definitions and findings to inform nutrition research and communication. Adv. Nutr. 2013, 4, 8–15. [Google Scholar] [CrossRef] [PubMed]
- Lafiandra, D.; Riccardi, G.; Shewry, P.R. Improving cereal grain carbohydrates for diet and health. J. Cereal. Sci. 2014, 59, 312–326. [Google Scholar] [CrossRef]
- Reicks, M.; Jonnalagadda, S.; Albertson, A.M.; Joshi, N. Total dietary fiber intakes in the US population are related to whole grain consumption: Results from the National Health and Nutrition Examination Survey 2009 to 2010. Nutr. Res. 2014, 34, 226–234. [Google Scholar] [CrossRef]
- Aldoori, W.H.; Giovannucci, E.L.; Rockett, H.R.; Sampson, L.; Rimm, E.B.; Willett, W.C. A prospective study of dietary fiber types and symptomatic diverticular disease in men. J. Nutr. 1998, 128, 714–719. [Google Scholar] [CrossRef]
- Fuchs, C.S.; Giovannucci, E.L.; Colditz, G.A.; Hunter, D.J.; Stampfer, M.J.; Rosner, B.; Speizer, F.E.; Willett, W.C. Dietary fiber and the risk of colorectal cancer and adenoma in women. N. Engl. J. Med. 1999, 340, 169–176. [Google Scholar] [CrossRef] [PubMed]
- Liu, S.; Manson, J.E.; Lee, I.M.; Cole, S.R.; Hennekens, C.H.; Willett, W.C.; Buring, J.E. Fruit and vegetable intake and risk of cardiovascular disease: The Women’s Health Study. Am. J. Clin. Nutr. 2000, 72, 922–928. [Google Scholar] [CrossRef] [PubMed]
- Fung, T.T.; Hu, F.B.; Pereira, M.A.; Liu, S.; Stampfer, M.J.; Colditz, G.A.; Willett, W.C. Whole-grain intake and the risk of type 2 diabetes: A prospective study in men. Am. J. Clin. Nutr. 2002, 76, 535–540. [Google Scholar] [CrossRef] [PubMed]
- McKeown, N.M.; Meigs, J.B.; Liu, S.; Saltzman, E.; Wilson, P.W.; Jacques, P.F. Carbohydrate nutrition, insulin resistance, and the prevalence of the metabolic syndrome in the Framingham Offspring Cohort. Diabetes Care 2004, 27, 538–546. [Google Scholar] [CrossRef] [PubMed]
- Pereira, M.A.; O’Reilly, E.; Augustsson, K.; Fraser, G.E.; Goldbourt, U.; Heitmann, B.L.; Hallmans, G.; Knekt, P.; Liu, S.; Pietinen, P.; et al. Dietary fiber and risk of coronary heart disease: A pooled analysis of cohort studies. Arch. Intern. Med. 2004, 164, 370–376. [Google Scholar] [CrossRef] [PubMed]
- Yao, B.; Fang, H.; Xu, W.; Yan, Y.; Xu, H.; Liu, Y.; Mo, M.; Zhang, H.; Zhao, Y. Dietary fiber intake and risk of type 2 diabetes: A dose-response analysis of prospective studies. Eur. J. Epidemiol. 2014, 29, 79–88. [Google Scholar] [CrossRef] [PubMed]
- Keenan, M.J.; Zhou, J.; Hegsted, M.; Pelkman, C.; Durham, H.A.; Coulon, D.B.; Martin, R.J. Role of resistant starch in improving gut health, adiposity, and insulin resistance. Adv. Nutr. 2015, 6, 198–205. [Google Scholar] [CrossRef] [PubMed]
- Birt, D.F.; Boylston, T.; Hendrich, S.; Jane, J.L.; Hollis, J.; Li, L.; McClelland, J.; Moore, S.; Phillips, G.J.; Rowling, M.; et al. Resistant starch: Promise for improving human health. Adv. Nutr. 2013, 4, 587–601. [Google Scholar] [CrossRef] [PubMed]
- Haub, M.D.; Hubach, K.L.; Al-Tamimi, E.K.; Ornelas, S.; Seib, P.A. Different types of resistant starch elicit different glucose reponses in humans. J. Nutr. Metab. 2010, 2010. [Google Scholar] [CrossRef] [PubMed]
- Dodevska, M.S.; Sobajic, S.S.; Djordjevic, P.B.; Dimitrijevic-Sreckovic, V.S.; Spasojevic-Kalimanovska, V.V.; Djordjevic, B.I. Effects of total fibre or resistant starch-rich diets within lifestyle intervention in obese prediabetic adults. Eur. J. Nutr. 2016, 55, 127–137. [Google Scholar] [CrossRef]
- Aliasgharzadeh, A.; Dehghan, P.; Gargari, B.P.; Asghari-Jafarabadi, M. Resistant dextrin, as a prebiotic, improves insulin resistance and inflammation in women with type 2 diabetes: A randomised controlled clinical trial. Br. J. Nutr. 2015, 113, 321–330. [Google Scholar] [CrossRef] [PubMed]
- Snelson, M.; Kellow, N.J.; Coughlan, M.T. Modulation of the Gut Microbiota by Resistant Starch as a Treatment of Chronic Kidney Diseases: Evidence of Efficacy and Mechanistic Insights. Adv. Nutr. 2019, 10, 303–320. [Google Scholar] [CrossRef] [PubMed]
- Bindels, L.B.; Walter, J.; Ramer-Tait, A.E. Resistant starches for the management of metabolic diseases. Curr. Opin. Clin. Nutr. Metab. Care 2015, 18, 559–565. [Google Scholar] [CrossRef] [PubMed]
- Slavin, J.L.; Martini, M.C.; Jacobs, D.R., Jr.; Marquart, L. Plausible mechanisms for the protectiveness of whole grains. Am. J. Clin. Nutr. 1999, 70, 459S–463S. [Google Scholar] [CrossRef] [PubMed]
- Belobrajdic, D.P.; King, R.A.; Christophersen, C.T.; Bird, A.R. Dietary resistant starch dose-dependently reduces adiposity in obesity-prone and obesity-resistant male rats. Nutr. Metab. 2012, 9. [Google Scholar] [CrossRef]
- Zhou, Z.; Wang, F.; Ren, X.; Wang, Y.; Blanchard, C. Resistant starch manipulated hyperglycemia/hyperlipidemia and related genes expression in diabetic rats. Int. J. Biol. Macromol. 2015, 75, 316–321. [Google Scholar] [CrossRef] [PubMed]
- Nielsen, T.S.; Theil, P.K.; Purup, S.; Nørskov, N.P.; Bach Knudsen, K.E. Effects of Resistant Starch and Arabinoxylan on Parameters Related to Large Intestinal and Metabolic Health in Pigs Fed Fat-Rich Diets. J. Agric. Food Chem. 2015, 63, 10418–10430. [Google Scholar] [CrossRef]
- Jiminez, J.A.; Uwiera, T.C.; Abbott, D.W.; Uwiera, R.R.E.; Inglis, G.D. Impacts of resistant starch and wheat bran consumption on enteric inflammation in relation to colonic bacterial community structures and short-chain fatty acid concentrations in mice. Gut Pathog. 2016, 8. [Google Scholar] [CrossRef]
- Moher, D.; Liberati, A.; Tetzlaff, J.; Altman, D.G.; PRISMA Group. Preferred reporting items for systematic reviews and meta-analyses: The PRISMA statement. J. Clin. Epidemiol. 2009, 62, 1006–1012. [Google Scholar] [CrossRef]
- Englyst, H.N.; Trowell, H.; Southgate, D.A.; Cummings, J.H. Dietary fiber and resistant starch. Am. J. Clin. Nutr. 1987, 46, 873–874. [Google Scholar] [CrossRef]
- Higgins, J.P.; Altman, D.G.; Gotzsche, P.C.; Jüni, P.; Moher, D.; Oxman, A.D.; Savovic, J.; Schulz, K.F.; Weeks, L.; Sterne, J.A.; et al. The Cochrane Collaboration’s tool for assessing risk of bias in randomised trials. BMJ 2011, 343, d5928. [Google Scholar] [CrossRef] [PubMed]
- Egger, M.; Davey Smith, G.; Schneider, M.; Minder, C. Bias in meta-analysis detected by a simple, graphical test. BMJ 1997, 315, 629–634. [Google Scholar] [CrossRef] [PubMed]
- Begg, C.B.; Mazumdar, M. Operating characteristics of a rank correlation test for publication bias. Biometrics 1994, 50, 1088–1101. [Google Scholar] [CrossRef] [PubMed]
- Alfa, M.J.; Strang, D.; Tappia, P.S.; Olson, N.; DeGagne, P.; Bray, D.; Murray, B.L.; Hiebert, B. A Randomized Placebo Controlled Clinical Trial to Determine the Impact of Digestion Resistant Starch MSPrebiotic® on Glucose, Insulin, and Insulin Resistance in Elderly and Mid-Age Adults. Front. Med. 2018, 4. [Google Scholar] [CrossRef] [PubMed]
- Behall, K.M.; Scholfield, D.J.; Yuhaniak, I.; Canary, J. Diets containing high amylose vs amylopectin starch: Effects on metabolic variables in human subjects. Am. J. Clin. Nutr. 1989, 49, 337–344. [Google Scholar] [CrossRef]
- Behall, K.M.; Howe, J.C. Effect of long-term consumption of amylose vs amylopectin starch on metabolic variables in human subjects. Am. J. Clin. Nutr. 1995, 61, 334–340. [Google Scholar] [CrossRef] [PubMed]
- Bergeron, N.; Williams, P.T.; Lamendella, R.; Faghihnia, N.; Grube, A.; Li, X.; Wang, Z.; Knight, R.; Jansson, J.K.; Hazen, S.L.; et al. Diets high in resistant starch increase plasma levels of trimethylamine-N-oxide, a gut microbiome metabolite associated with CVD risk. Br. J. Nutr. 2016, 116, 2020–2029. [Google Scholar] [CrossRef]
- Ble-Castillo, J.L.; Aparicio-Trapala, M.A.; Francisco-Luria, M.U.; Córdova-Uscanga, R.; Rodríguez-Hernández, A.; Méndez, J.D.; Díaz-Zagoya, J.C. Effects of native banana starch supplementation on body weight and insulin sensitivity in obese type 2 diabetics. Int. J. Environ. Res. Public Health 2010, 7, 1953–1962. [Google Scholar] [CrossRef]
- Bodinham, C.L.; Smith, L.; Wright, J.; Frost, G.S.; Robertson, M.D. Dietary fibre improves first-phase insulin secretion in overweight individuals. PLoS ONE 2012, 7, e40834. [Google Scholar] [CrossRef]
- Bodinham, C.L.; Smith, L.; Thomas, E.L.; Bell, J.D.; Swann, J.R.; Costabile, A.; Russell-Jones, D.; Umpleby, A.M.; Robertson, M.D. Efficacy of increased resistant starch consumption in human type 2 diabetes. Endocr. Connect. 2014, 3, 75–84. [Google Scholar] [CrossRef]
- Dainty, S.A.; Klingel, S.L.; Pilkey, S.E.; McDonald, E.; McKeown, B.; Emes, M.J.; Duncan, A.M. Resistant Starch Bagels Reduce Fasting and Postprandial Insulin in Adults at Risk of Type 2 Diabetes. J. Nutr. 2016, 146, 2252–2259. [Google Scholar] [CrossRef] [PubMed]
- de Roos, N.; Heijnen, M.L.; de Graaf, C.; Woestenenk, G.; Hobbel, E. Resistant starch has little effect on appetite, food intake and insulin secretion of healthy young men. Eur. J. Clin. Nutr. 1995, 49, 532–541. [Google Scholar] [PubMed]
- Gargari, B.P.; Namazi, N.; Khalili, M.; Sarmadi, B.; Jafarabadi, M.A.; Dehghan, P. Is there any place for resistant starch, as alimentary prebiotic, for patients with type 2 diabetes? Complement. Ther. Med. 2015, 23, 810–815. [Google Scholar] [CrossRef] [PubMed]
- Gower, B.A.; Bergman, R.; Stefanovski, D.; Darnell, B.; Ovalle, F.; Fisher, G.; Sweatt, S.K.; Resuehr, H.S.; Pelkman, C. Baseline insulin sensitivity affects response to high-amylose maize resistant starch in women: A randomized, controlled trial. Nutr. Metab. 2016, 13. [Google Scholar] [CrossRef]
- Heijnen, M.L.; van Amelsvoort, J.M.; Deurenberg, P.; Beynen, A.C. Neither raw nor retrograded resistant starch lowers fasting serum cholesterol concentrations in healthy normolipidemic subjects. Am. J. Clin. Nutr. 1996, 64, 312–318. [Google Scholar] [CrossRef] [PubMed]
- Jenkins, D.J.; Vuksan, V.; Kendall, C.W.; Würsch, P.; Jeffcoat, R.; Waring, S.; Mehling, C.C.; Vidgen, E.; Augustin, L.S.; Wong, E. Physiological effects of resistant starches on fecal bulk, short chain fatty acids, blood lipids and glycemic index. J. Am. Coll. Nutr. 1998, 17, 609–616. [Google Scholar] [CrossRef]
- Johnston, K.L.; Thomas, E.L.; Bell, J.D.; Frost, G.S.; Robertson, M.D. Resistant starch improves insulin sensitivity in metabolic syndrome. Diabet. Med. 2010, 27, 391–397. [Google Scholar] [CrossRef]
- Karimi, P.; Farhangi, M.A.; Sarmadi, B.; Gargari, B.P.; Zare Javid, A.; Pouraghaei, M.; Dehghan, P. The Therapeutic Potential of Resistant Starch in Modulation of Insulin Resistance, Endotoxemia, Oxidative Stress and Antioxidant Biomarkers in Women with Type 2 Diabetes: A Randomized Controlled Clinical Trial. Ann. Nutr. Metab. 2016, 68, 85–93. [Google Scholar] [CrossRef]
- Maki, K.C.; Pelkman, C.L.; Finocchiaro, E.T.; Kelley, K.M.; Lawless, A.L.; Schild, A.L.; Rains, T.M. Resistant starch from high-amylose maize increases insulin sensitivity in overweight and obese men. J. Nutr. 2012, 142, 717–723. [Google Scholar] [CrossRef]
- Maziarz, M.P.; Preisendanz, S.; Juma, S.; Imrhan, V.; Prasad, C.; Vijayagopal, P. Resistant starch lowers postprandial glucose and leptin in overweight adults consuming a moderate-to-high-fat diet: A randomized-controlled trial. Nutr. J. 2017, 16. [Google Scholar] [CrossRef]
- Noakes, M.; Clifton, P.M.; Nestel, P.J.; Le Leu, R.; McIntosh, G. Effect of high-amylose starch and oat bran on metabolic variables and bowel function in subjects with hypertriglyceridemia. Am. J. Clin. Nutr. 1996, 64, 944–951. [Google Scholar] [CrossRef] [PubMed]
- Penn-Marshall, M.; Holtzman, G.I.; Barbeau, W.E. African Americans may have to consume more than 12 g a day of resistant starch to lower their risk for type 2 diabetes. J. Med. Food 2010, 13, 999–1004. [Google Scholar] [CrossRef] [PubMed]
- Peterson, C.M.; Beyl, R.A.; Marlatt, C.K.; Aryana, K.J.; Marco, M.L.; Martin, R.J.; Keenan, M.J.; Ravussin, E. Effect of 12 wk of resistant starch supplementation on cardiometabolic risk factors in adults with prediabetes: A randomized controlled trial. Am. J. Clin. Nutr. 2018, 108, 492–501. [Google Scholar] [CrossRef] [PubMed]
- Robertson, M.D.; Bickerton, A.S.; Dennis, A.L.; Vidal, H.; Frayn, K.N. Insulin-sensitizing effects of dietary resistant starch and effects on skeletal muscle and adipose tissue metabolism. Am. J. Clin. Nutr. 2005, 82, 559–567. [Google Scholar] [CrossRef]
- Robertson, M.D.; Wright, J.W.; Loizon, E.; Debard, C.; Vidal, H.; Shojaee-Moradie, F.; Russell-Jones, D.; Umpleby, A.M. Insulin-sensitizing effects on muscle and adipose tissue after dietary fiber intake in men and women with metabolic syndrome. J. Clin. Endocrinol. Metab. 2012, 97, 3326–3332. [Google Scholar] [CrossRef] [PubMed]
- Begg, C.; Cho, M.; Eastwood, S.; Horton, R.; Moher, D.; Olkin, I.; Pitkin, R.; Rennie, D.; Schulz, K.F.; Simel, D.; et al. Improving the quality of reporting of randomized controlled trials. The CONSORT statement. JAMA 1996, 276, 637–639. [Google Scholar] [CrossRef] [PubMed]
- Schulz, K.F.; Altman, D.G.; Moher, D.; The CONSORT Group. CONSORT 2010 statement: Updated guidelines for reporting parallel group randomised trials. BMJ 2010, 340, c332. [Google Scholar] [CrossRef]
- Matarese, L.E.; Pories, W.J. Adult weight loss diets: Metabolic effects and outcomes. Nutr. Clin. Pract. 2014, 29, 759–767. [Google Scholar] [CrossRef]
- Aune, D.; Norat, T.; Leitzmann, M.; Tonstad, S.; Vatten, L.J. Physical activity and the risk of type 2 diabetes: A systematic review and dose-response meta-analysis. Eur. J. Epidemiol. 2015, 30, 529–542. [Google Scholar] [CrossRef]
- Robertson, M.D. Dietary-resistant starch and glucose metabolism. Curr. Opin. Clin. Nutr. Metab. Care 2012, 15, 362–367. [Google Scholar] [CrossRef]
- Zaman, S.A.; Sarbini, S.R. The potential of resistant starch as a prebiotic. Crit. Rev. Biotechnol. 2016, 36, 578–584. [Google Scholar] [CrossRef] [PubMed]
- Gibson, G.R.; Hutkins, R.; Sanders, M.E.; Prescott, S.L.; Reimer, R.A.; Salminen, S.J.; Scott, K.; Stanton, C.; Swanson, K.S.; Cani, P.D.; et al. Expert consensus document: The International Scientific Association for Probiotics and Prebiotics (ISAPP) consensus statement on the definition and scope of prebiotics. Nat. Rev. Gastroenterol. Hepatol. 2017, 14, 491–502. [Google Scholar] [CrossRef] [PubMed]
- Warren, F.J.; Fukuma, N.M.; Mikkelsen, D.; Flanagan, B.M.; Williams, B.A.; Lisle, A.T.; Ó Cuív, P.; Morrison, M.; Gidley, M.J. Food Starch Structure Impacts Gut Microbiome Composition. mSphere 2018, 3, e00086-18. [Google Scholar] [CrossRef] [PubMed]
- Metzler-Zebeli, B.U.; Canibe, N.; Montagne, L.; Freire, J.; Bosi, P.; Prates, J.A.M.; Tanghe, S.; Trevisi, P. Resistant starch reduces large intestinal pH and promotes fecal lactobacilli and bifidobacteria in pigs. Animal 2019, 13, 64–73. [Google Scholar] [CrossRef] [PubMed]
- Holscher, H.D. Dietary fiber and prebiotics and the gastrointestinal microbiota. Gut Microbes 2017, 8, 172–184. [Google Scholar] [CrossRef] [PubMed]
- De Silva, A.; Bloom, S.R. Gut Hormones and Appetite Control: A Focus on PYY and GLP-1 as Therapeutic Targets in Obesity. Gut Liver 2012, 6, 10–20. [Google Scholar] [CrossRef]
- Gutniak, M.; Orskov, C.; Holst, J.J.; Ahrén, B.; Efendic, S. Antidiabetogenic effect of glucagon-like peptide-1 (7–36)amide in normal subjects and patients with diabetes mellitus. N. Engl. J. Med. 1992, 326, 1316–1322. [Google Scholar] [CrossRef] [PubMed]
- Willms, B.; Werner, J.; Holst, J.J.; Orskov, C.; Creutzfeldt, W.; Nauck, M.A. Gastric emptying, glucose responses, and insulin secretion after a liquid test meal: Effects of exogenous glucagon-like peptide-1 (GLP-1)-(7–36) amide in type 2 (noninsulin-dependent) diabetic patients. J. Clin. Endocrinol. Metab. 1996, 81, 327–332. [Google Scholar]
- Batterham, R.L.; Cowley, M.A.; Small, C.J.; Herzog, H.; Cohen, M.A.; Dakin, C.L.; Wren, A.M.; Brynes, A.E.; Low, M.J.; Ghatei, M.A.; et al. Gut hormone PYY(3–36) physiologically inhibits food intake. Nature 2002, 418, 650–654. [Google Scholar] [CrossRef]
- Zhou, J.; Martin, R.J.; Tulley, R.T.; Raggio, A.M.; McCutcheon, K.L.; Shen, L.; Danna, S.C.; Tripathy, S.; Hegsted, M.; Keenan, M.J. Dietary resistant starch upregulates total GLP-1 and PYY in a sustained day-long manner through fermentation in rodents. Am. J. Physiol. Endocrinol. Metab. 2008, 295, E1160–E1166. [Google Scholar] [CrossRef] [PubMed]
- Keenan, M.J.; Zhou, J.; McCutcheon, K.L.; Raggio, A.M.; Bateman, H.G.; Todd, E.; Jones, C.K.; Tulley, R.T.; Melton, S.; Martin, R.J.; et al. Effects of resistant starch, a non-digestible fermentable fiber, on reducing body fat. Obesity 2006, 14, 1523–1534. [Google Scholar] [CrossRef] [PubMed]
- Keenan, M.J.; Janes, M.; Robert, J.; Martin, R.J.; Raggio, A.M.; McCutcheon, K.L.; Pelkman, C.; Tulley, R.; Goita, M.; Durham, H.A.; et al. Resistant starch from high amylose maize (HAM-RS2) reduces body fat and increases gut bacteria in ovariectomized (OVX) rats. Obesity 2013, 21, 981–984. [Google Scholar] [CrossRef] [PubMed]
- Zhou, J.; Martin, R.J.; Tulley, R.T.; Raggio, A.M.; Shen, L.; Lissy, E.; McCutcheon, K.; Keenan, M.J. Failure to ferment dietary resistant starch in specific mouse models of obesity results in no body fat loss. J. Agric. Food Chem. 2009, 57, 8844–8851. [Google Scholar] [CrossRef] [PubMed]
- Shen, L.; Keenan, M.J.; Raggio, A.; Williams, C.; Martin, R.J. Dietary-resistant starch improves maternal glycemic control in Goto-Kakizaki rat. Mol. Nutr. Food Res. 2011, 55, 1499–1508. [Google Scholar] [CrossRef] [PubMed]
- Venkataraman, A.; Sieber, J.R.; Schmidt, A.W.; Waldron, C.; Theis, K.R.; Schmidt, T.M. Variable responses of human microbiomes to dietary supplementation with resistant starch. Microbiome 2016, 4. [Google Scholar] [CrossRef]
- Nichenametla, S.N.; Weidauer, L.A.; Wey, H.E.; Beare, T.M.; Specker, B.L.; Dey, M. Resistant starch type 4-enriched diet lowered blood cholesterols and improved body composition in a double blind controlled cross-over intervention. Mol. Nutr. Food Res. 2014, 58, 1365–1369. [Google Scholar] [CrossRef] [PubMed]
- Martinez, I.; Kim, J.; Duffy, P.R.; Schlegel, V.L.; Walter, J. Resistant starches types 2 and 4 have differential effects on the composition of the fecal microbiota in human subjects. PLoS ONE 2010, 5, e15046. [Google Scholar] [CrossRef] [PubMed]
- Artis, D. Epithelial-cell recognition of commensal bacteria and maintenance of immune homeostasis in the gut. Nat. Rev. Immunol. 2008, 8, 411–420. [Google Scholar] [CrossRef] [PubMed]
- Rorato, R.; Borges, B.C.; Uchoa, E.T.; Antunes-Rodrigues, J.; Elias, C.F.; Elias, L.L.K. LPS-Induced Low-Grade Inflammation Increases Hypothalamic JNK Expression and Causes Central Insulin Resistance Irrespective of Body Weight Changes. Int. J. Mol. Sci. 2017, 18, 1431. [Google Scholar] [CrossRef]
- Guilloteau, P.; Martin, L.; Eeckhaut, V.; Ducatelle, R.; Zabielski, R.; Van Immerseel, F. From the gut to the peripheral tissues: The multiple effects of butyrate. Nutr. Res. Rev. 2010, 23, 366–384. [Google Scholar] [CrossRef]
- Ploger, S.; Stumpff, F.; Penner, G.B.; Schulzke, J.D.; Gäbel, G.; Martens, H.; Shen, Z.; Günzel, D.; Aschenbach, J.R. Microbial butyrate and its role for barrier function in the gastrointestinal tract. Ann. N. Y. Acad. Sci. 2012, 1258, 52–59. [Google Scholar] [CrossRef] [PubMed]
- Kinoshita, M.; Suzuki, Y.; Saito, Y. Butyrate reduces colonic paracellular permeability by enhancing PPARgamma activation. Biochem. Biophys. Res. Commun. 2002, 293, 827–831. [Google Scholar] [CrossRef]
- Charrier, J.A.; Martin, R.J.; McCutcheon, K.L.; Raggio, A.M.; Goldsmith, F.; Goita, M.; Senevirathne, R.N.; Brown, I.L.; Pelkman, C.; Zhou, J.; et al. High fat diet partially attenuates fermentation responses in rats fed resistant starch from high-amylose maize. Obesity 2013, 21, 2350–2355. [Google Scholar] [CrossRef] [PubMed]
- Roberfroid, M.; Gibson, G.R.; Hoyles, L.; McCartney, A.L.; Rastall, R.; Rowland, I.; Wolvers, D.; Watzl, B.; Szajewska, H.; Stahl, B.; et al. Prebiotic effects: Metabolic and health benefits. Br. J. Nutr. 2010, 104 (Suppl. 2), S1–S63. [Google Scholar] [CrossRef] [PubMed]
- Han, K.H.; Iijuka, M.; Shimada, K.; Sekikawa, M.; Kuramochi, K.; Ohba, K.; Ruvini, L.; Chiji, H.; Fukushima, M. Adzuki resistant starch lowered serum cholesterol and hepatic 3-hydroxy-3-methylglutaryl-CoA mRNA levels and increased hepatic LDL-receptor and cholesterol 7alpha-hydroxylase mRNA levels in rats fed a cholesterol diet. Br. J. Nutr. 2005, 94, 902–908. [Google Scholar] [CrossRef] [PubMed]
- Baddini Feitoza, A.; Fernandes Pereira, A.; Ferreira da Costa, N.; Goncalves Ribeiro, B. Conjugated linoleic acid (CLA): Effect modulation of body composition and lipid profile. Nutr. Hosp. 2009, 24, 422–428. [Google Scholar] [PubMed]
- Fava, F.; Lovegrove, J.A.; Gitau, R.; Jackson, K.G.; Tuohy, K.M. The gut microbiota and lipid metabolism: Implications for human health and coronary heart disease. Curr. Med. Chem. 2006, 13, 3005–3021. [Google Scholar]
- Bindels, L.B.; Segura Munoz, R.R.; Gomes-Neto, J.C.; Mutemberezi, V.; Martinez, I.; Salazar, N.; Cody, E.A.; Quintero-Vallegas, M.I.; Kittana, H.; de Los Reyes-Gavilan, C.G.; et al. Resistant starch can improve insulin sensitivity independently of the gut microbiota. Microbiome 2017, 5, 12. [Google Scholar] [CrossRef]


| Study Author/Year | Participants (Country, Age, No. of Participants, Gender, Health Status, BMI) | Study Design | Resistant Starch Intervention (Dose) | Type of RS | Length of Intervention | Effect of RS Intervention Compared to Placebo on Metabolic Outcomes |
|---|---|---|---|---|---|---|
| Alfa et al. (2018) [34] | Canada, n = 42 healthy adults (24 females, 18 males), age range 32–50 years; median body weight 78.4 kg | Parallel RCT, double blinded | Random assignment to 2 groups (control: fully digestible corn starch, intervention: 70% resistant potato starch) RS = 30 g/day supplement containing 21 g RS2 | RS2 (Solanum tuberosum extract) | 12 weeks | ↔ fasting glucose ↔ total cholesterol ↔ HDL ↔ LDL ↔ TAG ↔ HOMA-IR |
| Behall et al. (1989) [35] | USA, n = 12 healthy men (mean age 34 years, mean body weight 77.3 kg) | Crossover RCT, blinding not specified | Random assignment to 2 groups (control: 70% amylopectin corn starch, intervention: 70% amylose corn-starch), no washout period RS = approx. 40 g/day | RS2 (HAM-RS2) | 5 weeks | ↔ fasting glucose ↓ total cholesterol ↔ HDL ↓ TAG |
| Behall et al. (1995) [36] | USA, n = 24 healthy or hyperinsulinemic subjects (mean age control 37.2 years, intervention 41.2 years; mean BMI control 24.2 kg/m2, intervention 27.1 kg/m2) | Crossover RCT, blinding not specified | Random assignment to 2 groups (control: 70% amylopectin + 30% amylose starch, intervention: 30% amylopectin + 70% amylose resistant dextrin), 4-week washout RS ≥ 55% of total CHO intake/day | RS2 (HAM-RS2) | 10 weeks | ↔ total cholesterol (healthy) ↔ total cholesterol (MetS) ↔ TAG (healthy) ↓ TAG (MetS) |
| Bergeron et al. (2016) [37] | USA, n = 52 healthy men and women (mean age 44 years, mean BMI 31 kg/m2) | Crossover RCT, double blinded | Random assignment to 4 groups (high CHO/high RS, high CHO/low RS, low CHO/high RS, low CHO/low RS), 2-week washout RS = 48–66 g/day | RS2 (HAM-RS2) | 2 weeks | ↔ fasting glucose ↔ total cholesterol ↔ HDL ↔ LDL ↔ TAG ↔ body weight |
| Ble-Castillo et al. (2010) [38] | Mexico, n = 30 adults with T2D (mean age 51.7 years; mean BMI 34.89 kg/m2) | Crossover RCT, single blinded | Random assignment to 2 groups (control: soy drink, intervention: native banana starch NBS drink), no washout period RS = 24 g/day NBS contained 8 g RS2 | RS2 (Native Banana Starch) | 4 weeks | ↔ fasting glucose ↔ insulin resistance ↔ HBA1c ↔ total cholesterol ↔ LDL ↔ HDL ↔ TAG ↓ body weight |
| Bodinham et al. (2012) [39] | UK, n = 12, overweight participants (mean age 37 years; mean BMI control 28.4 kg/m2, intervention 28.4 kg/m2) | Crossover RCT, single blinded | Random assignment to 2 groups (control: 27 g rapidly digestible starch or intervention: 67 g Hi-maize 260), 4-week washout RS = 40 g/day | RS2 (HAM-RS2) | 4 weeks | ↓ fasting glucose ↔ Insulin sensitivity ↑ fasting insulin ↑ first-phase insulin secretion ↔ total cholesterol ↔ HDL ↔ LDL ↔ TAG ↔ body weight ↔ waist circumference |
| Bodinham et al. (2014) [40] | UK, n = 17 adults with well-controlled T2DM (mean age 55 years; mean BMI 30.6 kg/m2) | Crossover RCT, single blinded | Random assignment to 2 groups (control: 27 g rapidly digestible starch or intervention: 67 g Hi-maize 260), 12-week washout RS = 40 g/day | RS2 (HAM-RS2) | 12 weeks | ↔ fasting glucose ↔ HbA1c ↔ insulin resistance (clamp) ↔ total cholesterol ↑ TAG ↔ weight ↔ waist circumference |
| Dainty et al. (2016) [41] | Canada, n = 24 adults with MetS (mean age 55.3, mean BMI 30.2 kg/m2) | Crossover RCT, double blinded | Random assignment to 2 groups (control: wheat bagel, intervention: high amylose maize RS bagel, 4-week washout RS = 25 g/day | RS2 (HAM-RS2) | 8 weeks | ↔ fasting glucose ↓ HOMA-IR ↔ body weight ↔ BMI |
| deRoos et al. (1995) [42] | The Netherlands, n = 24 healthy males (mean age 23; mean BMI 22.7 kg/m2) | Crossover RCT, single blinded | Random assignment to 3 groups (control: glucose, intervention 1: RS2, intervention 2: Retrograded RS3) RS = 30 g/day | RS2 and RS3 (only results for RS2 reported) | 1 week | ↔ satiety |
| Gargari et al. (2015) [43] | Iran, n = 60 women with T2DM (mean age control 49.6 years, intervention 49.5 years; mean BMI control 30.8 kg/m2, intervention 31.5 kg/m2) | Parallel RCT, triple blinded | Random assignment to 2 groups (control: maltodextrin, intervention: Hi Maize 260 RS2) RS = 10 g/day | RS2 | 8 weeks | ↔ fasting glucose ↓ HbA1c ↔ total cholesterol ↔ LDL ↑ HDL ↓ TAG |
| Gower et al. (2016) [44] | USA, n = 40 healthy or insulin resistant women (mean age 48.3 years; mean BMI 29.8 kg/m2) | Crossover RCT, double blinded | Random assignment to 3 groups (control: waxy corn starch, intervention 1: low RS, intervention 2: high RS), 4-week washout Low RS = 15 g/day High RS = 30 g/day | RS2 (HAM-RS2) (only results for High RS reported) | 4 weeks | ↔ fasting glucose (healthy) ↔ fasting glucose (MetS) ↔ insulin sensitivity (healthy) ↑ insulin sensitivity (MetS) ↔ total cholesterol (healthy) ↔ total cholesterol (MetS) ↔ HDL (healthy) ↔ HDL (MetS) ↔ TAG (healthy) ↔ TAG (MetS) |
| Heijnen et al. (1996) [45] | The Netherlands, n = 60 healthy males and females (mean age 24.0 years; mean BMI 22.3 kg/m2) | Crossover RCT, single blinded | Random assignment to 6 groups. Each group consumed the following 3 supplements in one of 6 different sequences, with no washout period in between (control: glucose, intervention 1: RS2—High amylose resistant corn starch, intervention 2: RS3—Retrograded high amylose resistant corn starch) RS3 intervention = 30 g/day RS2 intervention = 30 g/day | RS2 and RS3 (only results for RS2 reported) | 3 weeks | ↔ total cholesterol ↔ HDL ↔ LDL ↔ TAG ↔ body weight |
| Jenkins et al. (1998) [46] | Canada, n = 24 healthy adults (mean age 33 years, mean BMI 23.7 kg/m²) | Crossover RCT, blinding not specified | Random assignment to 4 groups (control group 1: low fiber, control group 2: 30 g wheat bran, intervention 1: RS2—High amylose resistant starch, intervention 2: RS3—Retrograded high amylose resistant cornstarch), 2-week washout RS = 21.5 g/day | RS2 and RS3 (only results for RS2 reported) | 2 weeks | ↔ total cholesterol ↔ HDL ↔ LDL ↔ TAG ↑ satiety |
| Johnston et al. (2010) [47] | UK, n = 20 insulin resistant adults (8 females, 12 males; mean age control 50.1 years, mean age intervention 45.2 years; mean BMI control 30.4 kg/m2, mean BMI intervention 31.3 kg/m2) | Parallel RCT, single blinded | Random assignment to 2 groups (control: rapidly digestible starch, intervention: Hi-Maize 260 RS) RS = 40 g/day | RS2 (HAM-RS2) | 12 weeks | ↑ insulin sensitivity (clamp) ↔ body weight |
| Karimi et al. (2016) [48] | Iran, n = 56 women with T2DM (mean age control 48.6 years, mean age intervention 49.5 years; mean BMI control 31.0 kg/m2, mean BMI intervention 31.5 kg/m2) | Parallel RCT, triple blinded | Random assignment to 2 groups (control: maltodextrin, intervention: Hi-Maize 260 RS) RS = 10 g/day | RS2 (HAM-RS2) | 8 weeks | ↔ fasting glucose ↓ HbA1c ↓ HOMA-IR |
| Maki et al. (2012) [49] | USA, n = 33 overweight or obese adults (mean age 49.5 years; mean BMI 30.6 kg/m2) | Crossover RCT, double blinded | Random assignment to 3 groups (control: rapidly digestible starch, intervention 1: low HAM-RS2, intervention 2: high HAM-RS2), 3-week washout Low RS = 15 g/day High RS = 30 g/day | RS2 (HAM-RS2) (only results for High RS reported) | 4 weeks | ↔ fasting glucose ↔ insulin sensitivity (women) ↑ insulin sensitivity (men) |
| Maziarz et al. (2017) [50] | USA, n = 18 overweight adults (mean age control 31.2 years, intervention 31.0 years; mean BMI control 30.6 kg/m2, intervention 34.8 kg/m2) | Parallel RCT, double blinded | Random assignment to 2 groups (control: placebo muffin, intervention: muffin containing HAM-RS2) RS = 30 g/day | RS2 (HAM-RS2) | 6 weeks | ↔ satiety |
| Noakes et al. (1996) [51] | USA, n = 23 overweight adults with hypertriglyceridemia (mean age women 51 years, men 51 years; mean BMI women 29 kg/m2, men 29 kg/m2) | Crossover RCT, single blinded | Random assignment to 3 groups (control: low amylose, intervention 1: high oat bran, intervention 2: high amylose cornstarch (17 g RS for women and 25 g RS for men), no washout RS = 17 g RS for women, 25 g RS for men | RS2 (HAM-RS2) | 4 weeks | ↔ fasting glucose ↔ total cholesterol ↔ HDL ↔ LDL ↔ TAG |
| Penn-Marshall et al. (2010) [52] | USA, n = 15 adults with MetS (mean age 36.6 years; mean BMI 37.7 kg/m²) | Crossover RCT, double blinded | Random assignment to 2 groups (control: regular bread, intervention: bread made with added RS), 2-week washout RS = 12 g/day | RS2 (HAM-RS2) | 6 weeks | ↔ fasting glucose ↔ fasting insulin ↔ HOMA-IR ↔ fructosamine ↔ body weight ↔ BMI ↔ waist circumference |
| Peterson et al. (2018) [53] | USA, n = 59 overweight or obese adults with diagnosed prediabetes (20 males, 39 females); mean age 55 years; mean BMI 35.6 kg/m² | Parallel RCT, double blinded | Random assignment to 2 groups (control: rapidly digestible cornstarch amylopectin, intervention: Hi-Maize 260 RS) RS = 45 g/day | RS2 (HAM-RS2) | 12 weeks | ↓ HbA1c ↔ fasting glucose ↔ fasting insulin ↔ HOMA-IR ↔ total cholesterol ↔ HDL ↔ LDL ↔ TAG |
| Robertson et al. (2005) [54] | UK, n = 10 healthy adults (mean age 48.5 years; mean BMI 23.4 kg/m2) | Crossover RCT, single blinded | Random assignment to 2 groups (control: rapidly digestible starch, intervention: Hi-Maize 260), 4-week washout RS = 30 g/day | RS2 (HAM-RS2) | 4 weeks | ↔ fasting glucose ↔ HOMA-IR ↑ insulin sensitivity (clamp) ↔ body weight ↔ BMI |
| Robertson et al. (2012) [55] | UK, n = 15 adults with MetS (Age range 25–70 years; mean BMI 33.8 kg/m2) | Crossover RCT, single blinded | Random assignment to 2 groups (control: rapidly digestible starch, intervention—HAM-RS2), 8-week washout RS = 40 g/day | RS2 (HAM-RS2) | 8 weeks | ↔ fasting glucose ↔ insulin resistance (clamp) ↔ total cholesterol ↔ TAG ↔ body weight |
| Study Author/Year | Risk of Bias a | Bias Minimization Items b | ||||||
|---|---|---|---|---|---|---|---|---|
| 1 | 2 | 3 | 4 | 5 | 6 | Other | ||
| Alfa et al. (2018) [34] | Low | + | + | ? | + | + | + | Unclear whether funding and sponsorship free from bias |
| Behall et al. (1989) [35] | Unclear | ? | ? | ? | ? | + | ? | Unclear whether funding and sponsorship free from bias |
| Behall et al. (1995) [36] | High | ? | ? | ? | ? | + | - | Unclear whether funding and sponsorship free from bias |
| Bergeron et al. (2016) [37] | Low | + | + | + | - | ? | + | Funding and sponsorship free from bias |
| Ble-Castillo et al. (2010) [38] | High | - | ? | ? | - | + | + | Funding and sponsorship free from bias |
| Bodinham et al. (2012) [39] | High | - | ? | + | - | ? | + | Funding and sponsorship free from bias |
| Bodinham et al. (2014) [40] | Unclear | + | ? | + | - | ? | ? | Funding and sponsorship free from bias |
| Dainty et al. (2016) [41] | Unclear | + | + | ? | ? | + | ? | Unclear whether funding and sponsorship free from bias |
| De Roos et al. (1995) [42] | Unclear | ? | ? | + | ? | + | ? | Unclear whether funding and sponsorship free from bias |
| Gargari et al. (2015) [43] | Unclear | + | + | + | + | + | ? | Funding and sponsorship free from bias. Unspecified overlap between subjects participating in this study and another [48] undertaken by the same research group. Significant outcomes not replicated by other studies performed in similar patient groups. |
| Gower et al. (2016) [44] | Low | ? | + | + | ? | + | + | Unclear whether funding and sponsorship free from bias |
| Heijnen et al. (1996) [45] | Unclear | ? | ? | ? | + | + | ? | Funding and sponsorship free from bias |
| Jenkins et al. (1998) [46] | Unclear | ? | ? | ? | ? | + | ? | Unclear whether funding and sponsorship free from bias |
| Johnston et al. (2010) [47] | Unclear | ? | ? | + | ? | + | ? | Funding and sponsorship free from bias |
| Karimi et al. (2016) [48] | Unclear | + | + | + | + | + | ? | Funding and sponsorship free from bias. Unspecified overlap between subjects participating in this study and another [43] undertaken by the same research group. Significant outcomes not replicated by other studies performed in similar patient groups. |
| Maki et al. (2012) [49] | Unclear | - | ? | + | + | ? | + | Unclear whether funding and sponsorship free from bias |
| Maziarz et al. (2017) [50] | Low | + | + | + | + | + | + | Funding and sponsorship free from bias |
| Noakes et al. (1996) [51] | Unclear | ? | ? | + | ? | ? | ? | Funding and sponsorship free from bias |
| Penn-Marshall et al. (2010) [52] | Unclear | ? | ? | + | ? | + | + | Funding and sponsorship free from bias |
| Peterson et al. (2018) [53] | Low | + | + | + | + | + | + | Unclear whether funding and sponsorship free from bias |
| Robertson et al. (2005) [54] | Unclear | ? | ? | ? | ? | ? | ? | Funding and sponsorship free from bias |
| Robertson et al. (2012) [55] | Low | - | + | + | - | + | + | Unclear whether funding and sponsorship free from bias |
© 2019 by the authors. Licensee MDPI, Basel, Switzerland. This article is an open access article distributed under the terms and conditions of the Creative Commons Attribution (CC BY) license (http://creativecommons.org/licenses/by/4.0/).
Share and Cite
Snelson, M.; Jong, J.; Manolas, D.; Kok, S.; Louise, A.; Stern, R.; Kellow, N.J. Metabolic Effects of Resistant Starch Type 2: A Systematic Literature Review and Meta-Analysis of Randomized Controlled Trials. Nutrients 2019, 11, 1833. https://doi.org/10.3390/nu11081833
Snelson M, Jong J, Manolas D, Kok S, Louise A, Stern R, Kellow NJ. Metabolic Effects of Resistant Starch Type 2: A Systematic Literature Review and Meta-Analysis of Randomized Controlled Trials. Nutrients. 2019; 11(8):1833. https://doi.org/10.3390/nu11081833
Chicago/Turabian StyleSnelson, Matthew, Jessica Jong, Deanna Manolas, Smonda Kok, Audrey Louise, Romi Stern, and Nicole J. Kellow. 2019. "Metabolic Effects of Resistant Starch Type 2: A Systematic Literature Review and Meta-Analysis of Randomized Controlled Trials" Nutrients 11, no. 8: 1833. https://doi.org/10.3390/nu11081833
APA StyleSnelson, M., Jong, J., Manolas, D., Kok, S., Louise, A., Stern, R., & Kellow, N. J. (2019). Metabolic Effects of Resistant Starch Type 2: A Systematic Literature Review and Meta-Analysis of Randomized Controlled Trials. Nutrients, 11(8), 1833. https://doi.org/10.3390/nu11081833