Snacking Patterns in Children: A Comparison between Australia, China, Mexico, and the US

Abstract
1. Introduction
2. Materials and Methods
2.1. Study Population
2.2. Dietary Assessment
2.3. Definition of Snacking
2.4. Statistical Analyses
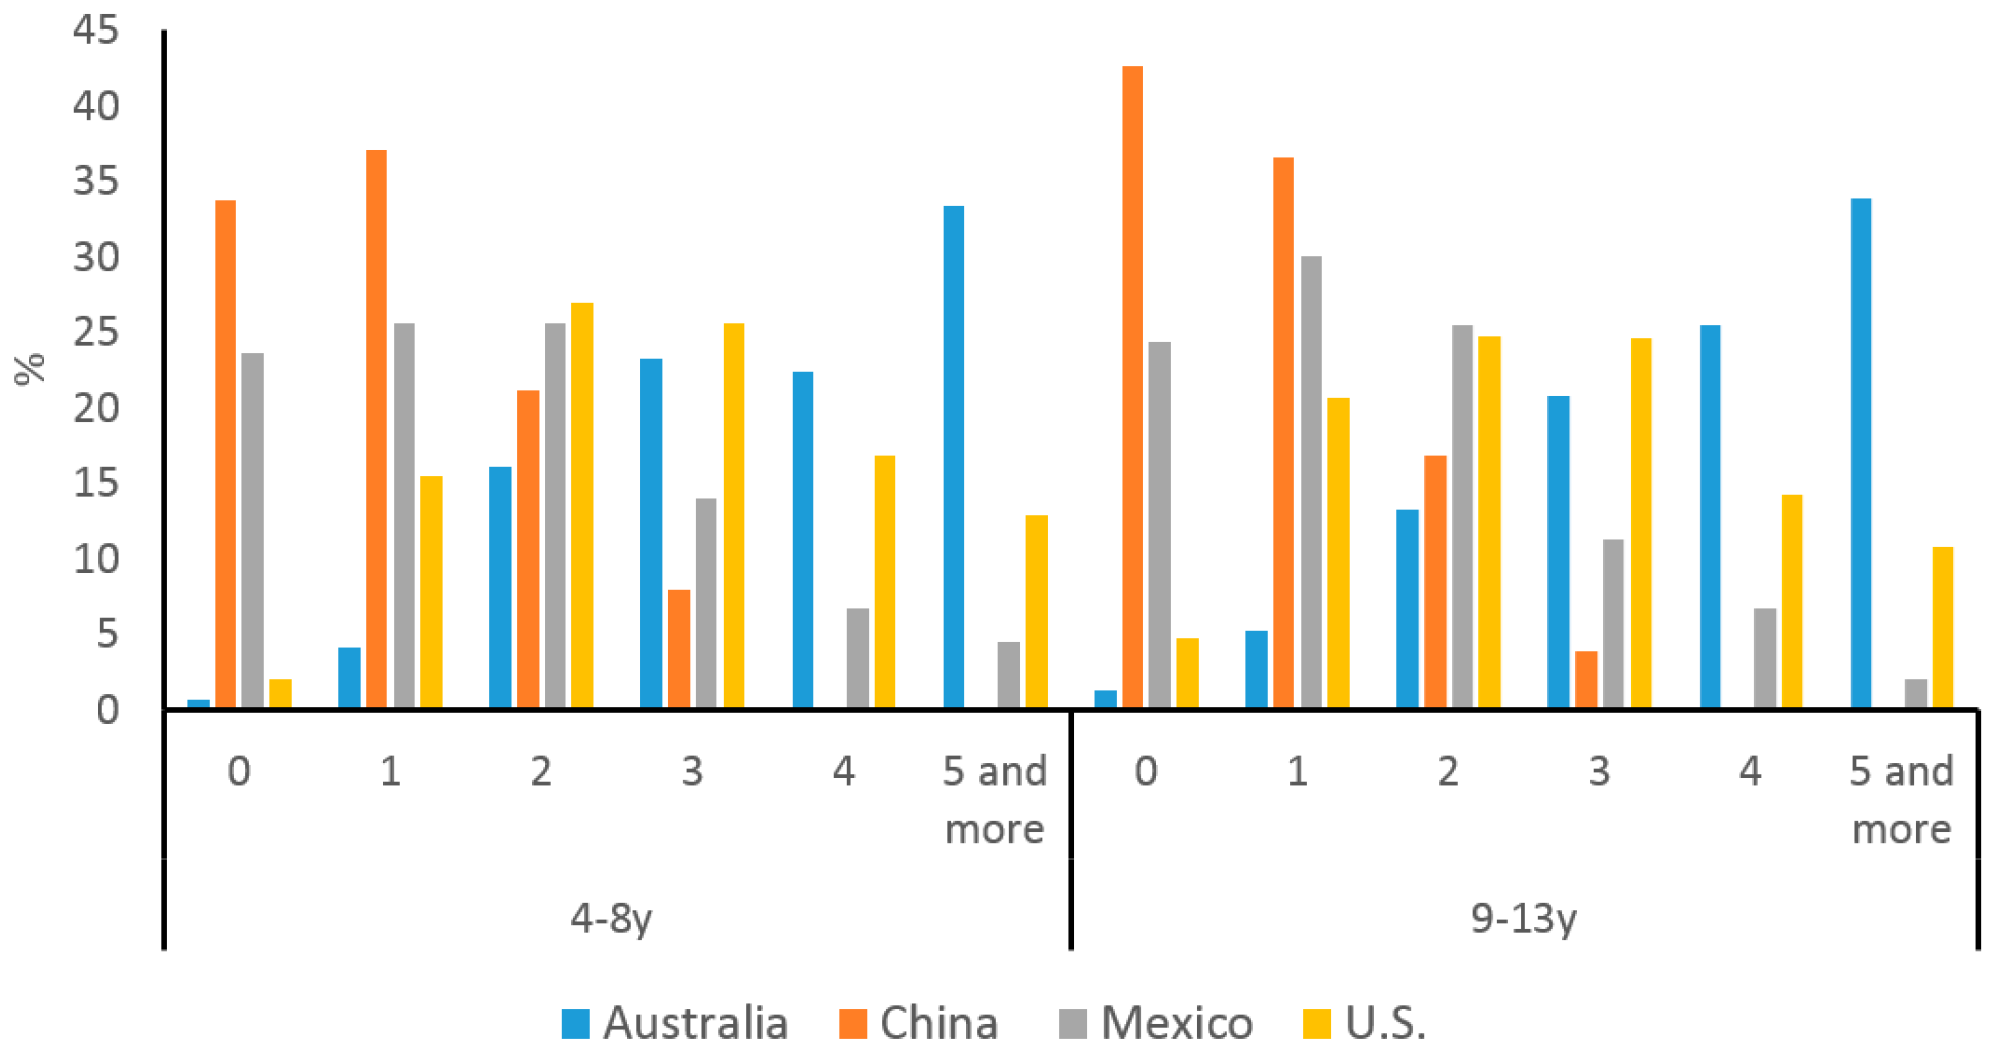
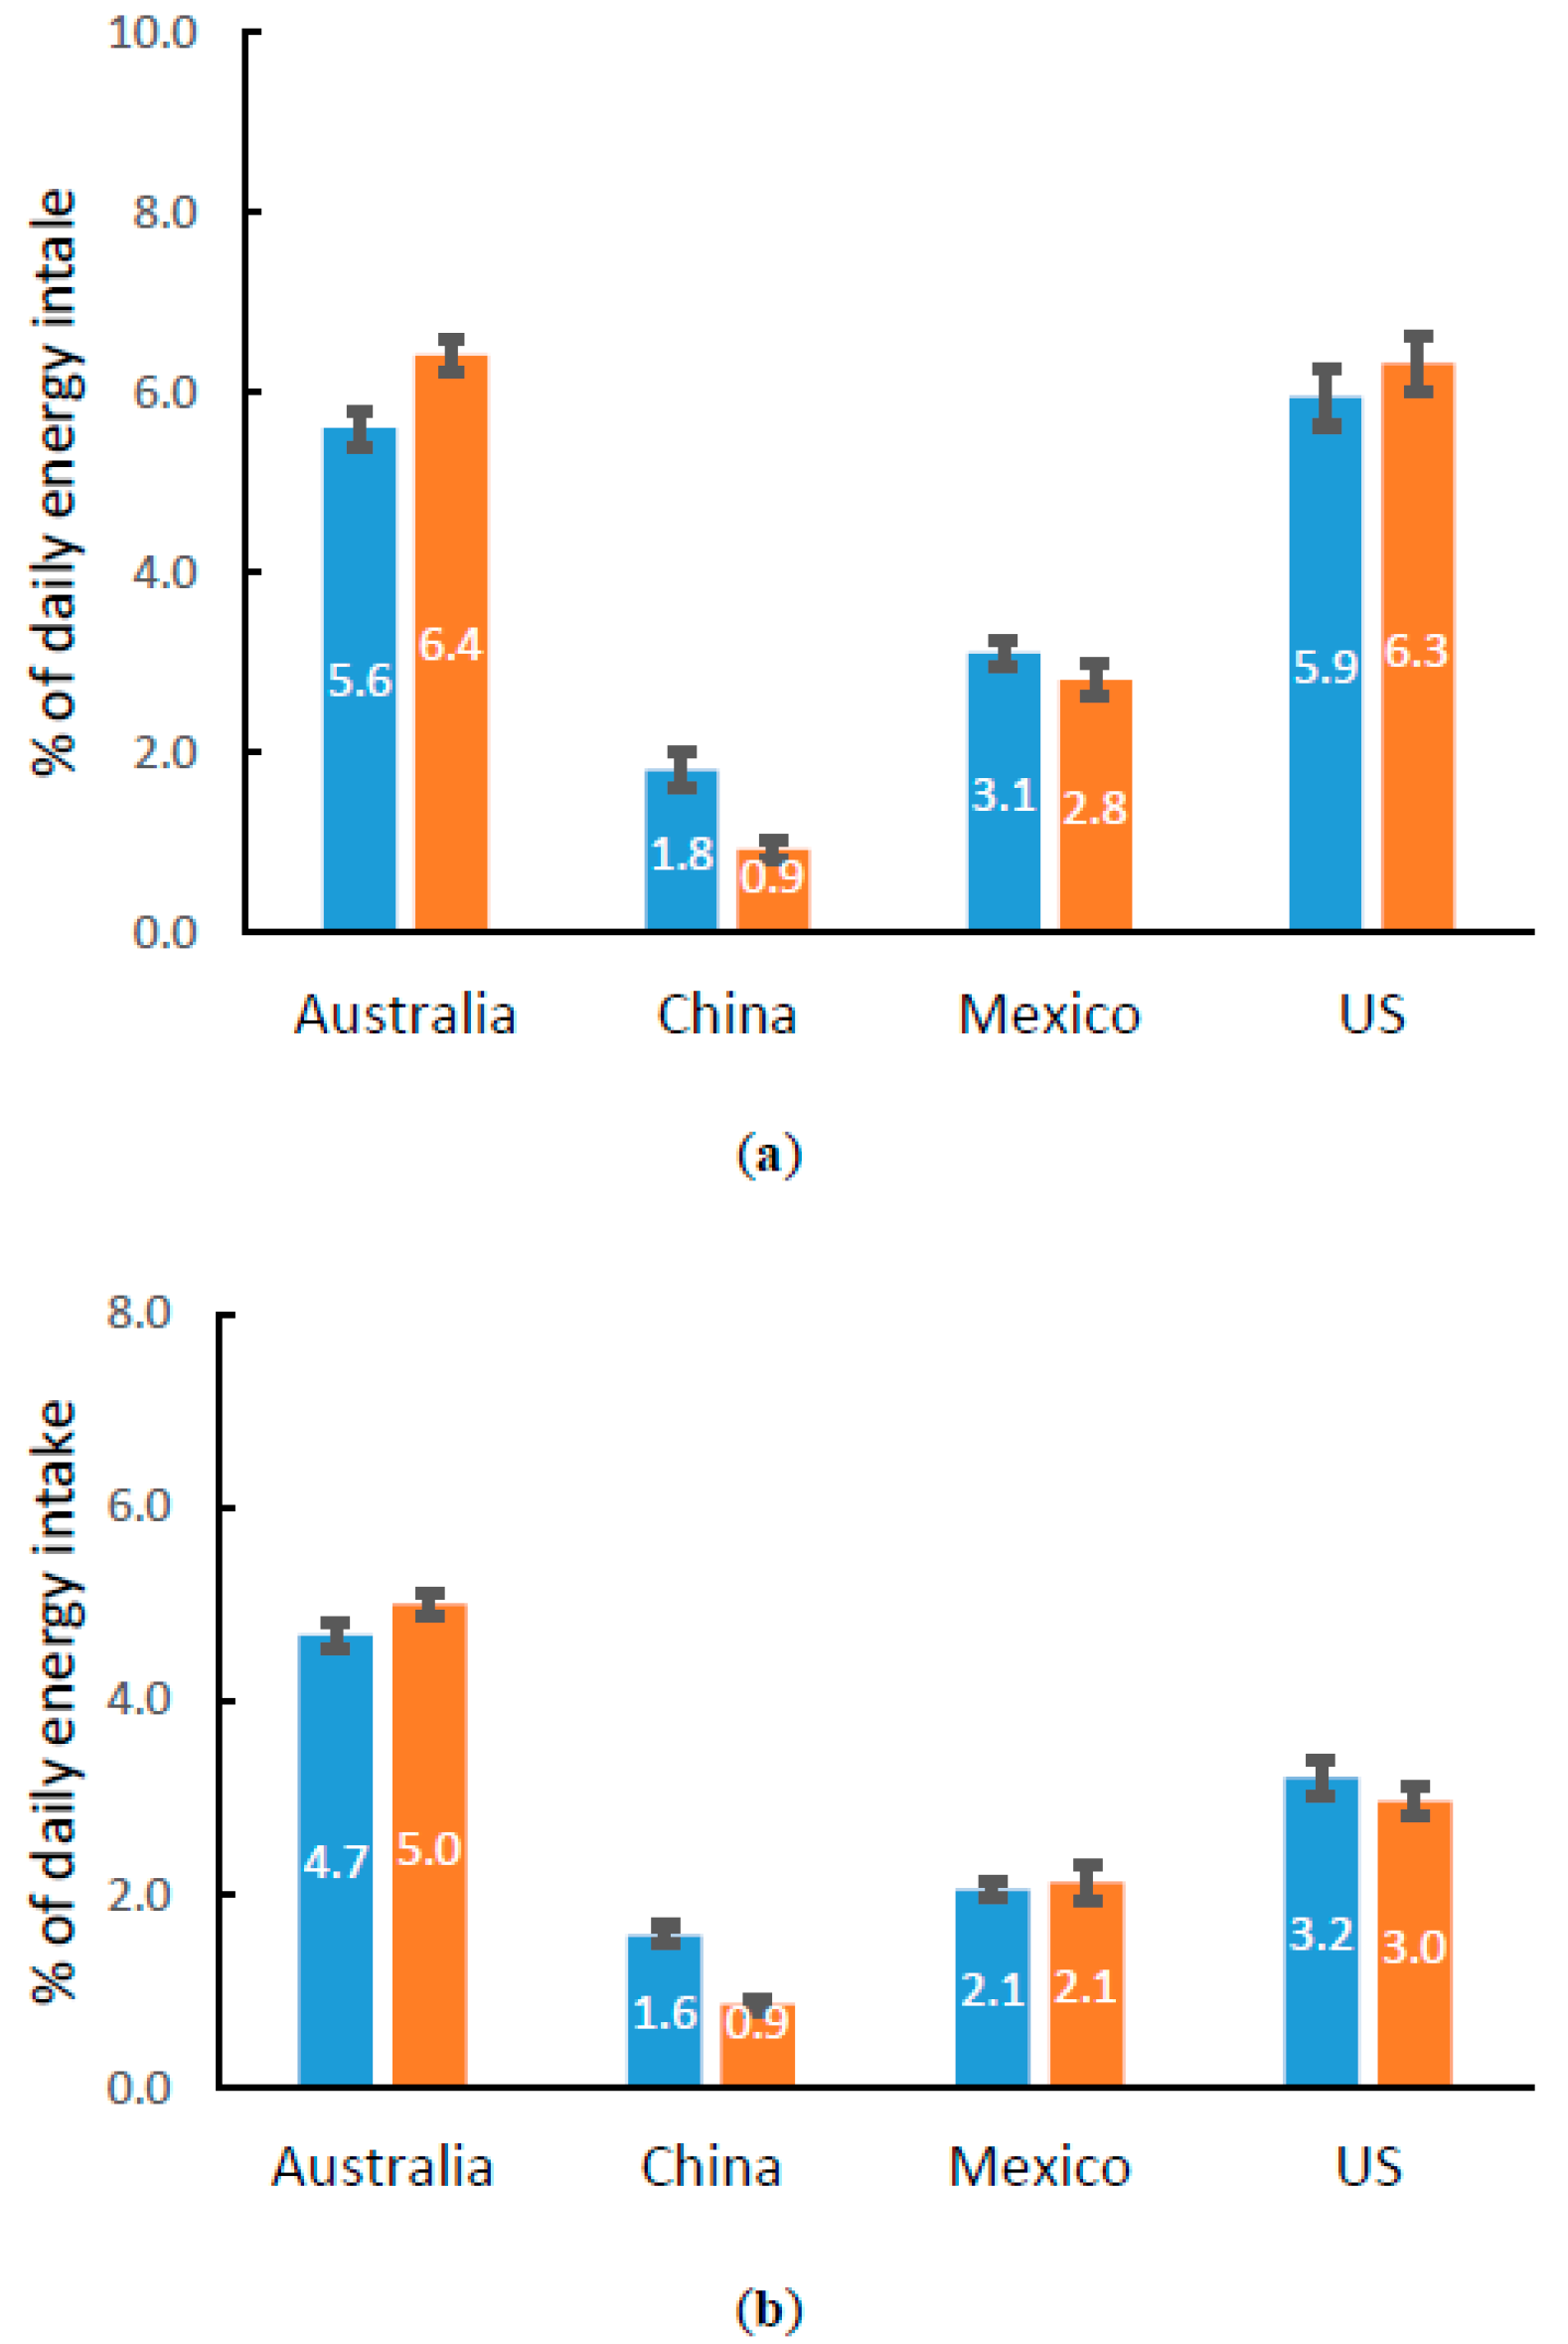
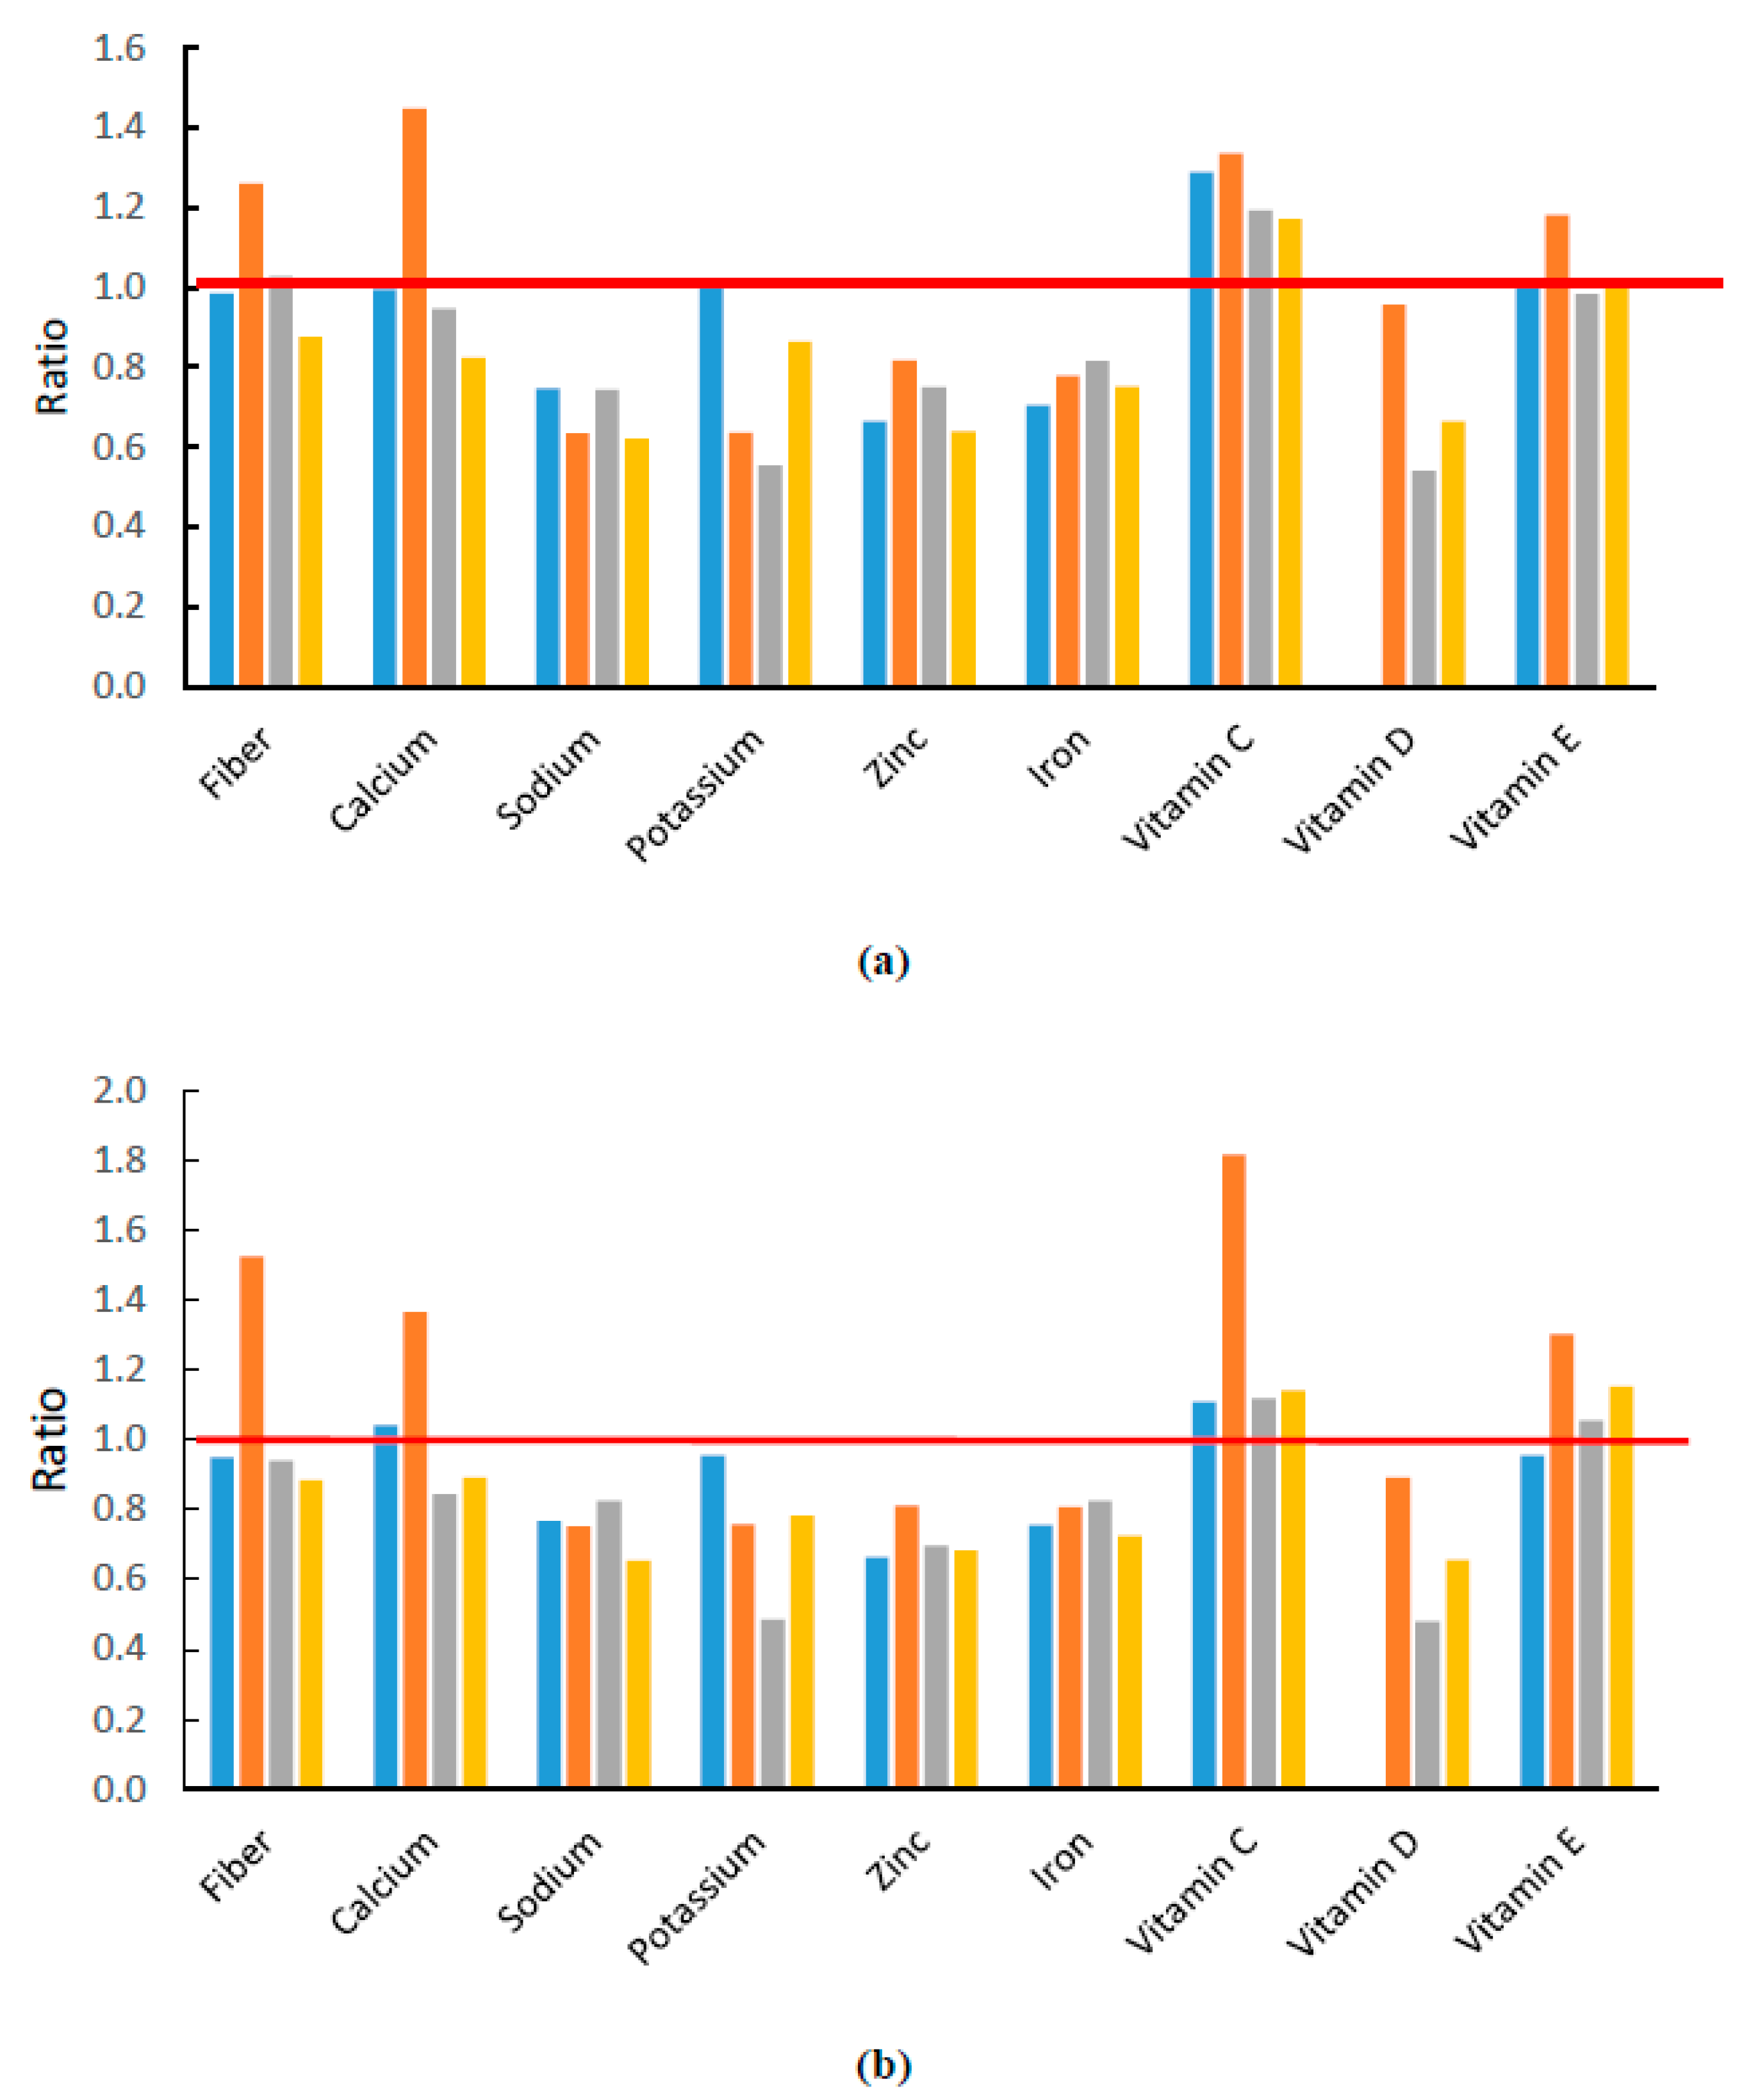
3. Results
4. Discussion
5. Conclusions
Acknowledgments
Author Contributions
Conflicts of Interest
References
- Piernas, C.; Popkin, B.M. Trends in snacking among US Children. Health Aff. 2010, 29, 398–404. [Google Scholar] [CrossRef] [PubMed]
- US Department of Agriculture, Agriculture Research Service. Percentages of Selected Nutrients Contributed by Food and Beverages Consumed at Snack Occasions, by Gender and Age, What We Eat in America, NHANES 2013–2014. Available online: https://www.ars.usda.gov/ARSUserFiles/80400530/pdf/1314/Table_25_SNK_GEN_13.pdf (accessed on 23 October 2017).
- Fayet-Moore, F.; Peters, V.; McConnell, A.; Petocz, P.; Eldridge, A.L. Weekday snacking prevalence, frequency, and energy contribution have increased while foods consumed during snacking have shifted among Australian children and adolescents: 1995, 2007 and 2011–12 national nutrition surveys. Nutr. J. 2017, 16, 65. [Google Scholar] [CrossRef] [PubMed]
- Wang, Z.; Zhai, F.; Zhang, B.; Popkin, B.M. Trends in Chinese snacking behaviors and patterns and the social-demographic role between 1991 and 2009. Asia Pac. J. Clin. Nutr. 2012, 21, 253–262. [Google Scholar] [PubMed]
- Taillie, L.S.; Afeiche, M.C.; Eldridge, A.L.; Popkin, B.M. Increased snacking and eating occasions are associated with higher energy intake among Mexican children aged 2–13 years. J. Nutr. 2015, 145, 2570–2577. [Google Scholar] [CrossRef] [PubMed]
- Wang, D.; van der Horst, K.; Jacquier, E.; Eldridge, A.L. Snacking among us children: Patterns differ by time of day. J. Nutr. Educ. Behav. 2016, 48, 369–375. [Google Scholar] [CrossRef] [PubMed]
- Rehm, C.D.; Drewnowski, A. Replacing american snacks with tree nuts increases consumption of key nutrients among US children and adults: Results of an NHANES modeling study. Nutr. J. 2017, 16, 17. [Google Scholar] [CrossRef] [PubMed]
- Evans, E.W.; Jacques, P.F.; Dallal, G.E.; Sacheck, J.; Must, A. The role of eating frequency on total energy intake and diet quality in a low-income, racially diverse sample of schoolchildren. Public Health Nutr. 2014, 1–8. [Google Scholar] [CrossRef] [PubMed]
- Murakami, K.; Livingstone, M.B. Associations between meal and snack frequency and overweight and abdominal obesity in US children and adolescents from national health and nutrition examination survey (NHANES) 2003–2012. Br. J. Nutr. 2016, 115, 1819–1829. [Google Scholar] [CrossRef] [PubMed]
- The National Institute of Nutrition and Health. Chinese Children and Adolescents Snacking Guidance; China Center for Disease Control and Prevention: Beijing, China, 2008.
- Secretaría de Educación, Secretaria de Salud. Acuerdo Mediante el Cual se Establecen los Lineamientos Generales para el Expendio o Distribución de Alimentos y Bebidas Preparados y Procesados en las Escuelas del Sistema Educativo Nacional. In Diario Oficial de la Federación; 16 May 2014. Available online: http://www.dof.gob.mx/nota_detalle.php?codigo=5344984&fecha=16/05/2014 (accessed on 23 October 2017).
- National Health and Medical Research Council. Australian Dietary Guidelines; National Health and Medical Research Council: Canberra, Australia, 2013.
- Arenas, A.B.; Fernández-Gaxiola, A.C.; Belausteguigoitia, M.P.; Kaufer-Horwitz, M.; Lizaur, A.B.P.; Dommarco, J.A.R. Guías Alimentarias y de Actividad Física en Contexto de Sobrepeso y Obesidad en la Población Mexicana; Secretaria de Salud: Ciudad de México, Mexico, 2015.
- US Department of Health and Human Services; US Department of Agriculture. 2015–2020 Dietary Guidelines for Americans, 8th ed.; United States Department of Agriculture: Washington, DC, USA, 2015.
- Australian Health Survey: First Results, 2011–12; Australian Bureau of Statistics: Canberra, Australia, 2012.
- Zhang, B.; Zhai, F.Y.; Du, S.F.; Popkin, B.M. The china health and nutrition survey, 1989–2011. Obes. Rev. 2014, 15 (Suppl. 1), 2–7. [Google Scholar] [CrossRef] [PubMed]
- Romero-Martinez, M.; Shamah-Levy, T.; Franco-Nunez, A.; Villalpando, S.; Cuevas-Nasu, L.; Gutierrez, J.P.; Rivera-Dommarco, J.A. [National health and nutrition survey 2012: Design and coverage]. Salud Publ. Mex. 2013, 55 (Suppl. 2), S332–S340. [Google Scholar]
- Johnson, C.L.; Paulose-Ram, R.; Ogden, C.L.; Carroll, M.D.; Kruszon-Moran, D.; Dohrmann, S.M.; Curtin, L.R. National health and nutrition examination survey: Analytic guidelines, 1999–2010. Vital Health Stat. 2 2013, 161, 1–24. [Google Scholar]
- Center for Disease Control. National Health and Nutrition Examination Survey: Analytic Guidelines, 2011–2012; National Center for Health Statistics, Centers for Disease Control and Prevention: Atlanta, GA, USA, 2013.
- Moshfegh, A.J.; Rhodes, D.G.; Baer, D.J.; Murayi, T.; Clemens, J.C.; Rumpler, W.V.; Paul, D.R.; Sebastian, R.S.; Kuczynski, K.J.; Ingwersen, L.A.; et al. The US department of agriculture automated multiple-pass method reduces bias in the collection of energy intakes. Am. J. Clin. Nutr. 2008, 88, 324–332. [Google Scholar] [PubMed]
- Blanton, C.A.; Moshfegh, A.J.; Baer, D.J.; Kretsch, M.J. The USDA automated multiple-pass method accurately estimates group total energy and nutrient intake. J. Nutr. 2006, 136, 2594–2599. [Google Scholar] [CrossRef] [PubMed]
- Food Standards Australia New Zealand. Ausnut 2011–13-Australian Food Composition Database; Food Standards Australia New Zealand: Canberra, Australia, 2014.
- Yang, Y.; Wang, G.; Pan, X. China Food Composition; Peking University Medical Press: Beijing, China, 2002. [Google Scholar]
- Piernas, C.; Wang, D.; Du, S.; Zhang, B.; Wang, Z.; Su, C.; Popkin, B.M. Obesity, non-communicable disease (NCD) risk factors and dietary factors among Chinese school-aged children. Asia Pac. J. Clin. Nutr. 2016, 25, 826–840. [Google Scholar] [CrossRef] [PubMed]
- Food and Nutrient Database for Dietary Studies 2013–2014. Available online: https://www.ars.usda.gov/northeast-area/beltsville-md/beltsville-human-nutrition-research-center/food-surveys-research-group/docs/fndds-download-databases/ (accessed on 23 October 2017).
- Lopez-Olmedo, N.; Carriquiry, A.L.; Rodriguez-Ramirez, S.; Ramirez-Silva, I.; Espinosa-Montero, J.; Hernandez-Barrera, L.; Campirano, F.; Martinez-Tapia, B.; Rivera, J.A. Usual intake of added sugars and saturated fats is high while dietary fiber is low in the Mexican population. J. Nutr. 2016, 146, 1856S–1865S. [Google Scholar] [CrossRef] [PubMed]
- United States Department of Agriculture. USDA National Nutrient Database for Standard Reference, Release 26; US Department of Agriculture, Agricultural Research Service, Nutrient Data Laboratory: Washington, DC, USA, 2013.
- Food Standards Australia New Zealand. AUSNUT 2011–2013 Food and Dietary Supplement Classification System; Food Standard Australia New Zealand: Canberra, Australia. Available online: http://www.foodstandards.gov.au/science/monitoringnutrients/ausnut/ausnutdatafiles/Pages/foodclassification.aspx (accessed on 23 October 2017).
- Afeiche, M.C.; Koyratty, B.N.S.; Wang, D.; Jacquier, E.F.; Le, K.A. Intakes and sources of total and added sugars among 4 to 13-year-old children in China, Mexico and the United States. Pediatr. Obes. 2017. [Google Scholar] [CrossRef] [PubMed]
- US Department of Agriculture, Agriculture Research Sevice. What We Eat in America Food Categories. Available online: https://www.ars.usda.gov/ARSUserFiles/80400530/pdf/1314/food_category_list.pdf (accessed on 23 October 2017).
- US Department of Agriculture, Agriculture Research Sevice. What We Eat in America Food Categories 2013–2014. Available online: www.ars.usda.gov/nea/bhnrc/fsrg (accessed on 23 October 2017).
- Fayet-Moore, F.; McConnell, A.; Kim, J.; Mathias, K.C. Identifying eating occasion-based opportunities to improve the overall diets of Australian adolescents. Nutrients 2017, 9, 608. [Google Scholar] [CrossRef] [PubMed]
- China Nutrition Society. Chinese Dietary Reference iIntakes (Version) 2013; Science Press: Beijing, China, 2014. [Google Scholar]
- Guelinckx, I.; Iglesia, I.; Bottin, J.H.; De Miguel-Etayo, P.; Gonzalez-Gil, E.M.; Salas-Salvado, J.; Kavouras, S.A.; Gandy, J.; Martinez, H.; Bardosono, S.; et al. Intake of water and beverages of children and adolescents in 13 countries. Eur. J. Nutr. 2015, 54, 69–79. [Google Scholar] [CrossRef] [PubMed]
- Piernas, C.; Barquera, S.; Popkin, B.M. Current patterns of water and beverage consumption among Mexican children and adolescents aged 1–18 years: Analysis of the Mexican national health and nutrition survey 2012. Public Health Nutr. 2014, 17, 2166–2175. [Google Scholar] [CrossRef] [PubMed]
- Lei, L.; Rangan, A.; Flood, V.M.; Louie, J.C. Dietary intake and food sources of added sugar in the Australian population. Br. J. Nutr. 2016, 115, 868–877. [Google Scholar] [CrossRef] [PubMed]
- Sanchez-Pimienta, T.G.; Batis, C.; Lutter, C.K.; Rivera, J.A. Sugar-sweetened beverages are the main sources of added sugar intake in the Mexican population. J. Nutr. 2016, 146, 1888S–1896S. [Google Scholar] [CrossRef] [PubMed]
- Grimes, C.A.; Riddell, L.J.; Campbell, K.J.; Nowson, C.A. Dietary salt intake assessed by 24 h urinary sodium excretion in Australian schoolchildren aged 5–13 years. Public Health Nutr. 2013, 16, 1789–1795. [Google Scholar] [CrossRef] [PubMed]
- Quader, Z.S.; Gillespie, C.; Sliwa, S.A.; Ahuja, J.K.; Burdg, J.P.; Moshfegh, A.; Pehrsson, P.R.; Gunn, J.P.; Mugavero, K.; Cogswell, M.E. Sodium intake among us school-aged children: National health and nutrition examination survey, 2011–2012. J. Acad. Nutr. Diet. 2016. [Google Scholar] [CrossRef] [PubMed]
- World Health Organization. Guideline; Sodium Intake for Adults and Children. 2012. Available online: http://apps.who.int/iris/bitstream/10665/77985/1/9789241504836_eng.pdf?ua=1&ua=1 (accessed on 13 November 2017).
- He, F.J.; Brinsden, H.C.; MacGregor, G.A. Salt reduction in the United Kingdom: A successful experiment in public health. J. Hum. Hypertens. 2014, 28, 345–352. [Google Scholar] [CrossRef] [PubMed]
- World Health Organization. Policy brief: Producing and Promoting More Food Products Consistent with a Healthy Diet. 2014. Available online: http://www.who.int/nmh/ncd-coordination-mechanism/Policybrief32.pdf (accessed on 18 October 2017).
- Hendrie, G.A.; Brindal, E.; Baird, D.; Gardner, C. Improving children’s dairy food and calcium intake: Can intervention work? A systematic review of the literature. Public Health Nutr. 2013, 16, 365–376. [Google Scholar] [CrossRef] [PubMed]
- Wang, H.; Wang, D.; Ouyang, Y.; Huang, F.; Ding, G.; Zhang, B. Do Chinese children get enough micronutrients? Nutrients 2017, 9, 397. [Google Scholar] [CrossRef] [PubMed]
- Smith, T.M.; Pinard, C.A.; Byker Shanks, C.; Wethington, H.; Blanck, H.M.; Yaroch, A.L. Fruits and vegetables as a healthier snack throughout the day among families with older children: Findings from a survey of parent-child dyads. Eat Behav. 2015, 17, 136–139. [Google Scholar] [CrossRef] [PubMed]
- Organization, W.H. Healthy Diet Fact Sheet N°394. 2015. Available online: http://www.who.int/mediacentre/factsheets/fs394/en/ (accessed on 18 October 2017).
- Sanchez-Pimienta, T.G.; Lopez-Olmedo, N.; Rodriguez-Ramirez, S.; Garcia-Guerra, A.; Rivera, J.A.; Carriquiry, A.L.; Villalpando, S. High prevalence of inadequate calcium and iron intakes by Mexican population groups as assessed by 24-h recalls. J. Nutr. 2016, 146, 1874S–1880S. [Google Scholar] [CrossRef] [PubMed]
- Gallagher, C.M.; Black, L.J.; Oddy, W.H. Micronutrient intakes from food and supplements in Australian adolescents. Nutrients 2014, 6, 342–354. [Google Scholar] [CrossRef] [PubMed]
- Bailey, R.L.; Dodd, K.W.; Goldman, J.A.; Gahche, J.J.; Dwyer, J.T.; Moshfegh, A.J.; Sempos, C.T.; Picciano, M.F. Estimation of total usual calcium and vitamin D intakes in the United States. J. Nutr. 2010, 140, 817–822. [Google Scholar] [CrossRef] [PubMed]
- Hess, J.; Slavin, J. Snacking for a cause: Nutritional insufficiencies and excesses of US Children, a critical review of food consumption patterns and macronutrient and micronutrient intake of US Children. Nutrients 2014, 6, 4750–4759. [Google Scholar] [CrossRef] [PubMed]
- Duffey, K.J.; Pereira, R.A.; Popkin, B.M. Prevalence and energy intake from snacking in Brazil: Analysis of the first nationwide individual survey. Eur. J. Clin. Nutr. 2013, 67, 868–874. [Google Scholar] [CrossRef] [PubMed]
- Murakami, K.; Livingstone, M.B. Decreasing the number of small eating occasions (<15% of total energy intake) regardless of the time of day may be important to improve diet quality but not adiposity: A cross-sectional study in British children and adolescents. Br. J. Nutr. 2016, 115, 332–341. [Google Scholar] [CrossRef] [PubMed][Green Version]
- Jacquier, E.F.; Gatrell, A.; Bingley, A. “We don’t snack”: Attitudes and perceptions about eating in-between meals amongst caregivers of young children. Appetite 2016, 108, 483–490. [Google Scholar] [CrossRef] [PubMed]


| Characteristics | 4–8 Year-Olds | 9–13 Year-Olds | ||||||
|---|---|---|---|---|---|---|---|---|
| Australia | China | Mexico | US | Australia | China | Mexico | US | |
| Total, n | 789 | 769 | 2146 | 857 | 787 | 691 | 1718 | 829 |
| Sex | ||||||||
| Boys (%) | 52 | 52 | 49 | 52 | 51 | 52 | 51 | 52 |
| Girls (%) | 48 | 48 | 51 | 48 | 49 | 48 | 49 | 48 |
| Snacking habits | ||||||||
| Consuming (%) | 99.3 | 66.1 | 76.4 | 97.9 | 98.7 | 57.3 | 75.5 | 95.2 |
| Energy from snacks (kcal) a | 565 ± 13 | 159 ± 8 | 276 ± 11 | 460 ± 15 | 717 ± 18 | 131 ± 8 | 328 ± 20 | 470 ± 20 |
| TEI (%) b | 32.9 ± 0.6 | 11.9 ± 0.5 | 15.4 ± 0.5 | 26.6 ± 0.6 | 33.7 ± 0.6 | 7.9 ± 0.4 | 14.9 ± 0.8 | 24.0 ± 1.0 |
| Nutrient | Australia | China | Mexico | US | ||||
|---|---|---|---|---|---|---|---|---|
| 4–8 Years | 9–13 Years | 4–8 Years | 9–13 Years | 4–8 Years | 9–13 Years | 4–8 Years | 9–13 Years | |
| Total sugars (kcal) | 203 ± 5 | 242 ± 6 | 56 ± 3 | 47 ± 3 | 96 ± 4 | 96 ± 6 | 162 ± 7 | 163± 8 |
| Added sugars (kcal) | 99± 4 | 134 ± 5 | 23 ± 2 | 15 ± 2 | 56 ± 3 | 58 ± 4 | 103 ± 6 | 124 ± 7 |
| Total fat (kcal) | 73 ± 2 | 100 ± 3 | 47 ± 3 | 36 ± 3 | 85 ± 5 | 112 ± 9 | 146 ± 6 | 157 ± 9 |
| Saturated fat (kcal) | 36 ± 1 | 47 ± 2 | 20 ± 1 | 13 ± 1 | 38 ± 2 | 48 ± 4 | 55 ± 4 | 58 ± 3 |
| Protein (kcal) | 51 ± 2 | 68 ± 2 | 18 ± 2 | 14 ± 2 | 23 ± 1 | 27 ± 2 | 38 ± 2 | 41 ± 3 |
| Fiber (g) | 6.3 ± 0.2 | 7.1 ± 0.2 | 1.5 ± 0.2 | 1.7 ± 0.2 | 2.8 ± 0.1 | 3.0 ± 0.2 | 3.1 ± 0.2 | 3.1 ± 0.2 |
| Calcium (mg) | 250 ± 9 | 302 ± 10 | 82 ± 8 | 56 ± 6 | 128 ± 6 | 117 ± 9 | 221 ± 16 | 223 ± 16 |
| Sodium (mg) | 495 ± 15 | 655 ± 23 | 150 ± 9 | 172 ± 12 | 255 ± 14 | 361 ± 30 | 438 ± 29 | 499 ± 25 |
| Potassium (mg) | 718 ± 19 | 850 ± 23 | 223 ± 22 | 232 ± 26 | 343 ± 15 | 362 ± 30 | 467 ± 24 | 412 ± 22 |
| Zinc (mg) | 1.7 ± 0.1 | 2.1 ± 0.1 | 0.8 ± 0.1 | 0.6 ± 0.1 | 1.1 ± 0.1 | 1.3 ± 0.1 | 1.5 ± 0.1 | 1.7 ± 0.1 |
| Iron (mg) | 2.1 ± 0.1 | 2.6 ± 0.1 | 1.6 ± 0.3 | 1.4 ± 0.3 | 1.7 ± 0.1 | 1.9 ± 0.2 | 2.6 ± 0.1 | 2.5 ± 0.2 |
| Vitamin C (mg) | 34.7 ± 1.7 | 39.3 ± 2.3 | 9.7 ± 0.9 | 14.1 ± 1.7 | 26.5 ± 1.9 | 31.2 ± 5.3 | 22.6 ± 2.0 | 19.9 ± 2.1 |
| Vitamin D (µg) | N/A | N/A | 0.4 ± 0.0 | 0.2 ± 0.0 | 6.8 ± 0.9 | 11.0 ± 5.5 | 1.0 ± 0.1 | 0.8 ± 0.1 |
| Vitamin E as alpha-tocopherol (mg) | 2.5 ± 0.1 | 3.0 ± 0.1 | 2.3 ± 0.2 | 2.0 ± 0.2 | 1.0 ± 0.1 | 1.5 ± 0.1 | 1.7 ± 0.1 | 2.0 ± 0.2 |
| Country | Ranking | 4–8 Year-Olds | 9–13 Year-Olds | ||||
|---|---|---|---|---|---|---|---|
| Food Group | Consuming of Each Food Group (%) | Energy (kcal) per Capita | Food Group | Consuming of Each Food Group (%) | Energy (kcal) per Capita | ||
| Australia | 1 | Water 1 | 82.8 | 0 ± 0 | Water 1 | 83.2 | 1 ± 0 |
| 2 | Fruits | 69.7 | 81 ± 3 | Fruits | 58.9 *** | 75 ± 3 | |
| 3 | Cookies & Brownies | 42.8 | 69 ± 5 | Cookies & Brownies | 42.1 | 78 ± 5 | |
| 4 | Savory Snacks | 30.2 | 57 ± 5 | Sweetened Beverages | 36.2 ** | 44 ± 3 | |
| 5 | Sweetened Beverages | 29.9 | 32 ± 3 | Candy | 31.7 | 57 ± 5 *** | |
| 6 | Candy | 27.8 | 33 ± 3 | Milk 2 | 30.7 | 68 ± 5 *** | |
| 7 | Milk 2 | 26.6 | 49 ± 4 | Savory Snacks | 30.3 | 60 ± 5 | |
| 8 | Ice Cream and Other Desserts | 24.6 | 35 ± 3 | Ice Cream and Other Desserts | 25.2 | 47 ± 4 | |
| 9 | Crackers | 23.6 | 28 ± 3 | Crackers | 20.9 | 38 ± 4 | |
| 10 | Breads | 18.5 | 33 ± 4 | Breads | 19.5 | 47 ± 5 | |
| China | 1 | Fruits | 42.9 | 30 ± 2 | Fruits | 41.3 | 36 ± 2 |
| 2 | Milk 2 | 16.0 | 24 ± 4 | Milk 2 | 8.4 *** | 11 ± 2 | |
| 3 | Crackers | 11.4 | 27 ± 3 | Yogurt | 5.9 | 7 ± 1 | |
| 4 | Yogurt | 5.5 | 6 ± 1 | Crackers | 3.4 *** | 11 ± 3 | |
| 5 | Cakes and Pies | 4.5 | 11 ± 2 | Ice Cream and Other Desserts | 3.1 | 3 ± 1 | |
| 6 | Breads | 4.2 | 10 ± 2 | Savory Snacks | 2.3 | 7 ± 2 | |
| 7 | Plant-based Protein Foods | 3.9 | 6 ± 1 | Cakes and Pies | 2.3 * | 5 ± 2 | |
| 8 | Dairy Drinks and Substitutes | 2.8 | 2 ± 1 | Meats 3 | 2.0 | 3 ± 1 | |
| 9 | Ice Cream and Other Desserts | 2.8 | 3 ± 1 | Candy | 1.9 | 5 ± 2 | |
| 10 | Candy | 2.1 | 2 ± 1 | Plant-Based Protein Foods | 1.6 ** | 4 ± 2 | |
| Mexico | 1 | Water 1 | 37.0 | 0 ± 0 | Water 1 | 36.6 | 0 ± 0 |
| 2 | Fruits | 24.3 | 32 ± 3 | Savory Snacks | 24.2 *** | 86 ± 10 *** | |
| 3 | Sweetened Beverages | 19.9 | 28 ± 3 | Sweetened Beverages | 20.0 | 30 ± 3 | |
| 4 | Candy | 19.9 | 14 ± 2 | Fruits | 19.5 *** | 33 ± 5 | |
| 5 | Savory Snacks | 18.5 | 45 ± 4 | Candy | 16.6 ** | 14 ± 2 | |
| 6 | Milk 2 | 8.1 | 14 ± 2 | Cookies & Brownies | 6.0 | 27 ± 6 | |
| 7 | Cookies & Brownies | 7.5 | 26 ± 4 | Cakes and Pies | 5.9 | 22 ± 4 | |
| 8 | Cakes and Pies | 7.1 | 24 ± 3 | Ice Cream and Other Desserts | 5.8 | 9 ± 2 | |
| 9 | Ice Cream and Other Desserts | 6.2 | 10 ± 2 | Pizza and Sandwiches | 5.4 | 33 ± 13 | |
| 10 | Pizza and Sandwiches | 4.8 | 17 ± 3 | Coffee and Tea | 4.0 | 2 ± 1 | |
| US | 1 | Water 1 | 64.8 | 0 ± 0 | Water 1 | 65.3 | 1 ± 0 |
| 2 | Candy | 30.4 | 56 ± 16 | Savory Snacks | 31.0 | 58 ± 8 | |
| 3 | Fruits | 27.6 | 23 ± 1 | Candy | 29.3 | 45 ± 6 | |
| 4 | Savory Snacks | 27.6 | 56 ± 9 | Sweetened Beverages | 28.4 | 46 ± 6 | |
| 5 | Cookies & Brownies | 25.1 | 53 ± 8 | Ice Cream and Other Desserts | 20.1 | 46 ± 4 | |
| 6 | Sweetened Beverages | 24.8 | 25 ± 2 | Fruits | 18.1 *** | 16 ± 2 | |
| 7 | Milk 2 | 22.7 | 30 ± 3 | Cookies & Brownies | 17.3 *** | 37 ± 6 | |
| 8 | Ice Cream and Other Desserts | 22.2 | 35 ± 3 | Milk 2 | 12.3 *** | 16 ± 2 | |
| 9 | Crackers | 17.8 | 24 ± 2 | Cheese | 12.2 | 12 ± 2 | |
| 10 | 100% Juice | 15.1 | 17 ± 2 | Crackers | 10.5 *** | 23 ± 6 | |
© 2018 by the authors. Licensee MDPI, Basel, Switzerland. This article is an open access article distributed under the terms and conditions of the Creative Commons Attribution (CC BY) license (http://creativecommons.org/licenses/by/4.0/).
Share and Cite
Wang, D.; Van der Horst, K.; Jacquier, E.F.; Afeiche, M.C.; Eldridge, A.L. Snacking Patterns in Children: A Comparison between Australia, China, Mexico, and the US. Nutrients 2018, 10, 198. https://doi.org/10.3390/nu10020198
Wang D, Van der Horst K, Jacquier EF, Afeiche MC, Eldridge AL. Snacking Patterns in Children: A Comparison between Australia, China, Mexico, and the US. Nutrients. 2018; 10(2):198. https://doi.org/10.3390/nu10020198
Chicago/Turabian StyleWang, Dantong, Klazine Van der Horst, Emma F. Jacquier, Myriam C. Afeiche, and Alison L. Eldridge. 2018. "Snacking Patterns in Children: A Comparison between Australia, China, Mexico, and the US" Nutrients 10, no. 2: 198. https://doi.org/10.3390/nu10020198
APA StyleWang, D., Van der Horst, K., Jacquier, E. F., Afeiche, M. C., & Eldridge, A. L. (2018). Snacking Patterns in Children: A Comparison between Australia, China, Mexico, and the US. Nutrients, 10(2), 198. https://doi.org/10.3390/nu10020198