Next Issue
Volume 9, August
Previous Issue
Volume 9, June
 
 
remotesensing-logo

Journal Browser

Journal Browser

Remote Sens., Volume 9, Issue 7 (July 2017) – 125 articles

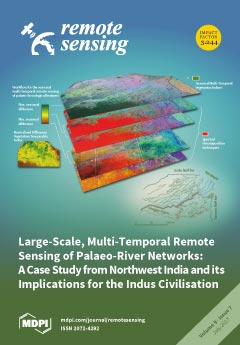
Cover Story (view full-size image): It has long been assumed that South Asia's ancient Indus Civilization was riverine, but many presumed watercourses are no longer visible. For the last 30 years, satellite imagery has been used to map the hydrology of the extensive plains that Indus populations occupied. This paper adopts a seasonal multi-temporal approach to the detection of palaeorivers over this large area (more than 80,000 km2). Twenty-eight years of Landsat 5 data—a total of 1711 multispectral images and 1254 8-day vegetation composites—have been bulk processed using Google Earth Engine© Code Editor and cloud computing infrastructure. The resulting data have allowed the mapping of 8000 km of relic water courses in the Sutlej-Yamuna interfluve, a core area for this Bronze Age civilization. The research also provided insights into the environmental conditions in which Indus urbanism developed and ultimately declined. View the paper
  • Issues are regarded as officially published after their release is announced to the table of contents alert mailing list.
  • You may sign up for e-mail alerts to receive table of contents of newly released issues.
  • PDF is the official format for papers published in both, html and pdf forms. To view the papers in pdf format, click on the "PDF Full-text" link, and use the free Adobe Reader to open them.
Order results
Result details
Section
Select all
Export citation of selected articles as:
3939 KiB  
Article
Coastal Waveform Retracking for Jason-2 Altimeter Data Based on Along-Track Echograms around the Tsushima Islands in Japan
by Xifeng Wang and Kaoru Ichikawa
Remote Sens. 2017, 9(7), 762; https://doi.org/10.3390/rs9070762 - 24 Jul 2017
Cited by 26 | Viewed by 6430
Abstract
Although the Brown mathematical model is the standard model for waveform retracking over open oceans, due to heterogeneous surface reflections within altimeter footprints, coastal waveforms usually deviate from open ocean waveform shapes and thus cannot be directly interpreted by the Brown model. Generally, [...] Read more.
Although the Brown mathematical model is the standard model for waveform retracking over open oceans, due to heterogeneous surface reflections within altimeter footprints, coastal waveforms usually deviate from open ocean waveform shapes and thus cannot be directly interpreted by the Brown model. Generally, the two primary sources of heterogeneous surface reflections are land surfaces and bright targets such as calm surface water. The former reduces echo power, while the latter often produces particularly strong echoes. In previous studies, sub-waveform retrackers, which use waveform samples collected from around leading edges in order to avoid trailing edge noise, have been recommended for coastal waveform retracking. In the present study, the peaky-type noise caused by fixed-point bright targets is explicitly detected and masked using the parabolic signature in the sequential along-track waveforms (or, azimuth-range echograms). Moreover, the power deficit of waveform trailing edges caused by weak land reflections is compensated for by estimating the ratio of sea surface area within each annular footprint in order to produce pseudo-homogeneous reflected waveforms suitable for the Brown model. Using this method, altimeter waveforms measured over the Tsushima Islands in Japan by the Ocean Surface Topography Mission (OSTM)/Jason-2 satellite are retracked. Our results show that both the correlation coefficient and root mean square difference between the derived sea surface height anomalies and tide gauge records retain similar values at the open ocean (0.9 and 20 cm) level, even in areas approaching 3 km from coastlines, which is considerably improved from the 10 km correlation coefficient limit of the conventional MLE4 retracker and the 7 km sub-waveform ALES retracker limit. These values, however, depend on the topography of the study areas because the approach distance limit increases (decreases) in areas with complicated (straight) coastlines. Full article
Show Figures

Graphical abstract

5510 KiB  
Article
Application of Sentinel 2 MSI Images to Retrieve Suspended Particulate Matter Concentrations in Poyang Lake
by Huizeng Liu, Qingquan Li, Tiezhu Shi, Shuibo Hu, Guofeng Wu and Qiming Zhou
Remote Sens. 2017, 9(7), 761; https://doi.org/10.3390/rs9070761 - 23 Jul 2017
Cited by 114 | Viewed by 12042
Abstract
Suspended particulate matter (SPM) is one of the dominant water constituents in inland and coastal waters, and SPM concnetration (CSPM) is a key parameter describing water quality. This study, using in-situ spectral and CSPM measurements as well as Sentinel [...] Read more.
Suspended particulate matter (SPM) is one of the dominant water constituents in inland and coastal waters, and SPM concnetration (CSPM) is a key parameter describing water quality. This study, using in-situ spectral and CSPM measurements as well as Sentinel 2 Multispectral Imager (MSI) images, aimed to develop CSPM retrieval models and further to estimate the CSPM values of Poyang Lake, China. Sixty-eight in-situ hyperspectral measurements and relative spectral response function were applied to simulate Sentinel 2 MIS spectra. Thirty-four samples were used to calibrate and the left samples were used to validate CSPM retrieval models, respectively. The developed models were then applied to two Sentinel 2 MSI images captured in wet and dry seasons, and the derived CSPM values were compared with those derived from MODIS B1 (λ = 645 nm). Results showed that the Sentinel 2 MSI B4–B8b models achieved acceptable to high fitting accuracies, which explained 81–93% of the variation of CSPM. The validation results also showed the reliability of these six models, and the estimated CSPM explained 77–93% of the variation of measured CSPM with the mean absolute percentage error (MAPE) ranging from 36.87% to 21.54%. Among those, a model based on B7 (λ = 783 nm) appeared to be the most accurate one. The Sentinel 2 MSI-derived CSPM values were generally consistent in spatial distribution and magnitude with those derived from MODIS. The CSPM derived from Sentinel 2 MSI B7 showed the highest consistency with MODIS on 15 August 2016, while the Sentinel 2 MSI B4 (λ = 665 nm) produced the highest consistency with MODIS on 2 April 2017. Overall, this study demonstrated the applicability of Sentinel 2 MSI for CSPM retrieval in Poyang Lake, and the Sentinel 2 MSI B4 and B7 are recommended for low and high loadings of SPM, respectively. Full article
(This article belongs to the Special Issue Remote Sensing of Floodpath Lakes and Wetlands)
Show Figures

Graphical abstract

7256 KiB  
Article
Mapping Development Pattern in Beijing-Tianjin-Hebei Urban Agglomeration Using DMSP/OLS Nighttime Light Data
by Yi’na Hu, Jian Peng, Yanxu Liu, Yueyue Du, Huilei Li and Jiansheng Wu
Remote Sens. 2017, 9(7), 760; https://doi.org/10.3390/rs9070760 - 23 Jul 2017
Cited by 31 | Viewed by 8133
Abstract
Spatial inequality of urban development may cause problems like inequality of living conditions and the lack of sustainability, drawing increasing academic interests and societal concerns. Previous studies based on statistical data can hardly reveal the interior mechanism of spatial inequality due to the [...] Read more.
Spatial inequality of urban development may cause problems like inequality of living conditions and the lack of sustainability, drawing increasing academic interests and societal concerns. Previous studies based on statistical data can hardly reveal the interior mechanism of spatial inequality due to the limitation of statistical units, while the application of remote sensing data, such as nighttime light (NTL) data, provides an effective solution. In this study, based on the DMSP/OLS NTL data, the urbanization type of all towns in the Beijing-Tianjin-Hebei urban agglomeration was analyzed from the aspects of development level and speed. Meanwhile, spatial cluster analysis of development level by local Moran’s I was used to explore spatial inequality, and the trend was discussed by comparing the development characteristics on both sides of the transition line of different development levels (inequality boundary). The results showed that the development level of the whole region increased dramatically as the mean DN value increased by 65.99%, and 83.72% of the towns showed a positive development during 2000–2012. The spatial distribution of urbanization types showed that Beijing and Tianjin were at a high urbanization level with rapid speed of development, with the southern region having a medium development level and the northwestern region lagging behind. The spatial cluster analysis also revealed a gradually intensifying trend of inequality as the number of towns with balanced development reduced by 319 during 2000–2012, while the towns in the high-high areas increased by 99 and those in the low-low areas increased by 229. Moreover, the development speed inside the inequality boundary was obviously higher than that outside, indicating an increasingly serious situation for spatial inequality of urban development in the whole region. Full article
(This article belongs to the Special Issue Recent Advances in Remote Sensing with Nighttime Lights)
Show Figures

Graphical abstract

4597 KiB  
Article
Ku-, X- and C-Band Microwave Backscatter Indices from Saline Snow Covers on Arctic First-Year Sea Ice
by Vishnu Nandan, Torsten Geldsetzer, Mallik Mahmud, John Yackel and Saroat Ramjan
Remote Sens. 2017, 9(7), 757; https://doi.org/10.3390/rs9070757 - 23 Jul 2017
Cited by 11 | Viewed by 7585
Abstract
In this study, we inter-compared observed Ku-, X- and C-band microwave backscatter from saline 14 cm, 8 cm, and 4 cm snow covers on smooth first-year sea ice. A Ku-, X- and C-band surface-borne polarimetric microwave scatterometer system was used to measure fully-polarimetric [...] Read more.
In this study, we inter-compared observed Ku-, X- and C-band microwave backscatter from saline 14 cm, 8 cm, and 4 cm snow covers on smooth first-year sea ice. A Ku-, X- and C-band surface-borne polarimetric microwave scatterometer system was used to measure fully-polarimetric backscatter from the three snow covers, near-coincident with corresponding in situ snow thermophysical measurements. The study investigated differences in co-polarized backscatter observations from the scatterometer system for all three frequencies, modeled penetration depths, utilized co-pol ratios, and introduced dual-frequency ratios to discriminate dominant polarization-dependent frequencies from these snow covers. Results demonstrate that the measured co-polarized backscatter magnitude increased with decreasing snow thickness for all three frequencies, owing to stronger gradients in snow salinity within thinner snow covers. The innovative dual-frequency ratios suggest greater sensitivity of Ku-band microwaves to snow grain size as snow thickness increases and X-band microwaves to snow salinity changes as snow thickness decreases. C-band demonstrated minimal sensitivity to changes in snow salinities. Our results demonstrate the influence of salinity associated dielectric loss, throughout all layers of the three snow covers, as the governing factor affecting microwave backscatter and penetration from all three frequencies. Our “plot-scale” observations using co-polarized backscatter, co-pol ratios and dual-frequency ratios suggest the future potential to up-scale our multi-frequency approach to a “satellite-scale” approach, towards effective development of snow geophysical and thermodynamic retrieval algorithms on smooth first-year sea ice. Full article
Show Figures

Graphical abstract

10270 KiB  
Article
Saturation Correction for Nighttime Lights Data Based on the Relative NDVI
by Zheng Wang, Fei Yao, Weifeng Li and And Jiansheng Wu
Remote Sens. 2017, 9(7), 759; https://doi.org/10.3390/rs9070759 - 22 Jul 2017
Cited by 8 | Viewed by 6632
Abstract
DMSP/OLS images are widely used as data sources in various domains of study. However, these images have some deficiencies, one of which is digital number (DN) saturation in urban areas, which leads to significant underestimation of light intensity. We propose a new method [...] Read more.
DMSP/OLS images are widely used as data sources in various domains of study. However, these images have some deficiencies, one of which is digital number (DN) saturation in urban areas, which leads to significant underestimation of light intensity. We propose a new method to correct the saturation. With China as the study area, the threshold value of the saturation DN is screened out first. A series of regression analyses are then carried out for the 2006 radiance calibrated nighttime lights (RCNL) image and relative NDVI (RNDVI) to determine a formula for saturation correction. The 2006 stable nighttime lights (SNL) image (F162006) is finally corrected and evaluated. It is concluded that pixels are saturated when the DN is larger than 50, and that the saturation is more serious when the DN is larger. RNDVI, which was derived by subtracting the interpolated NDVI from the real NDVI, is significantly better than the real NDVI for reflecting the degree of human activity. Quadratic functions describe the relationship between DN and RNDVI well. The 2006 SNL image presented more variation within urban cores and stronger correlations with the 2006 RCNL image and Gross Domestic Product after correction. However, RNDVI may also suffer “saturation” when it is lower than −0.4, at which point it is no longer effective at correcting DN saturation. In general, RNDVI is effective, although far from perfect, for saturation correction of the 2006 SNL image, and could be applied to the SNL images for other years. Full article
Show Figures

Graphical abstract

22132 KiB  
Article
Two-Step Downscaling of Trmm 3b43 V7 Precipitation in Contrasting Climatic Regions With Sparse Monitoring: The Case of Ecuador in Tropical South America
by Jacinto Ulloa, Daniela Ballari, Lenin Campozano and Esteban Samaniego
Remote Sens. 2017, 9(7), 758; https://doi.org/10.3390/rs9070758 - 22 Jul 2017
Cited by 35 | Viewed by 6909
Abstract
Spatial prediction of precipitation with high resolution is a challenging task in regions with strong climate variability and scarce monitoring. For this purpose, the quasi-continuous supply of information from satellite imagery is commonly used to complement in situ data. However, satellite images of [...] Read more.
Spatial prediction of precipitation with high resolution is a challenging task in regions with strong climate variability and scarce monitoring. For this purpose, the quasi-continuous supply of information from satellite imagery is commonly used to complement in situ data. However, satellite images of precipitation are available at coarse resolutions, and require adequate methods for spatial downscaling and calibration. The objective of this paper is to introduce and evaluate a 2-step spatial downscaling approach for monthly precipitation applied to TRMM 3B43 (from 0 . 25 27 km to 5 km resolution), resulting in 5 downscaled products for the period 01-2001/12-2011. The methodology was evaluated in 3 contrasting climatic regions of Ecuador. In step 1, bilinear resampling was applied over TRMM, and used as a reference product. The second step introduces further variability, and consists of four alternative gauge-satellite merging methods: (1) regression with in situ stations, (2) regression kriging with in situ stations, (3) regression with in situ stations and auxiliary variables, and (4) regression kriging with in situ stations and auxiliary variables. The first 2 methods only use the resampled TRMM data set as an independent variable. The last 2 methods enrich these models with auxiliary environmental factors, incorporating atmospheric and land variables. The results showed that no product outperforms the others in every region. In general, the methods with residual kriging correction outperformed the regression models. Regression kriging with situ data provided the best representation in the Coast, while regression kriging with in situ and auxiliary data generated the best results in the Andes. In the Amazon, no product outperformed the resampled TRMM images, probably due to the low density of in situ stations. These results are relevant to enhance satellite precipitation, depending on the availability of in situ data, auxiliary satellite variables and the particularities of the climatic regions. Full article
Show Figures

Graphical abstract

15707 KiB  
Article
Passive Radar Array Processing with Non-Uniform Linear Arrays for Ground Target’s Detection and Localization
by Nerea Del-Rey-Maestre, David Mata-Moya, Maria-Pilar Jarabo-Amores, Pedro-Jose Gómez-del-Hoyo, Jose-Luis Bárcena-Humanes and Javier Rosado-Sanz
Remote Sens. 2017, 9(7), 756; https://doi.org/10.3390/rs9070756 - 22 Jul 2017
Cited by 24 | Viewed by 9654
Abstract
The problem of ground target detection with passive radars is considered. The design of an antenna array based on commercial elements is presented, based on a non-uniform linear array optimized according to sidelobe level requirements. Array processing techniques are applied in the cross-ambiguity [...] Read more.
The problem of ground target detection with passive radars is considered. The design of an antenna array based on commercial elements is presented, based on a non-uniform linear array optimized according to sidelobe level requirements. Array processing techniques are applied in the cross-ambiguity function domain to exploit integration gain, system resolution and the sparsity of targets in this domain. A modified two-stage detection scheme is described, which is based on a previously-published one by other authors. All of these contributions are validated in a real semiurban scenario, proving the capabilities of detection, the direction of arrival estimation and the tracking of ground targets in the presence of big buildings that generate strong clutter returns. Detection performance is validated through the probability of false alarm and the probability of detection estimation with specified estimation errors. Full article
(This article belongs to the Special Issue Radar Systems for the Societal Challenges)
Show Figures

Graphical abstract

22422 KiB  
Article
Landsat 15-m Panchromatic-Assisted Downscaling (LPAD) of the 30-m Reflective Wavelength Bands to Sentinel-2 20-m Resolution
by Zhongbin Li, Hankui K. Zhang, David P. Roy, Lin Yan, Haiyan Huang and Jian Li
Remote Sens. 2017, 9(7), 755; https://doi.org/10.3390/rs9070755 - 22 Jul 2017
Cited by 29 | Viewed by 11286
Abstract
The Landsat 15-m Panchromatic-Assisted Downscaling (LPAD) method to downscale Landsat-8 Operational Land Imager (OLI) 30-m data to Sentinel-2 multi-spectral instrument (MSI) 20-m resolution is presented. The method first downscales the Landsat-8 30-m OLI bands to 15-m using the spatial detail provided by the [...] Read more.
The Landsat 15-m Panchromatic-Assisted Downscaling (LPAD) method to downscale Landsat-8 Operational Land Imager (OLI) 30-m data to Sentinel-2 multi-spectral instrument (MSI) 20-m resolution is presented. The method first downscales the Landsat-8 30-m OLI bands to 15-m using the spatial detail provided by the Landsat-8 15-m panchromatic band and then reprojects and resamples the downscaled 15-m data into registration with Sentinel-2A 20-m data. The LPAD method is demonstrated using pairs of contemporaneous Landsat-8 OLI and Sentinel-2A MSI images sensed less than 19 min apart over diverse geographic environments. The LPAD method is shown to introduce less spectral and spatial distortion and to provide visually more coherent data than conventional bilinear and cubic convolution resampled 20-m Landsat OLI data. In addition, results for a pair of Landsat-8 and Sentinel-2A images sensed one day apart suggest that image fusion should be undertaken with caution when the images are acquired under different atmospheric conditions. The LPAD source code is available at GitHub for public use. Full article
Show Figures

Graphical abstract

3578 KiB  
Technical Note
LACO-Wiki: A New Online Land Cover Validation Tool Demonstrated Using GlobeLand30 for Kenya
by Linda See, Juan Carlos Laso Bayas, Dmitry Schepaschenko, Christoph Perger, Christopher Dresel, Victor Maus, Carl Salk, Juergen Weichselbaum, Myroslava Lesiv, Ian McCallum, Inian Moorthy and Steffen Fritz
Remote Sens. 2017, 9(7), 754; https://doi.org/10.3390/rs9070754 - 22 Jul 2017
Cited by 32 | Viewed by 8835
Abstract
Accuracy assessment, also referred to as validation, is a key process in the workflow of developing a land cover map. To make this process open and transparent, we have developed a new online tool called LACO-Wiki, which encapsulates this process into a set [...] Read more.
Accuracy assessment, also referred to as validation, is a key process in the workflow of developing a land cover map. To make this process open and transparent, we have developed a new online tool called LACO-Wiki, which encapsulates this process into a set of four simple steps including uploading a land cover map, creating a sample from the map, interpreting the sample with very high resolution satellite imagery and generating a report with accuracy measures. The aim of this paper is to present the main features of this new tool followed by an example of how it can be used for accuracy assessment of a land cover map. For the purpose of illustration, we have chosen GlobeLand30 for Kenya. Two different samples were interpreted by three individuals: one sample was provided by the GlobeLand30 team as part of their international efforts in validating GlobeLand30 with GEO (Group on Earth Observation) member states while a second sample was generated using LACO-Wiki. Using satellite imagery from Google Maps, Bing and Google Earth, the results show overall accuracies between 53% to 61%, which is lower than the global accuracy assessment of GlobeLand30 but may be reasonable given the complex landscapes found in Kenya. Statistical models were then fit to the data to determine what factors affect the agreement between the three interpreters such as the land cover class, the presence of very high resolution satellite imagery and the age of the image in relation to the baseline year for GlobeLand30 (2010). The results showed that all factors had a significant effect on the agreement. Full article
(This article belongs to the Special Issue Validation on Global Land Cover Datasets)
Show Figures

Graphical abstract

12201 KiB  
Article
A Novel Method to Reconstruct Overhead High-Voltage Power Lines Using Cable Inspection Robot LiDAR Data
by Xinyan Qin, Gongping Wu, Xuhui Ye, Le Huang and Jin Lei
Remote Sens. 2017, 9(7), 753; https://doi.org/10.3390/rs9070753 - 22 Jul 2017
Cited by 49 | Viewed by 9371
Abstract
Overhead high-voltage power lines are key components of power transmission and their monitoring has a very significant influence on security and reliability of power system. Advanced laser scanning techniques have been widely used to capture three-dimensional (3D) point clouds of power system scenes. [...] Read more.
Overhead high-voltage power lines are key components of power transmission and their monitoring has a very significant influence on security and reliability of power system. Advanced laser scanning techniques have been widely used to capture three-dimensional (3D) point clouds of power system scenes. Nevertheless, power line corridors are found in increasingly complex environments (e.g., mountains and forests), and the multi-loop structure on the same power line tower raises great challenges to process light detection and ranging (LiDAR) data. This paper addresses these challenges by constructing a new collection mode of LiDAR data for power lines using cable inspection robot (CIR). A novel method is proposed to extract and reconstruct power line using CIR LiDAR data, which has two advantages: (1) rapidly extracts power line point by position and orientation system (POS) extraction model; and (2) better solves pseudo-line during reconstruction of power line by structured partition. The proposed method mainly includes four steps: CIR LiDAR data generation, POS-based crude extraction, voxel-based accurate extraction and power line reconstruction. The feasibility and validity of the proposed method are verified by test site experiment and actual line experiment, demonstrating a fast and reliable solution to accurately reconstruct power line. Full article
Show Figures

Graphical abstract

7776 KiB  
Article
Minimizing the Residual Topography Effect on Interferograms to Improve DInSAR Results: Estimating Land Subsidence in Port-Said City, Egypt
by Ahmed Gaber, Noura Darwish and Magaly Koch
Remote Sens. 2017, 9(7), 752; https://doi.org/10.3390/rs9070752 - 21 Jul 2017
Cited by 25 | Viewed by 7338
Abstract
The accurate detection of land subsidence rates in urban areas is important to identify damage-prone areas and provide decision-makers with useful information. Meanwhile, no precise measurements of land subsidence have been undertaken within the coastal Port-Said City in Egypt to evaluate its hazard [...] Read more.
The accurate detection of land subsidence rates in urban areas is important to identify damage-prone areas and provide decision-makers with useful information. Meanwhile, no precise measurements of land subsidence have been undertaken within the coastal Port-Said City in Egypt to evaluate its hazard in relationship to sea-level rise. In order to address this shortcoming, this work introduces and evaluates a methodology that substantially improves small subsidence rate estimations in an urban setting. Eight ALOS/PALSAR-1 scenes were used to estimate the land subsidence rates in Port-Said City, using the Small BAse line Subset (SBAS) DInSAR technique. A stereo pair of ALOS/PRISM was used to generate an accurate DEM to minimize the residual topography effect on the generated interferograms. A total of 347 well distributed ground control points (GCP) were collected in Port-Said City using the leveling instrument to calibrate the generated DEM. Moreover, the eight PALSAR scenes were co-registered using 50 well-distributed GCPs and used to generate 22 interferogram pairs. These PALSAR interferograms were subsequently filtered and used together with the coherence data to calculate the phase unwrapping. The phase-unwrapped interferogram-pairs were then evaluated to discard four interferograms that were affected by phase jumps and phase ramps. Results confirmed that using an accurate DEM (ALOS/PRISM) was essential for accurately detecting small deformations. The vertical displacement rate during the investigated period (2007–2010) was estimated to be −28 mm. The results further indicate that the northern area of Port-Said City has been subjected to higher land subsidence rates compared to the southern area. Such land subsidence rates might induce significant environmental changes with respect to sea-level rise. Full article
(This article belongs to the Special Issue Remote Sensing of Arid/Semiarid Lands)
Show Figures

Graphical abstract

5097 KiB  
Article
Influence of Ecological Factors on Estimation of Impervious Surface Area Using Landsat 8 Imagery
by Yuqiu Jia, Lina Tang and Lin Wang
Remote Sens. 2017, 9(7), 751; https://doi.org/10.3390/rs9070751 - 21 Jul 2017
Cited by 15 | Viewed by 6008
Abstract
Estimation of impervious surface area is important to the study of urban environments and social development, but surface characteristics, as well as the temporal, spectral, and spatial resolutions of remote sensing images, influence the estimation accuracy. To investigate the effects of regional environmental [...] Read more.
Estimation of impervious surface area is important to the study of urban environments and social development, but surface characteristics, as well as the temporal, spectral, and spatial resolutions of remote sensing images, influence the estimation accuracy. To investigate the effects of regional environmental characteristics on the estimation of impervious surface area, we divided China into seven sub-regions based on climate, soil type, feature complexity, and vegetation phenology: arid and semi-arid areas, Huang-Huai-Hai winter wheat production areas, typical temperate regions, the Pearl River Delta, the middle and lower reaches of the Yangtze River, typical tropical and subtropical regions, and the Qinghai Tibet Plateau. Impervious surface area was estimated from Landsat 8 images of five typical cities, including Yinchuan, Shijiazhuang, Shenyang, Ningbo, and Kunming. Using the linear spectral unmixing method, impervious and permeable surface areas were determined at the pixel-scale based on end-member proportions. We calculated the producer’s accuracy, user’s accuracy, and overall accuracy to assess the estimation accuracy, and compared the accuracies among images acquired from different seasons and locations. In tropical and subtropical regions, vegetation canopies can confound the identification of impervious surfaces and, thus, images acquired in winter, early spring, and autumn are most suitable; estimations in the Pearl River Delta, the middle and lower reaches of the Yangtze River are influenced by soil, vegetation phenology, vegetation canopy, and water, and images acquired in spring, summer, and autumn provide the best results; in typical temperate areas, images acquired from spring to autumn are most effective for estimations; in winter wheat-growing areas, images acquired throughout the year are suitable; and in arid and semi-arid areas, summer and early autumn, during which vegetation is abundant, are the optimal seasons for estimations. Knowledge of optimal time frames, multi-source data, and intelligent algorithms should be integrated to reduce spectral confusion and improve the estimation of impervious surface area from Landsat 8 OLI imagery. Full article
(This article belongs to the Section Remote Sensing in Geology, Geomorphology and Hydrology)
Show Figures

Graphical abstract

5929 KiB  
Article
Bathymetry of the Coral Reefs of Weizhou Island Based on Multispectral Satellite Images
by Rongyong Huang, Kefu Yu, Yinghui Wang, Jikun Wang, Lin Mu and Wenhuan Wang
Remote Sens. 2017, 9(7), 750; https://doi.org/10.3390/rs9070750 - 21 Jul 2017
Cited by 38 | Viewed by 7240
Abstract
Shallow water depth measurements using multispectral images are crucial for marine surveying and mapping. At present, relevant studies either depend on the use of other auxiliary data (such as field water depths or water column data) or contain too many unknown variables, thus [...] Read more.
Shallow water depth measurements using multispectral images are crucial for marine surveying and mapping. At present, relevant studies either depend on the use of other auxiliary data (such as field water depths or water column data) or contain too many unknown variables, thus making these studies suitable only for images that contain enough visible wavebands. To solve this problem, a Quasi-Analytical Algorithm (QAA) approach is proposed in this paper for estimating the water depths around Weizhou Island by developing a QAA to estimate the diffuse attenuation coefficients and simplifying the parameterization of the bathymetric model. The approach contains an initialization sub-approach and a novel global adjustment sub-approach. It is not only independent of other auxiliary data but also greatly reduces the number of unknowns. Experimental results finally demonstrated that the Root Mean Square Errors (RMSEs) were 1.01 m and 0.77 m for the ZY-3 image and the WorldView-3 (WV-3) image, respectively, so the approach is competitive to other QAA bathymetric methods. Besides, the global adjustment sub-approach was also seen to be superior to common smoothing filters: if the Signal-to-Noise Ratio (SNR) is as low as 42, i.e., ZY-3, it can smooth the water depths and improve the accuracies, otherwise can avoid the over-smoothing of water depths. Full article
(This article belongs to the Section Ocean Remote Sensing)
Show Figures

Graphical abstract

5369 KiB  
Article
Mapping of Aedes albopictus Abundance at a Local Scale in Italy
by Frédéric Baldacchino, Matteo Marcantonio, Mattia Manica, Giovanni Marini, Roberto Zorer, Luca Delucchi, Daniele Arnoldi, Fabrizio Montarsi, Gioia Capelli, Annapaola Rizzoli and Roberto Rosà
Remote Sens. 2017, 9(7), 749; https://doi.org/10.3390/rs9070749 - 21 Jul 2017
Cited by 20 | Viewed by 7035
Abstract
Given the growing risk of arbovirus outbreaks in Europe, there is a clear need to better describe the distribution of invasive mosquito species such as Aedes albopictus. Current challenges consist in simulating Ae. albopictus abundance, rather than its presence, and mapping its [...] Read more.
Given the growing risk of arbovirus outbreaks in Europe, there is a clear need to better describe the distribution of invasive mosquito species such as Aedes albopictus. Current challenges consist in simulating Ae. albopictus abundance, rather than its presence, and mapping its simulated abundance at a local scale to better assess the transmission risk of mosquito-borne pathogens and optimize mosquito control strategy. During 2014–2015, we sampled adult mosquitoes using 72 BG-Sentinel traps per year in the provinces of Belluno and Trento, Italy. We found that the sum of Ae. albopictus females collected during eight trap nights from June to September was positively related to the mean temperature of the warmest quarter and the percentage of artificial areas in a 250 m buffer around the sampling locations. Maps of Ae. albopictus abundance simulated from the most parsimonious model in the study area showed the largest populations in highly artificial areas with the highest summer temperatures, but with a high uncertainty due to the variability of the trapping collections. Vector abundance maps at a local scale should be promoted to support stakeholders and policy-makers in optimizing vector surveillance and control. Full article
Show Figures

Graphical abstract

21624 KiB  
Article
Criteria Comparison for Classifying Peatland Vegetation Types Using In Situ Hyperspectral Measurements
by Thierry Erudel, Sophie Fabre, Thomas Houet, Florence Mazier and Xavier Briottet
Remote Sens. 2017, 9(7), 748; https://doi.org/10.3390/rs9070748 - 20 Jul 2017
Cited by 37 | Viewed by 7617
Abstract
This study aims to evaluate three classes of methods to discriminate between 13 peatland vegetation types using reflectance data. These vegetation types were empirically defined according to their composition, strata and biodiversity richness. On one hand, it is assumed that the same vegetation [...] Read more.
This study aims to evaluate three classes of methods to discriminate between 13 peatland vegetation types using reflectance data. These vegetation types were empirically defined according to their composition, strata and biodiversity richness. On one hand, it is assumed that the same vegetation type spectral signatures have similarities. Consequently, they can be compared to a reference spectral database. To catch those similarities, several similarities criteria (related to distances (Euclidean distance, Manhattan distance, Canberra distance) or spectral shapes (Spectral Angle Mapper) or probabilistic behaviour (Spectral Information Divergence)) and several mathematical transformations of spectral signatures enhancing absorption features (such as the first derivative or the second derivative, the normalized spectral signature, the continuum removal, the continuum removal derivative reflectance, the log transformation) were investigated. Furthermore, those similarity measures were applied on spectral ranges which characterize specific biophysical properties. On the other hand, we suppose that specific biophysical properties/components may help to discriminate between vegetation types applying supervised classification such as Random Forest (RF), Support Vector Machines (SVM), Regularized Logistic Regression (RLR), Partial Least Squares-Discriminant Analysis (PLS-DA). Biophysical components can be used in a local way considering vegetation spectral indices or in a global way considering spectral ranges and transformed spectral signatures, as explained above. RLR classifier applied on spectral vegetation indices (training size = 25%) was able to achieve 77.21% overall accuracy in discriminating peatland vegetation types. It was also able to discriminate between 83.95% vegetation types considering specific spectral range [[range-phrase = –]3501350 n m ], first derivative of spectral signatures and training size = 25%. Conversely, similarity criterion was able to achieve 81.70% overall accuracy using the Canberra distance computed on the full spectral range [[range-phrase = –]3502500 n m ]. The results of this study suggest that RLR classifier and similarity criteria are promising to map the different vegetation types with high ecological values despite vegetation heterogeneity and mixture. Full article
(This article belongs to the Special Issue Hyperspectral Imaging and Applications)
Show Figures

Graphical abstract

6847 KiB  
Article
Aerosol Optical Properties and Associated Direct Radiative Forcing over the Yangtze River Basin during 2001–2015
by Lijie He, Lunche Wang, Aiwen Lin, Ming Zhang, Muhammad Bilal and Minghui Tao
Remote Sens. 2017, 9(7), 746; https://doi.org/10.3390/rs9070746 - 20 Jul 2017
Cited by 36 | Viewed by 5847
Abstract
The spatiotemporal variation of aerosol optical depth at 550 nm (AOD550), Ångström exponent at 470–660 nm (AE470–660), water vapor content (WVC), and shortwave (SW) instantaneous aerosol direct radiative effects (IADRE) at the top-of-atmosphere (TOA) in clear skies obtained from [...] Read more.
The spatiotemporal variation of aerosol optical depth at 550 nm (AOD550), Ångström exponent at 470–660 nm (AE470–660), water vapor content (WVC), and shortwave (SW) instantaneous aerosol direct radiative effects (IADRE) at the top-of-atmosphere (TOA) in clear skies obtained from the Moderate Resolution Imaging Spectroradiometer (MODIS) and Clouds and the Earth’s Radiant Energy System (CERES) are quantitatively analyzed over the Yangtze River Basin (YRB) in China during 2001–2015. The annual and seasonal frequency distributions of AE470–660 and AOD550 reveal the dominance of fine aerosol particles over YRB. The regional average AOD550 is 0.49 ± 0.31, with high value in spring (0.58 ± 0.35) and low value in winter (0.42 ± 0.29). The higher AOD550 (≥0.6) is observed in midstream and downstream regions of YRB and Sichuan Basin due to local anthropogenic emissions and long-distance transport of dust particles, while lower AOD550 (≤0.3) is in high mountains of upstream regions. The IADRE is estimated using a linear relationship between SW upward flux and coincident AOD550 from CERES and MODIS at the satellite passing time. The regional average IADRE is −35.60 ± 6.71 Wm−2, with high value (−40.71 ± 6.86 Wm−2) in summer and low value (−29.19 ± 7.04 Wm−2) in winter, suggesting a significant cooling effect at TOA. The IADRE at TOA is lower over Yangtze River Delta (YRD) (≤−30 Wm−2) and higher in midstream region of YRB, Sichuan Basin and the source area of YRB (≥−45 Wm−2). The correlation coefficient between the 15-year monthly IADRE and AOD550 values is 0.63, which confirms the consistent spatiotemporal variation patterns over most of the YRB. However, a good agreement between IADRE and AOD is not observed in YRD and the source area of YRB, which is probably due to the combined effects of aerosol and surface properties. Full article
Show Figures

Graphical abstract

6528 KiB  
Article
Evaluation of the U.S. Geological Survey Landsat Burned Area Essential Climate Variable across the Conterminous U.S. Using Commercial High-Resolution Imagery
by Melanie K. Vanderhoof, Nicole Brunner, Yen-Ju G. Beal and Todd J. Hawbaker
Remote Sens. 2017, 9(7), 743; https://doi.org/10.3390/rs9070743 - 20 Jul 2017
Cited by 17 | Viewed by 6302
Abstract
The U.S. Geological Survey has produced the Landsat Burned Area Essential Climate Variable (BAECV) product for the conterminous United States (CONUS), which provides wall-to-wall annual maps of burned area at 30 m resolution (1984–2015). Validation is a critical component in the generation of [...] Read more.
The U.S. Geological Survey has produced the Landsat Burned Area Essential Climate Variable (BAECV) product for the conterminous United States (CONUS), which provides wall-to-wall annual maps of burned area at 30 m resolution (1984–2015). Validation is a critical component in the generation of such remotely sensed products. Previous efforts to validate the BAECV relied on a reference dataset derived from Landsat, which was effective in evaluating the product across its timespan but did not allow for consideration of inaccuracies imposed by the Landsat sensor itself. In this effort, the BAECV was validated using 286 high-resolution images, collected from GeoEye-1, QuickBird-2, Worldview-2 and RapidEye satellites. A disproportionate sampling strategy was utilized to ensure enough burned area pixels were collected. Errors of omission and commission for burned area averaged 22 ± 4% and 48 ± 3%, respectively, across CONUS. Errors were lowest across the western U.S. The elevated error of commission relative to omission was largely driven by patterns in the Great Plains which saw low errors of omission (13 ± 13%) but high errors of commission (70 ± 5%) and potentially a region-growing function included in the BAECV algorithm. While the BAECV reliably detected agricultural fires in the Great Plains, it frequently mapped tilled areas or areas with low vegetation as burned. Landscape metrics were calculated for individual fire events to assess the influence of image resolution (2 m, 30 m and 500 m) on mapping fire heterogeneity. As the spatial detail of imagery increased, fire events were mapped in a patchier manner with greater patch and edge densities, and shape complexity, which can influence estimates of total greenhouse gas emissions and rates of vegetation recovery. The increasing number of satellites collecting high-resolution imagery and rapid improvements in the frequency with which imagery is being collected means greater opportunities to utilize these sources of imagery for Landsat product validation. Full article
(This article belongs to the Special Issue Quantitative Remote Sensing of Land Surface Variables)
Show Figures

Graphical abstract

3357 KiB  
Article
Expansion of Industrial Plantations Continues to Threaten Malayan Tiger Habitat
by Varada S. Shevade, Peter V. Potapov, Nancy L. Harris and Tatiana V. Loboda
Remote Sens. 2017, 9(7), 747; https://doi.org/10.3390/rs9070747 - 19 Jul 2017
Cited by 17 | Viewed by 13172
Abstract
Southeast Asia has some of the highest deforestation rates globally, with Malaysia being identified as a deforestation hotspot. The Malayan tiger, a critically endangered subspecies of the tiger endemic to Peninsular Malaysia, is threatened by habitat loss and fragmentation. In this study, we [...] Read more.
Southeast Asia has some of the highest deforestation rates globally, with Malaysia being identified as a deforestation hotspot. The Malayan tiger, a critically endangered subspecies of the tiger endemic to Peninsular Malaysia, is threatened by habitat loss and fragmentation. In this study, we estimate the natural forest loss and conversion to plantations in Peninsular Malaysia and specifically in its tiger habitat between 1988 and 2012 using the Landsat data archive. We estimate a total loss of 1.35 Mha of natural forest area within Peninsular Malaysia over the entire study period, with 0.83 Mha lost within the tiger habitat. Nearly half (48%) of the natural forest loss area represents conversion to tree plantations. The annual area of new plantation establishment from natural forest conversion increased from 20 thousand ha year−1 during 1988–2000 to 34 thousand ha year−1 during 2001–2012. Large-scale industrial plantations, primarily those of oil palm, as well as recently cleared land, constitute 80% of forest converted to plantations since 1988. We conclude that industrial plantation expansion has been a persistent threat to natural forests within the Malayan tiger habitat. Expanding oil palm plantations dominate forest conversions while those for rubber are an emerging threat. Full article
Show Figures

Graphical abstract

5491 KiB  
Article
Early Detection of Plant Physiological Responses to Different Levels of Water Stress Using Reflectance Spectroscopy
by Matthew Maimaitiyiming, Abduwasit Ghulam, Arianna Bozzolo, Joseph L. Wilkins and Misha T. Kwasniewski
Remote Sens. 2017, 9(7), 745; https://doi.org/10.3390/rs9070745 - 19 Jul 2017
Cited by 106 | Viewed by 11116
Abstract
Early detection of water stress is critical for precision farming for improving crop productivity and fruit quality. To investigate varying rootstock and irrigation interactions in an open agricultural ecosystem, different irrigation treatments were implemented in a vineyard experimental site either: (i) nonirrigated (NIR); [...] Read more.
Early detection of water stress is critical for precision farming for improving crop productivity and fruit quality. To investigate varying rootstock and irrigation interactions in an open agricultural ecosystem, different irrigation treatments were implemented in a vineyard experimental site either: (i) nonirrigated (NIR); (ii) with full replacement of evapotranspiration (FIR); or (iii) intermediate irrigation (INT, 50% replacement of evapotranspiration). In the summers 2014 and 2015, we collected leaf reflectance factor spectra of the vineyard using field spectroscopy along with grapevine physiological parameters. To comprehensively analyze the field-collected hyperspectral data, various band combinations were used to calculate the normalized difference spectral index (NDSI) along with 26 various indices from the literature. Then, the relationship between the indices and plant physiological parameters were examined and the strongest relationships were determined. We found that newly-identified NDSIs always performed better than the indices from the literature, and stomatal conductance (Gs) was the plant physiological parameter that showed the highest correlation with NDSI(R603,R558) calculated using leaf reflectance factor spectra (R2 = 0.720). Additionally, the best NDSI(R685,R415) for non-photochemical quenching (NPQ) was determined (R2 = 0.681). Gs resulted in being a proxy of water stress. Therefore, the partial least squares regression (PLSR) method was utilized to develop a predictive model for Gs. Our results showed that the PLSR model was inferior to the NDSI in Gs estimation (R2 = 0.680). The variable importance in the projection (VIP) was then employed to investigate the most important wavelengths that were most effective in determining Gs. The VIP analysis confirmed that the yellow band improves the prediction ability of hyperspectral reflectance factor data in Gs estimation. The findings of this study demonstrate the potential of hyperspectral spectroscopy data in motoring plant stress response. Full article
Show Figures

Graphical abstract

3771 KiB  
Article
Characterizing Regional-Scale Combustion Using Satellite Retrievals of CO, NO2 and CO2
by Sam J. Silva and A. F. Arellano
Remote Sens. 2017, 9(7), 744; https://doi.org/10.3390/rs9070744 - 19 Jul 2017
Cited by 35 | Viewed by 9052
Abstract
We present joint analyses of satellite-observed combustion products to examine bulk characteristics of combustion in megacities and fire regions. We use retrievals of CO, NO2 and CO2 from NASA/Terra Measurement of Pollution In The Troposphere, NASA/Aura Ozone Monitoring Instrument, and JAXA [...] Read more.
We present joint analyses of satellite-observed combustion products to examine bulk characteristics of combustion in megacities and fire regions. We use retrievals of CO, NO2 and CO2 from NASA/Terra Measurement of Pollution In The Troposphere, NASA/Aura Ozone Monitoring Instrument, and JAXA Greenhouse Gases Observing Satellite to estimate atmospheric enhancements of these co-emitted species based on their spatiotemporal variability (spread, σ) within 14 regions dominated by combustion emissions. We find that patterns in σXCOXCO2 and σXCOXNO2 are able to distinguish between combustion types across the globe. These patterns show distinct groupings for biomass burning and the developing/developed status of a region that are not well represented in global emissions inventories. We show here that such multi-species analyses can provide constraints on emission inventories, and be useful in monitoring trends and understanding regional-scale combustion. Full article
(This article belongs to the Special Issue Remote Sensing of Greenhouse Gases)
Show Figures

Graphical abstract

2287 KiB  
Article
Feasibility of GNSS-R Ice Sheet Altimetry in Greenland Using TDS-1
by Antonio Rius, Estel Cardellach, Fran Fabra, Weiqiang Li, Serni Ribó and Manuel Hernández-Pajares
Remote Sens. 2017, 9(7), 742; https://doi.org/10.3390/rs9070742 - 19 Jul 2017
Cited by 42 | Viewed by 7030
Abstract
Radar altimetry provides valuable measurements to characterize the state and the evolution of the ice sheet cover of Antartica and Greenland. Global Navigation Satellite System Reflectometry (GNSS-R) has the potential to complement the dedicated radar altimeters, increasing the temporal and spatial resolution of [...] Read more.
Radar altimetry provides valuable measurements to characterize the state and the evolution of the ice sheet cover of Antartica and Greenland. Global Navigation Satellite System Reflectometry (GNSS-R) has the potential to complement the dedicated radar altimeters, increasing the temporal and spatial resolution of the measurements. Here we perform a study of the Greenland ice sheet using data obtained by the GNSS-R instrument aboard the British TechDemoSat-1 (TDS-1) satellite mission. TDS-1 was primarily designed to provide sea state information such as sea surface roughness or wind, but not altimetric products. The data have been analyzed with altimetric methodologies, already tested in aircraft based experiments, to extract signal delay observables to be used to infer properties of the Greenland ice sheet cover. The penetration depth of the GNSS signals into ice has also been considered. The large scale topographic signal obtained is consistent with the one obtained with ICEsat GLAS sensor, with differences likely to be related to L-band signal penetration into the ice and the along-track variations in structure and morphology of the firn and ice volumes The main conclusion derived from this work is that GNSS-R also provides potentially valuable measurements of the ice sheet cover. Thus, this methodology has the potential to complement our understanding of the ice firn and its evolution. Full article
Show Figures

Graphical abstract

12616 KiB  
Article
High Precision DEM Generation Algorithm Based on InSAR Multi-Look Iteration
by Xiaoming Gao, Yaolin Liu, Tao Li and Danqin Wu
Remote Sens. 2017, 9(7), 741; https://doi.org/10.3390/rs9070741 - 18 Jul 2017
Cited by 24 | Viewed by 6782
Abstract
Interferometric Synthetic Aperture Radar (InSAR) is one of the most sufficient technologies to provide global digital elevation modeling (DEM). It unwraps the interferometric phase to provide observations for phase-to-height conversion. However, the phase gradient has great influence on the phase unwrapping quality, thereby [...] Read more.
Interferometric Synthetic Aperture Radar (InSAR) is one of the most sufficient technologies to provide global digital elevation modeling (DEM). It unwraps the interferometric phase to provide observations for phase-to-height conversion. However, the phase gradient has great influence on the phase unwrapping quality, thereby affecting the topographic mapping accuracy. Multi-look processing can improve the reliability of phase unwrapping by reducing the noise phase gradient. Nevertheless, it reduces the spatial resolution while increasing the height phase gradient, thus lowering the reliability of height values. In this paper, we propose a multi-look iteration algorithm to suppress the noise and maintain the reliability of height values. First, we use a large number of looks (NL) to suppress the noise phase gradient and obtain a coarse DEM. Then taking this coarse DEM as a reference, we remove the topographic phase from the interferogram with a small NL, which will reduce height phase gradient and ensure the accuracy of phase unwrapping. Finally, we obtain DEM products with high precision and fine resolution. We validate the proposed algorithm using both simulated and real data, and obtain DEM products in a greatly undulated region using TanDEM-X data. Results show that the proposed method is capable of providing DEM with resolution of 4 m and accuracy of 1.73 m. Full article
(This article belongs to the Section Remote Sensing in Geology, Geomorphology and Hydrology)
Show Figures

Graphical abstract

1398 KiB  
Article
How Reliable Is Structure from Motion (SfM) over Time and between Observers? A Case Study Using Coral Reef Bommies
by Vincent Raoult, Sarah Reid-Anderson, Andreas Ferri and Jane E. Williamson
Remote Sens. 2017, 9(7), 740; https://doi.org/10.3390/rs9070740 - 18 Jul 2017
Cited by 36 | Viewed by 7879
Abstract
Recent efforts to monitor the health of coral reefs have highlighted the benefits of using structure from motion-based assessments, and despite increasing use of this technique in ecology and geomorphology, no study has attempted to quantify the precision of this technique over time [...] Read more.
Recent efforts to monitor the health of coral reefs have highlighted the benefits of using structure from motion-based assessments, and despite increasing use of this technique in ecology and geomorphology, no study has attempted to quantify the precision of this technique over time and across different observers. This study determined whether 3D models of an ecologically relevant reef structure, the coral bommie, could be constructed using structure from motion and be reliably used to measure bommie volume and surface area between different observers and over time. We also determined whether the number of images used to construct a model had an impact on the final measurements. Three dimensional models were constructed of over twenty coral bommies from Heron Island, a coral cay at the southern end of the Great Barrier Reef. This study did not detect any significant observer effect, and there were no significant differences in measurements over four sampling days. The mean measurement error across all bommies and between observers was 15 ± 2% for volume measurements and 12 ± 1% for surface area measurements. There was no relationship between the number of pictures taken for a reconstruction and the measurements from that model, however, more photographs were necessary to be able to reconstruct complete coral bommies larger than 1 m3. These results suggest that structure from motion is a viable tool for ongoing monitoring of ecologically-significant coral reefs, especially to establish effects of disturbances, provided the measurement error is considered. Full article
(This article belongs to the Section Ocean Remote Sensing)
Show Figures

Graphical abstract

8806 KiB  
Article
Multi-Temporal X-Band Radar Interferometry Using Corner Reflectors: Application and Validation at the Corvara Landslide (Dolomites, Italy)
by Romy Schlögel, Benni Thiebes, Marco Mulas, Giovanni Cuozzo, Claudia Notarnicola, Stefan Schneiderbauer, Mattia Crespi, Augusto Mazzoni, Volkmar Mair and Alessandro Corsini
Remote Sens. 2017, 9(7), 739; https://doi.org/10.3390/rs9070739 - 18 Jul 2017
Cited by 28 | Viewed by 8153
Abstract
From the wide range of methods available to landslide researchers and practitioners for monitoring ground displacements, remote sensing techniques have increased in popularity. Radar interferometry methods with their ability to record movements in the order of millimeters have been more frequently applied in [...] Read more.
From the wide range of methods available to landslide researchers and practitioners for monitoring ground displacements, remote sensing techniques have increased in popularity. Radar interferometry methods with their ability to record movements in the order of millimeters have been more frequently applied in recent years. Multi-temporal interferometry can assist in monitoring landslides on the regional and slope scale and thereby assist in assessing related hazards and risks. Our study focuses on the Corvara landslides in the Italian Alps, a complex earthflow with spatially varying displacement patterns. We used radar imagery provided by the COSMO-SkyMed constellation and carried out a validation of the derived time-series data with differential GPS data. Movement rates were assessed using the Permanent Scatterers based Multi-Temporal Interferometry applied to 16 artificial Corner Reflectors installed on the source, track and accumulation zones of the landslide. The overall movement trends were well covered by Permanent Scatterers based Multi-Temporal Interferometry, however, fast acceleration phases and movements along the satellite track could not be assessed with adequate accuracy due to intrinsic limitations of the technique. Overall, despite the intrinsic limitations, Multi-Temporal Interferometry proved to be a promising method to monitor landslides characterized by a linear and relatively slow movement rates. Full article
(This article belongs to the Special Issue Remote Sensing of Landslides)
Show Figures

Figure 1

146 KiB  
Erratum
Erratum: Chance, E.W., et al. Identifying Irrigated Areas in the Snake River Plain, Idaho: Evaluating Performance across Compositing Algorithms, Spectral Indices, and Sensors. Remote Sens. 2017, 9, 546
by Eric W. Chance, Kelly M. Cobourn, Valerie A. Thomas, Blaine C. Dawson and Alejandro N. Flores
Remote Sens. 2017, 9(7), 738; https://doi.org/10.3390/rs9070738 - 18 Jul 2017
Viewed by 3169
Abstract
In the published paper [1], the title and Appendix Tables A4, A5, A7, and A8 contain typographical errors. The correct title and table captions are as follows: [...]
Full article
72641 KiB  
Article
Mathematical Modeling and Accuracy Testing of WorldView-2 Level-1B Stereo Pairs without Ground Control Points
by Jiang Ye, Xu Lin and Tao Xu
Remote Sens. 2017, 9(7), 737; https://doi.org/10.3390/rs9070737 - 17 Jul 2017
Cited by 8 | Viewed by 8132
Abstract
With very high resolution satellite (VHRS) imagery of 0.5 m, WorldView-2 (WV02) satellite images have been widely used in the field of surveying and mapping. However, for the specific WV02 satellite image geometric orientation model, there is a lack of detailed research and [...] Read more.
With very high resolution satellite (VHRS) imagery of 0.5 m, WorldView-2 (WV02) satellite images have been widely used in the field of surveying and mapping. However, for the specific WV02 satellite image geometric orientation model, there is a lack of detailed research and explanation. This paper elaborates the construction process of the WV02 satellite rigorous sensor model (RSM), which considers the velocity aberration, the optical path delay and the atmospheric refraction. We create a new physical inverse model based on a double-iterative method. Through this inverse method, we establish the virtual control grid in the object space to calculate the rational function model (RFM) coefficients. In the RFM coefficient calculation process, we apply the correcting characteristic value method (CCVM) and least squares (LS) method to compare the two experiments’ accuracies. We apply two stereo pairs of WV02 Level 1B products in Qinghai, China to verify the algorithm and test image positioning accuracy. Under the no-control conditions, the monolithic horizontal mean square error (RMSE) of the rational polynomial coefficient (RPC) is 3.8 m. This result is 13.7% higher than the original RPC positioning accuracy provided by commercial vendors. The stereo pair horizontal positioning accuracy of both the physical and RPC models is 5.0 m circular error 90% (CE90). This result is in accordance with the WV02 satellite images nominal positioning accuracy. This paper provides a new method to improve the positioning accuracy of the WV02 satellite image RPC model without GCPs. Full article
Show Figures

Graphical abstract

4551 KiB  
Article
A Burned Area Mapping Algorithm for Chinese FengYun-3 MERSI Satellite Data
by Tianchan Shan, Changlin Wang, Fang Chen, Qinchun Wu, Bin Li, Bo Yu, Zeeshan Shirazi, Zhengyang Lin and Wei Wu
Remote Sens. 2017, 9(7), 736; https://doi.org/10.3390/rs9070736 - 16 Jul 2017
Cited by 11 | Viewed by 6263
Abstract
Biomass burning is a worldwide phenomenon, which emits large amounts of carbon into the atmosphere and strongly influences the environment. Burned area is an important parameter in modeling the impacts of biomass burning on the climate and ecosystem. The Medium Resolution Spectral Imager [...] Read more.
Biomass burning is a worldwide phenomenon, which emits large amounts of carbon into the atmosphere and strongly influences the environment. Burned area is an important parameter in modeling the impacts of biomass burning on the climate and ecosystem. The Medium Resolution Spectral Imager (MERSI) onboard FengYun-3C (FY-3C) has shown great potential for burned area mapping research, but there is still a lack of relevant studies and applications. This paper describes an automated burned area mapping algorithm that was developed using daily MERSI data. The algorithm employs time-series analysis and multi-temporal 1000-m resolution data to obtain seed pixels. To identify the burned pixels automatically, region growing and Support Vector Machine) methods have been used together with 250-m resolution data. The algorithm was tested by applying it in two experimental areas, and the accuracy of the results was evaluated by comparing them to reference burned area maps, which were interpreted manually using Landsat 8 OLI data and the MODIS MCD64A1 burned area product. The results demonstrated that the proposed algorithm was able to improve the burned area mapping accuracy at the two study sites. Full article
Show Figures

Figure 1

9165 KiB  
Article
Large-Scale, Multi-Temporal Remote Sensing of Palaeo-River Networks: A Case Study from Northwest India and its Implications for the Indus Civilisation
by Hector A. Orengo and Cameron A. Petrie
Remote Sens. 2017, 9(7), 735; https://doi.org/10.3390/rs9070735 - 16 Jul 2017
Cited by 84 | Viewed by 15489
Abstract
Remote sensing has considerable potential to contribute to the identification and reconstruction of lost hydrological systems and networks. Remote sensing-based reconstructions of palaeo-river networks have commonly employed single or limited time-span imagery, which limits their capacity to identify features in complex and varied [...] Read more.
Remote sensing has considerable potential to contribute to the identification and reconstruction of lost hydrological systems and networks. Remote sensing-based reconstructions of palaeo-river networks have commonly employed single or limited time-span imagery, which limits their capacity to identify features in complex and varied landscape contexts. This paper presents a seasonal multi-temporal approach to the detection of palaeo-rivers over large areas based on long-term vegetation dynamics and spectral decomposition techniques. Twenty-eight years of Landsat 5 data, a total of 1711 multi-spectral images, have been bulk processed using Google Earth Engine© Code Editor and cloud computing infrastructure. The use of multi-temporal data has allowed us to overcome seasonal cultivation patterns and long-term visibility issues related to recent crop selection, extensive irrigation and land-use patterns. The application of this approach on the Sutlej-Yamuna interfluve (northwest India), a core area for the Bronze Age Indus Civilisation, has enabled the reconstruction of an unsuspectedly complex palaeo-river network comprising more than 8000 km of palaeo-channels. It has also enabled the definition of the morphology of these relict courses, which provides insights into the environmental conditions in which they operated. These new data will contribute to a better understanding of the settlement distribution and environmental settings in which this, often considered riverine, civilisation operated. Full article
Show Figures

Graphical abstract

2055 KiB  
Article
Considering Inter-Frequency Clock Bias for BDS Triple-Frequency Precise Point Positioning
by Lin Pan, Xingxing Li, Xiaohong Zhang, Xin Li, Cuixian Lu, Qile Zhao and Jingnan Liu
Remote Sens. 2017, 9(7), 734; https://doi.org/10.3390/rs9070734 - 15 Jul 2017
Cited by 33 | Viewed by 5903
Abstract
The joint use of multi-frequency signals brings new prospects for precise positioning and has become a trend in Global Navigation Satellite System (GNSS) development. However, a new type of inter-frequency clock bias (IFCB), namely the difference between satellite clocks computed with different ionospheric-free [...] Read more.
The joint use of multi-frequency signals brings new prospects for precise positioning and has become a trend in Global Navigation Satellite System (GNSS) development. However, a new type of inter-frequency clock bias (IFCB), namely the difference between satellite clocks computed with different ionospheric-free carrier phase combinations, was noticed. Consequently, the B1/B3 precise point positioning (PPP) cannot directly use the current B1/B2 clock products. Datasets from 35 globally distributed stations are employed to investigate the IFCB. For new generation BeiDou Navigation Satellite System (BDS) satellites, namely BDS-3 satellites, the IFCB between B1/B2a and B1/B3 satellite clocks, between B1/B2b and B1/B3 satellite clocks, between B1C/B2a and B1C/B3 satellite clocks, and between B1C/B2b and B1C/B3 satellite clocks is analyzed, and no significant IFCB variations can be observed. The IFCB between B1/B2 and B1/B3 satellite clocks for BDS-2 satellites varies with time, and the IFCB variations are generally confined to peak amplitudes of about 5 cm. The IFCB of BDS-2 satellites exhibits periodic signal, and the accuracy of prediction for IFCB, namely the root mean square (RMS) statistic of the difference between predicted and estimated IFCB values, is 1.2 cm. A triple-frequency PPP model with consideration of IFCB is developed. Compared with B1/B2-based PPP, the positioning accuracy of triple-frequency PPP with BDS-2 satellites can be improved by 12%, 25% and 10% in east, north and vertical directions, respectively. Full article
Show Figures

Graphical abstract

2976 KiB  
Article
Terrestrial Remote Sensing of Snowmelt in a Diverse High-Arctic Tundra Environment Using Time-Lapse Imagery
by Daniel Kępski, Bartłomiej Luks, Krzysztof Migała, Tomasz Wawrzyniak, Sebastian Westermann and Bronisław Wojtuń
Remote Sens. 2017, 9(7), 733; https://doi.org/10.3390/rs9070733 - 15 Jul 2017
Cited by 26 | Viewed by 9134
Abstract
Snow cover is one of the crucial factors influencing the plant distribution in harsh Arctic regions. In tundra environments, wind redistribution of snow leads to a very heterogeneous spatial distribution which influences growth conditions for plants. Therefore, relationships between snow cover and vegetation [...] Read more.
Snow cover is one of the crucial factors influencing the plant distribution in harsh Arctic regions. In tundra environments, wind redistribution of snow leads to a very heterogeneous spatial distribution which influences growth conditions for plants. Therefore, relationships between snow cover and vegetation should be analyzed spatially. In this study, we correlate spatial data sets on tundra vegetation types with snow cover information obtained from orthorectification and classification of images collected from a time-lapse camera installed on a mountain summit. The spatial analysis was performed over an area of 0.72 km2, representing a coastal tundra environment in southern Svalbard. The three-year monitoring is supplemented by manual measurements of snow depth, which show a statistically significant relationship between snow abundance and the occurrence of some of the analyzed land cover types. The longest snow cover duration was found on “rock debris” type and the shortest on “lichen-herb-heath tundra”, resulting in melt-out time-lag of almost two weeks between this two land cover types. The snow distribution proved to be consistent over the different years with a similar melt-out pattern occurring in every analyzed season, despite changing melt-out dates related to different weather conditions. The data set of 203 high resolution processed images used in this work is available for download in the supplementary materials. Full article
(This article belongs to the Special Issue Snow Remote Sensing)
Show Figures

Graphical abstract

Previous Issue
Next Issue
Back to TopTop