Highlights
What are the main findings?
- A novel optimized enhanced vegetation index (ONDVI) was developed by restructuring the normalized difference formulation with an exponential function, optimized band selection, and an enhancement factor, effectively alleviating vegetation index saturation in mature potato crops.
- Appropriate combinations of ONDVI, EVI, and GCVI significantly improved potato classification accuracy under conditions of high spectral similarity among vegetation types.
What are the implications of the main findings?
- Using freely available medium-resolution satellite imagery, the method reduces reliance on costly field surveys and high-resolution data, facilitating more accessible precision agriculture applications.
- The proposed vegetation index and multi-index fusion strategy improve crop separability without modifying the classification model structure, enhancing classification performance at a relatively low implementation cost.
Abstract
Potato is one of the major staple crops, and precise identification of potato planting areas is crucial for yield monitoring and future planting planning. However, during the later growth stages of potatoes, vegetation index identification tends to saturate, and the spectral differences between potatoes and other crops become minimal, resulting in difficulties in extraction and reduced accuracy. This study focuses on Huize County, a typical potato-producing region in Yunnan Province, China. Based on Landsat-8 OLI imagery from the 2020 winter cropping season, a novel optimized enhanced vegetation index (ONDVI) was developed and applied within a vegetation index recombination algorithm (NEG) for regional potato identification. The study first addresses the saturation issue of the Normalized Difference Vegetation Index (NDVI) under high vegetation coverage conditions through three steps: selecting the red, near-infrared, and green bands; reconstructing the saturation structure of the SR_B5 band; and re-defining the weighted band difference. ONDVI was nonlinearly combined with the enhanced vegetation index (EVI) and the Green Chlorophyll Vegetation Index (GCVI) to develop the vegetation index recombination algorithm (NEG), enhancing spectral differentiation among crops and improving the integrated characterization of potato canopy structure, chlorophyll content, and biomass dynamics. Finally, under a supervised classification framework, the random forest classifier was combined with manually labeled training samples to compare the classification performance of seven combination algorithms using the ONDVI, EVI, and GCVI indices. The results show that the NEG classification algorithm exhibits the best performance (Kappa coefficient = 0.9833; overall accuracy = 98.69%), with ONDVI contributing the most to the classification features in the NEG algorithm. The NEG combination algorithm fully leverages the advantages of the ONDVI, EVI, and GCVI indices, demonstrating high application potential for potato classification.
Keywords:
crop classification; vegetation index; NDVI; satellite; remote sensing; potato; random forest 1. Introduction
China is the world’s largest producer of potatoes [1]. In recent years, due to population growth, changes in dietary structure, and the promotion of staple food programs, the area of potato cultivation in Yunnan Province has continuously expanded, and the planting environment has become increasingly complex [2]. Currently, potato monitoring relies on manual field surveys, which are limited to area statistics and cannot fully capture the spatial distribution and spatiotemporal dynamics of potato cultivation [2]. While satellite remote sensing provides extensive spatial coverage, long-term temporal monitoring, and accurate crop spatial identification, in regions characterized by mixed cropland and forest or high-density vegetation saturation, its classification accuracy is constrained by the quality of the ground-truth data obtained from field surveys [3,4]. Late-stage potato crops, which are prone to confusion with other crops and forestland, further exacerbate the possibility of vegetation saturation due to the vigorous growth of their leaves.
In recent years, many studies have explored satellite-based remote sensing platforms for precise potato identification. Landsat satellite series (Landsat), Copernicus Sentinel satellite missions (Sentinel), and Moderate Resolution Imaging Spectroradiometer (MODIS) are the most commonly used satellite imagery sources for potato crop identification [5,6,7]. Landsat imagery has moderate spatial resolution and a longer revisit cycle, although Sentinel-2 provides higher temporal frequency, the effective availability of cloud-free observations in mountainous regions does not necessarily increase proportionally, making Landsat imagery a stable alternative for long-term crop classification [8,9]. Although Landsat imagery is a relatively good choice for crop extraction at the rural and township scale, its limited resolution makes it challenging to accurately extract crop information from similar spectral data when crop information is sparse [10,11]. Previous studies have used Landsat and Sentinel series satellites to predict potato planting areas in both domestic and international regions (high-latitude cold areas and perennial cropping fields), achieving good accuracy in identification. However, these studies are either limited by specific climatic conditions or rely heavily on numerous field validation points, which restricts their transferability and generalizability [12,13].
Vegetation indices, derived through band calculations, enhance vegetation information while suppressing background information, and are commonly used for crop extraction in complex environments. By optimizing input features without altering the structure of machine learning models, complementary information across crop spectral characteristics, phenological stages, and spatial heterogeneity can be fully exploited, thereby significantly improving classification accuracy and model robustness at a relatively low implementation cost [14,15]. Input feature optimization represents a relatively simple and highly transferable methodological strategy and is increasingly recognized as an effective approach for enhancing crop classification performance [16]. Normalized Difference Vegetation Index (NDVI) and enhanced vegetation index (EVI) were derived from MODIS satellite data and combined into time-series curves of phenological characteristics, enabling monitoring of crop growth status at 8-day intervals throughout the growing season and resulting in the estimation of potato planting density distribution in Bangladesh [17]. Multi-source NDVI composite imagery has been used for yield prediction across multiple potato fields [18]. Numerous studies have calculated Normalized Difference Vegetation Index (NDVI), enhanced vegetation index (EVI), and Green Chlorophyll Vegetation Index (GCVI) from satellite imagery to support planting area planning and management of potato crops [19,20,21]. However, NDVI shows clear limitations in potato crop classification, as it exhibits reduced sensitivity to aboveground biomass under conditions of high vegetation canopy cover [22]. In summary, most existing studies are conducted under the premise of abundant sample points for potato crops or dedicated potato planting experiments. Under conditions of limited field survey data and complex vegetation types, the discriminative capability of single vegetation indices such as NDVI, EVI, or GCVI declines, and their classification performance is further constrained when vegetation index saturation occurs.
To address vegetation index saturation and spectral similarity among crops, this study takes Huize County, a typical potato-producing region in Yunnan Province, China, as a case study and introduces the novel optimized enhanced vegetation index (ONDVI) in combination with the vegetation index recombination algorithm (NEG) to achieve a concise and efficient classification of potato crops. The construction of ONDVI consists of three steps: (1) developing an enhanced vegetation index (VI) based on NDVI; (2) constructing ONDVI based on the VI; and (3) determining the NEG index-based combined classification method. Finally, the accuracy of NEG for potato crop extraction and the contribution of ONDVI to potato crop classification were evaluated. The vegetation indices and classification method proposed in this study provide technical support for the accurate identification of potato planting areas and the development of planting management plans.
2. Study Area and Data
2.1. Research Area
Huize County is located in northeastern Yunnan Province and northwestern Qujing City, spanning longitudes 103°03′–103°55′E and latitudes 25°48′–27°04′N, and is one of the key potato-producing regions with distinct advantages in Yunnan Province. The county is located at the junction of the eastern Yunnan Plateau and the western Guizhou Plateau, within the main peak section of the Wumeng Mountains, featuring a stepped terrain that slopes from south to north with a maximum relative elevation difference of 3322.3 m, and its unique topographic conditions are well suited for potato cultivation [23]. The study area covers a total area of 5886 km2, encompassing the entire administrative region of Huize County [24]. According to agricultural surveys, Huize County has an average annual potato planting area of approximately 53,300 ha, spanning both cool high-altitude zones and low-heat river valleys and accounting for nearly half of the county’s cultivated land, with autumn-planted potatoes harvested in winter occupying about half of the annual potato production season [25,26]. Huize County has been recognized as an important virus-free seed potato and commercial potato production base in Yunnan Province and serves as a regional center for seed potato breeding and propagation. Owing to its representative plateau agricultural conditions, it is also considered one of the major potato-producing areas in Yunnan and Southwest China, making it a suitable and representative case for remote sensing-based potato classification studies [27]. The elevation and topographic characteristics of Huize County are shown in Figure 1.
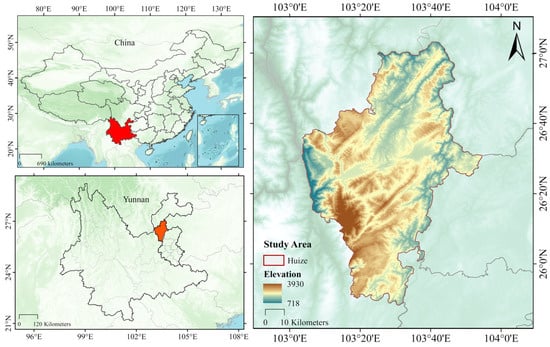
Figure 1.
Study area map of Huize County, Yunnan Province.
2.2. Data Processing
Google Earth Engine (GEE), with its robust computational power and extensive archive of raw satellite imagery, is particularly well-suited for the analysis and processing of landscapes characterized by complex land cover types [28,29,30]. A total of seven scenes covering the period from 1 September to 30 November 2020, corresponding to the key growth and harvest period of autumn-planted potatoes, were selected based on the region of interest and a cloud cover threshold of less than 70%, ensuring adequate coverage for subsequent classification. In this study, medium- to high-resolution optical imagery from the Landsat-8 Operational Land Imager (OLI) was utilized. All data processing and pixel-based classification were implemented within the Google Earth Engine (GEE) platform.
Among the high-spatial-resolution optical remote sensing products, Landsat imagery provided by the United States Geological Survey (USGS) is recognized as one of the most extensively utilized sources in scientific and operational applications [31,32]. The generation of the cloud-free optical image composite incorporated SR_B2 (blue), SR_B3 (green), SR_B4 (red), and SR_B5 (near-infrared, NIR), as well as two shortwave infrared bands—SR_B6 (SWIR1) and SR_B7 (SWIR2). The spectral response functions (SRFs) and detailed spectral band characteristics of the sensor are illustrated in Figure 2. Based on data retrieved from the Google Earth Engine (GEE) platform, the average number of valid observations per pixel during the 2020 potato growing season (1 September to 30 November) was 247. The number of effective observation pixels is shown in Figure 3. After cloud removal, effective pixels are mainly concentrated in images with cloud cover between 20% and 40%, while a considerable number of images are still available in the 60–70% cloud cover range. At the pixel level, cloud masking was applied to Landsat-8 imagery within the designated study area. The cloud removal process utilized the “QA_PIXEL” band to identify and mask cloud-contaminated pixels [33,34]. The satellite imagery was subjected to atmospheric correction and radiometric calibration. Scenes with cloud coverage not exceeding 40% were selected, followed by sequential clipping and cloud-masking procedures. All data were resampled to an average spatial resolution of 30 m. This procedure is intended to ensure the availability of high-quality target pixels characterized by accurate surface reflectance and radiometric brightness, thereby supporting reliable potato classification and identification.
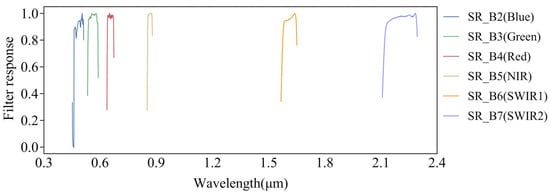
Figure 2.
The average relative spectral response functions (SRFs) of the Landsat 8 spectral bands employed in this study.
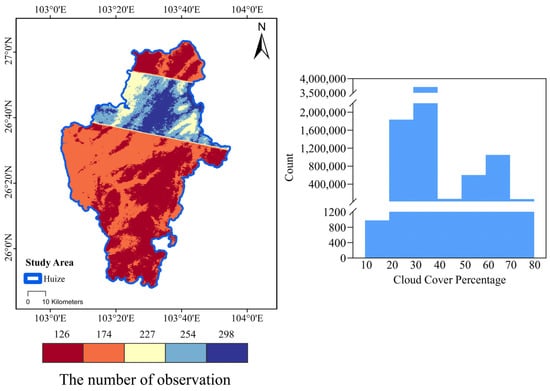
Figure 3.
Statistical analysis of Landsat 8 observation pixel counts and the distribution of image cloud cover percentages over Huize County during the period from September to November 2020.
Point data were collected through visual interpretation and field surveys, with a smartphone-based volunteer agricultural information collection application integrating Global Positioning System (GPS), video, and Geographic Information System (GIS), serving as the primary data acquisition tool to identify sample points of different land-use types in the study area. Sample points were collected randomly, and to ensure sample balance, stratified random sampling based on latitude and longitude was employed to obtain samples of forests, water bodies, built-up areas, other crops, and potatoes for training the random forest classifier. The number and types of sample points are presented in Table 1, and their spatial distribution is shown in Figure 4. To ensure a sufficient number of validation samples for evaluating model performance and mitigating overfitting, the dataset was split into training and validation sets at a ratio of 7:3. This data-splitting procedure was repeated multiple times to assess model performance and verify its consistency.

Table 1.
Types and number of sampling sites in Huize County.
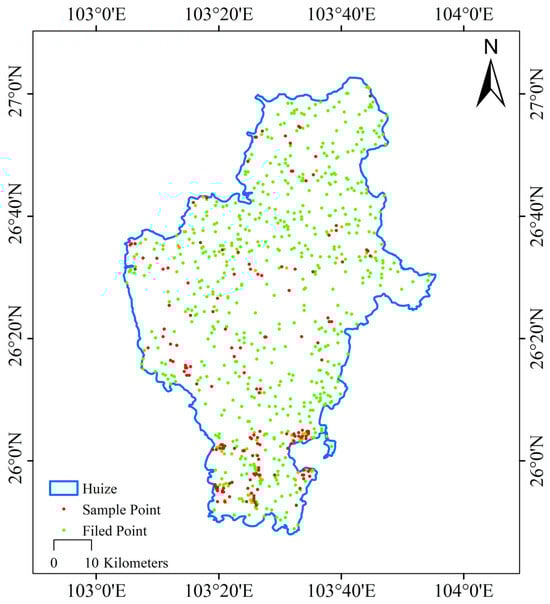
Figure 4.
Spatial distribution of sampling points for forests, water bodies, built-up areas, and other crops (green), and spatial distribution of sampling points for potato fields (red).
3. Experimental Methods
The classification algorithm workflow was implemented in Google Earth Engine, with Landsat-8 imagery used as the input data source. The study first analyzed spectral reflectance differences among sample points representing five land-cover types, including potato crops. To fully exploit reflectance differences across multispectral bands and enhance the discrimination of potato crops, spectrally similar bands were selected on the basis of NDVI, and the NDVI calculation structure was reorganized to derive the VI. In the generalized vegetation index (VI) normalization difference framework, the near-infrared band, which is prone to saturation, was used for structural reconstruction, and due to the relatively small difference between the red and green bands, an enhancement factor (a) was applied, resulting in the proposed ONDVI. Subsequently, seven combinations of ONDVI, EVI, and GCVI were evaluated, and the composite image classification results for potato crops and the other four land-cover types were assessed in terms of classification accuracy, suitability, and overall performance. The detailed workflow is shown in Figure 5.
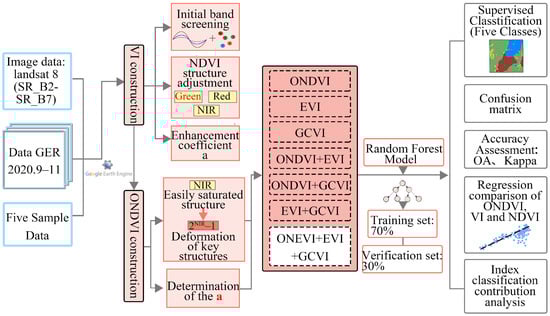
Figure 5.
Flowchart of the methodology for potato crop classification and mapping. Different colors represent different steps in the workflow: blue indicates data acquisition, red indicates vegetation index calculation and model construction, and gray indicates analysis of the model results.
3.1. The Construction of the VI
We first selected representative spectral bands from the multispectral imagery. Accordingly, a large number of pure samples derived from different land-cover types were selected and categorized into five classes: potato crops, other crops, woodlands, urban areas, and water bodies (Figure 6). More than 110 pure samples were collected for each land-cover class. Figure 6 illustrates the mean spectral curves of six multispectral bands. In the green and red, the spectral curves of potatoes, forests, and other crops exhibit relatively small variations, except for urban areas and water bodies. In the red and near-infrared (NIR) bands, the spectral curves of potatoes, forests, and other crops exhibit pronounced variations, whereas non-vegetated samples show relatively small changes. As shown in Figure 6, the spectral response of potato becomes relatively stabilized up to the near-infrared (NIR) band, indicating a high vegetation coverage condition that is prone to saturation effects in vegetation indices based on normalized difference structures. Accordingly, NDVI was further reformulated based on a three-band combination, as shown in Equation (1). In Equation (1), the difference between the SR_B4 (red) and SR_B3 (green) bands is relatively small; therefore, an enhancement coefficient (a) was introduced to amplify the difference between the red and green bands in the denominator of Equation (4), thereby adjusting the normalized difference calculation. The resulting vegetation index (VI) is given in Equation (2), and the determination of parameter a is described in Section 3.4.
NDVI = (NIR − Red)/(NIR + Red)
VI = (NIR − Red)/a × (Red − Green)
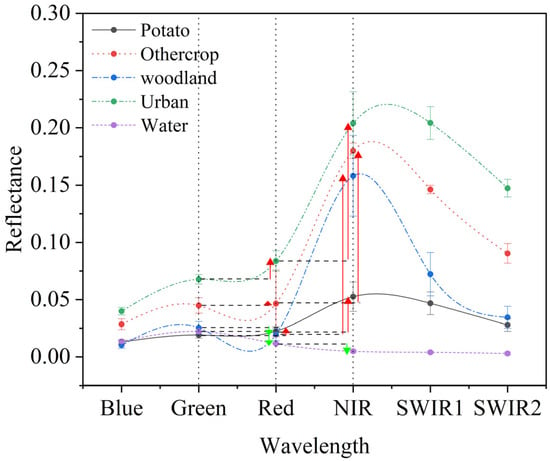
Figure 6.
Spectral curves for five land cover types. The arrows indicate the change in reflectance of the surveyed samples from the Red to NIR bands: red arrows represent an increase in reflectance in the NIR band relative to the Red band, whereas green arrows represent a decrease in reflectance.
3.2. The Construction of the ONDVI
Equation (3) uses the original NDVI formulation as an example to illustrate why the normalized difference structure leads to index saturation and fails to accurately reflect differences among vegetation types. When the SR_B5 value is much larger than SR_B4, the ratio SR_B4/SR_B5 approaches zero. Equation (3) is a modified formula used to illustrate NDVI saturation. As vegetation density increases, the difference between NIR and red becomes larger, and as shown in Equation (3), the ratio of red/NIR approaches zero. Under these conditions, the NDVI value remains nearly unchanged compared with its value before the increase in vegetation density and approaches 1 (saturation typically occurs when NDVI > 0.8). As a result, NDVI fails to adequately capture variations among different vegetation types (e.g., crops, forests, and grasslands), making land-cover discrimination more difficult.
NDVI_variant = (1 − Red/NIR)/(1 + Red/NIR)
The SR_B5 band is prone to saturation under conditions of high canopy cover during vigorous growth of potato and forest samples. Equation (4) represents a monotonic nonlinear function with a value range of 0–1 and does not alter the original range of the spectral band values. These characteristics ensure that, during nonlinear transformation, the spectral curves of the five land-cover types still retain their original value ranges.
f(x) = 2x − 1
ONDVI incorporates the exponential function in Equation (4) to achieve spatial-level synthesis of the vegetation index, thereby enhancing the sensitivity of NDVI to potato crop identification under conditions involving multiple vegetation and crop types. As shown in Figure 7, the linear stretching of ONDVI alleviates the compression effect of NDVI under high vegetation cover, enhances spectral gradient discrimination, and improves the identification accuracy of potato crops.
ONDVI = (2^{NIR} − 1) − Red)\a × (Red − Green)
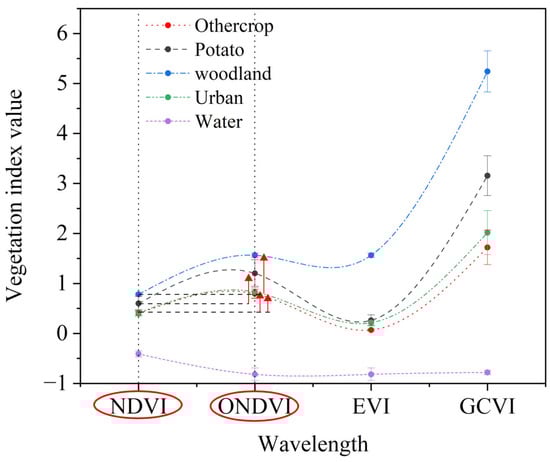
Figure 7.
Spectral curves of individual vegetation indices (NDVI, ONDVI, EVI, and GCVI) across five land-cover categories under identical sample datasets. This analysis was conducted prior to NEG construction to evaluate the discriminative ability of single indices; therefore, NEG values are not included in this figure. The red arrows represent the increase of ONDVI band reflectance relative to that of the NDVI band.
3.3. Construction of the NEG Index
Prior to constructing the NEG framework, a comparative analysis was conducted using individual vegetation indices (NDVI, ONDVI, EVI, and GCVI) under identical sample sets and classification conditions to evaluate their respective discriminative capabilities. Figure 7 therefore presents only the spectral behavior of single indices and does not include NEG, as NEG represents a fused index developed subsequently based on the outcomes of this preliminary analysis.
As illustrated in Figure 7, substantial overlap is observed among different land-cover classes in the NDVI feature space, particularly for potato, other crops, and woodland. This indicates that under high vegetation coverage conditions, NDVI exhibits limited discriminative capability among vegetation types and is prone to pronounced index-level spectral confusion. By comparison, ONDVI presents larger separability in mean index values across the five land-cover classes (potato, other crops, woodland, urban, and water). Nevertheless, the use of a single vegetation index remains insufficient to fully resolve spectral confusion among multiple vegetation types. In contrast, the EVI and GCVI indices contribute to reducing land-cover confusion by enhancing discrimination between crops and woodland, and between vegetated and non-vegetated classes, respectively. Based on this preliminary single-index evaluation, ONDVI demonstrated significantly stronger separability among major land-cover types than NDVI, providing the basis for selecting ONDVI as a core component in the subsequent NEG fusion framework.
To construct a composite spectral feature that more effectively characterizes potato canopy properties, this study designed the NEG fusion index based on ONDVI, EVI, and GCVI, as formulated in Equation (8). ONDVI emphasizes red–near-infrared differences in high-biomass vegetation, EVI enhances sensitivity to canopy structure while suppressing soil background effects, and GCVI is sensitive to variations in chlorophyll content and greenness. ONDVI, EVI, and GCVI were linearly combined to form the NEG index. This fusion strategy leverages the synergy among multiple vegetation indices to enhance the comprehensiveness of potato canopy information representation and spectral discriminability, thereby improving the identification accuracy of potato pixels in the classification model.
GCVI = NIR/Green − 1
EVI = 2.5 × (NIR − Red)/(NIR + 6 × Red − 7.5 × Blue + 1)
NEG = (2NIR − 1) − Red)\1 × (Red − Green) + 2.5 × (NIR − Red)/( NIR + 6 × Red − 7.5 × Blue + 1)+ NIR/Green − 1
Based on ONDVI, EVI, and GCVI, this study designed seven different vegetation index combination schemes. To reveal the classification performance of ONDVI, EVI, and GCVI for potato discrimination, a controlled-variable experimental design was adopted. Under identical input imagery, the same set of supervised classification samples, fixed random seeds, and an equal training–validation split ratio, classification results were compared using each individual index, pairwise combinations of the three indices, and the combination of all three indices.
3.4. Determination of Parameter a
The enhancement coefficient (a) in ONDVI was determined empirically within the NEG framework for potato classification. Candidate values of a ranging from 0 to 7 in increments of 1 were separately substituted into the NEG computations, and the overall accuracy (OA) and Kappa coefficient (KP) of potato extraction were evaluated using a dataset of sample points from five land-cover types in combination with a random forest classifier. As shown in Figure 8, the classification performance reached its maximum when a = 1; OA and KP decreased when a increased to 2–4, and remained relatively stable but lower than the maximum for a = 4–7. Therefore, a value of 1 was used for all subsequent analyses.
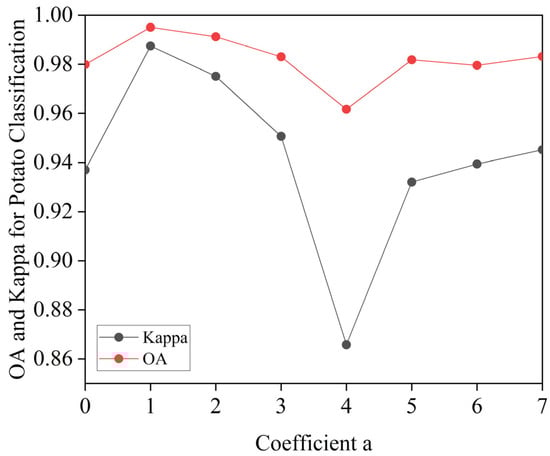
Figure 8.
Extraction accuracy of potatoes at different a values.
3.5. Random Forest Algorithms Feature Extraction
The random forest algorithm performs random sampling on the training samples to generate multiple training subsets, each of which is used to construct an individual decision tree. Each decision tree randomly selects a subset of features, which improves the generalization ability of the model and enhances classification accuracy [35]. This study uses the Landsat-8 dataset and applies the random forest algorithm for land-cover classification. First, vegetation index composite imagery for the winter cropping season was prepared, and seasonal imagery was combined with three composite indices to construct the classification dataset according to the feature configuration of the classification algorithm. The random forest classifier was applied with 400 decision trees, and samples within the study area were randomly partitioned, with 70% used for training and 30% for testing. To avoid increased computational complexity or degraded classification performance due to an excessive number of features (i.e., overfitting), out-of-bag (OOB) data were used to evaluate variable importance and automatically select key features, thereby optimizing the classification results. Input features were ranked based on their Gini importance, measured as the Mean Decrease in Impurity (MDI), to identify variables with high contributions.
3.6. Crop Stage Extraction
Temporal image grouping was performed based on the phenological characteristics and cropping duration of potatoes in Huize County. Four planting seasons were defined: minor spring cropping from 1 December to 28 February, major spring cropping I from 1 March to 31 May, major spring cropping II from 1 June to 31 August, and winter cropping from 1 September to 30 November. Given that potatoes during the winter cropping season are in the harvest stage, when vegetation indices are prone to saturation and spectral confusion with other crops and vegetation is more likely, the winter cropping season was selected as the study period for potato crop classification.
3.7. Accuracy Evaluation Method
In Google Earth Engine (GEE), the classification results were evaluated using an error matrix derived from the confusion matrix to assess classifier performance. Overall accuracy (OA) was used to evaluate the overall effectiveness of the classification, while the Kappa coefficient (KP) was employed to measure the agreement between the classification results and random classification, thereby reflecting the overall performance of the classifier. These evaluation metrics can effectively assess the classifier’s performance in handling class imbalance and random predictions. Consumer’s Accuracy (CA) measures the proportion of correctly classified samples among all reference (ground-truth) samples, while Producer’s Accuracy (PA) represents the proportion of samples correctly classified as a given class relative to all samples that were actually predicted as that class.
4. Results
4.1. Verification of Potato Extraction Results Under Different Vegetation Index Algorithms
4.1.1. Accuracy Evaluation of Potato Extract Results
This study employed four classification accuracy metrics—Kappa coefficient, overall accuracy (OA), Producer’s Accuracy (PA), and User’s Accuracy (UA)—to evaluate the classification performance of five land-cover classes, including potatoes, other crops, forest, urban areas, and water bodies, thereby ensuring the accuracy and reliability of the classification results. As shown in Table 2, the Kappa accuracy coefficients for potato classification are ranked as follows: NEG > ONDVI > ONDVI + EVI > ONDVI + GCVI > EVI > EVI + GCVI > GCVI. The overall accuracy (OA) coefficients are ranked as follows: NEG > ONDVI > ONDVI + EVI > EVI > ONDVI + GCVI > EVI + GCVI > GCVI. Compared with the ONDVI, ONDVI + EVI, EVI, ONDVI + GCVI, EVI + GCVI, and GCVI methods, the NEG classification approach improved the Kappa coefficient by 0.0019, 0.0057, 0.0144, 0.0150, 0.0259, and 0.1332, respectively, and increased the overall accuracy (OA) by 0.42%, 1.45%, 4.00%, 4.68%, 8.10%, and 9.10%, respectively. An analysis of the Producer’s Accuracy (PA) and User’s Accuracy (UA) for each land-cover class indicates that all seven methods achieved accuracies exceeding 80% for potatoes, other crops, forest, urban areas, and water bodies. For potato classification, the methods with the highest PA were ONDVI and NEG, while ONDVI + EVI achieved the highest UA. In the classification of other crops, the ONDVI + GCVI method exhibited the best performance in both PA and UA.
Table 2.
Comparative analysis of classification accuracy based on multi-index composite images using the random forest algorithm.
As shown in Figure 9, in the NEG method—which achieved the highest Kappa and overall accuracy (OA) among all index combinations—the contribution rates of the three indices were 34.01% for the ONDVI band, 33.70% for the EVI band, and 32.30% for the GCVI band. Compared with ONDVI + EVI and ONDVI + GCVI, ONDVI showed the highest contribution only within the NEG framework, while the three indices contributed in a relatively balanced manner, indicating that the superior performance of NEG arises from multi-index synergy, with ONDVI providing critical but not exclusive information support. Although NEG achieved the highest classification accuracy, it represents a composite feature configuration rather than an independent methodological innovation.
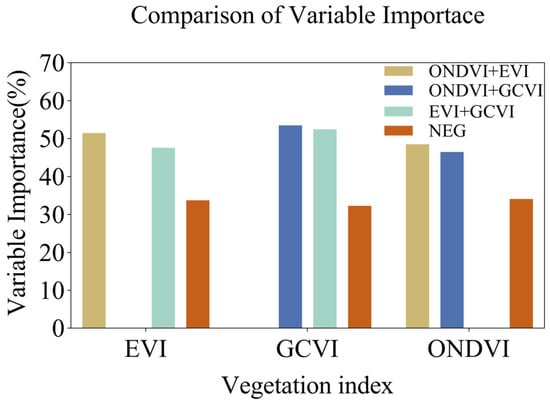
Figure 9.
Contribution of each vegetation index to all classification results under different taxonomic systems.
4.1.2. Comparison of Potato Classification Extraction Results
The classification results obtained using different vegetation index combinations are shown in Figure 10. All experiments were conducted under identical conditions, including the same study area, image acquisition period, masking strategy, sample points (SPs), training–validation split ratio, and random seed. Only the input feature combinations were varied; therefore, the differences among the classification schemes can be primarily attributed to the distinct spectral representation capabilities of the vegetation indices for land-cover classes. From a spatial distribution perspective, the potato classification results in Figure 10b,e,f differ markedly from those obtained using the other classification methods, indicating that GCVI exerts a strong influence on the discrimination of land-cover types. However, despite the pronounced changes in the overall classification patterns, the Producer’s Accuracy of the Potato class under the GCVI-based scheme remains above 88%, indicating that this index still provides a certain degree of separability for potato samples in feature space. GCVI is highly sensitive to vegetation with high chlorophyll content, which tends to enhance the spectral responses of Woodland and Other crop classes, thereby increasing their spectral confusion with the Potato class. This effect constitutes a primary reason for the notable decline in overall classification performance (OA and Kappa) observed in the GCVI-based and GCVI-combined schemes. In addition, within the GCVI + EVI combination, the insufficient sensitivity to water bodies characterized by low near-infrared and high visible reflectance leads to frequent misclassification of water areas, which further compromises the overall classification stability.
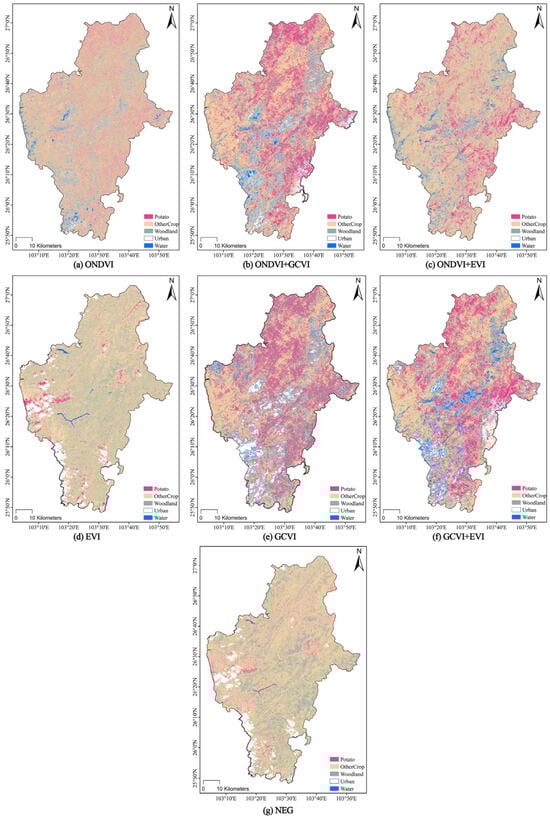
Figure 10.
Classification results of potato varieties using seven vegetation indices. Subfigures (a–g) show different index classification combinations.
NDVI is one of the representative indices commonly used to characterize and identify the growth status of potato crops. To validate the strength of the ONDVI and NEG indices, we conducted a correlation analysis between these two indices and the EVI, GCVI, and NDVI indices. The results are shown in Figure 11. From Figure 11a,b, it can be seen that GCVI has the highest correlation with NDVI, with an R2 value of 0.84, indicating a very strong positive correlation. The correlations between NEG, ONDVI, and NDVI are also relatively high, with the maximum R2 value around 0.81. The correlation between EVI and NDVI is the weakest, with an R2 value as low as 0.15, and the scatter plot distribution is uneven. Both the NEG and ONDVI indices, as improved versions, inherit the sensitivity of NDVI to vegetation growth conditions, while also offering certain enhancements and supplementary effects. Both the NEG and ONDVI indices, as improved versions, inherit the sensitivity of NDVI to vegetation growth conditions, while also offering certain enhancements and supplementary effects. EVI and NDVI are no longer in a simple linear relationship; instead, they are more suitable as ‘complementary information’ within a multi-index combination. This may be due to the suppression of saturation issues in high-coverage vegetation and background effects. In addition, within the GCVI + EVI combination, the insufficient sensitivity to water bodies characterized by low near-infrared and high visible reflectance leads to frequent misclassification of water areas, which further compromises the overall classification stability.
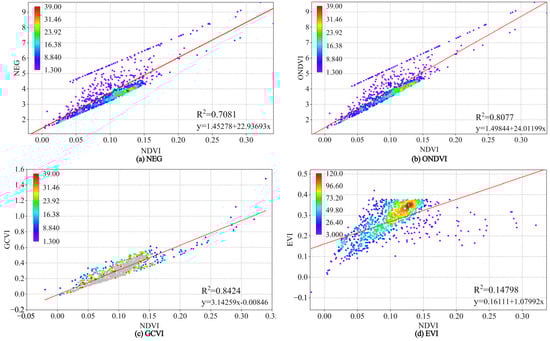
Figure 11.
Linear regression analysis of different vegetation indices with NDVI.
4.2. Analysis of Confusion Matrices for Potato Classification Under Different Vegetation Index Algorithms
As shown in the confusion matrix analysis in Figure 12, the accuracy ranking for potato crop classification is as follows: NEG > ONDVI > ONDVI + EVI > EVI > ONDVI + GCVI > GCVI > EVI + GCVI. From the confusion matrices in Figure 12, it can be observed that although single indices such as ONDVI, EVI, and GCVI can effectively distinguish between urban land and water bodies, there is still significant confusion between different crops, particularly between Class 1 and Class 2, and Class 2 and Class 3. From the confusion matrices in Figure 13, it can be observed that although single indices such as ONDVI, EVI, and GCVI can effectively distinguish between urban land and water bodies, there is still significant confusion between different crops, particularly between Class 1 and Class 2, and Class 2 and Class 3. As the index combination shifts from two indices to three, the diagonal elements of EVI + GCVI and ONDVI + EVI generally increase, and misclassified pixels decrease. Among them, the NEG (ONDVI + EVI + GCVI) combination shows the most concentrated diagonal, with the correct identification of potato, other crops, forestland, urban land, and water bodies at 51, 54, 25, 66, and 31 pixels, respectively. There are almost no misclassifications into other categories, indicating that the NEG combination significantly enhances the separability of the five land cover types and the stability of the classification results. The NEG method provides rich spectral features and may be more robust under complex background conditions (such as soil interference and mixed pixels). After combining with vegetation indices to synthesize imagery, it achieves high recognition accuracy and distinct differentiation. The method is simple in terms of features, with low computational overhead, making it suitable for rapid identification.
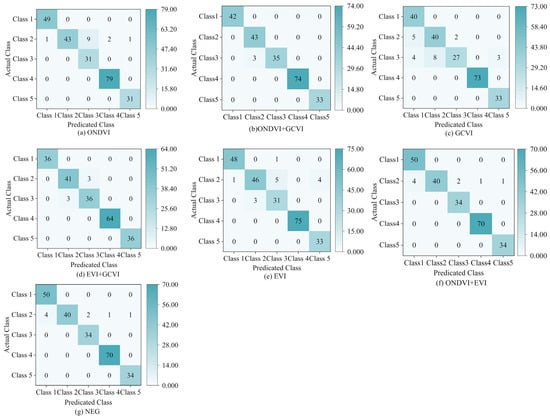
Figure 12.
Confusion matrix analysis for classification methods. Class 1 (Potato), Class 2 (Other Crop), Class 3 (Woodland), Class 4 (Urban), Class 5 (Water).
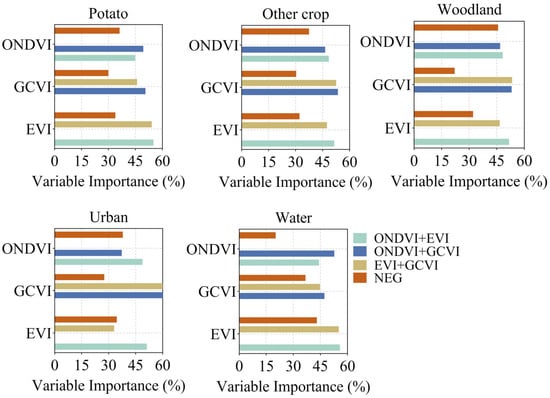
Figure 13.
This figure presents the variable importance analysis for the five-class classification results generated using the random forest (RF) algorithm. The x-axis denotes the relative importance of each input variable, while the y-axis displays spectral bands employed in the classification process.
4.3. Classification Feature Contribution Analysis
To reveal the ability of vegetation indices to discriminate the target class, a classification contribution analysis was conducted, as shown in Figure 13. For potato classification using the NEG method, the contribution rates of the vegetation indices were 36.21% for ONDVI, 33.87% for EVI, and 29.92% for GCVI. The red-edge response characteristics captured by ONDVI constitute the primary contributor to the discrimination of potato crops. In the dual-index combinations ONDVI + EVI and ONDVI + GCVI, EVI and GCVI exhibited higher contribution rates than ONDVI, accounting for 55.08% and 50.59%, respectively. In the EVI + GCVI combination, EVI contributed more than GCVI, with a contribution rate of 54.09%. The NEG combination achieved better classification performance than the three dual-index combinations. Within the NEG framework, the weights of ONDVI, EVI, and GCVI were relatively balanced, indicating that potato identification does not rely on a single index but instead benefits from the complementary information captured by the three indices simultaneously.
Accurate discrimination of the background land-cover classes—other crops, woodland, urban areas, and water bodies—contributes to improving the classification accuracy of potato crops. Analysis of the four multi-index composite classification methods indicates that ONDVI and GCVI contribute more substantially to the accurate identification of woodland and other crop classes, EVI plays a greater role in the accurate discrimination of water bodies, and GCVI contributes more prominently to urban area classification.
5. Discussion
5.1. Advantages of the Vegetation Index Method for Crop Extraction
Crop classification and identification are of great significance for adjusting agricultural planting strategies and monitoring yields. With the development of smart agriculture, relying solely on manual mapping of crop maps faces challenges such as time-consuming, labor-intensive, high-cost, and low-efficiency issues. However, under medium-resolution satellite imagery, performing high-precision crop classification and extraction, particularly for potato crops with dense canopies, and minimal differences in leaf color and shape at the late growth stage, presents a highly challenging task. At the late growth stage of crops, vegetation indices for multiple types of vegetation are prone to saturation, making it difficult to accurately extract individual crop classes.
Vegetation indices compress multi-band information into a few variables with clear physiological significance, suppress background information, and amplify the spectral differences between target crops and non-target backgrounds, thereby assisting machine learning models in improving crop classification performance [36]. Random forest is one of the commonly used algorithms for crop classification. By incorporating index features into the feature set, random forest can learn more discriminative feature patterns from multi-dimensional, complementary spectral information, reducing the saturation or confusion that may arise from using a single index, thereby enhancing the separability between different crop types. Previous studies have demonstrated that altering the structure of multi-spectral indices used in calculations helps to fully leverage the complementary spectral reflectance and growth characteristics of crops, thereby enhancing classification performance [16,37]. Genyun Sun et al. improved the extraction accuracy in shadowed areas and high-density vegetation by selectively adjusting the band weights in the EVI vegetation index formula to emphasize specific feature bands [38,39,40]. Previous studies have found that adjusting the index structure is often key to enhancing vegetation classification capabilities.
Aside from vegetation index methods, deep learning, feature extraction, and band selection are also widely used classification techniques [41,42,43]. However, deep learning models typically require a large amount of labeled data for training, making them unsuitable for small sample datasets. Feature extraction methods, while traditional and computationally simple, require comprehensive information on various crops, environments, and even light and temperature conditions. Band selection can improve computational efficiency and reduce redundant data, but it often requires empirical research and prior accumulated results. Its transferability in crop classification across different regions is generally limited [13,44,45]. Accurate discrimination of the background land-cover classes—other crops, woodland, urban areas, and water bodies—contributes to improving the classification accuracy of potato crops. Analysis of the four multi-index composite classification methods indicates that ONDVI and GCVI contribute more substantially to the accurate identification of woodland and other crop classes, EVI plays a greater role in the accurate discrimination of water bodies, and GCVI contributes more prominently to urban area classification.
In this study, an initial spectral analysis was conducted on the supervised classification samples of the target classes to explore the spectral information contained in three multispectral bands. Based on this analysis, the NDVI formulation was modified, and a new vegetation index structure, termed ONDVI, was proposed. By integrating the newly proposed vegetation index with existing vegetation indices for high-accuracy crop extraction during the late growth stage of winter crops, the proposed approach enhances the extraction capability of individual crops under conditions of high vegetation saturation and complex multi-vegetation environments.
5.2. Improvements to Crop Classification Extraction Using the New Vegetation Index
Multi-index combinations can often improve classification performance at the input level by extracting more representative physiological features from redundant multispectral information, thereby reducing the risk of overfitting and information overload caused by high-dimensional data. Numerous studies have demonstrated that incorporating multiple vegetation indices (e.g., NDVI, EVI, GNDVI) as input features for classifiers can significantly enhance the classification accuracy of various crop types, including rice, wheat, and potatoes, outperforming traditional approaches that rely on a single index such as NDVI alone. For example, higher crop-type identification accuracy has been achieved using vegetation index ensemble methods and mean-based clustering algorithms. Furthermore, systematic reviews have indicated that the combination of multiple vegetation indices with machine learning techniques has become a mainstream practice in agricultural remote sensing [36,46,47,48]. In this study, high-accuracy potato classification was achieved by jointly integrating the newly proposed ONDVI with EVI and GVI.
From the analysis of feature contribution for potato classification, the NEG method—which achieved the best classification performance—exhibited relatively balanced weights for ONDVI, EVI, and GCVI, with contribution rates ranked as ONDVI > EVI > GCVI. In contrast, in the ONDVI + GCVI and ONDVI + EVI combinations, ONDVI showed the lowest contribution. Compared with these two methods, the NEG approach increased the contribution share of ONDVI, thereby improving the classification accuracy for the potato class. From the overall feature contribution analysis, the NEG classification method—where ONDVI ranked first in contribution—continued to achieve the best classification performance. In contrast, when the contributions of EVI and GCVI increased in the ONDVI + GCVI and ONDVI + EVI methods, classification accuracy declined. This may be attributed to the ONDVI formulation, which enhances the discriminative potential of the red (SR_B3) and green (SR_B4) bands, whose separability is originally lower than that of the other spectral bands. This characteristic enables ONDVI to provide clearer class separability during classification, particularly by enhancing sensitivity in distinguishing crops from background features. By enhancing the contrast between the near-infrared (SR_B5) and red bands (SR_B4), this approach improves the sensitivity of red-edge-related information to variations in chlorophyll content and canopy structure, resulting in stronger spectral discriminability in high vegetation coverage conditions, particularly during the late growth stage of potato crops.
Multispectral bands have been shown in numerous studies to improve classification accuracy, as they are particularly sensitive to leaf pigment absorption and to variations in leaf area across different growth stages [49,50]. Texture features (e.g., those derived from the gray-level co-occurrence matrix and local binary patterns) can capture the spatial heterogeneity of crop canopies, thereby compensating for the limitations of spectral information. Topographic features (e.g., slope and elevation) reflect variations in spectral responses induced by terrain differences. Both types of features can further enhance the stability of classification models in complex environments [15,51]. Integrating high-resolution Sentinel imagery with spectral features has been shown to accurately delineate crop fields and capture small-scale spatial heterogeneity in crops such as wheat, maize, and soybean [15,52,53]. In future research, the NEG approach will be integrated with multispectral bands, texture features, and topographic features to improve the identification of potato growth conditions across different phenological stages.
5.3. Limitations and Prospects of Vegetation Index-Based Crop Classification
Although ONDVI was specifically developed and validated for potato crop classification in this study, its spectral formulation based on the near-infrared, red, and green bands of Landsat-8 suggests potential applicability to land-cover types dominated by crops such as maize, soybean, and cotton that exhibit similar canopy structures and chlorophyll-driven reflectance responses. Studies have shown that incorporating multiple spectral bands, such as shortwave infrared (SWIR) and near-infrared (NIR), significantly improves classification accuracy in cotton mapping; similarly, the inclusion of NIR and SWIR bands enhances subsequent model performance in maize and soybean crop classification [54,55]. Crops with similar spectral characteristics may benefit from the enhanced spectral separability provided by integrating near-infrared, red, and green bands.
Beyond potato cultivation systems, ONDVI may theoretically help distinguish crop types with moderate-to-dense canopy cover and pronounced seasonal dynamics, as these ecosystems exhibit comparable red–near-infrared contrast and vegetation vigor signals. Previous studies have shown that incorporating red-edge and near-infrared (NIR) bands improves the identification accuracy of wheat and barley under high-density canopy conditions during late growth stages (autumn) [56]. Vegetation indices incorporating red and near-infrared bands have been shown to maintain stable classification performance in heterogeneous cropping regions dominated by mixed wheat and maize cultivation [57]. The potential transferability remains a spectral-based hypothesis rather than an empirically validated conclusion. Future studies will assess ONDVI generalizability across agro-ecological zones through cross-crop and multi-regional evaluations.
This study still has certain limitations. The current classification is based solely on data from a single growing season, and the spatial and temporal resolutions of the data are subject to limitations. Incorporating multi-temporal remote sensing data from other seasons or the entire year into a joint modeling framework is expected to further improve the classification methodology. The generalization ability of the model may decline when applied to different regions or under extreme climatic conditions. In future studies, it is necessary to further integrate the NEG approach with topographic data, texture features, and multispectral bands to explore its potential applicability under complex terrain and diverse crop growth conditions.
6. Conclusions
The saturation of vegetation indices under vigorous crop growth and the spectral similarity among vegetation types pose major challenges for potato crop extraction. This study indicates that the classification accuracy of a target crop can be improved when innovative vegetation index structures are developed to overcome index saturation and when multi-index fusion approaches are used to enhance the spectral separability of spectrally similar crops. In this study, the spectral information of the target crop was thoroughly explored, and a novel optimized enhanced vegetation index (ONDVI) was reconstructed based on spectral band selection. Seven combinations of ONDVI, EVI, and GCVI were evaluated, among which the vegetation index recombination algorithm (NEG) approach achieved the best classification performance, with a Kappa coefficient of 0.9833 and an overall accuracy (OA) of 98.69%. Future research will incorporate additional growing seasons and planting regions to further optimize the classification methodology, with the aim of providing valuable information to support agricultural production.
Author Contributions
J.W. and Y.C. designed the research scheme. Y.C. developed the comparative analysis framework and performed the data analysis. All authors contributed to data collection. All authors have read and agreed to the published version of the manuscript.
Funding
This research was supported by the National Key Research and Development Program of China, grant number 2024YFD1700104.
Data Availability Statement
Data is available free of charge upon request.
Acknowledgments
The authors would like to express their sincere gratitude to the reviewers for their careful evaluation of the manuscript and for their constructive comments and insightful suggestions. Their valuable feedback has significantly contributed to improving the clarity, rigor, and overall quality of this work.
Conflicts of Interest
The authors declare no conflicts of interest.
References
- FAO. FAO Statistical Yearbook 2013—World Food and Agriculture; FAO Statistical Yearbook; FAO: Rome, Italy, 2012; ISBN 978-92-5-107396-4. [Google Scholar]
- Azizabadi, E.C.; Badreldin, N. A Review on Potato Crop Yield and Nitrogen Management Utilizing Remote/Proximal Sensing Technologies and Machine Learning Models in Canada. Potato Res. 2024, 68, 1659–1679. [Google Scholar] [CrossRef]
- Zhou, Z.; Liu, Y.; Diao, C. CropSight-US: An Object-Based Crop Type Ground Truth Dataset Using Street View and Sentinel-2 Satellite Imagery across the Contiguous United States, 2013–2023. Earth Syst. Sci. Data Discuss. 2025. [Google Scholar] [CrossRef]
- Nukala, R.M.; Panjala, P.; Mahammood, V.; Gumma, M.K. Strategic Ground Data Planning for Efficient Crop Classification Using Remote Sensing and Mobile-Based Survey Tools. Geographies 2025, 5, 59. [Google Scholar] [CrossRef]
- Awad, M.M. Toward Precision in Crop Yield Estimation Using Remote Sensing and Optimization Techniques. Agriculture 2019, 9, 54. [Google Scholar] [CrossRef]
- Ashourloo, D.; Shahrabi, H.S.; Azadbakht, M.; Rad, A.M.; Aghighi, H.; Radiom, S. A Novel Method for Automatic Potato Mapping Using Time Series of Sentinel-2 Images. Comput. Electron. Agric. 2020, 175, 105583. [Google Scholar] [CrossRef]
- Salvador, P.; Gómez, D.; Sanz, J.; Casanova, J.L. Estimation of Potato Yield Using Satellite Data at a Municipal Level: A Machine Learning Approach. ISPRS Int. J. Geo-Inf. 2020, 9, 343. [Google Scholar] [CrossRef]
- Liu, Y.; Chen, X.; Chen, J.; Zang, Y.; Wang, J.; Lu, M.; Sun, L.; Dong, Q.; Qiu, B.; Zhu, X. Long-Term (2013–2022) Mapping of Winter Wheat in the North China Plain Using Landsat Data: Classification with Optimal Zoning Strategy. Big Earth Data 2024, 8, 494–521. [Google Scholar] [CrossRef]
- Song, X.-P.; Huang, W.; Hansen, M.C.; Potapov, P. An Evaluation of Landsat, Sentinel-2, Sentinel-1 and MODIS Data for Crop Type Mapping. Sci. Remote Sens. 2021, 3, 100018. [Google Scholar] [CrossRef]
- Fan, J.; Zhang, X.; Zhao, C.; Qin, Z.; Vroey, M.D.; Defourny, P. Evaluation of Crop Type Classification with Different High Resolution Satellite Data Sources. Remote Sens. 2021, 13, 911. [Google Scholar] [CrossRef]
- Chen, C.; Dong, T.; Wang, Z.; Wang, C.; Song, W.; Zhang, H. Exploring Optimal Features and Image Analysis Methods for Crop Type Classification from the Perspective of Crop Landscape Heterogeneity. Remote Sens. Appl. Soc. Environ. 2024, 36, 101308. [Google Scholar] [CrossRef]
- Imtiaz, F.; Farooque, A.A.; Randhawa, G.S.; Wang, X.; Esau, T.J.; Hashemi Garmdareh, S.E.; Acharya, B. Optimizing Potato Yield Mapping and Prediction: Integrating Satellite-Based Remote Sensing and Machine Learning for Sustainable Agriculture. Comput. Electron. Agric. 2025, 237, 110636. [Google Scholar] [CrossRef]
- Li, Q.; Fu, X.; Li, H.; Zhou, H. Advancing County-Level Potato Cultivation Area Extraction: A Novel Approach Utilizing Multi-Source Remote Sensing Imagery and the Shapley Additive Explanations–Sequential Forward Selection–Random Forest Model. Agriculture 2025, 15, 92. [Google Scholar] [CrossRef]
- Kang, Y.; Meng, Q.; Liu, M.; Zou, Y.; Wang, X. Crop Classification Based on Red Edge Features Analysis of GF-6 WFV Data. Sensors 2021, 21, 4328. [Google Scholar] [CrossRef]
- Cheng, G.; Ding, H.; Yang, J.; Cheng, Y. Crop Type Classification with Combined Spectral, Texture, and Radar Features of Time-Series Sentinel-1 and Sentinel-2 Data. Int. J. Remote Sens. 2023, 44, 1215–1237. [Google Scholar] [CrossRef]
- Mohammadpour, P.; Viegas, D.X.; Viegas, C. Vegetation Mapping with Random Forest Using Sentinel 2 and GLCM Texture Feature—A Case Study for Lousã Region, Portugal. Remote Sens. 2022, 14, 4585. [Google Scholar] [CrossRef]
- Islam, A.S.; Bala, S.K. Assessment of Potato Phenological Characteristics Using MODIS-Derived NDVI and LAI Information. GIScience Remote Sens. 2008, 45, 454–470. [Google Scholar] [CrossRef]
- Ramirez-Gonzalez, D.A.; Chokmani, K.; Cambouris, A.N.; D’Souza, M.L. Delineation of Management Zones Based on the Agricultural Potential Concept for Potato Production Using Optical Satellite Images. Remote Sens. 2025, 17, 3709. [Google Scholar] [CrossRef]
- Newton, I.H.; Tariqul Islam, A.F.M.; Saiful Islam, A.K.M.; Tarekul Islam, G.M.; Tahsin, A.; Razzaque, S. Yield Prediction Model for Potato Using Landsat Time Series Images Driven Vegetation Indices. Remote Sens. Earth Syst. Sci. 2018, 1, 29–38. [Google Scholar] [CrossRef]
- Gómez, D.; Salvador, P.; Sanz, J.; Casanova, J.L. New Spectral Indicator Potato Productivity Index Based on Sentinel-2 Data to Improve Potato Yield Prediction: A Machine Learning Approach. Int. J. Remote Sens. 2021, 42, 3426–3444. [Google Scholar] [CrossRef]
- Meivel, S.; Maheswari, S. Monitoring of Potato Crops Based on Multispectral Image Feature Extraction with Vegetation Indices. Multidimens. Syst. Signal Process. 2022, 33, 683–709. [Google Scholar] [CrossRef]
- Mukiibi, A.; Machakaire, A.T.B.; Franke, A.C.; Steyn, J.M. A Systematic Review of Vegetation Indices for Potato Growth Monitoring and Tuber Yield Prediction from Remote Sensing. Potato Res. 2025, 68, 409–448. [Google Scholar] [CrossRef]
- Sun, X.; Li, D.; Cheng, X.; Ma, J.; He, W. Temporal and Spatial Pattern Variation Analysis of Grassland Resources in Huize County, Yunnan, China. IOP Conf. Ser. Earth Environ. Sci. 2019, 362, 012160. [Google Scholar] [CrossRef]
- Wang, S. Current Status, Problems, and Countermeasures of Potato Industry Development in Huize County. South. Agric. 2023, 17, 174–176. (In Chinese) [Google Scholar]
- Minda, T.T.; van der Molen, M.K.; Struik, P.C.; Combe, M.; Jiménez, P.A.; Khan, M.S.; de Arellano, J.V.-G. The Combined Effect of Elevation and Meteorology on Potato Crop Dynamics: A 10-Year Study in the Gamo Highlands, Ethiopia. Agric. For. Meteorol. 2018, 262, 166–177. [Google Scholar] [CrossRef]
- Adekanmbi, T.; Wang, X.; Basheer, S.; Liu, S.; Yang, A.; Cheng, H. Climate Change Impacts on Global Potato Yields: A Review. Environ. Res. Clim. 2023, 3, 012001. [Google Scholar] [CrossRef]
- Jun, W.; Yunzhong, D. Current Status and Suggestions for Potato Industry Development in Huize. Agric. Dev. Equip. 2021, 9, 38–39. (In Chinese) [Google Scholar]
- Shelestov, A.; Lavreniuk, M.; Kussul, N.; Novikov, A.; Skakun, S. Exploring Google Earth Engine Platform for Big Data Processing: Classification of Multi-Temporal Satellite Imagery for Crop Mapping. Front. Earth Sci. 2017, 5, 17. [Google Scholar] [CrossRef]
- Tamiminia, H.; Salehi, B.; Mahdianpari, M.; Quackenbush, L.; Adeli, S.; Brisco, B. Google Earth Engine for Geo-Big Data Applications: A Meta-Analysis and Systematic Review. ISPRS J. Photogramm. Remote Sens. 2020, 164, 152–170. [Google Scholar] [CrossRef]
- Amin, G.; Imtiaz, I.; Haroon, E.; Saqib, N.U.; Shahzad, M.I.; Nazeer, M. Assessment of Machine Learning Algorithms for Land Cover Classification in a Complex Mountainous Landscape. J. Geovis Spat. Anal. 2024, 8, 34. [Google Scholar] [CrossRef]
- Hemati, M.; Hasanlou, M.; Mahdianpari, M.; Mohammadimanesh, F. A Systematic Review of Landsat Data for Change Detection Applications: 50 Years of Monitoring the Earth. Remote Sens. 2021, 13, 2869. [Google Scholar] [CrossRef]
- Irons, J.R.; Dwyer, J.L.; Barsi, J.A. The next Landsat Satellite: The Landsat Data Continuity Mission. Remote Sens. Environ. 2012, 122, 11–21. [Google Scholar] [CrossRef]
- Zhu, Z.; Wang, S.; Woodcock, C.E. Improvement and Expansion of the Fmask Algorithm: Cloud, Cloud Shadow, and Snow Detection for Landsats 4–7, 8, and Sentinel 2 Images. Remote Sens. Environ. 2015, 159, 269–277. [Google Scholar] [CrossRef]
- Roy, D.P.; Wulder, M.A.; Loveland, T.R.; Woodcock, C.E.; Allen, R.G.; Anderson, M.C.; Helder, D.; Irons, J.R.; Johnson, D.M.; Kennedy, R.; et al. Landsat-8: Science and Product Vision for Terrestrial Global Change Research. Remote Sens. Environ. 2014, 145, 154–172. [Google Scholar] [CrossRef]
- Li, W.; Pan, J.; Peng, W.; Li, Y.; Li, C. Garlic Crops’ Mapping and Change Analysis in the Erhai Lake Basin Based on Google Earth Engine. Agronomy 2024, 14, 755. [Google Scholar] [CrossRef]
- Yan, K.; Gao, S.; Yan, G.; Ma, X.; Chen, X.; Zhu, P.; Li, J.; Gao, S.; Gastellu-Etchegorry, J.-P.; Myneni, R.B.; et al. A Global Systematic Review of the Remote Sensing Vegetation Indices. Int. J. Appl. Earth Obs. Geoinf. 2025, 139, 104560. [Google Scholar] [CrossRef]
- Kobayashi, N.; Tani, H.; Wang, X.; Sonobe, R. Crop Classification Using Spectral Indices Derived from Sentinel-2A Imagery. J. Inf. Telecommun. 2020, 4, 67–90. [Google Scholar] [CrossRef]
- Sun, G.; Jiao, Z.; Zhang, A.; Li, F.; Fu, H.; Li, Z. Hyperspectral Image-Based Vegetation Index (HSVI): A New Vegetation Index for Urban Ecological research. Int. J. Appl. Earth Obs. Geoinf. 2021, 103, 102529. [Google Scholar] [CrossRef]
- Lu, T.; Wan, L.; Wang, L. Fine Crop Classification in High Resolution Remote Sensing Based on Deep Learning. Front. Environ. Sci. 2022, 10, 991173. [Google Scholar] [CrossRef]
- Ko, J.; Shin, T.; Kang, J.; Baek, J.; Sang, W.-G. Combining Machine Learning and Remote Sensing-Integrated Crop Modeling for Rice and Soybean Crop Simulation. Front. Plant Sci. 2024, 15, 1320969. [Google Scholar] [CrossRef]
- Pan, B.; Wang, L.; Xu, X.; Shi, Z. Towards Weakly Pareto Optimal: An Improved Multi-Objective Based Band Selection Method for Hyperspectral Imagery. In Proceedings of the IGARSS 2018—2018 IEEE International Geoscience and Remote Sensing Symposium, Valencia, Spain, 22–27 July 2018; pp. 4705–4708. [Google Scholar]
- Wang, W.; Lin, Z.; Zhang, L.; Yu, T.; Ciren, P.; Zhu, Y. Building Visual Green Index: A Measure of Visual Green Spaces for Urban Building. Urban For. Urban Green. 2019, 40, 335–343. [Google Scholar] [CrossRef]
- Cao, Y.; Li, G.L.; Luo, Y.K.; Pan, Q.; Zhang, S.Y. Monitoring of Sugar Beet Growth Indicators Using Wide-Dynamic-Range Vegetation Index (WDRVI) Derived from UAV Multispectral Images. Comput. Electron. Agric. 2020, 171, 105331. [Google Scholar] [CrossRef]
- Ewees, A.A.; Alshahrani, M.M.; Alharthi, A.M.; Gaheen, M.A. Optimizing Feature Selection and Remote Sensing Classification with an Enhanced Machine Learning Method. J. Supercomput. 2025, 81, 370. [Google Scholar] [CrossRef]
- Sarma, A.S.; Nidamanuri, R.R. Nature-Based Metaheuristic Optimisation Techniques for Band Selection in Drone-Based Hyperspectral Images for Plant-Level Crop Classification. Stoch. Environ. Res. Risk Assess. 2025, 39, 599–611. [Google Scholar] [CrossRef]
- Marino, S.; Alvino, A. Vegetation Indices Data Clustering for Dynamic Monitoring and Classification of Wheat Yield Crop Traits. Remote Sens. 2021, 13, 541. [Google Scholar] [CrossRef]
- Saini, R. Integrating Vegetation Indices and Spectral Features for Vegetation Mapping from Multispectral Satellite Imagery Using AdaBoost and Random Forest Machine Learning Classifiers. Geomat. Environ. Eng. 2023, 17, 57–74. [Google Scholar] [CrossRef]
- Shi, X.; Yang, H.; Chen, Y.; Liu, R.; Guo, T.; Yang, L.; Hu, Y. Research on Estimating Potato Fraction Vegetation Coverage (FVC) Based on the Vegetation Index Intersection Method. Agronomy 2024, 14, 1620. [Google Scholar] [CrossRef]
- Forkuor, G.; Dimobe, K.; Serme, I.; Tondoh, J.E. Landsat-8 vs. Sentinel-2: Examining the Added Value of Sentinel-2′s Red-Edge Bands to Land-Use and Land-Cover Mapping in Burkina Faso. GIScience Remote Sens. 2018, 55, 331–354. [Google Scholar] [CrossRef]
- Chaves, M.E.D.; Picoli, M.C.A.; Sanches, I.D. Recent Applications of Landsat 8/OLI and Sentinel-2/MSI for Land Use and Land Cover Mapping: A Systematic Review. Remote Sens. 2020, 12, 3062. [Google Scholar] [CrossRef]
- Wang, X.; Liu, J.; Peng, P.; Chen, Y.; He, S.; Yang, K. Automatic Crop Classification Based on Optimized Spectral and Textural Indexes Considering Spatial Heterogeneity. Remote Sens. 2023, 15, 5550. [Google Scholar] [CrossRef]
- Yang, R.; Qi, Y.; Zhang, H.; Wang, H.; Zhang, J.; Ma, X.; Zhang, J.; Ma, C. A Study on the Object-Based High-Resolution Remote Sensing Image Classification of Crop Planting Structures in the Loess Plateau of Eastern Gansu Province. Remote Sens. 2024, 16, 2479. [Google Scholar] [CrossRef]
- He, J.; Zeng, W.; Ao, C.; Xing, W.; Gaiser, T.; Srivastava, A.K. Cross-Regional Crop Classification Based on Sentinel-2. Agronomy 2024, 14, 1084. [Google Scholar] [CrossRef]
- Agilandeeswari, L.; Prabukumar, M.; Radhesyam, V.; Phaneendra, K.L.N.B.; Farhan, A. Crop Classification for Agricultural Applications in Hyperspectral Remote Sensing Images. Appl. Sci. 2022, 12, 1670. [Google Scholar] [CrossRef]
- Meerasha, B.; Sagayam, M. Cotton Crop Classification Using Optical and Microwave Remote Sensing Datasets in Google Earth Engine. Int. Arch. Photogramm. Remote Sens. Spat. Inf. Sci. 2025, XLVIII-G-2025, 1055–1062. [Google Scholar] [CrossRef]
- Rahmati, A.; Zoej, M.J.V.; Dehkordi, A.T. Early Identification of Crop Types Using Sentinel-2 Satellite Images and an Incremental Multi-Feature Ensemble Method (Case Study: Shahriar, Iran). Adv. Space Res. 2022, 70, 907–922. [Google Scholar] [CrossRef]
- Tufail, R.; Tassinari, P.; Torreggiani, D. Deep Learning Applications for Crop Mapping Using Multi-Temporal Sentinel-2 Data and Red-Edge Vegetation Indices: Integrating Convolutional and Recurrent Neural Networks. Remote Sens. 2025, 17, 3207. [Google Scholar] [CrossRef]


Disclaimer/Publisher’s Note: The statements, opinions and data contained in all publications are solely those of the individual author(s) and contributor(s) and not of MDPI and/or the editor(s). MDPI and/or the editor(s) disclaim responsibility for any injury to people or property resulting from any ideas, methods, instructions or products referred to in the content. |
© 2026 by the authors. Licensee MDPI, Basel, Switzerland. This article is an open access article distributed under the terms and conditions of the Creative Commons Attribution (CC BY) license.