Highlights
What are the main findings?
- GPP products in Southwest China exhibit broadly consistent large-scale spatial patterns, but show substantial differences in magnitude, temporal variability, and uncertainty across model categories and temporal scales.
- Machine-learning-based GPP products demonstrate higher stability and lower relative uncertainty than other products, while vegetation indices, topography, and radiation emerge as the dominant drivers of GPP uncertainty.
What are the implications of the main findings?
- Quantitative uncertainty assessment using three-cornered hat and explainable machine learning methods provides an effective framework for evaluating GPP products in regions with complex terrain and sparse flux towers.
- The results offer practical guidance for region-specific GPP product selection and highlight key pathways for reducing uncertainty in carbon sink assessment under heterogeneous environmental conditions.
Abstract
Gross primary production (GPP) is a key indicator to evaluating ecosystem carbon sinks. Southwest China is characterised by diverse ecosystems and abundant forest resources and represents one of the most important carbon reservoirs in China. Therefore, a quantitative assessment of the uncertainty of existing GPP products and their influencing factors is important. This study investigates GPP uncertainties and its influencing factors based on the three-cornered hat (TCH) and XGBoost and SHAP methods. Thirteen products were examined, including six products from the light use efficiency (LUE) model, two products from the process-based (Process) model, three products from the machine learning (ML) model and two products from satellite-based direct proxies (Proxies). The results reveal the following: (1) All products show similar spatial patterns, with Process products fluctuating notably in 2010, 2011, and 2014, while others remain stable. (2) Relative uncertainty is lowest annually, increasing monthly and daily; ML products exhibit greater stability. Among them, CEDAR has the least uncertainty and strongest agreement with flux observations (r = 0.82), whereas EC-LUE shows the highest uncertainty. (3) Vegetation index, elevation and radiation are more influential than other factors. These findings aid GPP product selection and uncertainty assessment in complex terrains with sparse ground data.
1. Introduction
Gross primary production (GPP) refers to the total amount of carbon assimilated by vegetation through photosynthesis per unit time and area and represents the largest carbon flux in terrestrial ecosystems [1,2]. As the entry point of ecosystem energy flow, GPP underpins food webs and supports essential ecosystem services, including food, fibre, and timber production [1]. It is also identified in the Sixth Assessment Report of the IPCC as a core indicator for monitoring progress toward the carbon peaking and carbon neutrality targets of the Paris Agreement. Consequently, accurate estimation and monitoring of GPP, together with a clear understanding of its spatiotemporal variability and controlling mechanisms, are fundamental for assessing regional carbon balance, ecosystem responses to climate change, and vegetation productivity, as well as for informing strategies to achieve the “dual-carbon” goals.
GPP estimation methods have evolved from site-based measurements to large-scale, remote-sensing-driven modelling approaches. Eddy covariance (EC) observations provide high-accuracy, point-scale measurements of carbon exchange and serve as critical benchmarks for model development and validation [3]. However, the limited number and uneven spatial distribution of flux towers constrain their applicability at regional and continental scales. To overcome this limitation, light use efficiency(LUE) models, typically based on the “APAR × ε” framework with environmental stress scalars, have been widely used for large-scale GPP estimation due to their relatively simple structure and computational efficiency [4,5]. More recently, process-based (Process) models such as PML and BESS have incorporated carbon–water coupling, soil moisture, nutrient dynamics, and vegetation physiological processes, improving the representation of underlying biophysical mechanisms [6,7]. These models, however, are often sensitive to input data quality and parameterisation and entail higher computational demands [8]. In parallel, machine learning (ML) models, exemplified by FLUXCOM, have demonstrated strong performance by integrating flux observations with multi-source remote-sensing data [9,10]. In addition, satellite-based direct proxies (Proxies), such as the SIF-based GOSIF product, provide a more direct indication of photosynthetic activity and enable high-resolution global GPP estimation [11,12]. Despite these advances, different modelling strategies exhibit substantial discrepancies, and uncertainties associated with model structure, input variables, and regional transferability remain a key challenge.
Southwest China is characterised by highly complex terrain, strong climatic gradients, and diverse ecosystem types and is widely recognised as a hotspot for climate change and ecological research [13,14,15,16]. The region contains extensive forest resources and constitutes one of the largest carbon reservoirs in China [17], while also serving as an important ecological security barrier at regional and national scales. Most existing remotely sensed GPP models were developed and calibrated under relatively flat terrain conditions; when applied to the mountainous landscapes and heterogeneous climate of Southwest China, their abilities to represent terrain-induced variations in radiation, microclimate, and coupled carbon–water processes are often limited [18,19]. Previous studies have reported pronounced discrepancies among GPP products in this region, particularly during years with droughts or extreme precipitation, when model responses diverge and uncertainty increases [20,21]. Furthermore, the scarcity and uneven distribution of flux tower sites, which are often concentrated in specific basins or elevation zones, restrict the effectiveness of conventional site-based validation approaches [22]. These factors highlight the need for robust methods to quantify GPP uncertainty beyond direct observation-based comparisons.
Against this background, this study focuses on Southwest China and conducts a comprehensive uncertainty assessment of GPP remote-sensing products. Using observations from five flux tower sites, we combine the three-cornered hat method (TCH) with Extreme Gradient Boosting (XGBoost) and Shapley Additive Explanations (SHAP) analyses to evaluate the uncertainties of 13 GPP products derived from four model categories: LUE, Process, ML, and Proxies. Compared with conventional site-based validation in complex terrain, this combination reduces reliance on sparse tower measurements: TCH quantifies product-specific uncertainties without requiring a spatially continuous truth, while XGBoost–SHAP links the TCH to reveal the dominant drivers and their potentially non-linear effects. The objectives are to quantify product uncertainty, identify its dominant influencing factors, and provide guidance for regionally appropriate GPP product selection and model optimisation. By improving the understanding of GPP uncertainty in complex terrain with limited ground observations, this study aims to support more reliable assessments of regional carbon sink capacity and inform carbon management and ecological conservation strategies in Southwest China.
2. Materials and Methods
2.1. Study Area
Southwest China is located between 21°08′–34°19′N and 97°21′–112°04′E and consists of five provinces: Sichuan, Chongqing, Guizhou, Yunnan, and Guangxi. The region covers approximately 1.37 million km2, accounting for about 14.3% of China’s total land area. As shown in Figure 1, the study area is characterised by highly complex topography, with elevation increasing from the lowlands of southern Guangxi to the high mountains and deep valleys of the Hengduan Range, resulting in a total relief exceeding 6500 m. The terrain comprises a composite landscape of mountains, plateaus, and basins. Karst landforms are widely distributed, making the region one of the most representative karst concentration zones worldwide. Land cover types are diverse and are dominated by forests, grasslands, and croplands, exhibiting pronounced vertical zonation and spatial heterogeneity. Owing to its extensive forest resources and ecological complexity, Southwest China plays an important strategic role in China’s regional development framework and constitutes a key ecological security barrier.
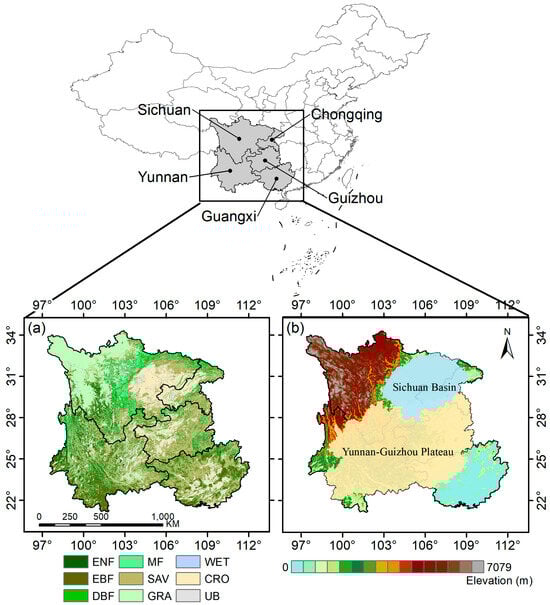
Figure 1.
Vegetation cover types (a) and elevation (b) in the study area. ENF: evergreen needleleaf forest; EBF: evergreen broadleaf forest; DBF: deciduous broadleaf forest; MF: mixed forest; SAV: savanna; GRA: grassland; WET: permanent wetland; CRO: cropland; UB: urban and built-up land.
2.2. Materials
2.2.1. GPP Remote-Sensing Products
At present, extensive research has been conducted, resulting in a variety of GPP remote-sensing products developed based on different principles. Building upon a systematic review of previous studies, this work selected 13 representative GPP products from four major categories: LUE, Process, ML, and Proxies. The temporal resolution, spatial resolution, temporal coverage, and corresponding references of each product are summarized in Table 1.

Table 1.
Spatiotemporal resolution and temporal coverage of the GPP products used in this study.
- (1)
- LUE Products
The LUE model is based on the principle of GPP, which is proportional to the canopy-absorbed photosynthetically active radiation (APAR). The model features a simple structure, strong interpretability, and relatively low data input requirements. However, its environmental stress functions require empirical parameterization, and it cannot fully capture the underlying energy processes.
- (a)
- The Moderate Resolution Imaging Spectroradiometer (MODIS) GPP product is derived based on the classical LUE framework. In this model, temperature and water stress are represented by the daily minimum temperature and the vapour pressure deficit (VPD), respectively [5,23]. In this study, we used the MOD17A2H V6.1 product, which is available from https://developers.google.com/earth-engine/datasets/catalog/MODIS_061_MOD17A2H (accessed on 12 February 2025). The estimation equation is given by:where is the fraction of photosynthetically active radiation absorbed by the canopy, is the photosynthetically active radiation, is the maximum light use efficiency, and are the temperature and water stress scalars, respectively, denotes the daily minimum temperature, and represents the vapour pressure deficit.
- (b)
- The Vegetation Photosynthesis Model (VPM) is developed based on the traditional LUE framework, with an emphasis on the regulation of actual light use efficiency by temperature, moisture, and phenology. The model employs the Land Surface Water Index (LSWI) to characterize water stress [24,25]. The dataset used in this study was obtained from https://data.casearth.cn/dataset/5c19a5660600cf2a3c557ad3?utm_source=chatgpt.com (accessed on 12 February 2025). The estimation equation is given by:where is the temperature scalar, and represent water and phenology stress functions, respectively, and denotes the land surface water index.
- (c)
- The Eddy Covariance Light Use Efficiency (EC-LUE) GPP is a flux-based approach that estimates GPP using eddy covariance tower observations. It assumes that light use efficiency is jointly constrained by temperature and water availability, with a focus on parameter optimization and generalization at the site scale [26,27]. The dataset used in this study was obtained from https://figshare.com/articles/dataset/Improved_estimate_of_global_gross_primary_production_for_reproducing_its_long-term_variation_1982-2017/8942336/3 (accessed on 12 February 2025). The estimation equation is given by:where denotes the minimum value between and , representing their combined limitation.
- (d)
- The Two-Leaf Light Use Efficiency (TL-LUE) model builds upon the MODIS GPP framework and assumes that the canopy consists of sunlit and shaded leaves. It separately models the photosynthetic activity of both components to enhance the estimation accuracy [28]. The data source is https://datadryad.org/dataset/doi:10.5061/dryad.dfn2z352k#methodsn (accessed on 12 February 2025). The estimation formula is expressed as:where and denote the light use efficiency of sunlit and shaded leaves, respectively, and and represent the absorbed photosynthetically active radiation by sunlit and shaded leaves, respectively.
- (e)
- The Global Land Surface Satellite (GLASS) GPP product is primarily based on the EC-LUE model and is driven by temperature, radiation, and vapour pressure deficit data derived from GLASS products [29]. The data source is https://www.geodata.cn/main/ (accessed on 12 February 2025).
- (f)
- The Multi-Source Data Synergized Quantitative (MuSyQ) GPP product builds upon the GLASS GPP dataset by incorporating the clear-sky index and vegetation functional types to analyse stress responses by integrating multi-source data [30]. The data source is https://www.geodata.cn/data/index.html?word=MuSyQ (accessed on 12 February 2025). The estimation formula is given as:where denotes the clear-sky index, and and represent the light use efficiency of sunlit and shaded leaves, respectively.
- (2)
- Process products
Process models are grounded in ecosystem and plant physiological theory. They simulate the coupling among multiple modules, including photosynthesis, stomatal conductance, carbon–water fluxes, water fluxes, and energy transfer, and directly compute GPP using physical and biochemical equations. Compared with LUE models, these models provide stronger physical and physiological interpretability.
- (a)
- Breathing Earth System Simulator (BESS) GPP product is driven by multiple modules and represents a coupled simulation system integrating atmospheric radiative transfer, canopy radiative transfer, photosynthesis, two-leaf canopy conductance and temperature, and evapotranspiration. GPP is directly derived from energy and mass flux processes within this framework [31]. Data source: https://www.environment.snu.ac.kr/bessv2 (accessed on 12 February 2025).
- (b)
- Penman–Monteith–Leuning (PML) GPP is based on the Penman–Monteith–Leuning framework, which applies stomatal conductance theory to couple transpiration and photosynthesis. By constraining GPP and evapotranspiration (ET) simultaneously, the model enhances estimation robustness. Data source: https://zenodo.org/records/10647618 (accessed on 12 February 2025).
- (3)
- ML products
ML models use GPP measured at ground-based flux towers as the target variable and employ multi-source remote-sensing features, climate variables, and related predictors as inputs. Statistical learning approaches, such as random forests, neural networks, and gradient boosting machines, are then used to construct predictive models.
- (a)
- FLUXCOM GPP uses flux-tower-derived GPP as the reference and is computed using multiple machine learning algorithms [32]. The database provides two global gridded products: one driven by MODIS remote-sensing (RS) data and another driven by a combination of remote-sensing and meteorological (RS + METEO) data. In this study, the RS product with a spatial resolution of 0.083° is used. Data source: http://fluxcom.org/ (accessed on 12 February 2025).
- (b)
- Upscaling Ecosystem Dynamics with ARtificial intelligence (CEDAR) is a ML upscaling model that explicitly accounts for the atmospheric CO2 fertilisation effect, enabling more accurate estimation of terrestrial ecosystem carbon sink capacity [33]. In this study, the ST_DT GPP product from CEDAR is used. Data source: https://zenodo.org/records/8212707 (accessed on 12 February 2025).
- (c)
- Ensemble Random Forest (ERF) GPP is an upscaled dataset constructed using an ensemble random forest framework. By integrating multiple models, this approach improves generalisation performance and robustness [34]. Data source: https://bg.copernicus.org/articles/21/4285/2024/ (accessed on 12 February 2025).
- (4)
- Proxies products
The proxies approach is based on the strong statistical correlation between certain satellite-derived indices and GPP, whereby these indices are mapped to GPP using linear or non-linear regression models. Proxy methods do not explicitly model photosynthetic processes; instead, they identify surrogate indicators that are statistically related to GPP. Owing to their simple data processing requirements, proxy approaches are well suited for rapid, preliminary GPP estimation or large-scale applications, although their interpretability is relatively limited.
- (a)
- Global OCO-2 Solar-Induced Fluorescence (GOSIF) GPP uses solar-induced chlorophyll fluorescence (SIF) as the core proxy and combines it with flux tower observations to estimate GPP [35]. Data source: https://globalecology.unh.edu/data/GOSIF-GPP.html (accessed on 12 February 2025).
- (b)
- Near-Infrared Reflectance of Vegetation (NIRv) GPP employs the near-infrared reflectance of vegetation index as a proxy for photosynthetic activity and estimates GPP using simple regression relationships [36]. Data source: https://figshare.com/articles/dataset/Long-term_1982-2018_global_gross_primary_production_dataset_based_on_NIRv/12981977/2 (accessed on 12 February 2025).
To ensure comparability among datasets, this study selected 2001–2015 as the common study period based on data availability, as detailed in Table 1. Given the differences in spatial resolution among the various products, all datasets were resampled to 0.05° to ensure spatiotemporal consistency and data comparability.
2.2.2. Ground-Based Flux Observation Data
To validate and evaluate the accuracy of remote-sensing GPP estimates, this study selected data from five existing flux tower sites in Southwest China for comparative analysis: the Xishuangbanna Tropical Seasonal Rainforest Flux Observation and Research Station (XSBN), the Ailao Mountain Subtropical Forest Ecosystem Research Station of the Chinese Academy of Sciences (ALS), the Puding Karst Ecosystem Observation and Research Station (PD), the Yuanjiang Dry–Hot Valley Ecological Station (YJ), and the Zoigê Alpine Meadow Ecosystem Field Scientific Observation and Research Station (RGE). Detailed information on these sites is provided in Table 2 [37,38,39,40,41]. This dataset is part of a national-level network in China that conducts long-term observations of carbon, water, and energy fluxes at the terrestrial ecosystem scale. Using the eddy covariance technique, the network monitors exchanges of matter and energy between representative ecosystems and the atmosphere, providing high-quality data support for studies of the carbon cycle and ecological processes. During data processing, invalid records with GPP values less than zero were excluded.
Table 2.
Information on the flux tower sites used in this study.
2.2.3. Ancillary Datasets
To investigate the influence of driving factors on the uncertainty of terrestrial GPP estimates, this study integrated several datasets, including MOD13A2 V6.1, MOD15A2 V6.1, MCD12C1 V6.1, TerraClimate climate data, and GMTED2010 topographic data. All datasets were accessed via the Google Earth Engine platform (https://code.earthengine.google.com/ (accessed on 12 February 2025)).
For vegetation-related variables, the MOD13A2 V6.1 product [42] was used, which provides the Normalized Difference Vegetation Index (NDVI) and the Enhanced Vegetation Index (EVI) at a temporal resolution of 16 days and a spatial resolution of 1 km. These indices are commonly used to characterise vegetation cover and photosynthetic activity. In addition, the MOD15A2 V6.1 product [43] was employed to obtain the Leaf Area Index (LAI) and the Fraction of Photosynthetically Active Radiation absorbed by vegetation (FPAR), with a temporal resolution of 8 days and a spatial resolution of 500 m, to represent vegetation photosynthetic capacity and energy absorption characteristics. To further distinguish different ecosystem types, land surface classification was performed using the MCD12C1 V6.1 land cover dataset [44].
Climate variables were derived from the TerraClimate dataset [45], which is developed by the University of California and hosted on the Google Earth Engine platform. This dataset has a monthly temporal resolution and a spatial resolution of approximately 1/24° (~4 km) and includes key meteorological variables such as minimum temperature (Tmin), maximum temperature (Tmax), precipitation (PR), vapour pressure (VAP), soil moisture (SM), and solar radiation (SRAD). These variables were used to analyse the influence of climate variability on GPP estimation results.
Topographic information was obtained from the GMTED2010 dataset [46], from which slope and aspect were derived for the study area to examine the role of topographic factors in GPP estimation uncertainty.
2.3. Methods
2.3.1. Correlation Analysis
Three statistical indicators were used to quantify model accuracy: the root mean square error (RMSE), the mean absolute error (MAE), and the Pearson correlation coefficient (r). These indicators characterize all aspects of the model’s performance and provide a comprehensive evaluation of the model. Their mathematical formulations are as follows:
where and denote the observed and simulated GPP at sample i, respectively; and are their corresponding means; and is the total number of samples.
2.3.2. Trend Analysis
In this study, Sen’s slope estimator was employed to analyse temporal trends in GPP. Sen’s slope is a non-parametric statistical method widely used for trend analysis in long-term time series. It is calculated as follows [47]:
where and denote the annual GPP values in years and , respectively, and median represents the median operator.
2.3.3. TCH Method
The TCH method is a statistical approach for estimating the uncertainty of multi-source datasets without requiring a true reference value. It evaluates errors by comparing the covariances among multiple independent datasets [12,22,48]. In this study, the uncertainties of 13 products were analysed on a pixel-by-pixel, time-series basis. For each pixel, N different GPP time series can be extracted, and the time series of each GPP product can be expressed as:
Since the true continuous gridded values were not available, one of the simulated sequences was chosen as the reference. Here, we use the multi-product mean as the reference . The choice of reference series has been reported to have little influence on TCH-derived uncertainty estimates. The differences between each remaining series and the reference product are given by:
All difference series are arranged into a matrix , and the covariance matrix of is calculated as . A design matrix is then introduced to establish the relationship between and the error covariance matrix :
where is the corresponding weighting matrix. For ease of comparison, the TCH-derived uncertainty is normalised by the mean of each time series to obtain the relative uncertainty (RU):
where denotes the diagonal elements of the matrix . is the ratio of TCH uncertainty to the product mean value, which can be used to compare more intuitively the uncertainties derived from the TCH method.
First, we assembled the time series of the 13 GPP products and calculated the reference GPP value. According to Equation (11), the difference matrix was then obtained, and its covariance matrix was computed. Next, Equation (12) was used to derive the diagonal matrix , representing the product-specific GPP error variances. Finally, the relative uncertainty was calculated using Equation (13). RU can be interpreted as the uncertainty level relative to the mean productivity, i.e., a smaller RU indicates lower uncertainty, whereas a larger RU indicates higher uncertainty relative to the mean.
2.3.4. Quantitative Analysis of GPP Uncertainty
We quantified the influencing factors on GPP uncertainty by modelling the statistical relationship between the TCH-derived RU and a suite of factors using XGBoost, followed by SHAP-based interpretation. XGBoost is a gradient-boosted decision-tree ensemble that can represent complex non-linear effects and interactions among predictors, and its regularisation helps improve generalisation performance [49]. In practice, RU and all drivers were compiled into a pixel-wise dataset, where each record represents one grid cell with co-located driver values and the corresponding RU.
We adopted a “one-product–one-model” strategy: for each of the 13 GPP products, we treated RU as the response variable and trained an independent XGBoost regression model using the same predictor set. To interpret the trained models, we used SHAP, a game-theoretic framework that decomposes each RU prediction into an additive sum of feature contributions [50]. For each product-specific model, SHAP values were computed for all drivers, providing pixel-level estimates of both the magnitude and direction of each driver’s contribution to RU. We interpreted the results primarily through SHAP distribution plots: the horizontal spread reflects the magnitude and variability of a driver’s influence on RU, the signs of SHAP values indicate whether the driver tends to increase or decrease RU, and the colour gradient represents the corresponding driver value. This distribution-based interpretation allowed us to identify the dominant contributors to RU and compare driver sensitivities and contribution directions among GPP products.
3. Results
3.1. Spatiotemporal Differences Among GPP Products
3.1.1. Spatial Differences Among GPP Products
Figure 2 shows the multi-year mean GPP (2001–2015) from 13 products. Despite differences in model principles, the products agree on a large-scale gradient, with lower GPP in the northwest and higher GPP in the south. Low GPP is concentrated in the high-elevation northwestern sector, whereas high GPP occurs mainly in the southern and southeastern areas. Most products show lower GPP in the Sichuan Basin than in surrounding mountains, but higher GPP than on the northwestern plateau. Central areas (southern Sichuan, northern Yunnan, and most of Guizhou) show intermediate GPP, forming a transition zone. Products differ markedly in absolute magnitude, spatial texture, and internal consistency. TL-LUE, GLASS, and ERF show higher GPP and larger high-value areas, whereas EC-LUE, MuSyQ, and BESS yield lower values over most regions (Figure 2). Differences among LUE products are most pronounced in and around the Sichuan Basin. The two proxy products diverge, with NIRv consistently lower than GOSIF. In spatial texture, ML products are internally consistent and relatively smooth, while Process products show similar large-scale patterns but differ locally. LUE products are more heterogeneous and patchier, particularly EC-LUE and GLASS, and NIRv shows distinct spatial patterns compared with the other 12 products.
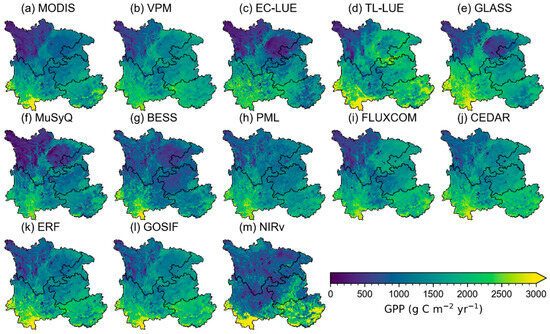
Figure 2.
Spatial distribution of the multi-year mean GPP values in Southwest China (2001–2015). LUE products include MODIS, VPM, EC-LUE, TL-LUE, GLASS, and MuSyQ; Process products include BESS and PML; ML products include FLUXCOM, CEDAR, and ERF; and Proxies products include GOSIF and NIRv.
3.1.2. Temporal Differences Among GPP Products
Figure 3 shows pixel-level GPP trends (2001–2015), and Figure 4 shows regional interannual variability. Most products indicate increasing GPP in the east and south, while changes in the northwest are generally weak. Regionally, all model categories show a gradual increase over 2001–2015. Trend direction and magnitude differ substantially among products: MODIS, VPM, TL-LUE, CEDAR, ERF, GOSIF, and NIRv show widespread increases (Figure 3a,b,d,j,k,l,m), whereas EC-LUE, GLASS, and MuSyQ show decreases in parts of the region (Figure 3c,e,f). FLUXCOM shows weak changes, whereas in the Sichuan Basin several products indicate increases but EC-LUE, GLASS, and MuSyQ show marked decreases. Similar inconsistencies occur in Guizhou and Guangxi, where EC-LUE, MuSyQ, and BESS indicate decreases unlike most other products. Process products show the largest interannual fluctuations (Figure 4b), whereas ML and proxy products vary less (Figure 4c,d); LUE products show intermediate variability, and MODIS and VPM capture a pronounced decline around 2010.
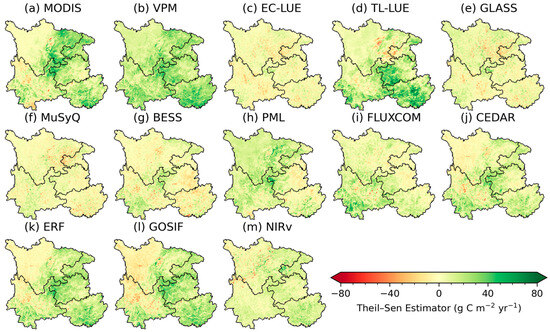
Figure 3.
Spatial trends of GPP derived from different products in Southwest China during 2001–2015. LUE products include MODIS, VPM, EC-LUE, TL-LUE, GLASS, and MuSyQ; Process products include BESS and PML; ML products include FLUXCOM, CEDAR, and ERF; and Proxies products include GOSIF and NIRv.
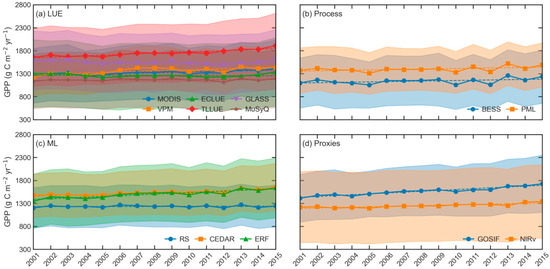
Figure 4.
Interannual variations of GPP derived from different products in Southwest China during 2001–2015. Shaded areas indicate the interquartile range of the data, reflecting the dispersion of GPP values across different years. Dashed lines denote the fitted overall interannual trend for each product.
3.2. Uncertainty Analysis of Different GPP Products
3.2.1. Comparison Based on Flux Tower Observations
Considering the availability of ground-based data, observations from five flux tower sites in Southwest China were used to compare the performance of the GPP products (Table 3). Overall, products derived from ML models exhibit the highest correlation with flux tower observations, with correlation coefficients (r) ranging from 0.73 to 0.82. Among them, CEDAR shows the strongest correlation (r = 0.82). The two Proxies products display notable differences. GOSIF shows a strong correlation with flux tower data (r = 0.80), with RMSE of 74.70 g C m−2 mon−1 and MAE of 59.85 g C m−2 mon−1. In contrast, NIRv exhibits a weaker correlation (r = 0.56), with a higher RMSE (84.04 g C m−2 mon−1) and MAE (69.06 g C m−2 mon−1). For the process models, PML and BESS show a large difference in correlation coefficients, with r values of 0.49 and 0.75, respectively. However, their RMSE and MAE values are relatively similar (RMSE = 77.04 and 75.05 g C m−2 mon−1 and MAE = 64.49 and 63.40 g C m−2 mon−1, respectively). Substantial variability in correlation with flux tower observations is also observed among products based on the LUE framework. TL-LUE exhibits the highest correlation with flux tower data (r = 0.80), with an RMSE of 78.59 g C m−2 mon−1 and an MAE of 68.54 g C m−2 mon−1. VPM, GLASS, and MODIS all show correlation coefficients of approximately 0.75, while MuSyQ has a moderate correlation (r = 0.67). In contrast, EC-LUE exhibits a much weaker correlation with flux tower observations (r = 0.29), despite RMSE and MAE values (81.80 and 65.78 g C m−2 mon−1, respectively) that are comparable to those of several other products.
Table 3.
Comparison between GPP products and flux tower observations.
3.2.2. Relative Uncertainty of GPP Products
We analysed the spatial distributions of relative uncertainty at annual, monthly, and daily scales ( Figure 5, Figure 6 and Figure 7), with regional summaries presented in Figure 8. Across all temporal scales, GPP uncertainty exhibits a consistent spatial pattern, with higher uncertainty in the north and lower uncertainty in the south. High-uncertainty regions are mainly located in western and northwestern Sichuan and the Sichuan Basin, whereas lower uncertainty is observed in Yunnan and Guangxi. Across model categories, LUE products generally show higher uncertainty, while Process and ML products exhibit lower values. Uncertainty decreases systematically from daily to monthly and annual scales.
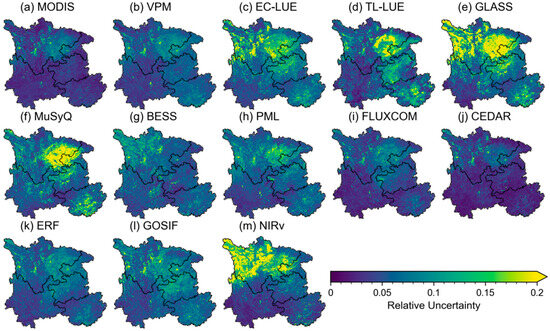
Figure 5.
Spatial distribution of relative uncertainty of GPP products at the annual scale in Southwest China (2001–2015). LUE products include MODIS, VPM, EC-LUE, TL-LUE, GLASS, and MuSyQ; Process products include BESS and PML; ML products include FLUXCOM, CEDAR, and ERF; and Proxies products include GOSIF and NIRv.
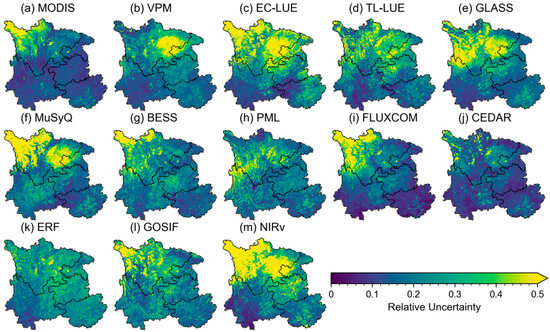
Figure 6.
Spatial distribution of relative uncertainty of GPP products at the monthly scale in Southwest China (2001–2015). LUE products include MODIS, VPM, EC-LUE, TL-LUE, GLASS, and MuSyQ; Process products include BESS and PML; ML products include FLUXCOM, CEDAR, and ERF; and Proxies products include GOSIF and NIRv.
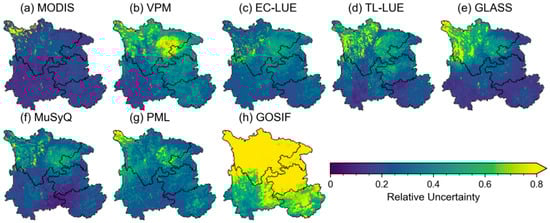
Figure 7.
Spatial distribution of relative uncertainty of GPP products at the daily scale in Southwest China (2001–2015). LUE products include MODIS, VPM, EC-LUE, TL-LUE, GLASS, and MuSyQ; Process products include BESS and PML; ML products include FLUXCOM, CEDAR, and ERF; and Proxies products include GOSIF and NIRv.
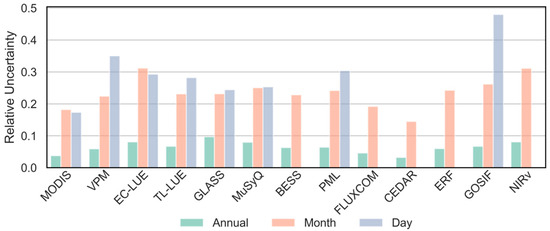
Figure 8.
Relative uncertainty of different GPP products across multiple temporal scales in Southwest China during 2001–2015. LUE products include MODIS, VPM, EC-LUE, TL-LUE, GLASS, and MuSyQ; Process products include BESS and PML; ML products include FLUXCOM, CEDAR, and ERF; and Proxies products include GOSIF and NIRv.
At the annual scale, LUE products—particularly EC-LUE, TL-LUE, GLASS, and MuSyQ—show markedly higher uncertainty, especially in western and northwestern Sichuan and the Sichuan Basin (Figure 5). NIRv exhibits relatively high uncertainty in northern parts of the study region. In contrast, uncertainty differences among Process and ML products are relatively small.
At the monthly scale, most products exhibit elevated uncertainty in northwestern areas, but VPM, PML, CEDAR, and ERF show comparatively lower uncertainty (Figure 6). ML products, especially CEDAR, maintain lower uncertainty overall. At the daily scale, GOSIF shows higher uncertainty than other products (Figure 7), and LUE products such as VPM, TL-LUE, and GLASS exhibit particularly high uncertainty in northwestern regions and the Sichuan Basin.
3.2.3. GPP Uncertainty Across Different Vegetation Types
To explore the factors influencing GPP uncertainty, we compared the relative uncertainty of four categories of products (LUE, Process, ML, and Proxies) across multiple vegetation types (Figure 9). Overall, all four product categories exhibit relatively high uncertainty over WETs, whereas uncertainty is generally lower over EBFs and ENFs. Grasslands (GRAs) show more variable uncertainty among products (Figure 9). In addition, differences among products are pronounced for the LUE and Proxies categories (Figure 9a,d), whereas the two Process products show relatively small differences (Figure 9b). ML products are the most stable across vegetation types, with relative uncertainty values mostly below 0.20 (Figure 9c).
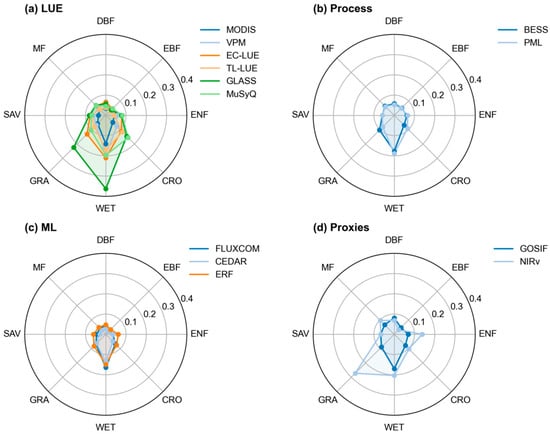
Figure 9.
Relative uncertainty of GPP across different vegetation types in Southwest China. ENF: evergreen needleleaf forest; EBF: evergreen broadleaf forest; DBF: deciduous broadleaf forest; MF: mixed forest; SAV: savanna; GRA: grassland; WET: permanent wetland; CRO: cropland; UB: urban and built-up land.
Despite differences in underlying principles, several common patterns are observed among products across vegetation types. For PML, EC-LUE, MuSyQ, VPM, and NIRv, relative uncertainty over WETs is approximately 0.2 (Figure 9a–d). In contrast, the three ML GPP products all exhibit relative uncertainty values below 0.2 across vegetation types (Figure 9c). Moreover, GLASS and NIRv show relative uncertainty values exceeding 0.2 over GRAs (Figure 9a,d), and GLASS exhibits particularly high uncertainty over WETs, reaching 0.3–0.4 (Figure 9a).
3.3. GPP Uncertainty Under the Influencing Factors
We investigated the effects of vegetation (EVI, NDVI, LAI, FPAR), energy (SRAD), water-related variables (PR, SM, VAP), climate factors (Tmin, Tmax), and topographic factors (DEM, SLOPE, ASPECT) on GPP uncertainty. The results indicate that EVI, NDVI, LAI, DEM, and SRAD contribute more substantially to GPP uncertainty than the other factors. However, the relative importance rankings of the driving factors and the distributions of SHAP values differ among products (Figure 10).
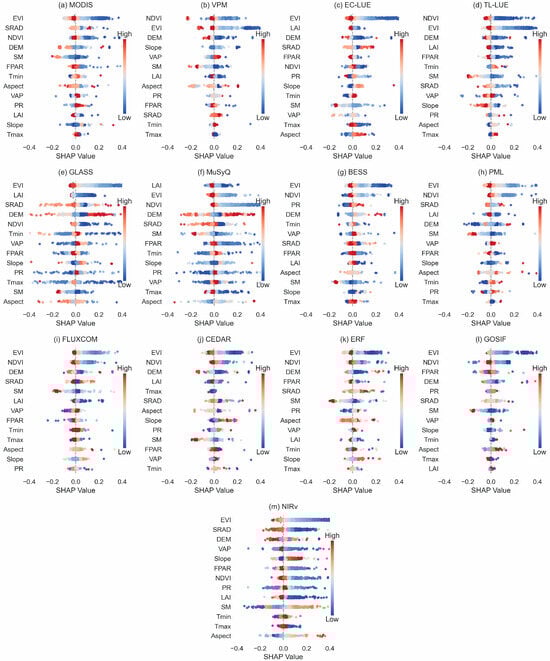
Figure 10.
Attribution analysis of the driving factors of relative GPP uncertainty based on SHAP values. Negative SHAP values indicate reduced uncertainty, where positive values indicate increased uncertainty. Driving factors are ranked from top to bottom according to their importance. Red indicates high values of the corresponding factor, and blue indicates low values.
In terms of factor importance rankings across products, vegetation variables (NDVI, EVI, and LAI) generally rank among the most influential factors for LUE products. Specifically, EVI and LAI rank first and second, respectively, for EC-LUE and GLASS (Figure 10c,e), whereas for MuSyQ (Figure 10f), LAI ranks first and EVI second. For VPM and TL-LUE (Figure 10b,d), the top-ranked factors are consistent and include NDVI, EVI, and DEM. MODIS and GLASS (Figure 10a,e) show a distinctive pattern in that energy-related variables (SRAD) appear among the top three factors. For Process models, BESS and PML (Figure 10g,h) exhibit broadly similar rankings, with EVI and NDVI among the most important factors, whereas topographic (Aspect) and climate (Tmax) variables generally rank lower. LAI ranks high in PML (Figure 10h) but relatively low in BESS (Figure 10g). For ML products, the three most influential factors are consistent across products (EVI, NDVI, and DEM). Topographic (Aspect) and water-related (PR) variables show moderate importance for CEDAR and ERF but have relatively minor influence on FLUXCOM (Figure 10i), where they rank near the bottom. For Proxies products, apart from EVI ranking first for both GOSIF and NIRv (Figure 10l,m), the importance rankings of the remaining factors differ substantially between the two products.
With respect to SHAP value distributions, for LUE products (TL-LUE, GLASS, and MuSyQ), the Process product (PML), and ML products (FLUXCOM, CEDAR, and ERF), higher NDVI values correspond to lower SHAP values, indicating that relative uncertainty decreases as NDVI increases. Across all GPP products from the four model categories, higher EVI values are consistently associated with lower SHAP values. For LAI and FPAR, relative uncertainty decreases with increasing LAI and FPAR for LUE products (MODIS, EC-LUE, and TL-LUE), whereas no clear relationship is observed for the other products. Higher values of the energy-related variable SRAD are associated with lower relative uncertainty for all LUE products, the Process product PML, the ML products FLUXCOM and CEDAR, and the Proxies product NIRv. As SM increases, relative uncertainty decreases for most products, with the exception of the Proxies NIRv product. In contrast, higher values of VAP correspond to higher relative uncertainty for the three ML products and the Proxies GOSIF product, whereas no clear relationship is observed between PR and SHAP values. In addition, for most products, DEM shows an overall negative relationship with relative uncertainty. Other climate variables (Tmin and Tmax) and topographic factors (SLOPE and ASPECT) contribute relatively little to the relative uncertainty of GPP products.
4. Discussion
4.1. Differences Among GPP Products
Overall, the spatial patterns of the 13 GPP remote-sensing products are similar (Figure 2), showing a “low in the northwest, high in the south” pattern: low values are concentrated in the high-altitude, alpine grasslands region in the northwest, while high values are concentrated in the forested areas of the south to southeast. Most products consistently indicate that GPP in the Sichuan Basin is lower than in the surrounding mountainous areas, but higher than on the northwestern plateau.
Despite this agreement in large-scale patterns, the products differ markedly in numerical magnitude, spatial texture, and internal consistency. (1) EC-LUE, MuSyQ, BESS, and NIRv are relatively low across most regions. EC-LUE may be affected by limited representativeness due to the scarcity of flux towers in the region; additionally, LAI biases under high canopy closure and complex terrain, as well as insufficient characterization of VPD stress in hot–dry environments, can lead to underestimation [51,52]. MuSyQ introduces a clear-sky index and may be biased low under the persistently high cloudiness in Southwest China [30]. BESS relies on many input parameters with differing spatial resolutions, so errors are more likely to accumulate under complex terrain and cloudy conditions [31,53]. NIRv is sensitive to the accuracy of the near-infrared band under cloudy conditions, which in turn affects GPP estimation. (2) Discrepancies among LUE products are most pronounced in the Sichuan Basin and surrounding areas: EC-LUE and GLASS are lower than MuSyQ, while the other three product types are generally higher. Persistent cloud cover can perturb key inputs such as PAR and temperature [53,54], and different LUE models handle radiation, moisture, and VPD stress differently. MOD17 prescribes the maximum LUE, Tmin and VPD thresholds using a biome parameter lookup table, such that GPP increases with rising APAR determined by FPAR and PAR. VPM constrains water stress using LSWI and LSWImax and is relatively insensitive to VPD. EC-LUE/GLASS adopt the minimum of temperature stress (Ts) and water stress (Ws) and dynamically incorporate CO2, direct and diffuse radiation, and VPD; stomatal limitation reduces LUE, offsetting the greening effect and thereby leading to a decline in GPP. On the other hand, PAR and other input parameters are crucial within the LUE framework. The radiation input data for EC-LUE, GLASS, and MuSyQ have lower accuracy compared to the other three products, with resolutions of 0.5°, 0.05°, and 0.25°, respectively [29,30,52,53,55]. (3) The two Proxies products differ substantially, with NIRv generally lower than GOSIF. NIRv is based on a near-infrared proxy and simplified regression, lacks explicit representation of environmental stress, and its accuracy is limited across the diverse vegetation types of Southwest China [56,57]. In contrast, GOSIF leverages the physiological coupling between SIF and GPP and can more effectively characterize productivity across different vegetation types [35].
In terms of spatial texture and consistency, ML products are generally smoother and show higher internal consistency, whereas LUE products more often appear patchy and exhibit poorer consistency. Process models are broadly consistent overall but show local discrepancies; the two proxy products also differ clearly in both texture and consistency. These differences are related to model structural principles and to scale mismatches among FPAR, LAI, vegetation type, and meteorological forcing data used by LUE products [32,58,59,60,61]. Moreover, although most products agree on the overall direction of interannual variation, they still differ in the magnitude of change and regional responses (Figure 3 and Figure 4).
Regarding temporal dynamics, most products indicate increasing GPP in the east and south, with no significant change in the northwest. Regionally averaged GPP shows a slow upward trend from 2001 to 2015, likely associated with ecological restoration and protection projects such as the Grain for Green Program, Natural Forest Protection, shelterbelt construction, grazing bans, and karst rocky desertification control [59,62]. However, differences among products remain prominent: (1) In parts of Guizhou and Guangxi, some products (e.g., EC-LUE, MuSyQ, and BESS) show declining trends that conflict with other products (Figure 3c,f,g). The karst landforms and frequent droughts in this region make vegetation highly sensitive to water availability [63,64], and differences in model sensitivity to water stress/evapotranspiration constraints may drive these trend divergences. (2) Process models exhibit the largest interannual variability, ML and Proxies products the weakest, and LUE products intermediate (Figure 4). This suggests that Process models respond more directly to climate anomalies in temperature, radiation, VPD, and soil moisture, whereas statistical/proxy products are more affected by algorithmic smoothing, observational noise, and saturation effects. LUE products fall between the two and can capture the regional-scale GPP decline around 2010 [52,57,63]. Accordingly, based on GPP dynamics, we can reasonably predict the probability of future extreme weather events. For different regions dominated by different extreme climate types, priority can be given to selecting GPP products (or product combinations) that respond more consistently to the relevant stress mechanisms and can more reliably represent interannual anomalies, thereby providing a more robust scientific basis for ecological conservation and adaptive management policymaking.
4.2. Drivers of Uncertainty in GPP Products
In this study, we compared 13 GPP products with observations from five flux sites in Southwest China and further quantified product uncertainties using the TCH method (Table 3; Figure 5, Figure 6, Figure 7 and Figure 8). Product agreement with flux data varied, with CEDAR showing the highest correlation (r = 0.82) and the lowest relative uncertainty. The TCH-based uncertainty ranking was consistent with the flux-site evaluation. Notable differences were evident among products: for Proxies products, GOSIF correlated well with flux data (r = 0.80), whereas NIRv showed substantially lower correlation (r = 0.56), reflecting their different underlying principles. For LUE products, correlations also differed markedly; TL-LUE performed best (r = 0.80), while EC-LUE was the weakest among all products (r = 0.29). This may be due to limited regional representativeness of the global flux-site training for EC-LUE, compounded by LAI-related biases under dense canopies and complex terrain and by its limited sensitivity to VPD stress under dry–hot conditions, which can propagate through the model to yield lower GPP estimates [51,65].
Meanwhile, different GPP products led to varying relative uncertainties across different time scales. The relative uncertainty of GPP was highest at the daily scale, followed by the monthly scale, and lowest at the annual scale (Figure 7). To further investigate the factors influencing uncertainty, we explored the critical role of vegetation (EVI, NDVI, LAI, FPAR), energy (SRAD), water (PR, SM, VAP), climate (Tmin, Tmax), and topographic factors (DEM, SLOPE, ASPECT) in accurately estimating GPP. This study employed the XGBoost algorithm and SHAP attribution method to explain the importance and influence mechanisms of each factor on the relative uncertainty of the 13 GPP products. Vegetation factors ranked relatively high in importance across the four models. Previous studies have shown that in GPP simulations in grassland regions of the Qinghai–Tibet Plateau, the relative uncertainty caused by model parameters and input data reached 18.30% [66]. The impact of vegetation status on GPP uncertainty is primarily manifested through photosynthesis. Overall, canopy structure, leaf physiology, and climate directly influence the vegetation photosynthesis process [67]. Regarding canopy structure, the LAI is used to characterize canopy light attenuation and other processes associated with changes in leaf amount, making it a key variable in models describing canopy structure [68,69]. It ranks high in factor importance; in LUE models (MODIS, EC-LUE, TL-LUE) products, relative uncertainty decreases with increasing LAI. MODIS and VPM models consider radiation conversion efficiency as a core feature [4], with the proportion of photosynthetically active radiation absorbed by the canopy described by LAI. PML, on the other hand, adopts a simplified framework to express canopy conductance, thereby characterizing stomatal response and assimilation processes, and regards LAI as a necessary element for carbon assimilation. However, the current PML model requires further research as it does not account for dynamic changes in LAI [70]. In terms of climate, frequent droughts occur in Southwest China, and GPP simulations in arid areas exhibit significant uncertainty, possibly due to ineffective constraints on soil moisture. When drought occurs, a decline in soil moisture leads to stomatal closure, resulting in a corresponding decrease in GPP [71,72]. Our research results indicate that, except for the satellite proxy model (NIRv) product, in most products, higher SM values are associated with lower relative uncertainty. The possible reason is that the NIRv model uses near-infrared spectral proxies to estimate GPP and lacks constraints related to soil moisture [22]. Regarding topographic factors, in most products, there is generally a negative correlation between DEM and the relative uncertainty of the products. The possible reason is that as DEM increases, vegetation types and canopy structures tend to become simpler and more stable, reducing the spatiotemporal variability of ecosystem functions and thereby decreasing the uncertainty in GPP estimation [73].
Furthermore, errors in model input datasets and scale mismatches between inputs and outputs may also affect the relative uncertainty of GPP products. Input datasets encompass site observation data, meteorological observations or reanalysis data, and remote-sensing data. The data collection process for site-related data is susceptible to systematic and random errors [74]. Errors in meteorological reanalysis data and remote-sensing data stem from spatial heterogeneity, sensor inconsistencies, and retrieval methods. Previous studies have also found that the uncertainty in GPP primarily originates from meteorological reanalysis data [9]. Errors in model input data may weaken the model’s ability to capture the correct relationship between GPP and driving factors, ultimately leading to high relative uncertainty in GPP.
4.3. Limitations and Outlook
Although this study conducted a comprehensive evaluation of 13 GPP products in Southwest China using site data and the TCH method, our research still has some limitations: (1) Limited observation sites. We utilized publicly available flux site data, but currently, only five flux sites are available, and these sites are sparsely distributed spatially. Moreover, the measurement results from flux sites can only represent the carbon flux within the footprint range of the flux towers [75], while the spatial resolution of GPP products ranges from 500 m to 5 km. There is a scale discrepancy between the observations from flux sites and remote-sensing products, which to some extent affects the evaluation results. (2) Sample size issue in TCH. For these 13 GPP products, the differences in their uncertainties and corresponding influencing factors mainly stem from errors in GPP algorithms or models, and partly from the uncertainties inherent in the evaluation method itself. The sample size is a potential source of uncertainty in the TCH method-for individual pixels in GPP products; the minimum sample size for a given time series may affect the stability of uncertainty results [76,77]. Therefore, this study incorporated sample size as an explanatory variable in the attribution analysis to calibrate the contributions of other explanatory variables in the analysis. (3) Preprocessing of GPP products and influencing factors. To implement the TCH method and attribution analysis, all GPP products and influencing factors were resampled to a spatial resolution of 0.05° by 0.05°. Despite efforts to select products with similar spatial resolutions, resampling still introduces uncertainties [30]. Additionally, the applicability of auxiliary data in Southwest China was adopted without prior evaluation, which may also introduce uncertainties into the research results.
Analysing the factors influencing uncertainty can help us better understand the applicability of various models and their improvement methods. Overall, the LUE models performed poorly in Southwest China. Our research results indicate that FPAR and water are important influencing factors for the uncertainty of the LUE models. Therefore, to enhance the applicability of the LUE models in estimating GPP in Southwest China, optimizing the input parameters for FPAR and water is crucial. Optimizing the data assimilation process and the simulation methods for water-related indicators are effective ways to reduce the uncertainties associated with FPAR and water data, thereby reducing the uncertainty in GPP simulations [78,79]. Process models typically estimate GPP products by coupling various physiological processes, and errors in individual parameters become key factors influencing the uncertainty of Process models [80]. Therefore, regional calibration of parameters in Southwest China can be conducted to obtain parameters suitable for this region, thereby reducing the uncertainty of GPP products. Regarding Proxies models, GOSIF uses SIF as the core proxy and combines it with flux tower data to estimate GPP, lacking the consideration of stress effects from climate and vegetation environmental variables. Future research should incorporate a wide range of climate and vegetation environmental studies to deepen the understanding of the spatial and temporal relationships between SIF and GPP, thereby reducing its uncertainty [81]. For NIRv, in addition to vegetation index-related variables, energy-related variables (such as Tmin and PAR) and water-related variables (such as soil moisture) have significant impacts on the uncertainty values of NIRv. Therefore, supplementing missing variables (such as soil moisture and radiation data) as input variables for its model in future research can effectively reduce the uncertainty values of the NIRv product [57]. Overall, a rigorous comparison of existing GPP models and an accurate quantification of uncertainties across different GPP products can provide foundational data for properly evaluating the effectiveness of ecological engineering initiatives in Southwest China and can also inform more accurate estimates of regional carbon budget potential. As an important component of the global land surface, complex mountainous regions (about 24% of the earth’s land surface) make it especially valuable to compare different GPP models and identify the sources of result uncertainty. This is of considerable scientific and practical significance for improving model accuracy across different scenarios and for robustly quantifying terrestrial ecosystem carbon budgets.
5. Conclusions
This study focuses on Southwest China and, based on observations from five flux tower sites in the region, combines the TCH method with XGBoost and SHAP analyses to evaluate the uncertainty of 13 GPP products derived from four categories of remotely sensed GPP estimation models (LUE, Process, ML, and Proxies). The main conclusions are as follows:
- (1)
- The spatial patterns of most GPP products are broadly consistent, exhibiting a distribution characterised by “lower values in the northwest and higher values in the south”. In terms of temporal trends, GPP derived from Process model shows pronounced fluctuations in specific years (2010, 2011, and 2014), whereas variations in the other model categories are relatively small.
- (2)
- The ranking of relative uncertainty across temporal scales is daily > monthly > annual. Products based on ML exhibit higher overall stability across model categories. Among the 13 products, CEDAR has the lowest relative uncertainty and shows a strong correlation with flux tower observations (r = 0.82), whereas EC-LUE has the highest relative uncertainty and the weakest correlation with flux tower data (r = 0.29).
- (3)
- Compared with other factors, EVI, NDVI, LAI, DEM, and SRAD contribute more substantially to GPP uncertainty, indicating that vegetation parameters, topography, and radiation in the complex mountainous terrain of Southwest China are key sources of uncertainty in GPP products.
Author Contributions
Conceptualization, Z.G.; methodology, Y.Q.; software, Y.Q.; validation, Y.Q., H.T.; formal analysis, Y.Q. and H.T.; resources, Z.G.; data curation, Y.Q.; writing—original draft preparation Y.Q. and H.T.; writing—review and editing, Z.G. and B.-H.T.; visualization, Y.Q.; supervision, B.-H.T.; project administration, Z.G.; and funding acquisition, Z.G. All authors have read and agreed to the published version of the manuscript.
Funding
This work was supported by the National Natural Science Foundation of China [Grant No. 42401465] and Yunnan Fundamental Research Projects [Grant Nos. 202501AT070343 and 202401AU070169].
Data Availability Statement
All data that support the findings of this study are included within the article.
Conflicts of Interest
The authors declare no conflicts of interest.
References
- Beer, C.; Reichstein, M.; Tomelleri, E.; Ciais, P.; Jung, M.; Carvalhais, N.; Rödenbeck, C.; Arain, M.A.; Baldocchi, D.; Bonan, G.B.; et al. Terrestrial gross carbon dioxide uptake: Global distribution and covariation with climate. Science 2010, 329, 834–838. [Google Scholar] [CrossRef]
- Zheng, Y.; Zhang, L.; Xiao, J.; Yuan, W.; Yan, M.; Li, T.; Zhang, Z. Sources of uncertainty in gross primary productivity simulated by light use efficiency models: Model structure, parameters, input data, and spatial resolution. Agric. For. Meteorol. 2018, 263, 242–257. [Google Scholar] [CrossRef]
- Baldocchi, D. How eddy covariance flux measurements have contributed to our understanding of global change biology. Glob. Change Biol. 2020, 26, 242–260. [Google Scholar] [CrossRef]
- Monteith, J.L. Solar radiation and productivity in tropical ecosystems. J. Appl. Ecol. 1972, 9, 747–766. [Google Scholar] [CrossRef]
- Running, S.W.; Nemani, R.R.; Heinsch, F.A.; Zhao, M.; Reeves, M.; Hashimoto, H. A continuous satellite-derived measure of global terrestrial net primary production. BioScience 2004, 54, 547–560. [Google Scholar] [CrossRef]
- Ryu, Y.; Baldocchi, D.D.; Kobayashi, H.; van Ingen, C.; Li, J.; Black, T.A.; Beringer, J.; van Gorsel, E.; Knohl, A.; Law, B.E.; et al. Integration of MODIS land and atmosphere products with a coupled-process model to estimate gross primary productivity and evapotranspiration from 1 km to global scales. Global Biogeochem. Cycles 2011, 25, GB4017. [Google Scholar] [CrossRef]
- Gan, R.; Zhang, Y.; Shi, H.; Yang, Y.; Eamus, D.; Cheng, L.; Chiew, F.; Yu, Q. Use of satellite leaf area index estimating evapotranspiration and gross assimilation for Australian Ecosystems. Ecohydrology 2018, 11, e1974. [Google Scholar] [CrossRef]
- Anav, A.; Friedlingstein, P.; Beer, C.; Ciais, P.; Harper, A.; Jones, C.; Murray-Tortarolo, G.; Papale, D.; Parazoo, N.C.; Peylin, P.; et al. Spatiotemporal patterns of terrestrial gross primary production: A review. Rev. Geophys. 2015, 53, 785–818. [Google Scholar] [CrossRef]
- Tramontana, G.; Ichii, K.; Camps-Valls, G.; Tomelleri, E.; Papale, D. Uncertainty analysis of gross primary production upscaling using Random Forests, remote sensing and eddy covariance data. Remote Sens. Environ. 2015, 168, 360–373. [Google Scholar] [CrossRef]
- Jung, M.; Reichstein, M.; Margolis, H.A.; Cescatti, A.; Richardson, A.D.; Arain, M.A.; Arneth, A.; Bernhofer, C.; Bonal, D.; Chen, J.; et al. Global patterns of land-atmosphere fluxes of carbon dioxide, latent heat, and sensible heat derived from eddy covariance, satellite, and meteorological observations. J. Geophys. Res. 2011, 116, G00J07. [Google Scholar] [CrossRef]
- Badgley, G.; Field, C.B.; Berry, J.A. Canopy near-infrared reflectance and terrestrial photosynthesis. Sci. Adv. 2017, 3, e1602244. [Google Scholar] [CrossRef] [PubMed]
- Li, X.; Xiao, J.; He, B. Chlorophyll fluorescence observed by OCO-2 is strongly related to gross primary productivity estimated from flux towers in temperate forests. Remote Sens. Environ. 2018, 204, 659–671. [Google Scholar] [CrossRef]
- Wang, Z.; Chen, W.; Piao, J.; Cai, Q.; Chen, S.; Xue, X.; Ma, T. Synergistic effects of high atmospheric and soil dryness on record-breaking decreases in vegetation productivity over southwest China in 2023. NPJ Clim. Atmos. Sci. 2025, 8, 6. [Google Scholar] [CrossRef]
- Qiu, J. China drought highlights future climate threats. Nature 2010, 465, 142–143. [Google Scholar] [CrossRef]
- Tong, X.; Brandt, M.; Yue, Y.; Horion, S.; Wang, K.; De Keersmaecker, W.; Tian, F.; Schurgers, G.; Xiao, X.; Luo, Y.; et al. Increased vegetation growth and carbon stock in China karst via ecological engineering. Nat. Sustain. 2018, 1, 44–50. [Google Scholar] [CrossRef]
- Wang, J.; Feng, L.; Palmer, P.I.; Liu, Y.; Fang, S.; Bösch, H.; O’Dell, C.W.; Tang, X.; Yang, D.; Liu, L.; et al. Large Chinese land carbon sink estimated from atmospheric carbon dioxide data. Nature 2020, 586, 720–723. [Google Scholar] [CrossRef]
- Peng, B.; Zhou, Z.; Cai, W.; Li, M.; Xu, L.; He, N. Maximum potential of vegetation carbon sink in Chinese forests. Sci. Total Environ. 2023, 905, 167325. [Google Scholar] [CrossRef] [PubMed]
- Xie, X.; Li, A.; Chen, J.M.; Guan, X.; Leng, J. Quantifying scaling effect on gross primary productivity estimation in the upscaling process of surface heterogeneity. J. Geophys. Res. Biogeosci. 2022, 127, e2021JG006775. [Google Scholar] [CrossRef]
- Coops, N.C.; Waring, R.H. The use of multiscale remote sensing imagery to derive regional estimates of forest growth capacity using 3-PGS. Remote Sens. Environ. 2001, 75, 324–334. [Google Scholar] [CrossRef]
- Zhao, M.; Running, S.W. Drought-induced reduction in global terrestrial net primary production from 2000 through 2009. Science 2010, 329, 940–943. [Google Scholar] [CrossRef] [PubMed]
- Chen, H.; Chen, H.; Huang, X.; Zhang, S.; He, T. Landscape ecological risk assessment and driving factor analysis in southwest China. Sci. Rep. 2024, 14, 23208. [Google Scholar] [CrossRef]
- Zhang, W.; Luo, G.; Hamdi, R.; Ma, X.; Li, Y.; Yuan, X.; Li, C.; Ling, Q.; Hellwich, O.; Termonia, P.; et al. Can gross primary productivity products be effectively evaluated in regions with few observation data? GIScience Remote Sens. 2023, 60, 2213489. [Google Scholar] [CrossRef]
- Zhao, M.; Heinsch, F.; Nemani, R.; Running, S. Improvements of the MODIS terrestrial gross and net primary production global data set. Remote Sens. Environ. 2005, 95, 164–176. [Google Scholar] [CrossRef]
- Xiao, X.; Hollinger, D.; Aber, J.; Goltz, M.; Davidson, E.A.; Zhang, Q.; Moore, B. Satellite-based modeling of gross primary production in an evergreen needleleaf forest. Remote Sens. Environ. 2004, 89, 519–534. [Google Scholar] [CrossRef]
- Xiao, X.; Zhang, Q.; Braswell, B.; Urbanski, S.; Boles, S.; Wofsy, S.; Berrien, M.; Ojima, D. Modeling gross primary production of temperate deciduous broadleaf forest using satellite images and climate data. Remote Sens. Environ. 2004, 91, 256–270. [Google Scholar] [CrossRef]
- Yuan, W.; Liu, S.; Zhou, G.; Zhou, G.; Tieszen, L.L.; Baldocchi, D.; Bernhofer, C.; Gholz, H.; Goldstein, A.H.; Goulden, M.L.; et al. Deriving a light use efficiency model from eddy covariance flux data for predicting daily gross primary production across biomes. Agric. For. Meteorol. 2007, 143, 189–207. [Google Scholar] [CrossRef]
- Yuan, W.; Zheng, Y.; Piao, S.; Ciais, P.; Lombardozzi, D.; Wang, Y.; Ryu, Y.; Chen, G.; Dong, W.; Hu, Z.; et al. Increased atmospheric vapor pressure deficit reduces global vegetation growth. Sci. Adv. 2019, 5, eaax1396. [Google Scholar] [CrossRef]
- He, M.; Ju, W.; Zhou, Y.; Chen, J.; He, H.; Wang, S.; Wang, H.; Guan, D.; Yan, J.; Li, Y.; et al. Development of a two-leaf light use efficiency model for improving the calculation of terrestrial gross primary productivity. Agric. For. Meteorol. 2013, 173, 28–39. [Google Scholar] [CrossRef]
- Liang, S.; Cheng, J.; Jia, K.; Jiang, B.; Liu, Q.; Xiao, Z.; Yao, Y.; Yuan, W.; Zhang, X.; Zhao, X.; et al. The global land surface satellite (GLASS) product suite. Bull. Am. Meteorol. Soc. 2021, 102, E323–E337. [Google Scholar] [CrossRef]
- Wang, J.; Sun, R.; Zhang, H.; Xiao, Z.; Zhu, A.; Wang, M.; Yu, T.; Xiang, K. New global MuSyQ GPP/NPP remote sensing products from 1981 to 2018. IEEE J. Sel. Top. Appl. Earth Obs. Remote Sens. 2021, 14, 5596–5612. [Google Scholar] [CrossRef]
- Li, B.; Ryu, Y.; Jiang, C.; Dechant, B.; Liu, J.; Yan, Y.; Li, X. BESSv2.0: A satellite-based and coupled-process model for quantifying long-term global land–atmosphere fluxes. Remote Sens. Environ. 2023, 295, 113696. [Google Scholar] [CrossRef]
- Jung, M.; Koirala, S.; Weber, U.; Ichii, K.; Gans, F.; Camps-Valls, G.; Papale, D.; Schwalm, C.; Tramontana, G.; Reichstein, M. The FLUXCOM ensemble of global land–atmosphere energy fluxes. Sci. Data 2019, 6, 74. [Google Scholar] [CrossRef]
- Kang, Y.; Bassiouni, M.; Gaber, M.; Lu, X.; Keenan, T.F. CEDAR-GPP: A spatiotemporally upscaled dataset of gross primary productivity incorporating CO2 fertilization. Earth Syst. Sci. Data 2025, 17, 3009–3046. [Google Scholar] [CrossRef]
- Chen, X.; Chen, T.; Li, X.; Chai, Y.; Zhou, S.; Guo, R.; Dai, J. A 2001–2022 global gross primary productivity dataset using an ensemble model based on the random forest method. Biogeosciences 2024, 21, 4285–4300. [Google Scholar] [CrossRef]
- Li, X.; Xiao, J. A global, 0.05-degree product of solar-induced chlorophyll fluorescence derived from OCO-2, MODIS, and reanalysis data. Remote Sens. 2019, 11, 517. [Google Scholar] [CrossRef]
- Yuan, W.; Liu, S.; Yu, G.; Bonnefond, J.-M.; Chen, J.; Davis, K.; Desai, A.R.; Goldstein, A.H.; Gianelle, D.; Rossi, F.; et al. Global estimates of evapotranspiration and gross primary production based on MODIS and global meteorology data. Remote Sens. Environ. 2010, 114, 1416–1431. [Google Scholar] [CrossRef]
- Chen, W.; Wang, S.; Niu, S. A dataset of carbon, water and heat fluxes of Zoige alpine meadow from 2015 to 2020. China Sci. Data 2023, 8, 1–8. [Google Scholar] [CrossRef]
- Qi, D.; Yang, D.; Song, Q.; Liu, Y.; Zhang, Y.; Fei, X.; Sha, L.; Zhou, W.; Chen, A.; Wen, G.; et al. An observation dataset of carbon and water fluxes at Yuanjiang dry-hot valley ecological station (2013–2015). China Sci. Data 2021, 6. [Google Scholar] [CrossRef]
- Qi, D.; Fei, X.; Song, Q.; Zhang, Y.; Sha, L.; Liu, Y.; Zhou, W.; Lu, Z.; Fan, Z. A dataset of carbon and water fluxes observation in subtropical evergreen broad-leaved forest in Ailao Shan from 2009 to 2013. China Sci. Data 2021, 6. [Google Scholar] [CrossRef]
- Qi, D.; Zhang, Y.; Song, Q.; Fei, X.; Sha, L.; Liu, Y.; Zhou, W.; Zhou, L.; Deng, X.; Luo, Y.; et al. A dataset of carbon, water and energy fluxes observed in Xishuangbanna tropical seasonal rain forest from 2003 to 2010. China Sci. Data 2021, 6. [Google Scholar] [CrossRef]
- Wang, Y.; Luo, W.; Chen, J.; Cai, X.; Zhang, L.; Cheng, A.; Wang, S. A dataset of carbon and water fluxes in the sample plots of natural regeneration at Puding station of Guizhou Province (2015–2019). China Sci. Data 2023, 8. [Google Scholar] [CrossRef]
- Didan, K. MOD13A2 MODIS/Terra vegetation indices 16-day L3 global 1 km SIN grid (Version 006). NASA Eosdis 2015. [Google Scholar] [CrossRef]
- Myneni, R.; Knyazikhin, Y.; Park, T. MODIS/Terra leaf area index/FPAR 8-day L4 global 500 m SIN grid (Version 061). NASA Eosdis 2021. [Google Scholar] [CrossRef]
- Friedl, M.; Sulla-Menashe, D. MODIS/Terra+Aqua land cover type yearly L3 global 0.05° CMG (Version 061). NASA Eosdis 2022. [Google Scholar] [CrossRef]
- Abatzoglou, J.T.; Dobrowski, S.Z.; Parks, S.A.; Hegewisch, K.C. TerraClimate, a high-resolution global dataset of monthly climate and climatic water balance from 1958–2015. Sci. Data 2018, 5, 170191. [Google Scholar] [CrossRef]
- Carabajal, C.C.; Harding, D.J.; Boy, J.-P.; Danielson, J.J.; Gesch, D.B.; Suchdeo, V.P. Evaluation of the Global Multi-Resolution Terrain Elevation Data 2010 (GMTED2010) using ICESat geodetic control. Proc. SPIE 2011, 8286, 82861Y. [Google Scholar]
- Lu, M.; Sun, H.; Yang, Y.; Xue, J.; Ling, H.; Zhang, H.; Zhang, W. Assessing recovery time of ecosystems in China: Insights into flash drought impacts on gross primary productivity. Hydrol. Earth Syst. Sci. 2025, 29, 613–625. [Google Scholar] [CrossRef]
- Premoli, A.; Tavella, P. A revisited three-cornered hat method for estimating frequency standard instability. IEEE Trans. Instrum. Meas. 1993, 42, 7–13. [Google Scholar] [CrossRef]
- Grekousis, G. Geographical-XGBoost: A new ensemble model for spatially local regression based on gradient-boosted trees. J. Geogr. Syst. 2025, 27, 169–195. [Google Scholar] [CrossRef]
- Zhao, Y.; Wang, L.; Jiang, Q.; Wang, Z. Sensitivity of gross primary production to precipitation and the driving factors in China’s agricultural ecosystems. Sci. Total Environ. 2024, 948, 174938. [Google Scholar] [CrossRef]
- Fang, H.; Baret, F.; Plummer, S.; Schaepman-Strub, G. An overview of global leaf area index (LAI): Methods, products, validation, and applications. Rev. Geophys. 2019, 57, 739–799. [Google Scholar] [CrossRef]
- Zheng, Y.; Shen, R.; Wang, Y.; Li, X.; Liu, S.; Liang, S.; Chen, J.M.; Ju, W.; Zhang, L.; Yuan, W. Improved estimate of global gross primary production for reproducing its long-term variation, 1982–2017. Earth Syst. Sci. Data 2020, 12, 2725–2746. [Google Scholar] [CrossRef]
- Tong, L.; He, T.; Ma, Y.; Zhang, X. Evaluation and intercomparison of multiple satellite-derived and reanalysis downward shortwave radiation products in China. Int. J. Digit. Earth 2023, 16, 1853–1884. [Google Scholar] [CrossRef]
- Lu, H.; Xie, M.; Zhuang, B.; Ma, D.; Liu, B.; Zhan, Y.; Wang, T.; Li, S.; Li, M.; Zhu, K. Impacts of atmospheric circulation patterns and cloud inhibition on aerosol radiative effect and boundary layer structure during winter air pollution in Sichuan Basin, China. Atmos. Chem. Phys. 2024, 24, 8963–8982. [Google Scholar] [CrossRef]
- Wang, M.; Sun, R.; Zhu, A.; Xiao, Z. Evaluation and comparison of light use efficiency and gross primary productivity using three different approaches. Remote Sens. 2020, 12, 1003. [Google Scholar] [CrossRef]
- Jin, J.; Hou, W.; Wang, L.; Wang, S.; Wang, Y.; Zhu, Q.; Fang, X.; Ren, L. Non-ignorable differences in NIRv-based estimations of gross primary productivity considering land cover change and discrepancies in multisource products. Remote Sens. 2023, 15, 4693. [Google Scholar] [CrossRef]
- Badgley, G.; Anderegg, L.D.L.; Berry, J.A.; Field, C.B. Terrestrial gross primary production: Using NIRv to scale from site to globe. Glob. Change Biol. 2019, 25, 3731–3740. [Google Scholar] [CrossRef] [PubMed]
- Jung, M.; Schwalm, C.; Migliavacca, M.; Walther, S.; Camps-Valls, G.; Koirala, S.; Anthoni, P.; Besnard, S.; Bodesheim, P.; Carvalhais, N.; et al. Scaling carbon fluxes from eddy covariance sites to globe: Synthesis and evaluation of the FLUXCOM approach. Biogeosciences 2020, 17, 1343–1365. [Google Scholar] [CrossRef]
- Xu, X.; Jiao, F.; Lin, D.; Liu, J.; Zhang, K.; Yang, R.; Lin, N.; Zou, C. Carbon Sink Trends in the Karst Regions of Southwest China: Impacts of Ecological Restoration and Climate Change. Land 2023, 12, 1906. [Google Scholar] [CrossRef]
- Yu, T.; Sun, R.; Xiao, Z.; Zhang, Q.; Liu, G.; Cui, T.; Wang, J. Estimation of global vegetation productivity from global land surface satellite data. Remote Sens. 2018, 10, 327. [Google Scholar] [CrossRef]
- Liu, L.; Gao, X.; Cao, B.; Ba, Y.; Chen, J.; Cheng, X.; Zhou, Y.; Huang, H.; Zhang, J. Comparing different light use efficiency models to estimate the gross primary productivity of a cork oak plantation in northern China. Remote Sens. 2022, 14, 5905. [Google Scholar] [CrossRef]
- Zhang, X.; Yue, Y.; Tong, X.; Wang, K.; Qi, X.; Deng, C.; Brandt, M. Eco-engineering controls vegetation trends in southwest China karst. Sci. Total Environ. 2021, 770, 145160. [Google Scholar] [CrossRef]
- Wang, Y.; She, X.; Zhu, C.; Chen, J.; Kong, D.; Shi, W.; Guan, X.; Xie, Q.; Gao, X.; Li, W.; et al. Unveiling the accuracy of global GPP products in data-scarce mountain ecosystems of southwest China. Int. J. Appl. Earth Obs. Geoinf. 2025, 144, 104908. [Google Scholar] [CrossRef]
- Yuan, W.; Tian, J.; Wang, M.; Wang, S.; Xu, W.; Wang, Y.; Fu, Z.; Girardin, M.P.; Green, J.K.; Zhou, S.; et al. Impacts of rising atmospheric dryness on terrestrial ecosystem carbon cycle. Nat. Rev. Earth Environ. 2025, 6, 712–727. [Google Scholar] [CrossRef]
- Zheng, H.; Lin, H.; Zhu, X.; Jin, Z.; Bao, H. Divergent spatial responses of plant and ecosystem water-use efficiency to climate and vegetation gradients in the Chinese Loess Plateau. Glob. Planet. Change 2019, 181, 102995. [Google Scholar] [CrossRef]
- He, H.; Liu, M.; Xiao, X.; Ren, X.; Zhang, L.; Sun, X.; Yang, Y.; Li, Y.; Zhao, L.; Shi, P.; et al. Large-scale estimation and uncertainty analysis of gross primary production in Tibetan alpine grasslands. J. Geophys. Res. Biogeosci. 2014, 119, 466–486. [Google Scholar] [CrossRef]
- Li, Y.; Zhang, Y.; Lv, J. Interannual variations in GPP in forest ecosystems in southwest China and regional differences in the climatic contributions. Ecol. Inform. 2022, 69, 101591. [Google Scholar] [CrossRef]
- Liu, Y.; Xiao, J.; Ju, W.; Zhu, G.; Wu, X.; Fan, W.; Li, D.; Zhou, Y. Satellite-derived LAI products exhibit large discrepancies and can lead to substantial uncertainty in simulated carbon and water fluxes. Remote Sens. Environ. 2018, 206, 174–188. [Google Scholar] [CrossRef]
- Piao, S.; Yin, G.; Tan, J.; Cheng, L.; Huang, M.; Li, Y.; Liu, R.; Mao, J.; Myneni, R.B.; Peng, S.; et al. Detection and attribution of vegetation greening trend in China over the last 30 years. Glob. Change Biol. 2015, 21, 1601–1609. [Google Scholar] [CrossRef] [PubMed]
- Zhang, Y.; Kong, D.; Gan, R.; Chiew, F.H.S.; McVicar, T.R.; Zhang, Q.; Yang, Y. Coupled estimation of 500 m and 8-day resolution global evapotranspiration and gross primary production in 2002–2017. Remote Sens. Environ. 2019, 222, 165–182. [Google Scholar] [CrossRef]
- Knauer, J.; Werner, C.; Zaehle, S. Evaluating stomatal models and their atmospheric drought response in a land surface scheme: A multibiome analysis. J. Geophys. Res. Biogeosci. 2015, 120, 1894–1911. [Google Scholar] [CrossRef]
- Wu, J.; Serbin, S.P.; Ely, K.S.; Wolfe, B.T.; Dickman, L.T.; Grossiord, C.; Michaletz, S.T.; Collins, A.D.; Detto, M.; McDowell, N.G.; et al. The response of stomatal conductance to seasonal drought in tropical forests. Glob. Change Biol. 2020, 26, 823–839. [Google Scholar] [CrossRef]
- Zheng, Y.; Zhao, W.; Chen, A.; Chen, Y.; Chen, J.; Zhu, Z. Vegetation canopy structure mediates the response of gross primary production to environmental drivers across multiple temporal scales. Sci. Total Environ. 2024, 917, 170439. [Google Scholar] [CrossRef] [PubMed]
- Fratini, G.; Sabbatini, S.; Ediger, K.; Riensche, B.; Burba, G.; Nicolini, G.; Vitale, D.; Papale, D. Eddy covariance flux errors due to random and systematic timing errors during data acquisition. Biogeosciences 2018, 15, 5473–5487. [Google Scholar] [CrossRef]
- Fang, J.; Chen, B.; Zhang, H.; Dilawar, A.; Guo, M.; Liu, S. Assessing spatial representativeness of global flux tower eddy-covariance measurements using data from FLUXNET2015. Sci. Data 2024, 11, 569. [Google Scholar] [CrossRef] [PubMed]
- Xu, T.; Guo, Z.; Xia, Y.; Ferreira, V.G.; Liu, S.; Wang, K.; Yao, Y.; Zhang, X.; Zhao, C. Evaluation of twelve evapotranspiration products from machine learning, remote sensing and land surface models over conterminous United States. J. Hydrol. 2019, 578, 124105. [Google Scholar] [CrossRef]
- Liu, J.; Fang, J.; Chai, L.; Dong, J.; Zheng, D.; Wigneron, J.-P.; Liu, S.; Zhou, J.; Xu, T.; Yang, S.; et al. Uncertainty analysis of eleven multisource soil moisture products in the Third Pole environment based on the three-cornered hat method. Remote Sens. Environ. 2021, 255, 112225. [Google Scholar] [CrossRef]
- Mercado, L.M.; Bellouin, N.; Sitch, S.; Boucher, O.; Huntingford, C.; Wild, M.; Cox, P.M. Impact of changes in diffuse radiation on the global land carbon sink. Nature 2009, 458, 1014–1017. [Google Scholar] [CrossRef]
- Cai, W.; Yuan, W.; Liang, S.; Zhang, X.; Dong, W.; Xia, J.; Fu, Y.; Chen, Y.; Liu, D.; Zhang, Q. Improved estimations of gross primary production using satellite-derived photosynthetically active radiation. J. Geophys. Res. Biogeosci. 2014, 119, 110–123. [Google Scholar] [CrossRef]
- Xing, X.; Wu, M.; Zhang, W.; Ju, W.; Tagesson, T.; He, W.; Wang, S.; Wang, J.; Hu, L.; Yuan, S.; et al. Modeling China’s terrestrial ecosystem gross primary productivity with the BEPS model: Parameter sensitivity analysis and model calibration. Agric. For. Meteorol. 2023, 343, 109789. [Google Scholar] [CrossRef]
- Chen, A.; Mao, J.; Ricciuto, D.; Lu, D.; Xiao, J.; Li, X.; Thornton, P.E.; Knapp, A.K. Seasonal changes in GPP/SIF ratios and their climatic determinants across the Northern Hemisphere. Glob. Change Biol. 2021, 27, 5186–5197. [Google Scholar] [CrossRef] [PubMed]


Disclaimer/Publisher’s Note: The statements, opinions and data contained in all publications are solely those of the individual author(s) and contributor(s) and not of MDPI and/or the editor(s). MDPI and/or the editor(s) disclaim responsibility for any injury to people or property resulting from any ideas, methods, instructions or products referred to in the content. |
© 2026 by the authors. Licensee MDPI, Basel, Switzerland. This article is an open access article distributed under the terms and conditions of the Creative Commons Attribution (CC BY) license.