Highlights
What are the main findings?
- Propose a Frequency-aware Modulation and Perturbation Network (FMP-Net) integrating adaptive wavelet attention and Frequency-Guided Perturbation, which selectively enhances ship high-frequency features while suppressing speckle noise and background interference.
- Achieve state-of-the-art performance on four benchmark datasets (LS-SSDD-v1.0, SSDD, SAR-Ship-Dataset, AIR-SARShip2.0) with a lightweight design (2.78M parameters), outperforming 18 existing methods, especially in complex nearshore and sea clutter scenes.
What are the implications of the main findings?
- Provides a lightweight, high-performance practical solution for SAR ship detection in complex sea areas like nearshore and sea clutter scenarios, which can improve the efficiency of practical tasks including maritime surveillance and maritime security.
- Verifies the effectiveness of the technical idea combining “frequency-domain modulation + perturbation” with attention mechanism in SAR image denoising and target feature enhancement, offering new technical references for subsequent algorithm design of SAR target detection.
- The proposed FMP-Net can be easily integrated into existing object detection frameworks with minimal computational cost, providing a versatile tool for enhancing SAR ship detection across various applications.
Abstract
Synthetic Aperture Radar (SAR) has unique advantages in ship monitoring at sea due to its all-weather imaging capability. However, its unique imaging mechanism presents two major challenges. First, speckle noise in the frequency domain reduces the contrast between the target and the background. Second, side-lobe scattering blurs the ship outline, especially in nearshore complex scenes, and strong scattering characteristics make it difficult to separate the target from the background. The above two challenges significantly limit the performance of tailored CNN-based detection models in optical images when applied directly to SAR images. To address these challenges, this paper proposes a modulation and perturbation mechanism in the frequency domain based on a lightweight CNN detector. Specifically, the wavelet transform is firstly used to extract high-frequency features in different directions, and feature expression is dynamically adjusted according to the global statistical information to realize the selective enhancement of the ship edge and detail information. In terms of frequency-domain perturbation, a perturbation mechanism guided by frequency-domain weight is introduced to effectively suppress background interference while maintaining key target characteristics, which improves the robustness of the model in complex scenes. Extensive experiments on four widely adopted benchmark datasets, namely LS-SSDD-v1.0, SSDD, SAR-Ship-Dataset, and AIR-SARShip-2.0, demonstrate that our FMP-Net significantly outperforms 18 existing state-of-the-art methods, especially in complex nearshore scenes and sea surface interference scenes.
1. Introduction
Synthetic Aperture Radar (SAR) is crucial for maritime ship detection, ocean observation, and maritime security because of its capability to provide images regardless of weather or time of day [1]. SAR is particularly beneficial for detecting maritime entities as it can penetrate challenging weather conditions like clouds, rain, and fog, allowing for continuous marine surveillance [2]. Nonetheless, SAR’s specialized imaging method presents various hurdles, complicating the ship detection process [3]. Firstly, speckle noise in SAR imagery poses a significant challenge. This noise originates from the coherent interference between radar and scattered waves on target surfaces [4], spreading widely across the frequency domain. The presence of speckle noise introduces random grainy textures in images, diminishing the contrast between targets and their backgrounds, thereby complicating detection [5]. As depicted in Figure 1a, background noise from waves, ocean currents, and sea surface clutter makes small targets more susceptible to noise disruption or being obfuscated by clutter. Secondly, scattering leakage from side lobes can render the ship’s external outlines incomplete and indistinct. As illustrated in Figure 1b,c, differentiation between target and background becomes more challenging in complex inshore environments due to intense side-lobe leakage and robust scattering from coastal and port infrastructures.
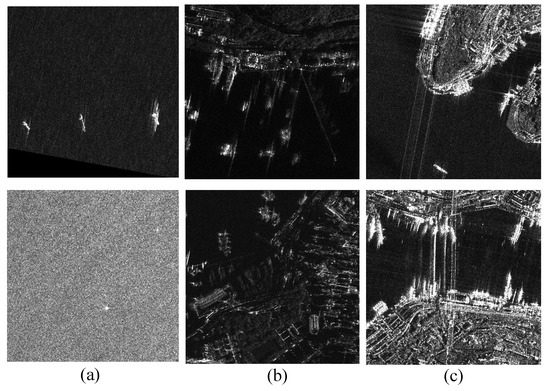
Figure 1.
Several typical SAR target detection challenges: (a) sea clutter interference, (b) strong side-lobe interference leading to shape and edge blur, (c) complex scenes near the shore.
Traditional ship detection methods in SAR imagery, such as the constant false alarm rate (CFAR) statistical approaches [6,7,8], frequently rely on predetermined thresholds based on a specific statistical model for the background noise. These methods function well in largely uniform backgrounds, but in more intricate maritime and coastal regions, noise and target distribution uncertainties make target–background differentiation problematic. Object detection models leveraging Convolutional Neural Networks (CNNs), such as the Faster R-CNN [9] and YOLO versions [10,11,12,13,14,15,16], can independently extract image features through comprehensive training and have been proven effective in object detection tasks. However, as illustrated in Figure 2, there is a significant discrepancy between the imaging qualities of SAR and optical images [3]. This disparity often results in difficulties when these models are applied, as they encounter issues with speckle noise and complex background interference, leading to reduced performance. These deep learning models, in particular, find it challenging to distinguish ship targets from other highly scattered objects in complex settings and have trouble adapting to variable backgrounds, especially near ports and coastlines, resulting in increased false positive rates.
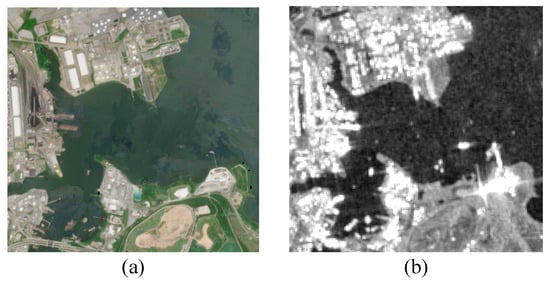
Figure 2.
Examples of optical and SAR images from the same view. (a) Visible image. (b) SAR image.
Incorporating frequency-domain information offers a powerful means of addressing these challenges. Within SAR imagery, ship targets’ edge and detailed features typically manifest as high-frequency components, whereas the background is primarily located in the lower-frequency range. Consequently, frequency-domain analysis can adeptly separate the target’s frequency elements from the background, thereby enhancing target detection accuracy. Nonetheless, speckle noise infiltrates not only the low-frequency regions but also disrupts the image details within the high-frequency zones. This noise reduces the contrast between targets and backgrounds, compounding the difficulty of object detection. The presence of high-frequency noise necessitates not just attention to the targets’ edges and details during high-frequency feature extraction but also requires effective discrimination between beneficial high-frequency data and noise. Although conventional frequency domain filtering techniques, such as high-pass filtering, succeed in isolating high-frequency components, they fail to differentiate between target characteristics and noise, potentially escalating high-frequency noise and impairing the efficacy of the detector.
This paper introduces a Frequency-aware Modulation and Perturbation Network (FMP-Net) aimed at improving SAR ship detection. As shown in Figure 3, the core of FMP-Net is the two successive Frequency-aware Modulation and Perturbation (FMP) stages, composed of two crucial components: the multiscale Frequency-aware Modulation and Perturbation (MS-FMP) module and the Adaptive Wavelet Frequency-aware Downsampling (AWFDown) module, whose detailed architectures are illustrated in Figure 4. Within the MS-FMP module, the input feature map initially undergoes a multiscale convolution process. Subsequently, these features flow into the Adaptive Frequency-aware Modulation and Perturbation (AFMP) module for further refinement. The AFMP module features two branches: one for capturing and adjusting high-frequency features, and the other for diminishing background interference. The first branch employs an Adaptive Wavelet Frequency-aware Attention (AWFA) module to detect high-frequency data across various directions. Concurrently, to prevent undue enhancement of high-frequency noise, a variance modulation strategy is employed, adjusting high-frequency features based on their variance to minimize false detections in complex backgrounds. The opposing branch houses the Frequency-Guided Perturbation (FGP) module, which perturbs feature maps within the same batch. Unlike random perturbation, this method uses frequency domain weights from the AWFA module to guide perturbation, maintaining essential details and textures while suppressing less critical features and improving the model noise resistance, as illustrated in Figure 5. To the best of our knowledge, this is the first time feature perturbation has been introduced into the field of SAR target detection. In the AWFDown module, the AWFA module is additionally integrated to preserve high-frequency edges and textures during downsampling, ensuring critical features remain intact while reducing resolution. The contributions of the paper can be summarized in three key aspects:
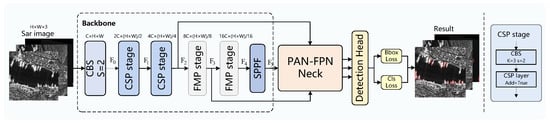
Figure 3.
The overall framework of our proposed FMP-Net.
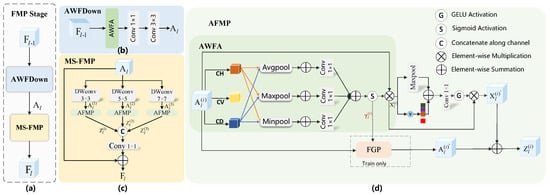
Figure 4.
Overall framework of our proposed Frequency-aware Modulation and Perturbation (FMP) stage. (a) The main architecture. (b) Adaptive Wavelet Frequency-aware Downsampling (AWFDown) module. (c) Mutiscale Frequency-aware Modulation and Perturbation (MS-FMP) module. (d) Adaptive Frequency-aware Modulation and Perturbation (AFMP) module.
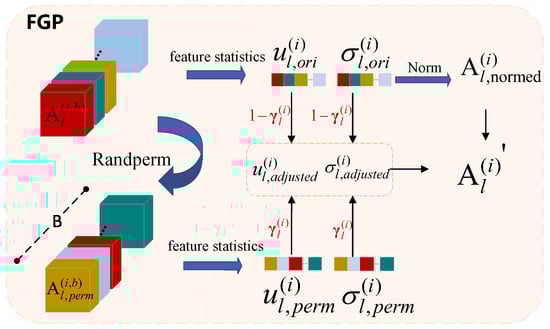
Figure 5.
The detailed architecture of our proposed Frequency-Guided Perturbation (FGP) module.
- We introduce an innovative Frequency-aware Modulation and Perturbation Network that effectively leverages the frequency domain characteristics of SAR images to thoroughly explore target features, thereby enhancing the precision and resilience of ship detection.
- Our developed Frequency-aware Modulation and Perturbation module employs a dual-branch structure to improve the model’s resistance to noise: the first branch is designed to modulate crucial frequency components through a tailored AWFA module, while the second branch perturbs the feature maps guided by frequency weights generated by AWFA.
- Our approach significantly surpasses baseline methods and attains state-of-the-art results across four SAR ship target detection benchmark datasets, namely LS-SSDD-v1.0, SSDD, SAR-Ship-Dataset, and AIR-SARShip-2.0. Moreover, the method can be easily integrated into existing object detection frameworks with minimal computational cost.
The remainder of this paper is organized as follows: Section 2 provides a summary of the related work discussed in this study. Section 3 details the components of the proposed approach. As discussed in Section 4, we performed comprehensive experiments on four widely adopted benchmark datasets to demonstrate the advantages of our method and evaluate the contributions of its individual components. Finally, Section 5 presents the conclusions of this study.
2. Related Work
2.1. SAR Ship Object Detection
Due to significant differences in feature distribution and noise characteristics between SAR images and optical images, the effect of the general target detection model applied directly to the SAR images is sub-optimal. To this end, researchers have improved these models to adapt to the characteristics of SAR images. For example, Fu et al. [17] proposed an anchor-free detection framework for multiscale SAR ship detection to eliminate the influence of anchors by directly learning the encoded bounding boxes. Yang et al. [18] introduced a coordinate attention module (CoAM) into the backbone for multiscale ship detection with complex backgrounds in massive SAR images. Hong et al. [19] improved YOLOv3 [10] according to the characteristics of the ships and introduced a Gaussian model to output the uncertainty of each predicted bounding box to improve detection accuracy. Hu et al. [20] proposed the Feature Interaction Network (FINet), which considers the interaction of different subtasks at different scales from the object level and the pixel level to improve the localization and classification ability in complex scenes. Zha et al. [21] proposed a network based on Salient Region Extraction (SRE) and Multi-branch Attention (MBA) to enhance the saliency of ships and improved the detection accuracy of small ships. Muhammad et al. [22] combined a CNN and non-linear regression to extract ship geometric features from SAR images and improved Mask R-CNN [23] and ViTDet [24] models to generate high-quality object masks for accurate localization. Shen et al. [25] used an anchor-free detector, decomposed large kernel convolutions to capture global information and long-range dependencies, adaptively selected convolution kernels based on target features, and improved multiscale feature representation. Muhammad et al. [26] proposed SwinYOLOv7 by combining YOLOv7 [27], a Feature Pyramid Network (FPN) [28], and the Swin Transformer to reduce the influence of background clutter. Besides intensity-based SAR detectors, polarimetric and decomposition-based methods have also been explored to exploit scattering information for ship-related analysis. Zhang et al. [29] proposed a PolSAR ship detection metric based on sub-look decomposition and H/A/ analysis to suppress sea clutter. Wang et al. [30] developed a PSO-based fine polarimetric decomposition with explicit physical meaning for ship scattering characterization. These physics-driven approaches typically rely on full-polarimetric measurements and explicit decomposition procedures. In contrast, our method targets conventional SAR intensity images and improves ship detection robustness within a lightweight CNN detector under speckle noise and complex backgrounds.
In addition, some recent works [31,32,33] have investigated the use of frequency domain information to enhance the feature enhancement of the SAR image target. In contrast, we propose a Frequency-aware Modulation and Perturbation strategy that not only selectively enhances high-frequency target features through adaptive modulation but also introduces Frequency-Guided Perturbation to suppress background interference, enabling more robust detection in complex SAR scenes.
2.2. SAR Target Detection Based on Frequency Domain
Considering the frequency characteristics of SAR images, some studies have begun to focus on the application of frequency domain features for SAR target detection. Li et al. [34] manually constructed the rotation-invariant frequency domain feature of the ship target with the polar Fourier transform to improve the detection of multiscale ships in complex SAR scenes. Qiao et al. [35] proposed Multi-frequency Aggregation (MFA), which uses Discrete Cosine Transform (DCT) to aggregate frequency information and suppresses background interference by selecting the optimal frequency response feature. Zhang et al. [31] introduced the frequency attention mechanism (FAM) to suppress the interference of sea clutter through the end-to-end adaptive processing of frequency-domain information from SAR images. Wang et al. [32] used the Haar wavelet transform to convert the original image into the frequency domain and obtained the spatial and frequency characteristics of the target ship to effectively separate the key features and useless noise of the SAR image. However, the above frequency-domain methods do not fully use high-frequency information. For SAR intensity imagery, high-frequency components simultaneously encode discriminative ship edges and textures as well as speckle- and background-induced interference, so indiscriminate high-frequency enhancement tends to amplify noise and reduce reliability. Therefore, simply amplifying the high-frequency information will cause the background noise to be amplified at the same time, thus reducing the detection accuracy and reliability. The variance modulation mechanism introduced in this paper adaptively adjusts the high-frequency features through global statistical information to achieve the goal of selectively enhancing high-frequency features and suppressing background noise. In summary, our FMP module differs from prior frequency-domain-based detectors in three aspects. First, we model directional high-frequency responses via wavelet-aware weighting, rather than using a single global frequency representation. Second, we introduce variance modulation to adaptively balance enhancement and suppression in the high-frequency branch, which avoids indiscriminate amplification of noisy responses. Third, beyond deterministic enhancement, we incorporate frequency-guided feature perturbation to improve robustness against speckle noise and complex background interference.
2.3. Feature Perturbation
In the realm of object detection, feature perturbation has been proven to effectively boost a model’s ability to generalize [36,37]. Modifying input features prevents the model from heavily depending on specific local traits, thereby enhancing its resilience across varying conditions [36,37,38,39,40,41,42,43,44]. For instance, Zhou et al. [42] introduced AMSP Vortex Convolution (AMSP-VCONV) to alter the noise pattern and strengthen feature extraction. Fan et al. [43] devised the Normalized Perturbation (NP) method to create diverse latent styles by modifying channel statistics of low-level source-domain features, enabling the model to recognize various latent domains. Zhou et al. [44] introduced Mixstyle, which in training combines feature statistics from two random samples in one pass to improve domain generalization performance. While feature perturbation based on spatial features has been effective in detecting targets in optical images, its usage in SAR image target detection remains limited. SAR images, often complicated by speckle noise and intricate backgrounds, face the challenge of noise interference, which may result in false detections and missed targets. This study presents a feature perturbation module founded on high-frequency information enhancement, which further augments the model’s adaptability in cluttered and noisy settings.
3. Approach
3.1. Overall Framework
The overall architecture of our proposed FMP-Net is depicted in Figure 3. It comprises three primary components: backbone, neck, and detection head. In this work, we adopted YOLOv8n as the baseline detection framework. Initially, SAR images, denoted as , are introduced as input data and processed by the backbone network. This backbone is made up of two CSP stages and two Frequency-aware Modulation and Perturbation (FMP) stages. The CSP stages handle the extraction of low-level features, whereas the FMP stages are responsible for capturing higher-level semantic features. Each FMP stage consists of an Adaptive Wavelet Frequency-aware Downsampling (AWFDown) module and a Multiscale Frequency-aware Modulation and Perturbation (MS-FMP) module, as illustrated in Figure 4. The AWFDown module maintains the image’s high-frequency information during downsampling via wavelet decomposition, ensuring that essential details are retained despite the reduction in the map’s size. The MS-FMP module generates multiscale features through the Adaptive Frequency-aware Modulation and Perturbation (AFMP) module, primarily comprising an Adaptive Wavelet Frequency-aware Attention (AWFA) module and a variance modulation module. The AWFA module captures edge and detail information of the image to ensure precise contour extraction of targets, whereas the variance modulation utilizes global statistical characteristics to dynamically adjust high-frequency features, preventing false detections in complex environments or with significant noise. Moreover, the Frequency-Guided Perturbation (FGP) module within the AFMP module aids in mitigating background interference on the target by introducing dynamic disturbances during training, thereby enhancing detection robustness. Subsequently, the SPPF [45] module further refines these features to bolster computational efficiency and eliminate redundant data. The PAN-FPN [46] structure is employed to merge multilevel features from the backbone, enabling the model to detect both detailed and global features effectively. Ultimately, the detection head utilizes features obtained by the neck to perform object classification and localization, providing the final detection results.
3.2. Frequency-Aware Modulation and Perturbation (FMP)
As shown in Figure 4a, the FMP stage consists of two main parts: the MS-FMP and AWFDown modules, which successively process the input features in order to retain high-frequency information while downsampling, selectively enhancing and perturbing high-frequency features. Given the input feature map , denotes the number of stages that are first downsampled by the AWFDown module to obtain the feature map . Then, is processed by the MS-FMP module, which further enhances and perturbs high-frequency features, resulting in the output feature map , i.e.,
Adaptive Wavelet Frequency-Aware Downsampling (AWFDown). Due to the possible loss of important information in detail during the sampling operation, we introduce AWFDown to effectively preserve high-frequency information during the downsampling process. As shown in Figure 4b, AWFDown consists of AWFA, , and :
where the AWFA module can enhance the edges and details in the feature map, so as to retain important detail information in the subsequent downsampling process. represents a convolutional layer with a kernel size of 1 × 1, and represents a convolutional layer with a kernel size of 3 × 3. In Section 3.3, we discuss the implementation of the AWFA module in detail.
Mutiscale Frequency-Aware Modulation and Perturbation (MS-FMP). As mentioned in Section 1, unlike general target detection, SAR target detection is susceptible to strong scattering and speckle noise, making it difficult to distinguish the target from the background. In order to solve the problem of the ambiguous boundary between the background and the object, as shown in Figure 4c, we introduce the MS-FMP module to capture multiscale texture features. Formally, the MS-FMP module within the l-th stage can be represented mathematically as
3.3. Adaptive Frequency-Aware Modulation and Perturbation (AFMP) Module
In SAR images, important information about the target, such as edge and texture, often appears in the form of high-frequency features, and background noise may also appear as high-frequency interference. Therefore, as shown in Figure 4d, we designed the AFMP module to achieve selective enhancement of high-frequency features and suppression of background noise.
Adaptive Wavelet Frequency-Aware Attention Module (AWFA). As shown in Figure 4d, the AWFA module first applies a one-level Haar wavelet transform to the input feature map , where denotes the i-th scale, to extract high-frequency information that is indicative of boundaries and structural details. Through Haar wavelet decomposition, we retain only the three directional high-frequency components: the horizontal detail component , the vertical detail component , and the diagonal detail component . The rationale for using , , and jointly is that ship boundaries, wakes, and corner-type scattering structures may appear at arbitrary orientations. Accordingly, different boundary segments can yield stronger responses in different directional components, and using only one component may miss edges with other orientations. By aggregating these three components, AWFA forms a more complete edge-enhancement representation, which facilitates target–background separation in both offshore scenes and nearshore scenarios with complex clutter. This behavior is illustrated in Figure 6, where the combined magnitude of LH+HL+HH highlights ship boundaries more clearly than any single directional component.
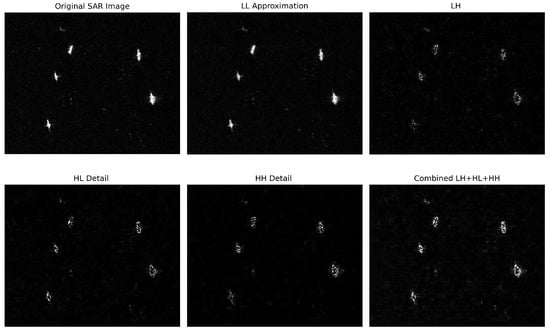
Figure 6.
Visualization of one-level 2D Haar DWT subbands on a representative SAR image. LL denotes the low-frequency approximation. LH, HL, and HH denote the directional high-frequency detail subbands.
These high-frequency components can be obtained through convolution with the following Haar filter kernels:
where , , and are used to extract high-frequency information in horizontal, vertical, and diagonal directions, respectively. In implementation, the Haar transform is realized by fixed Haar filter kernels with a stride of 2 applied over the entire feature map, and thus, the transform window is inherently for a one-level decomposition. This design does not introduce an additional patch-wise window-size hyper-parameter; instead, it performs dense local filtering across the whole feature map with minimal computational overhead. By applying these filters with a stride of 2, high-frequency components in the horizontal, vertical, and diagonal directions can be obtained from the input feature map ,
To capture frequency features at different scales, we apply multiscale pooling to the high-frequency components , , and . Specifically,
where , , and represent the average, maximum, and minimum pooling results, respectively. These operations smooth, emphasize, and suppress high-frequency features to enhance texture details, highlight structural edges, and reduce background noise. The pooled features are then fused by applying a convolution to each pooled output and summing the results, as follows:
where denotes the output of the AWFA module. The weight of the frequency domain , obtained through the sigmoid activation function , dynamically modulates the strength of the high-frequency features in different regions of the feature map. “⊗” represents element-wise broadcasted multiplication. This adaptive weighting mechanism enables the model to selectively enhance the high-frequency details in the target regions.
Variance modulation. In SAR images, high-frequency information not only includes target edges and details but also contains a significant amount of noise. Direct enhancement of all high-frequency features may lead to excessive amplification of noise. Variance modulation dynamically adjusts the expression of high-frequency information by combining the global statistical information of the feature map with local salient features.
Firstly, by calculating the variance of the feature map, we can quantify the global variation range of each channel of the feature map, which can reflect the strength of the high-frequency features in the image.
where represents the mean of the feature map . Next, to capture prominent local high-frequency features, we apply adaptive maxpooling to extract significant local details. We then combine the global variance with the locally pooled feature through a linear combination, weighted by learnable parameters and , to balance the influence of global and local high-frequency information. The combined features undergo a linear transformation with a learnable weight matrix and are then passed through a GELU activation function. The modulation process can be calculated as follows:
where “⊙” represents the Hadamard product. This formulation ensures an adaptive balance between local and global information, enhancing the representation of high-frequency details while suppressing noise.
Frequency-Guided Perturbation (FGP). The abundance of speckle noise in SAR images leads to random intensity variations caused by the coherence among small scatterers. This noise generates texture interference within the image, obscuring the boundary between the target and the background, making it easy to misinterpret background noise as significant features, thereby compromising the precision of target detection.
As shown in Figure 5, the FGP module standardizes the feature map and adjusts the feature mean and variance to a unified scale.
where , , and denote , meaning the results of the mean, standard deviation, and standardization, respectively. Assuming the size of the training batch is B, we randomly rearrange the features within the batch. Specifically, we firstly randomly shuffle the sample order within the batch to obtain a new permutation index perm:
Here, represents the permuted features with an average of and a standard deviation of , indicating the modified feature distribution. This random modification obscures background information, compelling the model to depend on global characteristics instead of local signals to identify the target. Subsequently, we employ weighted adjustment to merge the mean and standard deviation of the original with those of the permuted features, resulting in the adjusted mean and the adjusted standard deviation as demonstrated:
Here, signifies the perturbation coefficient, a parameter that dictates the level of disturbance applied. This coefficient is influenced by the weight in the frequency domain, denoted as , after which characteristic disturbances are adaptively adjusted. A large value of signifies that high-frequency information within the image is crucial and heavily weighted for the detection task. To prevent excessive alterations to these details, it is essential to diminish the perturbation coefficient. Conversely, if the detailed information presently has a minor role in the task, or if the background information is more intricate, enhancing the perturbation coefficient can help mitigate the impact of background noise. The resulting perturbation features are represented as follows:
It combines with and to ensure that the output feature map not only retains the necessary high-frequency details but also focuses more on global features when the background noise is complex. This dynamic adjustment mechanism enables the FGP module to deal with the dependence of the target on background information in different scenarios.
The final output of the AFMP module is
3.4. Loss Function
The final loss function is composed of a weighted binary cross-entropy loss , a weighted CIoU loss , and a distribution focal loss , where each component has a specific weight to ensure an appropriate influence on the total loss. The resultant loss function can be formulated as
4. Experiments
4.1. Dataset and Experimental Setup
(1) The LS-SSDD-v1.0 [47] is constructed from Sentinel-1 SAR data released by the European Space Agency. The dataset is composed of Sentinel-1 acquisitions in the interferometric wide swath imaging mode. It contains two polarization channels, VV and the VH, which are the default polarimetric combinations over maritime surveillance areas. Following the official setting, large-scene images are cut into 9000 sub-images of 800 × 800 pixels, where ships are usually small and thus challenging to detect. According to the official division, 6000 sub-images are used for training and 3000 for testing.
(2) SSDD [48] integrates SAR images collected from three sensors, namely RadarSat-2, TerraSAR-X, and Sentinel-1. It includes multiple polarization modes, namely HH, HV, VV, and VH. The dataset contains 1160 SAR images of 500 × 500 pixels with 2358 ship instances, and the spatial resolution spans from 1 m to 15 m. The official split uses 928 images for training and the remaining images for testing.
(3) SAR-Ship-Dataset [49] was built from Gaofen-3 and Sentinel-1 data and contains 43,819 ship chips of 256 × 256 pixels covering 59,535 ship instances. The dataset involves multiple SAR acquisition modes, including ultrafine strip-map, fine strip-map 1, fine strip-map 2, quad-polarization strip-map 1, S3 strip-map, and interferometric wide-swath. It provides samples with multiple spatial resolutions, including 3 m, 5 m, 8 m, 10 m, and 25 m, and it supports single-polarization, dual-polarization, and full-polarization settings. Since no official split has been released, we randomly split the dataset into training and testing sets at a ratio of 8 to 2 following common practice in comparative methods.
(4) AIR-SARShip-2.0 [50] was collected from Gaofen-3 high-resolution SAR imagery. According to the dataset description, Gaofen-3 data are acquired under strip-map imaging mode and spotlight imaging mode, and the dataset provides meter-level resolutions, including 1 m and 3 m, with single-polarization measurements. It contains 300 SAR images of 1000 × 3000 pixels covering various complex scenes, including ports, islands, reefs, and open sea surfaces. Since no official split standard is provided, the dataset was randomly divided into training and testing sets at a ratio of 8 to 2 following the settings in other methods, which is suitable for high-resolution SAR ship detection under complex backgrounds.
We performed experiments on four NVIDIA GeForce GTX3090 Gpus with 24 GB of memory with Pytorch-1.12.1 and python 3.9, with the batch size set to 96. The size of the training images was 640 for the LS-SSDD-v1.0, SSDD, and AIR-SARShip-2.0 datasets and 256 for the SAR-Ship-Dataset. We trained the model 300 times in total, and the Adam optimizer was used with an initial learning rate of 0.001, and the weight decay and momentum were set to and 0.9. To ensure a fair comparison, all comparative methods were trained and evaluated under the same protocol on each dataset, including the same data splits, input resolution, batch size, training epochs, and the same data augmentation pipeline (random flipping, random scaling, and mosaic augmentation).
4.2. Evaluation Metrics
In order to systematically evaluate the performance of the model in the ship detection tasks on SAR images, this study used the precision, recall and F1 score, along with the mean average precision (mAP), as primary evaluation metrics. mAP is widely used in object detection tasks, as it comprehensively measures the performance of a model in terms of precision and recall, reflecting the stability of the model across different detection thresholds. mAP calculates the average precision (AP) for each class by taking the area under the precision–recall curve. The metrics are defined as follows:
where TP denotes the number of correctly detected targets, FP represents regions that are incorrectly detected as targets, and FN represents the number of missed targets. AP is calculated as follows:
where n represents the number of sampling points on the recall curve used to calculate AP, and represents the precision of a recall of r. The mAP is defined as the average of the AP values in all categories, as follows:
where N denotes the total number of target categories, and represents the average precision for the k-th category. To comprehensively assess the detection performance of the model, AP is calculated under various IoU thresholds, including (IoU = 0.5), (IoU = 0.75), and , which is the mean AP across IoU thresholds from 0.5 to 0.95 with a step size of 0.05. In this study, since the detection target is limited to the category of the ship, the calculation of mAP simplifies to the AP value for this single class.
4.3. Comparison with State-of-the-Arts Methods
(1) Quantitative evaluation: Table 1, Table 2, Table 3 and Table 4 present the detailed comparison results of our proposed FMP-Net against 18 other state-of-the-art methods in multiple benchmark datasets. These methods include the following: one-stage object detection networks: Atss [51], CenterNet [52], Fcos [53], Gfl [54], Retinanet [55], YOLOv3n-tiny [10], YOLOv5n [11], YOLOv6n [12], YOLOv9t [13], YOLOv8n [14], YOLOv10n [15], and YOLOv11n [16]; two-stage object detection networks: Cascade-RCNN [56], Faster-RCNN [9], Grid-RCNN [57], and Libra-RRCNN [58]; and end-to-end networks: Dino [59] and RTDetr-ResNet50 [60]. It can be seen that our method significantly outperforms these comparison methods on all benchmark datasets and achieves higher detection performance. Among them, our proposed FMP-Net achieves the best or second-best performance in several evaluation metrics, demonstrating excellent advantages. In particular, our method maintains a lightweight architecture with only 2.78M parameters and 7.8G FLOPs, which are significantly lower metrics than those of most comparison methods.

Table 1.
Quantitative comparison of FMP-Net with 18 SOTA methods for SAR ship detection on the LS-SSDD-v1.0 dataset. Bold indicates the best performance, and underline indicates the second-best performance.
Table 2.
Quantitative comparison of FMP-Net with 18 SOTA methods for SAR ship detection on the SSDD dataset. Bold indicates the best performance, and underline indicates the second-best performance.
Table 3.
Quantitative comparison of FMP-Net with 18 SOTA methods for SAR ship detection on the SAR-Ship-Dataset. Bold indicates the best performance, and underline indicates the second-best performance.
Table 4.
Quantitative comparison of FMP-Net with 18 SOTA methods for SAR ship detection on the AIR-SARShip-2.0 dataset. Bold indicates the best performance, and underline indicates the second-best performance.
On the LS-SSDD-v1.0 dataset. As shown in Table 1, we performed a detailed analysis on inshore and offshore scenarios, which represent different levels of detection difficulty. In inshore scenarios, FMP-Net achieves a precision of 67.7%, a recall of 51.1%, and an F1 score of 58.2%, significantly outperforming other methods. Compared to the second-best, YOLOv8s, the F1 score is improved by 2.1% (from 56.1% to 58.2%), and AP50 is increased by 4.2% (from 52.8% to 57.0%). This superior performance is attributed to the Frequency-aware Modulation and Perturbation strategy, which effectively distinguishes ships from strongly scattering harbor facilities and coastal structures. In offshore scenarios, AP75 is significantly higher than the second-best, YOLOv5n (an increase of 1.8%), where AP50 and mAP reach 93.1% and 40.6%, respectively. This indicates that the method has a strong detection ability in offshore background. It should be noted that while most methods show better performance in offshore scenarios than inshore scenarios, the proposed FMP-Net has a smaller performance gap (36.5% difference in AP50) between these two scenarios than other methods (for example, YOLOv6n shows a 47.3% gap). This shows that the proposed method maintains a more consistent performance under different environmental conditions.
On the SSDD dataset. As shown in Table 2, our method achieves an AP50 of 98.3% and mAP of 67.4%, outperforming all comparison methods. Specifically, compared with the second-best method, YOLOv8s (mAP: 66.2%; AP75: 77.8%), our mAP and AP75 are improved by 1.2% and 1.5%, respectively. The F1 value reaches 97.0%, which is 1.2% higher than that of YOLOv8s. Additionally, our precision reaches 97.7% and recall reaches 96.2%, demonstrating the superior and balanced detection capabilities of FMP-Net.
On the SAR-Ship-Dataset dataset. As shown in Table 3, for AP75, our FMP-Net achieves 82.0%, exceeding the second-best Dino (80.7%) by 1.3%. The strong AP75 score indicates our model’s exceptional ability in precise target localization. In terms of mAP, which evaluates detection performance across different IoU thresholds, our method reaches 68.9%, surpassing Dino (67.0%) by 1.9%. The F1 score reaches 95.3% with 96.0% precision and 94.6% recall, indicating balanced detection performance.
On the AIR-SARShip-2.0 dataset. As shown in Table 4, our FMP-Net achieves superior performance across all evaluation metrics. For AP75, our method reaches 51.9%, notably outperforming the second-best YOLOv10n (48.6%) by 3.3%. This significant improvement in AP75 demonstrates our model’s enhanced capability in accurate target localization. In terms of AP50, our approach attains 83.0%, surpassing the second-best YOLOv5n (81.8%) by 1.2%. For mAP, which evaluates detection performance across various IoU thresholds, our method achieves 48.5%, exceeding YOLOv10n (46.8%) by 1.7%. The remarkable improvement in AP75 (3.3% higher than that of the second-best method) highlights the effectiveness of our frequency-aware modulation and perturbation strategy in accurately localizing targets, even in complex scenarios like ports, islands, and reefs.
(2) Qualitative evaluation: In Figure 7, we show the qualitative comparison of our method to several representative SOTA methods in some challenging cases, with correctly detected targets, missed targets, and false alarms marked blue, red, and yellow, respectively. Our method FMP-Net achieves more competitive visual performance mainly in the following aspects: Regarding small objects in sea clutter interference (first row), traditional detection methods often struggle in this scene due to the high background noise level, and our method has better prediction and localization ability for small objects. In the complex inshore scene (second, third, and fourth rows), the traditional model is prone to false detections, while our method suppresses irrelevant interference and maintains the accuracy in recognizing the true target. In strongly scattering, side-lobe interference scenarios (fifth and sixth rows), which usually lead to false detections due to stacked reflections, our method achieves robust performance even in highly scattering environments. More accurate detection of the target is realized in the low-contrast scene (seventh row). These qualitative results demonstrate the effectiveness of our approach in a variety of challenging SAR image scenarios.
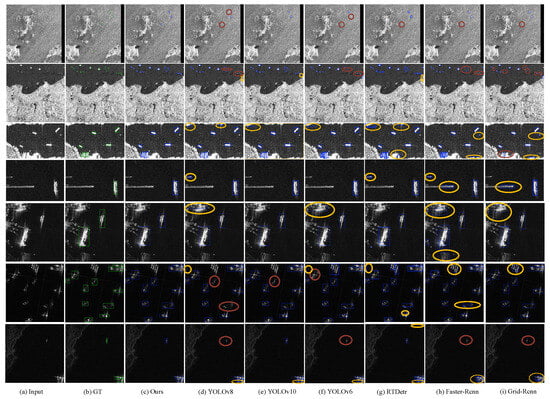
Figure 7.
Visual comparison of our method with six representative state-of-the-art methods. Our method is capable of tackling challenging cases (e.g., small objects under sea clutter (first row), complex inshore scene (second, third, and fourth rows), strong scattering (fifth and sixth rows), and low-contrast scene (seventh row)).
4.4. Ablation Study
This section delves into the ablation study conducted on the LS-SSDD-v1.0 and SSDD datasets. Note that the three proposed techniques are not independent plug-ins. Specifically, the variance modulation is defined on the directional high-frequency weights extracted by AWFA, and the FGP module was designed for Frequency-Guided Perturbation that relies on the AWFA-derived frequency weights.
(1) The effect of the modulation strategy. As shown in Table 5, on LS-SSDD-v1.0, the AP50 and AP75 of the model also increased from 75.6% and 14.5% to 77.7% and 17.8% after adding AWFA, respectively. After adding variance modulation to the basis of the AWFA module, the AP50 and AP75 of the model improve to 78.8% and 18.3%, respectively. Similarly, on SSDD data, AP75 improved from 75.5% to 76.7% after adding the AWFA module and then reached 78.5% after adding variance modulation. This indicates the synergistic effect of the AWFA module and modulation. Firstly, the AWFA module enhances the high-frequency features in the SAR images, making the model more sensitive to boundaries and details. The variance modulation further dynamically adjusts the high-frequency features so that the model can extract effective information from complex backgrounds and suppress irrelevant noise.
Table 5.
The effect of the modulation strategy.
(2) The effect of the FGP module. As shown in Table 6, on LS-SSDD-v1.0, F1 and AP50 improved from 77.0% and 78.4 to 78.3% and 80.2% after adding the FGP module, respectively. Similarly, on SSDD, F1 and AP75 improved from 95.1% and 78.2% to 96.0% and 79.0%, respectively. This indicates that the FGP module forces the model to pay more attention to the essential characteristics of the target and weakens the influence of background information during the learning process by imposing dynamic disturbances on the feature space.
Table 6.
The effect of the FGP module.
(3) The strategy for selecting the interference coefficient in the FGP module. As shown in Table 7, we explore the effect of different values of the interference coefficients on the performance of the model. In the experiment, three schemes were compared: no disturbance, random disturbance coefficient selection, and dynamic adjustment of the disturbance coefficient according to the frequency weight. After using random values such as , in the LS dataset, although AP50 increased slightly, AP75 decreased by 0.7%. This indicates that random perturbations introduce some uncertainty, and inappropriate perturbations can degrade the performance of the model. When = , compared to randomly selected in LS-SSDD-v1.0, AP50 improves by 1.5%, AP75 improves by 1.3%, and F1 improves by 1.0% in SSDD. The experimental results show that the dynamic adjustment strategy based on frequency weight has more advantages than random disturbance, so that the model can weaken the interference of irrelevant background while maintaining the attention to the important features of the target.
Table 7.
The strategy for selecting the interference coefficient in the FGP module.
(4) Effectiveness analysis of the AWFDown and MS-FMP module. As shown in Table 8, adding only the AWFDown module increases the mAP model in LS-SSDD-v1.0 by 2.9% and AP75 by 3.0% compared to the baseline. In SSDD, AP75 improves by 3.1%. When only the MS-FMP module is introduced, AP75 and F1 improve by 3.4% and 3.3%, respectively, in LS-SSDD-v1.0, and by 3.5% and 2.2% in SSDD. When the two modules are combined, the model achieves the best detection performance. Compared to the baseline, the F1, AP50, and mAP in LS-SSDD-v1.0 increase to 78.8%, 81.0%, and 33.6%, respectively. In SSDD, the F1, AP50, and mAP increase to 97.0%, 98.3%, and 67.4%, respectively. The AWFDown module effectively reduces the loss of high-frequency details during feature downsampling by preserving high-frequency information in the image. Based on this, MS-FMP further enhances these high-frequency features and effectively suppresses the interference of background noise, thereby improving the SAR target detection ability of the model in complex backgrounds.
Table 8.
Effectiveness analysis of AWFDown and MS-FMP modules.
(5) Effectiveness comparison of FPM stage in different object detection networks. The FPM stage improves the detection accuracy across different types of networks, including one-stage models (e.g., CenterNet, YOLOv5, YOLOv6, YOLOv9, YOLOv10), two-stage models (e.g., Faster-RCNN, Grid-RCNN, and Librar-RCNN), and end-to-end models (e.g., RTDetr-ResNet50 and Dino). For example, as shown in Table 9 on LS-SSDD-v1.0, integrating the FPM stage into Faster-RCNN improves AP50 by 1.8% and mAP by 2.0%. For RTDetr-ResNet50, AP50 is improved by about 10.1%. Integrating the FPM stage into YOLOv5n improves AP50 by 2.8%. These improvements show that the FPM stage, as an effective plug-and-play module, can significantly enhance high-frequency feature extraction capabilities across different detection architectures, and is an important component in improving the robustness and accuracy of detection in complex environments.
Table 9.
Performance comparison of inserting FPM stage into different object detection networks.
4.5. Visualization of Feature Activation Maps
To better understand the effectiveness of the proposed method, we visualize the feature activation maps in Figure 8, where brighter colors indicate stronger activation responses. We selected four representative challenging scenarios for analysis. As shown in the first row, with strong coastal interference, our method produces a more focused activation for ship targets while effectively suppressing coastal background interference, while the baseline shows a distraction of background structure. In the second row of the offshore scene with sea clutter interference, our method produces a more focused and stronger activation for the ship target, while the baseline shows a relatively weak and ambiguous response due to the influence of sea clutter. For the multi-ship case of different sizes (third row), the baseline exhibits relatively weak and ambiguous responses, and our method maintains consistent and precise activation patterns regardless of the target scale, which demonstrates the effectiveness of our method. In a complex scene with strong scattering interference (fourth row), our method generates clearer and sharper activation maps for each target, indicating excellent discrimination in challenging environments. These visualizations provide intuitive evidence that our Frequency-aware Modulations and Perturbations help the network focus on essential ship features while effectively filtering out background noise and reducing interference.
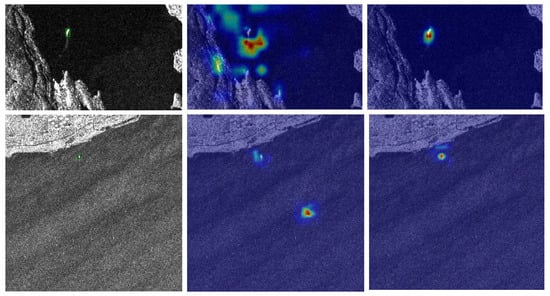
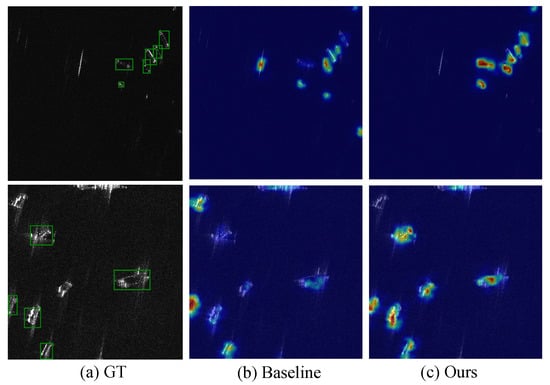
Figure 8.
Feature activation map visualization comparison. (a) Ground truth (GT). (b) Baseline. (c) Ours. The rows represent different challenging scenarios: coastal interference, sea clutter interference, multiscale ships, and complex scattering scenes.
5. Conclusions
This paper introduces FMP-Net, a novel Frequency-aware Modulation and Perturbation network for detecting SAR ships, employing a strategy that enhances high-frequency features and reduces background noise. The AWFA module targets high-frequency data in diverse directions, while variance modulation fine-tunes feature description to minimize false detections in complex scenes. The FGP module, guided by frequency domain weights, concentrates on crucial target features while minimizing background effects. Additionally, the AWFDown module maintains high-frequency information during downsampling to retain critical details. These innovations allow FMP-Net to achieve state-of-the-art results in multiple benchmarks with a lightweight design. It excels in both offshore and inshore conditions, especially in challenging circumstances like sea clutter and complex coastlines. The FMP stage shows significant generalization ability, enhancing performance across various detection frameworks. Future research may apply this frequency-aware strategy to other remote sensing tasks and explore its potential in multi-modal fusion.
Author Contributions
Conceptualization and methodology, M.F. and W.Z.; investigation and experiments, M.F. and L.T.; writing—original draft preparation, M.F. and X.Q.; writing—review and editing, W.Z., D.S. and J.Z.; visualization, D.S. and J.Z.; resources and supervision, Y.X. and S.Z. All authors have read and agreed to the published version of the manuscript.
Funding
This work was supported in part by the National Natural Science Foundation of China (NSFC) under Grant 62201467, in part by Innovation Capability Support Program of Shaanxi (Program No. 2024ZC-KJXX-043), and in part by the Young Talent Fund of Xi’an Association for Science and Technology under Grant 959202313088.
Data Availability Statement
The raw data supporting the conclusions of this article will be made available by the authors on request.
Conflicts of Interest
Authors Wencong Zhang, Xiaochen Quan, Dahu Shi were employed by the company Hikrobot Co., Ltd. The remaining authors declare that the research was conducted in the absence of any commercial or financial relationships that could be construed as a potential conflict of interest.
References
- Wang, R.; Su, T.; Xu, D.; Chen, J.; Liang, Y. MIGA-Net: Multi-view image information learning based on graph attention network for SAR target recognition. IEEE Trans. Circuits Syst. Video Technol. 2024, 34, 10779–10792. [Google Scholar] [CrossRef]
- Geng, J.; Ma, W.; Jiang, W. Causal Intervention and Parameter-Free Reasoning for Few-Shot SAR Target Recognition. IEEE Trans. Circuits Syst. Video Technol. 2024, 34, 12702–12714. [Google Scholar] [CrossRef]
- Huang, B.; Zhang, T.; Quan, S.; Wang, W.; Guo, W.; Zhang, Z. Scattering Enhancement and Feature Fusion Network for Aircraft Detection in SAR Images. IEEE Trans. Circuits Syst. Video Technol. 2024, 35, 1936–1950. [Google Scholar] [CrossRef]
- Huang, S.Q.; Liu, D.Z.; Gao, G.Q.; Guo, X.J. A novel method for speckle noise reduction and ship target detection in SAR images. Pattern Recognit. 2009, 42, 1533–1542. [Google Scholar] [CrossRef]
- Guo, H.; Yang, X.; Wang, N.; Gao, X. A CenterNet++ model for ship detection in SAR images. Pattern Recognit. 2021, 112, 107787. [Google Scholar] [CrossRef]
- Xing, X.; Ji, K.; Zou, H.; Sun, J.; Zhou, S. High resolution SAR imagery ship detection based on EXS-C-CFAR in Alpha-stable clutters. In Proceedings of the 2011 IEEE International Geoscience and Remote Sensing Symposium, Vancouver, BC, Canada, 24–29 July 2011; pp. 316–319. [Google Scholar]
- Leng, X.; Ji, K.; Yang, K.; Zou, H. A bilateral CFAR algorithm for ship detection in SAR images. IEEE Geosci. Remote Sens. Lett. 2015, 12, 1536–1540. [Google Scholar] [CrossRef]
- Wang, C.; Bi, F.; Zhang, W.; Chen, L. An intensity-space domain CFAR method for ship detection in HR SAR images. IEEE Geosci. Remote Sens. Lett. 2017, 14, 529–533. [Google Scholar] [CrossRef]
- Ren, S.; He, K.; Girshick, R.; Sun, J. Faster R-CNN: Towards real-time object detection with region proposal networks. IEEE Trans. Pattern Anal. Mach. Intell. 2016, 39, 1137–1149. [Google Scholar] [CrossRef] [PubMed]
- Farhadi, A.; Redmon, J. Yolov3: An incremental improvement. In Proceedings of the Computer Vision and Pattern Recognition; Springer: Berlin/Heidelberg, Germany, 2018; Volume 1804, pp. 1–6. [Google Scholar]
- Jocher, G. YOLOv5 by Ultralytics. 2020. Available online: https://zenodo.org/records/7347926 (accessed on 7 January 2026).
- Li, C.; Li, L.; Jiang, H.; Weng, K.; Geng, Y.; Li, L.; Ke, Z.; Li, Q.; Cheng, M.; Nie, W.; et al. YOLOv6: A single-stage object detection framework for industrial applications. arXiv 2022, arXiv:2209.02976. [Google Scholar] [CrossRef]
- Wang, C.Y.; Yeh, I.H.; Mark Liao, H.Y. Yolov9: Learning what you want to learn using programmable gradient information. In Proceedings of the European Conference on Computer Vision—ECCV 2024, Milan, Italy, 29 September–4 October 2024; pp. 1–21. [Google Scholar]
- Reis, D.; Kupec, J.; Hong, J.; Daoudi, A. Real-time flying object detection with YOLOv8. arXiv 2023, arXiv:2305.09972. [Google Scholar] [CrossRef]
- Wang, A.; Chen, H.; Liu, L.; Chen, K.; Lin, Z.; Han, J.; Ding, G. Yolov10: Real-time end-to-end object detection. arXiv 2024, arXiv:2405.14458. [Google Scholar]
- Jocher, G.; Qiu, J. Ultralytics YOLO11. 2024. Available online: https://docs.ultralytics.com/models/yolo11/#usage-examples (accessed on 7 January 2026).
- Fu, J.; Sun, X.; Wang, Z.; Fu, K. An anchor-free method based on feature balancing and refinement network for multiscale ship detection in SAR images. IEEE Trans. Geosci. Remote Sens. 2020, 59, 1331–1344. [Google Scholar] [CrossRef]
- Yang, X.; Zhang, X.; Wang, N.; Gao, X. A robust one-stage detector for multiscale ship detection with complex background in massive SAR images. IEEE Trans. Geosci. Remote Sens. 2021, 60, 5217712. [Google Scholar] [CrossRef]
- Hong, Z.; Yang, T.; Tong, X.; Zhang, Y.; Jiang, S.; Zhou, R.; Han, Y.; Wang, J.; Yang, S.; Liu, S. Multi-scale ship detection from SAR and optical imagery via a more accurate YOLOv3. IEEE J. Sel. Top. Appl. Earth Obs. Remote Sens. 2021, 14, 6083–6101. [Google Scholar] [CrossRef]
- Hu, Q.; Hu, S.; Liu, S.; Xu, S.; Zhang, Y.D. FINet: A feature interaction network for SAR ship object-level and pixel-level detection. IEEE Trans. Geosci. Remote Sens. 2022, 60, 5239215. [Google Scholar] [CrossRef]
- Zha, C.; Min, W.; Han, Q.; Xiong, X.; Wang, Q.; Xiang, H. SAR ship detection based on salience region extraction and multi-branch attention. Int. J. Appl. Earth Obs. Geoinf. 2023, 123, 103489. [Google Scholar] [CrossRef]
- Yasir, M.; Liu, S.; Mingming, X.; Wan, J.; Pirasteh, S.; Dang, K.B. ShipGeoNet: SAR image-based geometric feature extraction of ships using convolutional neural networks. IEEE Trans. Geosci. Remote Sens. 2024, 62, 5202613. [Google Scholar] [CrossRef]
- He, K.; Gkioxari, G.; Dollár, P.; Girshick, R. Mask r-cnn. In Proceedings of the IEEE International Conference on Computer Vision, Venice, Italy, 22–29 October 2017; pp. 2961–2969. [Google Scholar]
- Li, Y.; Mao, H.; Girshick, R.; He, K. Exploring plain vision transformer backbones for object detection. In Proceedings of the European Conference on Computer Vision—ECCV 2022, Tel Aviv, Israel, 23–27 October 2022; pp. 280–296. [Google Scholar]
- Shen, J.; Bai, L.; Zhang, Y.; Momi, M.C.; Quan, S.; Ye, Z. ELLK-Net: An efficient lightweight large kernel network for SAR ship detection. IEEE Trans. Geosci. Remote Sens. 2024, 62, 5221514. [Google Scholar] [CrossRef]
- Yasir, M.; Shanwei, L.; Mingming, X.; Jianhua, W.; Nazir, S.; Islam, Q.U.; Dang, K.B. SwinYOLOv7: Robust ship detection in complex synthetic aperture radar images. Appl. Soft Comput. 2024, 160, 111704. [Google Scholar] [CrossRef]
- Wang, C.Y.; Bochkovskiy, A.; Liao, H.Y.M. YOLOv7: Trainable bag-of-freebies sets new state-of-the-art for real-time object detectors. In Proceedings of the 2023 IEEE/CVF Conference on Computer Vision and Pattern Recognition, Vancouver, BC, Canada, 17–24 June 2023; pp. 7464–7475. [Google Scholar]
- Lin, T.Y.; Dollár, P.; Girshick, R.; He, K.; Hariharan, B.; Belongie, S. Feature pyramid networks for object detection. In Proceedings of the 2017 IEEE Conference on Computer Vision and Pattern Recognition, Honolulu, HI, USA, 21–26 July 2017; pp. 2117–2125. [Google Scholar]
- Zhang, T.; Xie, N.; Quan, S.; Wang, W.; Wei, F.; Yu, W. Polarimeric SAR Ship Detection Based on Sub-Look the Decomposition Technology. IEEE Trans. Radar Syst. 2026, 4, 35–49. [Google Scholar] [CrossRef]
- Wang, J.; Quan, S.; Xing, S.; Li, Y.; Wu, H.; Meng, W. PSO-based fine polarimetric decomposition for ship scattering characterization. ISPRS J. Photogramm. Remote Sens. 2025, 220, 18–31. [Google Scholar] [CrossRef]
- Zhang, L.; Liu, Y.; Zhao, W.; Wang, X.; Li, G.; He, Y. Frequency-adaptive learning for SAR ship detection in clutter scenes. IEEE Trans. Geosci. Remote Sens. 2023, 61, 5215514. [Google Scholar] [CrossRef]
- Wang, S.; Cai, Z.; Yuan, J. Automatic SAR ship detection based on multifeature fusion network in spatial and frequency domains. IEEE Trans. Geosci. Remote Sens. 2023, 61, 4102111. [Google Scholar] [CrossRef]
- Zhang, Z.; Li, Y. YOLO-FCNET: Enhancing SAR Ship Detection with Fourier Convolution in YOLOv8. In Proceedings of the International Joint Conference on Artificial Intelligence 2024, Jeju, Republic of Korea, 3 August 2024; pp. 195–207. [Google Scholar]
- Li, D.; Liang, Q.; Liu, H.; Liu, Q.; Liu, H.; Liao, G. A novel multidimensional domain deep learning network for SAR ship detection. IEEE Trans. Geosci. Remote Sens. 2021, 60, 5203213. [Google Scholar] [CrossRef]
- Qiao, C.; Shen, F.; Wang, X.; Wang, R.; Cao, F.; Zhao, S.; Li, C. A novel multi-frequency coordinated module for sar ship detection. In Proceedings of the 2022 IEEE 34th International Conference on Tools with Artificial Intelligence (ICTAI), Macao, China, 31 October–2 November 2022; pp. 804–811. [Google Scholar]
- Wilson, S.; Fischer, T.; Dayoub, F.; Miller, D.; Sünderhauf, N. SAFE: Sensitivity-aware features for out-of-distribution object detection. In Proceedings of the IEEE/CVF International Conference on Computer Vision, Paris, France, 1–6 October 2023; pp. 23565–23576. [Google Scholar]
- Qi, L.; Dong, P.; Xiong, T.; Xue, H.; Geng, X. DoubleAUG: Single-domain Generalized Object Detector in Urban via Color Perturbation and Dual-style Memory. ACM Trans. Multimed. Comput. Commun. Appl. 2024, 20, 1–20. [Google Scholar] [CrossRef]
- Li, S.; Ye, M.; Zhu, X.; Zhou, L.; Xiong, L. Source-free object detection by learning to overlook domain style. In Proceedings of the IEEE/CVF Conference on Computer Vision and Pattern Recognition, New Orleans, LA, USA, 18–24 June 2022; pp. 8014–8023. [Google Scholar]
- Song, Z.; Gong, X.; Hu, G.; Zhao, C. Deep perturbation learning: Enhancing the network performance via image perturbations. In Proceedings of the International Conference on Machine Learning, PMLR, Honolulu, HI, USA, 23–29 July 2023; pp. 32273–32287. [Google Scholar]
- Li, C.; Zhang, D.; Huang, W.; Zhang, J. Cross contrasting feature perturbation for domain generalization. In Proceedings of the IEEE/CVF International Conference on Computer Vision, Paris, France, 1–6 October 2023; pp. 1327–1337. [Google Scholar]
- Dreyer, M.; Achtibat, R.; Wiegand, T.; Samek, W.; Lapuschkin, S. Revealing hidden context bias in segmentation and object detection through concept-specific explanations. In Proceedings of the IEEE/CVF Conference on Computer Vision and Pattern Recognition, Vancouver, BC, Canada, 17–24 June 2023; pp. 3828–3838. [Google Scholar]
- Zhou, J.; He, Z.; Lam, K.M.; Wang, Y.; Zhang, W.; Guo, C.; Li, C. AMSP-UOD: When vortex convolution and stochastic perturbation meet underwater object detection. In Proceedings of the AAAI Conference on Artificial Intelligence, Vancouver, BC, Canada, 20–27 February 2024; Volume 38, pp. 7659–7667. [Google Scholar]
- Fan, Q.; Segu, M.; Tai, Y.W.; Yu, F.; Tang, C.K.; Schiele, B.; Dai, D. Towards robust object detection invariant to real-world domain shifts. In Proceedings of the Eleventh International Conference on Learning Representations (ICLR 2023), Kigali, Rwanda, 1–5 May 2023. [Google Scholar]
- Zhou, K.; Yang, Y.; Qiao, Y.; Xiang, T. Mixstyle neural networks for domain generalization and adaptation. Int. J. Comput. Vis. 2024, 132, 822–836. [Google Scholar] [CrossRef]
- He, K.; Zhang, X.; Ren, S.; Sun, J. Spatial pyramid pooling in deep convolutional networks for visual recognition. IEEE Trans. Pattern Anal. Mach. Intell. 2015, 37, 1904–1916. [Google Scholar] [CrossRef] [PubMed]
- Liu, S.; Qi, L.; Qin, H.; Shi, J.; Jia, J. Path aggregation network for instance segmentation. In Proceedings of the IEEE Conference on Computer Vision and Pattern Recognition, Salt Lake City, UT, USA, 18–23 June 2018; pp. 8759–8768. [Google Scholar]
- Zhang, T.; Zhang, X.; Ke, X.; Zhan, X.; Shi, J.; Wei, S.; Pan, D.; Li, J.; Su, H.; Zhou, Y.; et al. LS-SSDD-v1.0: A deep learning dataset dedicated to small ship detection from large-scale Sentinel-1 SAR images. Remote Sens. 2020, 12, 2997. [Google Scholar] [CrossRef]
- Li, J.; Qu, C.; Shao, J. Ship detection in SAR images based on an improved faster R-CNN. In Proceedings of the 2017 SAR in Big Data Era: Models, Methods and Applications (BIGSARDATA), Beijing, China, 13–14 November 2017; pp. 1–6. [Google Scholar]
- Wang, Y.; Wang, C.; Zhang, H.; Dong, Y.; Wei, S. A SAR dataset of ship detection for deep learning under complex backgrounds. Remote Sens. 2019, 11, 765. [Google Scholar] [CrossRef]
- Xian, S.; Zhirui, W.; Yuanrui, S.; Wenhui, D.; Yue, Z.; Kun, F. AIR-SARShip-1.0: High-resolution SAR ship detection dataset. J. Radars 2019, 8, 852–863. [Google Scholar]
- Zhang, S.; Chi, C.; Yao, Y.; Lei, Z.; Li, S.Z. Bridging the gap between anchor-based and anchor-free detection via adaptive training sample selection. In Proceedings of the IEEE/CVF Conference on Computer Vision and Pattern Recognition, Seattle, WA, USA, 13–19 June 2020; pp. 9759–9768. [Google Scholar]
- Duan, K.; Bai, S.; Xie, L.; Qi, H.; Huang, Q.; Tian, Q. CenterNet: Keypoint Triplets for Object Detection. In Proceedings of the IEEE/CVF International Conference on Computer Vision (ICCV), Seoul, Republic of Korea, 27 October–2 November 2019. [Google Scholar]
- Tian, Z.; Chu, X.; Wang, X.; Wei, X.; Shen, C. Fully convolutional one-stage 3d object detection on lidar range images. Adv. Neural Inf. Process. Syst. 2022, 35, 34899–34911. [Google Scholar]
- Li, X.; Wang, W.; Wu, L.; Chen, S.; Hu, X.; Li, J.; Tang, J.; Yang, J. Generalized focal loss: Learning qualified and distributed bounding boxes for dense object detection. Adv. Neural Inf. Process. Syst. 2020, 33, 21002–21012. [Google Scholar]
- Ross, T.Y.; Dollár, G. Focal loss for dense object detection. In Proceedings of the IEEE Conference on Computer Vision and Pattern Recognition, Honolulu, HI, USA, 21–26 July 2017; pp. 2980–2988. [Google Scholar]
- Cai, Z.; Vasconcelos, N. Cascade r-cnn: Delving into high quality object detection. In Proceedings of the IEEE Conference on Computer Vision and Pattern Recognition, Salt Lake City, UT, USA, 18–23 June 2018; pp. 6154–6162. [Google Scholar]
- Lu, X.; Li, B.; Yue, Y.; Li, Q.; Yan, J. Grid r-cnn. In Proceedings of the IEEE/CVF Conference on Computer Vision and Pattern Recognition, Long Beach, CA, USA, 15–20 June 2019; pp. 7363–7372. [Google Scholar]
- Pang, J.; Chen, K.; Shi, J.; Feng, H.; Ouyang, W.; Lin, D. Libra R-CNN: Towards Balanced Learning for Object Detection. In Proceedings of the IEEE/CVF Conference on Computer Vision and Pattern Recognition (CVPR), Long Beach, CA, USA, 15–20 June 2019. [Google Scholar]
- Zhang, H.; Li, F.; Liu, S.; Zhang, L.; Su, H.; Zhu, J.; Ni, L.M.; Shum, H.Y. Dino: Detr with improved denoising anchor boxes for end-to-end object detection. arXiv 2022, arXiv:2203.03605. [Google Scholar]
- Zhao, Y.; Lv, W.; Xu, S.; Wei, J.; Wang, G.; Dang, Q.; Liu, Y.; Chen, J. Detrs beat yolos on real-time object detection. In Proceedings of the IEEE/CVF Conference on Computer Vision and Pattern Recognition, Seattle, WA, USA, 16–22 June 2024; pp. 16965–16974. [Google Scholar]


Disclaimer/Publisher’s Note: The statements, opinions and data contained in all publications are solely those of the individual author(s) and contributor(s) and not of MDPI and/or the editor(s). MDPI and/or the editor(s) disclaim responsibility for any injury to people or property resulting from any ideas, methods, instructions or products referred to in the content. |
© 2026 by the authors. Licensee MDPI, Basel, Switzerland. This article is an open access article distributed under the terms and conditions of the Creative Commons Attribution (CC BY) license.