Highlights
What are the main findings?
- The study modeled remote sensing reflectance (Rrs) in sea waters using absorption (a), attenuation (c), and backscattering (bb) coefficients.
- Rrs was estimated using both Morel’s proxy algorithm and Monte Carlo (MC) simulations for selected wavelengths (420 nm, 488 nm, 555 nm, 620 nm).
- The proxy parameter (k) increased with wavelength, indicating the need for wavelength dependent adjustments in the proxy model.
What are the implications of the main findings?
- Estimating Rrs using inherent optical properties (IOPs) offers advantages under variable lighting conditions, unlike direct Rrs measurements.
- Refining proxy models to include environmental variability, seasonal factors, and better calibration against in situ data is recommended for improved remote sensing applications.
Abstract
The study focuses on modeling the remote sensing reflectance (Rrs) for optically complex waters based on the absorption (a), scattering (b), and backscattering (bb) coefficients measured at selected wavelengths (420 nm, 488 nm, 555 nm, and 620 nm). Rrs was calculated using both Morel’s proxy and Monte Carlo (MC) simulations. A comparison of the Rrs values obtained from the proxy and the MC simulations allowed us to determine the proxy factor (k). The results evidenced that this proxy parameter increases with wavelength. The findings demonstrate that Rrs can be computed from inherent optical properties (IOPs) using radiative transfer modeling, providing light independent reflectance estimates, unlike direct in situ Rrs measurements, which are affected by instantaneous lightening conditions.
1. Introduction
Understanding the connection between inherent optical properties and the remote sensing reflectance of water areas is essential to improve capacity to identify marine biogeochemical components or contaminants and their temporal changes [1,2]. Therefore, for decades, researchers have been looking for improved measurement approaches and increasingly precise descriptions of the relationships between optically active components and apparent optical properties (AOPs) or IOPs. Foundational theoretical formulations were established in early optical studies [3,4,5], followed by the development of semi-analytical radiance and ocean color models [6,7,8]. Later work introduced analytical and bidirectional reflectance models [9,10,11,12,13]. The latest advances include refined empirical relationships and hyperspectral characterizations of optical properties in diverse and very dynamic marine environments [14,15,16,17]. Recent developments also include deep generative approaches, such as water cycle diffusion, which integrates visual textual fusion to significantly improve underwater image enhancement and compensate for complex degradations characteristic of aquatic environments [18].
It has been well established that the spectral reflectance of a water body can reveal information about the optically active components it contains [19,20,21,22,23,24]. Recent studies also emphasize that color disparities induced by wavelength-dependent attenuation provide important clues for restoring natural color consistency in underwater imagery, improving the interpretation of optical signals in complex water conditions [25]. Early works, such as those by Jerlov [26] and Gordon and Morel [27], laid the groundwork for understanding the radiative transfer processes in natural waters. Morel refined these theories, linking reflectance to IOPs like absorption and scattering coefficients (b), leading to widely adopted models for interpreting satellite data.
In parallel, researchers like Preisendorfer [28] and Dera [29] expanded the theoretical framework, exploring how subsurface reflectance could be empirically related to Rrs through in situ measurements. These studies highlighted the complexity of light interactions in water and the importance of distinguishing between contributions from phytoplankton, dissolved organic matter, and non-algal particles.
Determining Rrs from IOPs is a fundamental aspect of ocean color remote sensing. Several algorithms have been developed for this purpose [30,31,32,33,34]. These algorithms have significantly advanced the field of ocean color remote sensing by enabling the estimation of IOPs from Rrs measurements, thereby improving our understanding of aquatic environments.
Many remote sensing inversion techniques rely on a fundamental relationship [3,4,11,35]:
where represent (Q) the ratio of upwelling irradiance (Eu) to upwelling radiance:
In contrast, (f) is a complex function of the solar zenith angle, light wavelength, and single-scattering albedo.
The parameters f and Q exhibit a similar variability pattern with changes in both wavelength and the solar zenith angle. The f/Q ratio, often denoted as (g) or (f/Q), is used in ocean optics to relate Rrs to the a and bb of water. This parameter accounts for factors such as the bidirectional nature of light and multiple scattering effects [11].
The (f/Q) ratio conception is rooted in earlier radiative transfer theories, such as the Kubelka–Munk theory [36], which have been adapted and extended to address the complexities of light interaction in aquatic environments. This theory models the appearance of paint films by relating reflectance to a and bb using a two-stream approximation for light diffusing through a medium. Although the Kubelka–Munk theory was initially developed for paint applications, its mathematical framework has influenced various fields, including ocean optics.
Therefore, Equation (1) serves as the foundation for numerous inversion algorithms, though their accuracy is compromised if the dependence of f/Q on the shape of the β and radiance distribution is not properly accounted for. The proportionality factor f/Q in the literature generally ranges from 0.084 to 0.15 sr−1 for nadir-viewed radiance [37,38]. This factor depends on the relationship between backscattered light and the bb, which is influenced by the specifics of the β in the backward direction and the radiance distribution. Consequently, most directional effects in radiative transfer are encapsulated within f/Q, making it a subject of extensive study [6,37,38]. However, accurately determining the f/Q ratio in Case 2 waters presents significant challenges and necessitates a highly localized approach. In 2002, Morel [39] determined that for Case 2 waters, the f/Q ratio varies between 0.07 and 0.18 sr−1. These theoretical findings were later validated by empirical studies conducted by Voss and Morel in 2005 [40]. Moreover, in a 2003 study, D’Sa and Miller [41] reported that at the mouth of the Mississippi River in the Gulf of Mexico, this ratio falls within the range of 0.09 to 0.12 sr−1, while in 2022, Lednicka [2] established that for southern Baltic Sea, the f/Q ratio ranges from 0.07 to 0.13 sr−1.
In 1993 Morel and Gentili [37], based on MC simulations of the radiative transfer process, established a relationship between Rrs and the inherent optical properties of seawater:
Nowadays, Morel and Gentili’s proxy remains one of the best approaches for calculating reflectance from IOPs because it is physically based, accounts for bidirectional effects, works across different water conditions, and has been widely validated. Moreover it is not limited to a specific water type (e.g., Case 1 or Case 2 waters) and it has been validated for various oceanic conditions.
These days, Rrs remains a cornerstone of aquatic remote sensing, with ongoing research refining measurement techniques, atmospheric correction algorithms, and bio-optical models. Understanding its historical evolution helps contextualize modern advancements and underscores the enduring significance of Rrs in global ocean observation systems. Therefore, Rrs is a fundamental concept in ocean optics, representing the ratio of the upwelling radiance (Lu) to the downwelling irradiance (Ed) just above or just below the water surface.
Reflectance measurements can be conducted both above and below the water surface. Above-surface reflectance (Rrs(0+)) accounts for light that escapes from the water column, modified by surface effects like reflection and refraction. Below-surface reflectance (Rrs(0−)), on the other hand, describes the ratio of upwelling to downwelling irradiance just beneath the water surface, without the interference of surface reflection. Measurements taken just below the surface avoid distortions caused by surface waves, foam, and specular reflection. The air–water interface acts as a complex optical boundary where part of the light is reflected back to the atmosphere, and part is refracted into or out of the water. Wind-driven waves, surface roughness, and changing solar angles further complicate light propagation. Therefore, measuring reflectance beneath the surface can isolate the water’s optical signal, reducing the influence of transient surface conditions. Subsurface reflectance is directly connected to the water’s absorption and scattering coefficients (b). Absorption determines how much light is lost to chemical and biological constituents, while scattering describes how particles redirect light. This link is essential for characterizing water quality, detecting harmful algal blooms, and understanding carbon cycling in aquatic systems. In situ measurements below the surface provide critical validation points for satellite and airborne sensors. Since remotely sensed reflectance is affected by atmospheric scattering and surface reflection, direct subsurface measurements allow researchers to calibrate satellite algorithms and correct for these distortions. Long-term monitoring programs, like NASA’s Ocean Color program, rely on these ground-truth measurements to improve the accuracy and reliability of global ocean observations [42,43,44].
Moreover, understanding light fields below the surface is essential for refining radiative transfer models. These models describe how light interacts with water and its constituents, simulating processes like multiple scattering, and absorption by dissolved and suspended matter. Accurate subsurface reflectance measurements help validate these models, which are used to predict light penetration depth, primary production rates, and habitat suitability for marine organisms.
The aim of the research presented in this paper is to indicate the possibility of determining Rrs not by the remote method, which requires measurements in defined lighting conditions, but by the method of measuring IOPs directly in the water. Measurements conducted in this way make it possible to collect information about Rrs in any weather conditions and at any time of day. On the other hand, the results of above-water determinations of Rrs against the background of the existing database of this size would provide information about changes in optical conditions in the sea, and consequently, about processes in the marine environment.
Measuring Rrs using radiance and irradiance meters is practical, efficient, and an integrated approach for monitoring the optical properties and water quality in natural environments. It allows for real-time, large-scale assessments and directly relates to how light interacts with water, making it an excellent method to validate measurements of Rrs values obtained based on absorption and scattering coefficients.
2. Materials
The scope of the work includes modeling of Rrs just below the water surface, using historical measurement data from the Gulf of Gdansk (Figure 1) regarding the absorption coefficient, scattering coefficient, and backscattering coefficient.
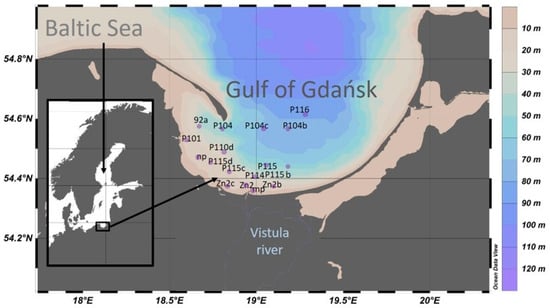
Figure 1.
Study area and sampling stations.
The Gulf of Gdańsk (part of the southern Baltic Sea) (Figure 1) is an interesting area in terms of optical measurements, due to pollution by admixtures of various substances brought by rivers (mostly the Vistula River) and flowing from the shores and the atmosphere (e.g., pollen). These admixtures influence the optical characteristics of the sea, which in turn impact the radiation spectrum detected by satellite radiometers [45,46]. Moreover, in the near-bottom zone, elevated concentrations of hydrogen sulfide, oxygen deficiency, and increased levels of heavy metals are frequently observed [47]. Therefore, it is extremely important to develop local mathematical algorithms and models for areas such as the Gulf of Gdańsk to establish relationships between the components of seawater and its optical properties, which will enable better interpretation of the signal reaching the satellite [2,45].
The optical dataset used for this study was obtained from 17 stations in the Gulf of Gdansk during three cruise surveys in March, April, and May 2009. Some of the measurement stations were repeated, resulting in a total of 34 optical datasets. All measurements were conducted just below the sea surface (typically at 0.5–1 m depth), with both the ac-9 (WET Labs, Philomath, OR, USA) and Hydroscat-4 (HOBI Labs, Bellevue, WA, USA) sensors mounted vertically to ensure a consistent sensor height and to minimize shading effects and flow disturbances.
Absorption and attenuation coefficients by dissolved and suspended constituents of seawater ((apg) and (cpg)) were measured using an underwater absorption and attenuation meter ac-9, which measured these values for nine wavelengths (412 nm, 440 nm, 488 nm, 510 nm, 532 nm, 555 nm, 650 nm, 676 nm, and 715 nm). Prior to each deployment, the ac-9 was calibrated following the manufacturer’s recommended procedures, including pure-water calibration with 0.2 μm filtered Milli-Q water and dark calibration performed before and after each measurement sequence. The derived absorption and attenuation coefficients were further corrected for temperature and salinity effects [48] and for scattering effects according to Zaneveld et al. [49], assuming a wavelength-independent shape of the scattering phase function and using 715 nm as the reference wavelength for which absorption is zero.
The scattering coefficient by suspended constituents of seawater (bp) was determined from the difference between attenuation and absorption. At the same locations and times, the backscattering coefficients by particles (bbp) were estimated using a spectral backscattering meter Hydroscat-4, which measures the volume scattering function (β) at an angle of 140° and derives the backscattering coefficient bb(λ) at four wavelengths (420, 488, 550 and 620 nm) following the methodology of Maffione and Dana [50,51]. Prior to deployment, the Hydroscat-4 was calibrated using dark readings and reference-water procedures recommended by the manufacturer.
The Hydroscat-4 measures β(140°) over a source–detector path length of approximately 90 cm, and in the optically complex waters of the Gulf of Gdansk the direct measurement was affected by significant light attenuation. Therefore, a sigma-correction procedure was applied to account for this effect [50]. The attenuation coefficients required for this correction were taken from the ac-9 measurements. Two of the Hydroscat-4 wavelengths (488 and 550 nm) coincided with ac-9 channels, whereas the remaining wavelengths (420 and 620 nm) were estimated by linear interpolation of neighboring ac-9 bands (412/440 nm for 420 nm, and 555/650 nm for 620 nm). The particulate backscattering coefficient bbp(λ) was then calculated as the difference between the total backscattering bb(λ) and the pure water backscattering bbw(λ).
Measurements from the ac-9 and Hydroscat-4 were temporally synchronized by acquiring data from both instruments simultaneously during each station stop, ensuring that all optical parameters corresponded to the same water mass and eliminating temporal decorrelation between measurements. Since the bbp coefficients were measured only at four wavelengths, this limited the subsequent radiative-transfer modeling to λ = 420 nm, 488 nm, 550 nm, and 620 nm.
3. Methods
Spectral values of absorption coefficients of particles and CDOM (as gelbstoff) (apg) and the scattering coefficients by particles (bp) were used in the simulation of the fate of two billion virtual photons (MC radiative transfer), on the basis of which Rrs was calculated (Rrs_MC), while apg and the backscattering coefficients by particles (bbp) were used to calculate the unscaled value of Rrs (Rrs_unprox) as a proxy according to Morel [37]. The Rrs_unprox were calculated using the apg and bbp values for the same sampling points as for Rrs_MC. Since the total absorption of seawater (a) is the sum of the absorption by pure water (aw) and that by water constituents (apg), the total absorption coefficients a(λ) were calculated by adding the absorption coefficients of pure water molecules aw(λ), following Pope and Fry [52]. Similarly, the scattering (bw(λ)) and backscattering coefficients (bbw(λ)) of pure water were used, according to Morel [53], to calculate the total scattering b(λ) and total backscattering bb(λ) coefficients of seawater. Values of scaled Rrs proxies (Rrs_k) were calculated by multiplying unscaled proxies by the proxy parameter k determined from the comparison of Rrs_MC and Rrs_unprox. Figure 2 presents an overall block diagram of estimation of the proxy parameter (k) calculated based on MC simulation and Morel’s proxy for the waters of the Gulf of Gdansk for four wavelengths (420 nm, 488 nm, 555 nm, and 620 nm). The diagram consists of three main parts: input data, methods, and output data.
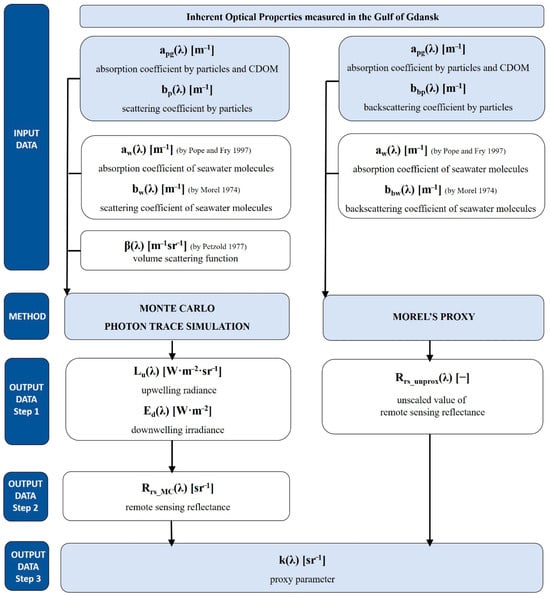
Figure 2.
The block diagram of estimation of the proxy parameter calculated based on MC simulation and Morel’s proxy for the waters of the Gulf of Gdansk for four wavelengths (420 nm, 488 nm, 555 nm, and 620 nm) [52,53,54].
The MC model studies were based on values derived from in situ measurements of surface water of the absorption coefficients of particles and CDOM (apg) and the scattering coefficients by particles (bp) in the Gulf of Gdansk. The total absorption coefficients a(λ) were calculated as a sum of apg(λ) and aw(λ) (the absorption coefficients of seawater molecules) [52] and total scattering coefficients b(λ) were calculated as a sum of bp(λ) and scattering coefficients of pure water (bw(λ)) [53]. The value of Rrs_MC for four wavelengths was determined for all sampling points, taking into account weather conditions and the angular scattering function characteristic for coastal waters determined by Petzold [54].
The conditions on the sea surface were determined using the Cox and Munk model [55], assuming a wind speed of 5 m/s, which consequently resulted in a virtually wavy water surface. The optical representation of the sky was determined based on the RADTRAN model developed by Gregg and Carder [56]. The simulations further assumed a cloudless sky and a solar zenith angle of 30°, which defined the incidence angle of direct sunlight entering the model domain. The MC simulations used in this study tracked the fate of two billion virtual photons, providing sufficient statistical stability for the estimation of radiance fields and remote sensing reflectance. Photons were initialized in the upper hemisphere according to the radiance distribution obtained from the RADTRAN sky model [56]. For each photon, radiances from the upper hemisphere, as well as an equal number of radiances from the lower hemisphere, were converted into sector irradiances by multiplying each radiance by cosθ. At every scattering event, the photon’s angular redistribution was governed by the Petzold coastal water phase function [54], which defines a detailed directional scattering pattern characteristic for turbid nearshore waters. Boundary conditions at the air sea interface accounted for both reflection and refraction according to Fresnel’s equations and the statistical representation of surface roughness from the Cox and Munk model [55]. The lower boundary was treated as optically deep, preventing photon reflection from the seabed and ensuring that photons reaching large depths were considered absorbed and removed from further propagation. The sensitivity of the results to these boundary conditions and to the number of photons was evaluated through preliminary tests, which confirmed that the chosen configuration ensured numerical stability and minimized statistical noise.
The virtual receivers of upwelling radiance and downwelling irradiance were placed just below the surface. Then, the computational algorithm counted virtual photons in seawater. The virtual photon receivers of Lu and Ed were directed accordingly downwards and upwards, therefore they recorded photons moving from the water column perpendicularly downwards and upwards (Figure 2, Output Data, Step 1). The values of remote sensing reflectance for four wavelengths were calculated using the ratio of Lu to Ed:
where 0− means just below the surface (Figure 2, Output Data, Step 2).
We used Morel’s proxy (Equation (3)) to calculate Rrs_unprox as a ratio of bb/a + bb (for four wavelengths) based on derived in situ measurements of a and bb (Figure 1, Output Data, Step 1). Total absorption coefficients a(λ) were calculated as a sum of apg(λ) and aw(λ) [52] and total backscattering coefficients bb(λ) were calculated as a sum of bbp(λ) and bbw(λ)) [53].
However, in this paper it was decided to express the f/Q ratio using a single parameter, k:
This is determined in the following section.
The parameter k for four wavelengths (420 nm, 488 nm, 555 nm and 620 nm) was determined from the equation:
based on the remote sensing reflectance values obtained from MC simulations and ratio bb/a + bb calculated from Morel’s proxy (Figure 1, Output Data, Step 3).
4. Results
To determine the k parameter, in the first stage of the analysis, the relationships between the Rrs values obtained from MC simulations and ratio bb/a + bb were examined and statistically approximated. Figure 3 shows these relationships for four wavelengths for selected areas of the Gulf of Gdansk.
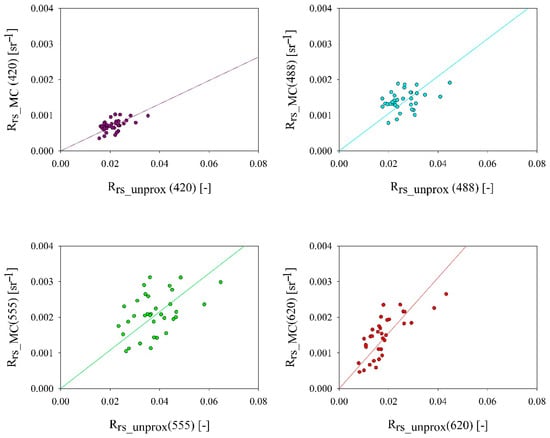
Figure 3.
Relationships between the Rrs values obtained from MC simulations (Rrs_MC) and ratio bb/a + bb in the chosen areas of the Gulf of Gdansk (line approximation by Equations (7)–(10)) for four wavelengths (420, 488, 555, and 620 nm).
Using linear regression methods of single-variable functions, the following equations approximating these relationships were determined:
The scatter of points on all graphs took a similar form and the dependence had a linear course; there were differences only in the slope. The values of the remote sensing reflectance obtained from MC simulations changed within the range of one order of magnitude only for 620 nm. For the rest of the wavelengths, they lay within the same order of magnitude. However, the values of the bb/a + bb ratio changed within one order of magnitude for almost all wavelengths, i.e., for 420 nm, 488 nm, and 620 nm. Only for the 555 nm wavelength did they lie within the same order of magnitude. Moreover, the slope of the line approximation by Equations (7)–(10) increased with the increase in wavelength.
The results based on Rrs values obtained from MC simulations and ratio bb/(a + bb)and using regression methods of linear functions of one variable were calculated to obtain parameter k. The values of parameter k calculated using Equation (6) were as follows: 0.033 sr−1 for 420 nm, 0.052 sr−1 for 488 nm, 0.054 sr−1 for 555 nm and 0.081 sr−1 620 nm.
Figure 4 presents the statistical distribution of parameter k (the average values, median, range of variability, and outliers) for four wavelengths. The largest differences between the median and average for calculated parameter k values were observed for the wavelengths 620 nm and 555 nm; the values of median and average were 0.082 sr−1 and 0.085 sr−1 for 620 nm and 0.060 sr−1 and 0.062 sr−1 for 620 nm, respectively. For the 488 nm wavelength, the values of median and average were 0.057 sr−1 and 0.056 sr −1 and 0.060 sr−1 and for 420 nm, both values were the same, 0.034 sr −1.
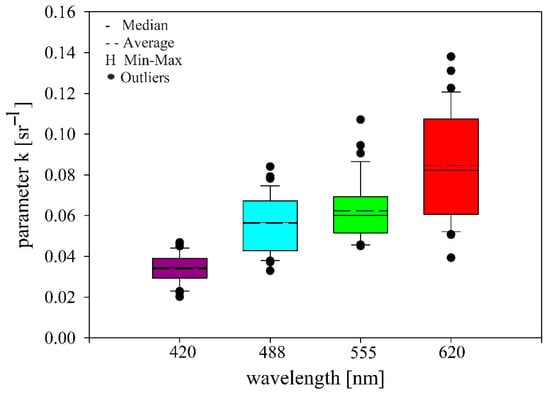
Figure 4.
The proxy parameter k calculated based on MC simulation and Morel’s algorithm for the waters of the Gulf of Gdansk for four wavelengths (420 nm, 488 nm, 555 nm, and 620 nm). Vertical bars depict the variation ranges, H depict min–max whiskers, dashes show average values, dashed lines depict medians, and black dots outliers. The vertical boundaries of the rectangles show the interquartile range (IQR) of 25–75%.
The value of parameter k increased with wavelength, with 620 nm having the highest values. Moreover, variability of this parameter was higher at longer wavelengths (especially for 620 nm), as evidenced by the broader interquartile range and the presence of more outliers (Figure 4). The presence of outliers may be due to systematic deviation resulting from environmental or measurement uncertainties.
5. Discussion
The analyses carried out to determine the parameter k values allowed us to determine values of Rrs(λ) based on the a and bb (according to Equations (7)–(10)). Graphical comparison of the Rrs values obtained from MC simulations with their respective values estimated using the k proxy parameter obtained by Equations (7)–(10) for four wavelengths and ratio distribution histograms (Rrs_k(λ)/Rrs_MC(λ)) are presented in Figure 5, Figure 6 and Figure 7. Statistical errors (according to linear and logarithmic statistics) of these estimates were also determined (Table 1 and Table 2).
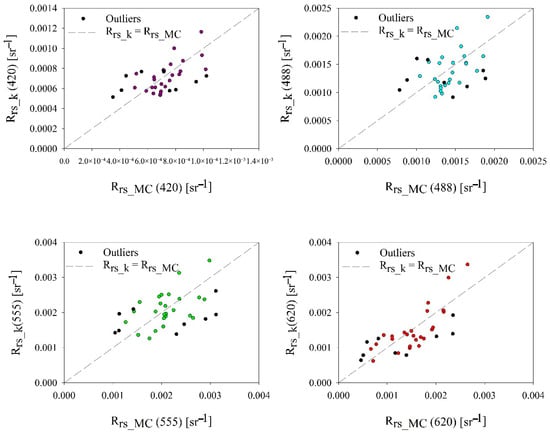
Figure 5.
Comparison of the modeled Rrs_MC(λ) and calculated Rrs_k(λ) (Equations (7)–(10)) for four wavelengths (λ = 420 nm, 488 nm, 555 nm, and 620 nm) at selected areas of the Gulf of Gdansk. The dashed line represents the function (Rrs_k(λ) = Rrs_MC(λ)). The black dots represent outliers.
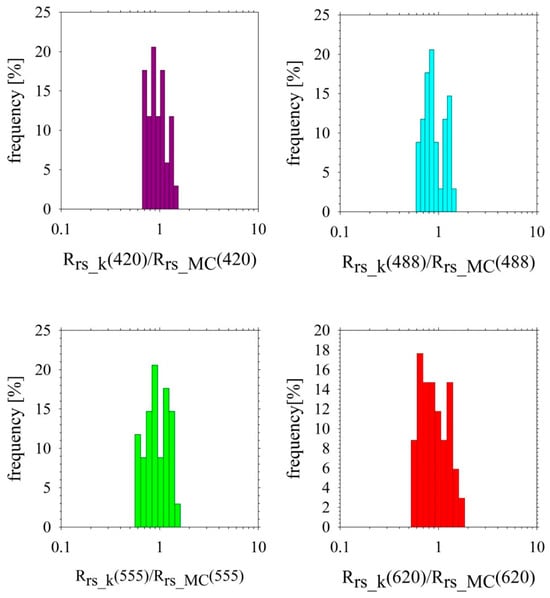
Figure 6.
The probability distribution of the ratio of calculated Rrs_k(λ) using the proxy parameter k to model Rrs_MC(λ) obtained from MC simulations (for all 34 datasets).
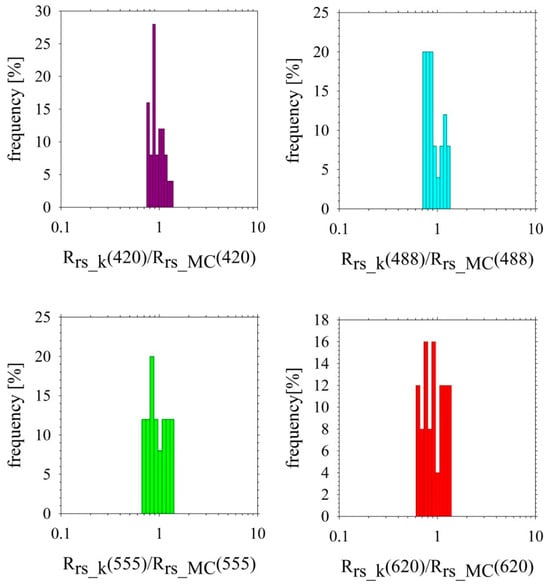
Figure 7.
The probability distribution of the ratio of calculated Rrs_k(λ) using the proxy parameter k to model Rrs_MC(λ) obtained from MC simulations (without outliers, for 25 datasets).

Table 1.
The relative errors of the Rrs(λ) coefficients for selected stations in the Gulf of Gdansk (for the wavelengths 420, 488, 555, and 620 nm) calculated using the proxy parameter k (for all 34 datasets).
Table 2.
The relative errors of the Rrs(λ) coefficients for selected stations in the Gulf of Gdansk (for the wavelengths 420, 488, 555, and 620 nm) calculated using the proxy parameter k (without outliers, for 25 datasets).
The dashed line in Figure 5 in each scatter plot for four wavelengths represents the function Rrs_k(λ) = Rrs_MC(λ), i.e., the ideal 1:1 relationship, where Rrs_k(λ) = Rrs_MC(λ), serving as a reference for assessing the accuracy of the proxy-based calculations. The black dots indicate outliers, highlighting instances where the discrepancy between the modeled and calculated reflectance is significant. At shorter wavelengths (420 nm and 488 nm), Rrs_k aligned more closely with Rrs_MC, indicating good model performance. At longer wavelengths (555 nm and 620 nm), deviations from the 1:1 line increased, suggesting higher errors in the proxy-based reflectance estimation. The spread of points indicates systematic differences between the two methods, which may be influenced by wavelength-dependent variations in scattering and absorption properties.
Figure 6 illustrates the probability distribution of the ratio between the calculated and modeled reflectance values across 34 datasets, encompassing all available data, including outliers. The distribution provides insight into the accuracy and consistency of the proxy-based approach relative to the MC simulations. For 420 nm, the distribution is quite narrow, and there is a slight dispersion around the value of 1. In addition, several bars are off the close center, suggesting some deviation. For 488 nm, the distribution is more concentrated around the value of 1 and has less deviation to the sides. The distribution for 488 nm shows the best fit of all wavelengths. The tall bars in the close center indicate a better fit. For 555 nm, the distribution is minimally wider than the distribution for 488 nm. It further shows good matching, but minimally weaker than for 488 nm. The worst matching shows the distribution for 620 nm is widest and the high bars are not concentrated around the value of 1.
The statistical analysis of the relative errors in Rrs(λ) coefficients for the selected stations in the Gulf of Gdańsk provides quantitative insights into the accuracy of the proxy-based calculations (Table 1 and Table 2).
To assess the uncertainty of the estimation of the Rrs(λ) calculated based on the proxy parameter k, the following arithmetic and logarithmic statistical metrics were used (Zi,m—modeled values of Rrs(λi); Zi,c—estimated values of Rrs(λi)):
- Relative mean error
- RMSE—root mean square error of ε
- Mean logarithmic error
- Standard error factor
- Statistical logarithmic errors
- Zi,m—modeled values of Rrs(λi); Zi,c—estimated values of Rrs(λi)
For the complete dataset (including outliers) (Table 1), the relative mean error (ε) varies across wavelengths, with the highest error observed at 620 nm (5.31%) and the lowest at 488 nm (1.96%). The root mean square error (RMSE) of the relative error is largest for 620 nm (36.17%), indicating greater variability in the accuracy of the proxy approach at longer wavelengths. The mean logarithmic error (εg) remains close to zero, suggesting no systematic bias in the logarithmic space. The standard error factor (x) increases with wavelength, from 1.24 at 420 nm to 1.38 at 620 nm, reflecting increased uncertainty at longer wavelengths (except for the wavelength 488 nm, for which it is 1.22). The statistical logarithmic errors (σ+ and σ−) indicate a higher deviation in positive error values than in negative errors, especially for 620 nm, where the upper bound (σ+ = 37.76) is significantly higher than the lower bound (σ− = −27.41).
Figure 7 presents the same probability distribution as Figure 6, but after the removal of outliers, resulting in a dataset of 25 samples. The outliers were identified and removed using a standard interquartile range (IQR) criterion, corresponding to the graphical representation in Figure 4. Specifically, a value of k was classified as an outlier if it fell outside the interval [Q1 − 1.5 IQR, Q3 + 1.5 IQR], where Q1 and Q3 denote the first and third quartiles of the distribution. Furthermore, the removed outliers corresponded to physically implausible deviations likely resulting from environmental or measurement uncertainties, particularly at longer wavelengths (e.g., 620 nm), where reduced absorption and increased scattering make the system more sensitive to variations in particle backscattering and the high optical dynamics of the Gulf of Gdańsk.
The exclusion of outliers led to a more concentrated distribution for all wavelengths, with the probability more closely centered around 1. For this reduced dataset, the probability distribution for 488 nm also gave the best results, and for 620 nm it was the most difficult to obtain a close match (Table 2). This suggests an improved agreement between the calculated and modeled reflectance values when extreme deviations were excluded.
The removal of outliers resulted (filtered dataset without outliers, Table 2) in a significant reduction in relative mean error, with the maximum error dropping to 2.83% at 620 nm. The RMSE values were substantially lower, improving from 36.17% to 26.29% at 620 nm, indicating a stronger correlation between the proxy-based and MC results. The standard error factor (x) decreased for all wavelengths, with the most considerable improvement at 620 nm (from 1.38 to 1.27). The σ+ and σ− were notably lower, reflecting a more consistent and reliable estimation of Rrs(λ) after outlier exclusion.
The observed increase in the scaling factor k with wavelength indicates that the efficiency of reflectance retrieval is wavelength-dependent. Longer wavelengths exhibited higher k values, likely due to reduced absorption and increased scattering effects. However, the increased spread and presence of outliers at longer wavelengths suggest that uncertainties in reflectance modeling grow with wavelength. Comparisons between Rrs_k and Rrs_MC demonstrate that the proxy-based method provides a reasonable approximation at shorter wavelengths but becomes less accurate at longer wavelengths. This discrepancy could arise due to several factors. The first of these is increased multiple scattering at longer wavelengths. Higher k values at longer wavelengths suggest increased contributions from multiple scattering, which may not be fully accounted for in the proxy model. The second of these is measurement and model assumptions. The assumptions made in deriving Rrs_k may not fully capture the complexities of light interaction at longer wavelengths. The third one is variability in water optical properties. Natural variability in absorption and scattering properties of water could introduce deviations in Rrs_MC and Rrs_k. The Gulf of Gdansk exhibits considerable variability in biogeochemical properties (such as chlorophyll a concentration (Chl a) and suspended particulate matter (SPM)), which significantly influence its optical properties. Therefore, Table 3, as a supplement to the above analyses, presents maximum (Max), minimum (Min), median, mean, standard deviation (SD), and coefficients of variation (CV) values of the absorption coefficients of particles and CDOM (as gelbstoff) (apg), the scattering coefficients by particles (bp) and the backscattering coefficients by particles (bbp) for four wavelengths 420, 488, 555, and 620 nm, calculated for 34 samples.
Table 3.
Statistical summary of absorption coefficients of particles and CDOM (apg), the scattering coefficients by particles (bp) and the backscattering coefficients by particles (bbp) at selected wavelengths, calculated for 34 samples, measured in the surface waters of the Gulf of Gdańsk.
The values of the apg(λ), bp(λ) and bbp(λ) obtained for all 34 samples show variability of the range of one order of magnitude; only values of apg for 620 nm had the same range (min = 0.102 m−1 and max = 0.869 m−1), while values of bbp for 420 nm even differed by two orders of magnitude (min = 0.006 m−1 and max = 0.106 m−1). The variability in IOPs across samples implies that remote sensing applications in this area require locally tuned bio-optical models to account for spatial heterogeneity.
Moreover, one of the distinct features seen in Table 3 is high absorption in the blue region (420 nm), decreasing toward the red (620 nm), which is consistent with the optical properties of both CDOM and phytoplankton pigments that strongly absorb in the UV-blue region. The greatest variability in absorption was also observed at 420 nm (SD = 0.684 m−1), which might indicate spatial heterogeneity in CDOM and phytoplankton concentrations. As the wavelength increased, both mean absorption and variability decreased, which in turn may suggest less influence of chromophoric substances in the red region.
The scattering coefficients bp(λ) were consistently high across all wavelengths, which might indicate a substantial and persistent presence of suspended particulate matter (both organic and inorganic). The mean values of bp were very similar across wavelengths (~1.1 m−1), showing little spectral dependence, typical of non-selective Mie scattering by large particles. The standard deviation of bp was in range of 0.668–0.702 m−1, moderately high and stable across all wavelengths, which might reflect consistent spatial differences in particle concentrations.
Values of light backscattering bbp were low (mean values between 0.013–0.031 m−1), which is typical for natural waters. The highest mean bbp value occurred at 420 (0.031 m−1).Variability (SD) of bbp was greatest at 420 nm (0.023 m−1), which might suggest more heterogeneity in the composition or structure of particulate matter affecting blue light backscattering. Moreover, all parameters showed variability of an order of magnitude, values of apg(λ) were in the range of 0.30—0.60 m.
Furthermore, Table 3 shows that the highest CV values were obtained for bbp, with the greatest relative variability at bbp(620) (CV = 84%), next at bbp(488) (CV = 81%), followed by bbp(555) (CV = 79%), and bbp(420) (CV = 75%). This indicate that backscattering is highly variable in the Gulf of Gdańsk waters, reflecting differences in particle size distribution, composition, and refractive index, particularly at longer wavelengths. On the other hand, the lowest variability (CV = 49%) occurred at apg(420), where CDOM typically dominates absorption. The conducted analyses show that the surface waters of the Gulf of Gdańsk exhibit moderate variability in absorption properties but high variability in scattering and backscattering coefficients, particularly at longer wavelengths. These results suggest that this area is influenced by dynamic biogeochemical processes and multiple sources of particulate matter, contributing to complex and variable optical conditions. The significant variability in backscattering, particularly in red wavelengths, may suggest the influence of heterogeneous particulate matter, possibly due to riverine inputs, sediment resuspension, or seasonal biological productivity.
Moreover, Figure 8 shows the ternary diagrams illustrating the relative contribution of three key optical components: phytoplankton pigments, non-algal particles, and CDOM to the total absorption by non-water constituents at four wavelengths (420 nm, 488 nm, 555 nm, and 620 nm) measured in the surface waters of the Gulf of Gdańsk for 34 samples. These water samples were collected simultaneously and at the same locations as the measurements of apg, bp, and bbp. The absorption coefficients of CDOM (acdom(λ)) were obtained using spectrophotometric analysis followed by two-step filtration [57]. The absorption coefficients of phytoplankton (aph(λ)) and the absorption coefficients of non-phytoplankton pigments (ad(λ)) were measured using spectrophotometric tests with the Whatman GF/F filter pad technique [58] and depigmentation with sodium hypochloride [2]. Diagrams in Figure 8 provide insight into the dominant light-absorbing substances in the Gulf of Gdańsk.
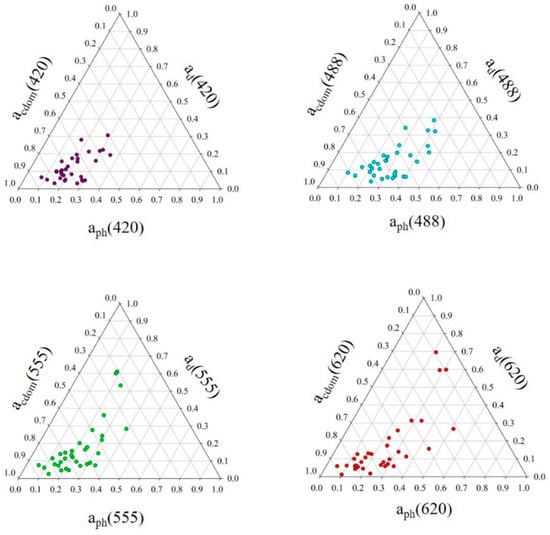
Figure 8.
Ternary diagrams illustrate the relative contribution of phytoplankton pigments, non-phytoplankton pigments, and CDOM, to the total absorption by non-water constituents at four wavelengths in selected areas of the Gulf of Gdansk. The relative contribution of each component was determined as the ratio of its absorption coefficient (e.g., ad(λ)) to the sum of the absorption coefficients of all three components (aph(λ) + ad(λ) + acdom(λ)).
Figure 8 shows a clear dominance of CDOM at 420 nm. The points in the diagram for 420 nm cluster near the acdom axis, indicating that CDOM contributes the most to total absorption in this wavelength. For 488 nm, we observed more balanced contributions. The ternary plot for 488 nm shows a more distributed pattern between aph, ad, and acdom. While CDOM still plays a role, there is a more noticeable contribution from phytoplankton absorption, reflecting the characteristic Chl a absorption peak around this wavelength. For 555 nm, the distribution shifts towards the aph axis, indicating that aph becomes relatively more significant at this wavelength. The 620 nm diagram suggests a substantial contribution from non-algal particles, likely due to detrital and mineral particles that absorb light in the red region.
Moreover, the relative dominance of CDOM in the blue wavelengths suggests a significant input of dissolved organic matter, possibly from riverine (Vistula River) or terrestrial sources. The increasing contribution of aph at longer wavelengths reflects the presence of phytoplankton populations, which influence optical properties and primary productivity. The role of ad at 620 nm indicates the influence of inorganic particulate matter, which may result from sediment resuspension or anthropogenic activities.
The obtained IOP values reflect a combination of water quality parameters. For instance, Chl a concentration is a primary determinant of aph, while SPM and its components significantly affect both absorption and scattering properties of the water. Therefore, Table 4 presents descriptive statistics for key water quality parameters Chl a, SPM, and its organic (SPMorg) and inorganic (SPMinorg) fractions in the Gulf of Gdańsk, obtained for all 34 datasets. The water samples for this analysis were collected simultaneously and at the same locations as the measurements of all IOPs. The values of Chl a were determined using absorption spectrum of the pigment ethanol extract [59], while mass concentration of suspended particulate matter SPM and its organic and inorganic fractions were determined using the standard gravimetric method [60].
Table 4.
Water quality parameter descriptive statistics (standard deviation (SD), coefficients of variation (CV)) for sampling collected from Gulf of Gdańsk.
In Table 4, the parameter with the highest value is Chl a, with a maximum concentration of 31.15 mg L−1. Meanwhile, the parameter with the lowest coefficient of variation CV is SPM, with a CV of 57%, indicating the least relative variability among the measured parameters.
Table 4 shows that the Gulf of Gdansk exhibits considerable variability in phytoplankton biomass and SPM, which significantly influence its optical properties. This reservoir is characterized by high variability in Chl a. Chl a ranges from 1.27 to 31.15 mg L−1, with a mean of 8.61 mg L−1 and a coefficient of variation CV of 98%. This significant variability suggests dynamic phytoplankton populations, likely influenced by factors such as nutrient availability, light conditions, and seasonal changes. SPM concentrations vary between 0.82 and 7.07 mg L−1, averaging 2.80 mg L−1 with a CV of 57%. The SPMorg constitutes a substantial part of the total SPM, with concentrations ranging from 0.41 to 5.85 mg L−1 and a CV of 62%. This indicates a predominance of organic material, likely from phytoplankton and detritus. The SPMinorg shows concentrations between 0.13 and 2.84 mg L−1, with a higher CV of 94%, reflecting episodic inputs from sediment resuspension or Vistula inflows.
The variability in Chl a and SPM directly affects the IOPs, including absorption and backscattering coefficients. Elevated phytoplankton biomass increases absorption, particularly in the blue and red wavelengths, while higher SPM levels enhance scattering, influencing water clarity and light penetration.
6. Conclusions
This study evaluated the relationship between Rrs and optical properties using MC simulations. It has been shown that the proxy parameter k increases with wavelength, with higher variability at longer wavelengths. Therefore, the proxy model provides a good approximation of Rrs at shorter wavelengths but becomes less reliable at longer wavelengths.
The proxy-based method provides a reasonable estimation of Rrs(λ), but its accuracy varies across wavelengths. The best agreement with MC simulations was observed at 488 nm, while the largest discrepancies occurred at 620 nm. Outliers significantly impacted the statistical performance of the model. When extreme deviations were removed, the probability distribution became more centered around 1, and the error metrics improved substantially at higher wavelengths (e.g., 620 nm) exhibiting larger variability and relative errors, likely due to increased sensitivity to water optical properties such as backscattering and absorption variations, which are related to the high dynamics of the waters of the Gulf of Gdańsk. After outlier removal, the relative mean error decreases, the RMSE improves, and the logarithmic statistical errors became more balanced, supporting the validity of the proxy approach under standard conditions.
These findings indicate that while the proxy-based calculation of Rrs(λ) is a useful tool, careful data filtering and wavelength-dependent adjustments are essential for improving accuracy, especially in optically complex waters like the Gulf of Gdańsk. Future improvements to the model should consider wavelength-dependent scattering effects and refine assumptions to enhance accuracy. Moreover, research should focus on refining the proxy-based approach by incorporating additional environmental factors and improving calibration against in situ measurements. Understanding these relationships will improve remote sensing applications in aquatic environments, enhancing the accuracy of ocean color retrieval algorithms.
The results obtained show the possibilities of improving the accuracy of remote sensing reflectance algorithms, especially in optically complex coastal waters. Moreover, these findings demonstrate the importance of optimizing preprocessing steps, such as the detection and removal of outliers, prior to the algorithmic inversion of satellite data. Ultimately, these studies will allow for reliable monitoring of water quality in environments characterized by high temporal and spatial variability.
These studies focused on a specific area; that is, the waters of the Gulf of Gdansk. However, we do not know what values of the parameter k would be obtained with another series of data from both this area and other locations. It is possible that the value of this parameter may also depend on the season (temporary blooms affecting the value of absorption and scattering coefficients). The conducted research is the basis for further development of science on this topic. The results provide a basis for further analysis of the determination of Rrs(λ) under conditions independent of lighting and weather.
Author Contributions
Conceptualization, B.L. and Z.O.; methodology, B.L. and Z.O.; formal analysis, B.L., investigation, B.L., Z.O., and S.S.; data curation, B.L., Z.O., and S.S.; software, J.P., writing original draft preparation, B.L.; writing review and editing, Z.O.; visualization, B.L. and Z.O. All authors have read and agreed to the published version of the manuscript.
Funding
This research received no external funding.
Data Availability Statement
The raw data supporting the conclusions of this article will be made available by the authors on request.
Acknowledgments
This research was supported by the National Science Centre, Poland, under grant 2023/49/B/ST10/02193. The authors would like to thank their colleagues from IOPAN: Justyna Meler, Joanna Stoń-Egiert, Agnieszka Zdun, Mirosława Ostrowska, Sławomir Bogdan Woźniak, Piotr Kowalczuk, and Mirosław Darecki for their help in the field and laboratory measurements.
Conflicts of Interest
The authors declare no conflicts of interest.
Abbreviations
The following abbreviations are used in this manuscript:
| IOPs | inherent optical properties |
| AOPs | apparent optical properties |
| MC | Monte Carlo simulation |
| CDOM | colored dissolved organic matter |
| SPM | suspended particulate matter (mg L−1) |
| SPMinorg | inorganic fraction of suspended particulate matter (mg L−1) |
| SPMorg | organic fraction of suspended particulate matter (mg L−1) |
| Chl a | concentration of chlorophyll a (mg L−1) |
| a(λ) | total absorption coefficient of seawater (m−1) |
| aw(λ) | absorption coefficient of pure water (water molecules) (m−1) |
| aCDOM(λ) | absorption coefficient of CDOM (m−1) |
| aph(λ) | absorption coefficients of phytoplankton (m−1) |
| ad(λ) | absorption coefficients of non-phytoplankton pigments (m−1) |
| apg(λ) | absorption coefficients of particles and CDOM (dissolved and suspended constituents of seawater: phytoplankton, non-phytoplankton and CDOM) (m−1) |
| b(λ) | total scattering coefficient of seawater (m−1) |
| bw(λ) | scattering coefficient of pure water (water molecules) (m−1) |
| bp(λ) | scattering coefficient by suspended constituents of seawater (m−1) |
| bb(λ) | total backscattering coefficient of seawater (m−1) |
| bbw(λ) | backscattering coefficient of pure water (water molecules) (m−1) |
| bbp(λ) | backscattering coefficients by particles (m−1) |
| cpg(λ) | attenuation coefficients by dissolved and suspended constituents of seawater (m−1) |
| Lu(λ) | upwelling radiance [W m−2 sr−1] |
| Ed(λ) | downwelling irradiance [W m−2] |
| β(λ) | volume scattering function [m−1 sr−1] |
| f | anisotropy factor of the light filed in the water |
| Q | bidirectionality factor dimensionless |
| k | proxy parameter [sr−1] |
| Rrs(λ) | remote sensing reflectance [sr−1] |
| Rrs_MC(λ) | remote sensing reflectance calculated using MC [sr−1] |
| Rrs_k(λ) | remote sensing reflectance calculated using proxy parameter k [sr−1] |
| Rrs_unprox(λ) | unscaled value of remote sensing reflectance |
References
- Lo Prejato, M.; McKee, D.; Mitchell, C. Inherent optical properties-reflectance relationships revisited. J. Geophys. Res. Ocean. 2020, 125, e2020JC016661. [Google Scholar] [CrossRef]
- Lednicka, B.; Kubacka, M. Semi-empirical model of remote-sensing reflectance for chosen areas of the southern Baltic. Sensors 2022, 22, 1105. [Google Scholar] [CrossRef] [PubMed]
- Gordon, H.R.; Brown, O.B.; Jacobs, M.M. Computed relationship between the inherent and apparent optical properties of a flat homogeneous ocean. Appl. Opt. 1975, 14, 417–427. [Google Scholar] [CrossRef]
- Morel, A.; Prieur, L. Analysis of variations in ocean color. Limnol. Oceanogr. 1977, 22, 709–722. [Google Scholar] [CrossRef]
- Kirk, J.T.O. Light Photosynthesis in Aquatic Ecosystems; Cambridge University Press: Cambridge, UK, 1994. [Google Scholar]
- Gordon, H.R.; Brown, O.B.; Evans, R.H.; Brown, J.W.; Smith, R.C.; Baker, K.S.; Clark, D.K. A semianalytic radiance model of ocean color. J. Geophys. Res. 1988, 93, 10909–10924. [Google Scholar] [CrossRef]
- Gordon, H.R. Inverse methods in hydrologic optics. Oceanologia 2002, 44, 9–58. [Google Scholar]
- Lee, Z.P.; Carder, K.L.; Arnone, R. Deriving inherent optical properties from water color: A multi-band quasi-analytical algorithm for optically deep waters. Appl. Opt. 2002, 41, 5755–5772. [Google Scholar] [CrossRef]
- Albert, A.; Mobley, C. An analytical model for subsurface irradiance and remote sensing reflectance in deep and shallow case-2 waters. Opt. Express 2003, 11, 2873–2890. [Google Scholar] [CrossRef] [PubMed]
- Park, Y.-J.; Ruddick, K. Model of remote-sensing reflectance including bidirectional effects for case 1 and case 2 waters. Appl. Opt. 2005, 44, 1236–1249. [Google Scholar] [CrossRef]
- IOCCG Report 5. In Remote Sensing of Inherent Optical Properties: Fundamentals, Tests of Algorithms, and Applications; Lee, Z.P., Ed.; IOCCG: Dartmouth, UK, 2006; p. 126. [Google Scholar]
- Van der Woerd, H.; Pasterkamp, R. HYDROPT: A fast and flexible method to retrieve chlorophyll-a from multispectral satellite observations of optically complex coastal waters. Remote Sens. Environ. 2008, 112, 1795–1807. [Google Scholar] [CrossRef]
- Liu, C.C.; Miller, R.L. Spectrum matching method for estimating the chlorophyll-a concentration, CDOM ratio, and backscatter fraction from remote sensing of ocean color. Can. J. Remote Sens. 2008, 34, 343–355. [Google Scholar] [CrossRef]
- Hirata, T.; Højerslev, N.K. Relationship between the irradiance reflectance and inherent optical properties of seawater. J. Geophys. Res. Ocean. 2008, 113. [Google Scholar] [CrossRef]
- Li, L.; Stramski, D.; Darecki, M. Characterization of the Light Field and Apparent Optical Properties in the Ocean Euphotic Layer Based on Hyperspectral Measurements of Irradiance Quartet. Appl. Sci. 2018, 8, 2677. [Google Scholar] [CrossRef]
- Konik, M.; Kowalczuk, P.; Zabłocka, M.; Makarewicz, A.; Meler, J.; Zdun, A.; Darecki, M. Empirical Relationships between Remote-Sensing Reflectance and Selected Inherent Optical Properties in Nordic Sea Surface Waters for the MODIS and OLCI Ocean Colour Sensors. Remote Sens. 2020, 12, 2774. [Google Scholar] [CrossRef]
- Lednicka, B.; Kubacka, M.; Freda, W.; Haule, K.; Ficek, D.; Sokólski, M. Multi-Parameter Algorithms of Remote Sensing Reflectance, Absorption and Backscattering for Coastal Waters of the Southern Baltic Sea Applied to Pomeranian Lakes. Water 2023, 15, 2843. [Google Scholar] [CrossRef]
- Wang, H.; Zhang, W.; Xu, Y.; Li, H.; Ren, P. WaterCycleDiffusion: Visualtextual fusion empowered underwater image enhancement. Inf. Fusion 2026, 127, 103693. [Google Scholar] [CrossRef]
- Steemann Nielsen, E. The Annual Amount of Organic Matter Produced by the Phytoplankton in the Sound off Helsingor. Meddelelserfra Komm. Dan. Fisk. Havundersogelser. Ser. Plankton 1937, 3, 1–37. [Google Scholar]
- Steemann Nielsen, E.; Jensen, E. Primary Ocean Production. The Autotrophic Production of Organic Matter in the Oceans. Galathea Rep. 1957, 1, 49–136. [Google Scholar]
- Steemann Nielsen, E. Productivity, Definition and Measurement; Hill, M.N., Ed.; In The Sea; Wiley: London, UK, 1963; Volume 1, pp. 129–164. [Google Scholar]
- Blondeau-Patissier, D.; Gower, J.F.R.; Dekker, A.G.; Phinn, S.R.; Brando, V.E. A review of ocean color remote sensing methods and statistical techniques for the detection, mapping and analysis of phytoplankton blooms in coastal and open oceans. Prog. Oceanogr. 2014, 123, 123–144. [Google Scholar] [CrossRef]
- Lednicka, B.; Otremba, Z.; Piskozub, J. Modelling the upwelling radiance detected in a seawater column for oil-in-water emulsion tracking. Sci. Rep. 2023, 13, 23098. [Google Scholar] [CrossRef]
- Lednicka, B.; Otremba, Z.; Piskozub, J. Vector irradiance modelling in a seawater column for assessing the detection capabilities of an oil-in-water emulsion. Opt. Express 2024, 32, 29424–29435. [Google Scholar] [CrossRef] [PubMed]
- Wang, H.; Sun, S.; Ren, P. Underwater Color Disparities: Cues for Enhancing Underwater Images Toward Natural Color Consistencies. IEEE Trans. Circuits Syst. Video Technol. 2024, 34, 738–753. [Google Scholar] [CrossRef]
- Jerlov, N.G. Optical Oceanography; American Elsevier Publishing Co., Inc.: New York, NY, USA, 1968. [Google Scholar]
- Gordon, H.R.; Morel, A. Remote Assessment of Ocean Color for Interpretation of Satellite Visible Imagery: A Review; Springer: New York, NY, USA, 1983. [Google Scholar]
- Preisendorfer, R.W. Hydrologic Optics; National Technical Information Service: Springfield, VA, USA, 1976; Volume 1–6.
- Dera, J. Marine Physics, 2nd ed.; PWN: Warszawa, Poland, 2003. [Google Scholar]
- Reinart, A.; Kutser, T. Comparison of different satellite sensors in detecting cyanobacterial bloom events in the Baltic Sea. Remote Sens. Environ. 2006, 102, 74–85. [Google Scholar] [CrossRef]
- Zibordi, G.; Berthon, J.F.; Melin, F.; D’Alimonte, D.; Kaitala, S. Validation of satellite ocean color primary products at optically com- plex coastal sites: Northern Adriatic Sea, northern Baltic Proper, Gulf of Finland. Remote Sens. Environ. 2009, 113, 2574–2591. [Google Scholar] [CrossRef]
- Lu, Y.; Shi, J.; Hu, C.; Zhang, M.; Sun, S.; Liu, Y. Optical interpretation of oil emulsions in the ocean—Part II: Applications to multi-band coarse-resolution imagery. Remote Sens. Environ. 2020, 242, 111778. [Google Scholar] [CrossRef]
- Hu, C. Remote detection of marine debris using satellite observations in the visible and near infrared spectral range: Challenges and potentials. Remote Sens. Environ. 2021, 259, 112414. [Google Scholar] [CrossRef]
- Hu, C.; Qi, L.; Xie, Y.; Zhang, S.; Barnes, B.B. Spectral characteristics of sea snot reflectance observed from satellites: Implications for remote sensing of marine debris. Remote Sens. Environ. 2022, 269, 112842. [Google Scholar] [CrossRef]
- O’Shea, R.E.; Pahlevan, N.; Smith, B.; Boss, E.; Gurlin, D.; Alikas, K.; Kangro, K.; Kudela, R.M.; Vaičiūtė, D. A hyperspectral inversion framework for estimating absorbing inherent optical properties and biogeochemical parameters in inland and coastal waters. Remote Sens. Environ. 2023, 295, 113706. [Google Scholar] [CrossRef]
- Kubelka, P.; Munk, F. Ein Beitrag Zur Optik Der Farbanstriche. Z. Für Tech. Phys. 1931, 12, 593–601. [Google Scholar]
- Morel, A.; Gentili, B. Diffuse reflectance of oceanic waters II: Bidirectional aspects. Appl. Opt. 1993, 32, 6864–6879. [Google Scholar] [CrossRef]
- Lee, Z.P.; Carder, K.L.; Du, K.P. Effects of molecular and particle scatterings on model parameters for remote-sensing reflectance. Appl. Opt. 2004, 43, 4957–4964. [Google Scholar] [CrossRef] [PubMed]
- Morel, A.; Antoine, D.; Gentili, B. Bidirectional reflectance of oceanic waters: Accounting for Raman emission and varying particle scattering phase function. Appl. Opt. 2002, 41, 6289–6306. [Google Scholar] [CrossRef]
- Voss, K.J.; Morel, A. Bidirectional reflectance function for oceanic waters with varying chlorophyll concentrations: Measurements versus predictions. Limnol. Oceanogr. 2005, 50, 698–705. [Google Scholar] [CrossRef]
- D’Sa, E.J.; Miller, R.L. Bio-optical properties in waters influenced by the Mississippi River during low flow conditions. Remote Sens. Environ. 2003, 84, 538–549. [Google Scholar] [CrossRef]
- McClain, C.R.; Meister, G.; Monosmith, B. Satellite Ocean Color Sensor Design Concepts and Performance Requirements. In Experimental Methods in the Physical Sciences; Donlon, C., Parr, A., Eds.; Academic Press: Cambridge, UK, 2014; Volume 47, pp. 73–119. [Google Scholar]
- Werdell, P.J.; McKinna, L.I.W.; Boss, E.; Ackleson, S.G.; Craig, S.E.; Gregg, W.W.; Lee, Z.; Maritorena, S.; Roesler, C.S.; Rousseaux, C.S.; et al. An overview of approaches and challenges for retrieving marine inherent optical properties from ocean color remote sensing. Prog Oceanogr. 2018, 160, 186–212. [Google Scholar] [CrossRef]
- McClain, C.R.; Franz, B.A.; Werdell, P.J. Genesis and evolution of NASA’s satellite ocean color program. Front. Remote Sens. 2022, 3, 938006. [Google Scholar] [CrossRef]
- Ostrowska, M.; Ficek, D.; Stoltmann, D.; Ston-Egiert, J.; Zdun, A.; Kowalewski, M.; Zapadka, T.; Majchrowski, R.; Pawlik, M.; Dera, J. Ten years of remote sensing and analyses of the Baltic Sea primary production (2010–2019). Remote Sens. Appl. Soc. Environ. 2022, 26, 100715. [Google Scholar] [CrossRef]
- Hu, C.; Qi, L.; English, D.C.; Wang, M.; Mikelsons, K.; Barnes, B.B.; Pawlik, M.M. Pollen in the Baltic Sea as viewed from space. Remote Sens. Environ. 2023, 284, 113337. [Google Scholar] [CrossRef]
- Filipkowska, A.; Pavoni, B.; Kowalewska, G. Organotin compounds in surface sediments of the Southern Baltic coastal zone: A study on the main factors for their accumulation and degradation. Environ. Sci. Pollut. Res. 2014, 21, 2077–2087. [Google Scholar] [CrossRef] [PubMed]
- Pegau, W.; Gray, D.; Zaneveld, J. Absorption and attenuation of visible and nearinfrared light in water: Dependence on temperature and salinity. Appl. Opt. 1997, 36, 6035–6046. [Google Scholar] [CrossRef]
- Zaneveld, J.R.V.; Kitchen, J.C.; Moore, C. The scattering error correction of reflecting-tube absorption meters. Ocean. Opt. XII 1994, 2258, 44–55. [Google Scholar]
- Maffione, R.A.; Dana, D.R. Instruments and methods for measuring the backward scattering coefficient of ocean waters. Appl. Opt. 1997, 36, 6057–6067. [Google Scholar] [CrossRef]
- Dana, D.R.; Maffione, R.A. Determining the backward scattering coefficient with fixed-angle backscattering sensors—Revisited. In Proceedings of the Ocean Optics XVI Conference, Santa Fe, NM, USA, 18–22 November 2002. [Google Scholar]
- Pope, R.M.; Fry, E.S. Absorption spectrum (380–700 nm) of pure water. II. Integrating cavity measurements. Appl. Opt. 1997, 36, 8710–8723. [Google Scholar] [CrossRef]
- Morel, A. Optical properties of pure water and pure seawater. In Optical Aspects of Oceanography; Jerlov, N.G., Steeman, E., Eds.; Academic Press: London, UK, 1974; pp. 1–24. [Google Scholar]
- Petzold, T.J. Volume scattering functions for selected ocean waters. In Light in the Sea; Tyler, J.E., Ed.; Dowden Hutchinson and Ross: Stroudsburg, PA, USA, 1977. [Google Scholar]
- Cox, C.; Munk, W.H. Statistics of the sea surface derived from sun glitter. J. Mar. Res. 1954, 13, 198–227. [Google Scholar]
- Gregg, W.W.; Carder, K.L. A simple spectral solar irradiance model for cloudless maritime atmospheres. Limnol. Oceanogr. 1990, 35, 1657–1675. [Google Scholar] [CrossRef]
- Kowalczuk, P. The absorption of yellow substance in the Baltic Sea. Oceanol. 2002, 44, 287–288. [Google Scholar]
- Tassan, S.; Ferrari, G.M. An alternative approach to absorption measurements of aquatic particles retained on filters. Limnol. Ocean. 1995, 40, 1358–1368. [Google Scholar] [CrossRef]
- Pápista, É.; Ács, É.; Böddi, B. Chlorophyll-a determination with ethanol—A critical test. Hydrobiologia 2002, 485, 191–198. [Google Scholar] [CrossRef]
- Woźniak, S.B.; Darecki, M.; Zabłocka, M.; Burska, D.; Dera, J. New simple statistical formulas for estimating surface concentrations of suspended particulate matter (SPM) and particulate organic carbon (POC) from remote-sensing reflectance in the southern Baltic Sea. Oceanologia 2016, 58, 161–175. [Google Scholar] [CrossRef]


Disclaimer/Publisher’s Note: The statements, opinions and data contained in all publications are solely those of the individual author(s) and contributor(s) and not of MDPI and/or the editor(s). MDPI and/or the editor(s) disclaim responsibility for any injury to people or property resulting from any ideas, methods, instructions or products referred to in the content. |
© 2025 by the authors. Licensee MDPI, Basel, Switzerland. This article is an open access article distributed under the terms and conditions of the Creative Commons Attribution (CC BY) license.