Highlights
What are the main findings?
- Elevation-dependent divergence: Below 4000 m, snow cover area and depth both decrease. Above this threshold, the decrease in area slows, while snow depth significantly increases.
- Mechanistic shift: Snowmelt, peaking around 4000 m, governs these patterns. The dominant drivers transition from multi-factor synergy at lower elevations to a temperature-driven regime controlled by precipitation at higher elevations.
What are the implications of the main findings?
- This has further deepened our understanding of the snow–climate interactions in alpine regions, particularly the elevation-dependent mechanisms thereof.
- The study results have clear practical value for the water resource security and sustainable development in the Yarkand River Basin.
Abstract
Understanding the elevation-dependent response of mountain snow cover to climate change requires transcending statistical correlations to reveal the underlying physical mechanisms. This study investigates these mechanisms in the Upper Yarkand River Basin (U-YRB, located on the northwestern edge of the Qinghai–Tibet Plateau) from 2002 to 2020 by integrating a Gradient-Boosted Decision Tree (GBDT) model, a process-based degree-day model, and Structural Equation Modeling (SEM). Our analysis reveals a significant overall decline in Snow Cover Area (SCA) at a rate of −0.25%·a−1, with the rate of decrease accelerating below 4000 m but slowing above this threshold. Snow Depth (SD) exhibited a distinct elevation-dependent trend, decreasing at elevations below 3500 m while increasing above 4000 m. GBDT analysis quantified the shifting dominance of climatic drivers: temperature was the primary factor reducing SCA across all elevations, though its contribution diminished with increasing elevation. Precipitation played a critical yet contrasting role, emerging as the key positive driver for SD accumulation at high elevations (>4500 m). A comparative analysis of snowfall and snowmelt processes identified snowmelt as the key process governing elevation-dependent patterns, peaking around 4000 m. Crucially, SEM elucidated a mechanistic shift across the 4000 m threshold: below 4000 m, snow cover loss was primarily driven by temperature via its strong positive effect on snowmelt. Above 4000 m, while the influence of temperature persisted, the dominant positive effect of precipitation on snowfall became the key driver of the observed SD increase. This shift signals a fundamental transition from melt-dominated dynamics at lower elevations to accumulation-influenced dynamics at higher elevations. Our findings clarify the physical processes behind elevation-dependent snow cover changes and underscore the necessity of elevation-stratified frameworks for hydrological prediction and water resource management in alpine basins.
1. Introduction
Snow cover is an integral component of the cryosphere and exerts a strong influence on the global land surface energy balance and water cycle, owing to its high albedo, low thermal conductivity, and hydrological role during melt [1,2,3,4]. Therefore, a clear understanding of snow cover’s spatiotemporal variability is essential to assess regional climate change impacts and formulate sustainable water management strategies.
In the past decades, temperature rise on the Qinghai–Tibet Plateau (QTP) has accelerated in the context of global warming, leading to rapid melting of glaciers and permafrost, rising snow lines, reduced wetland areas, and ecological degradation [5,6]. Therefore, the spatial and temporal characteristics of snow cover and its associated mechanisms on the QTP are of great research significance [7,8]. Many studies have found the elevation dependency of snow cover change in QTP. Snow parameters were extracted and their spatial and temporal variations were analyzed using a daily cloud-free Moderate Resolution Imaging Spectroradiometer (MODIS) snow cover product, revealing vertical differences in the relationship between elevation and snow phenology [4]. Based on data from 103 meteorological stations on the QTP, the mean annual snow depth (SD) showed an increase from 1960 to 1982, followed by a decrease from 1983 to 2010 [9]. An analysis of the spatial and temporal distributions and trend characteristics of fractional snow cover (FSC) in seven basins on the upper QTP found that snow cover distribution was highly dependent on elevation, with higher FSC at higher elevations and a later onset of snowmelt [10]. In the QTP scale, the snow cover change displayed a trend of first increasing and then decreasing, and the temperature displayed a high correlation with the snow cover change. The mechanism of elevation dependency is not clear (just the Correlation analysis), so there are some studies at the basin scale to explore the reason/driver of the elevation dependency.
In mountainous regions, snow cover formation is closely linked to the 0 °C temperature threshold, and in the context of global warming, many studies have suggested that there will be a general decrease in snow cover with increasing temperatures [11,12,13]. However, an increase in precipitation due to warmer temperatures [14,15], especially at high elevations and high latitudes, will complicate the response of snow cover to global warming [16]. To date, many studies have been conducted on differences in snow cover variability across elevation gradients at local or regional scales. At the local scale, a systematic analysis of snow cover changes and their response to climate change over the QTP from 2001 to 2014 identified a positive feedback effect of snowfall on snow cover attenuation and a negative feedback effect of both rainfall and temperature. The positive feedback of snowfall increased significantly with elevation [17]. Analysis of the spatiotemporal variations in SD across the entire QTP and its climatic zones (1980–2014) showed that the observed reduction was mainly driven by increasing temperature, particularly at high elevations [18]. However, studies conducted at local scales often overlook geographical distinctions among basins when examining the elevation dependency of snow cover. Therefore, a more refined analysis of snow cover variations with elevation should be conducted at the basin scale. At the regional scale, studies have begun to unravel the complex interactions between snow cover, elevation, and climate. For instance, vertical differences in snow phenology and its climate response were explored using multi-source remote sensing data (2000–2019) from the northern slope of the central Tianshan Mountains [19]. Their findings revealed significant correlations between temperature/precipitation changes and most elevation-dependent snow phenology metrics (excluding high elevation SCD and SCOD), yet highlighted complex correlations arising from substantial temporal variations in these climatic drivers. Complementing this, a contrasting elevation pattern was documented in the Yellow River Basin, showing a decrease in snow cover at lower elevations but an increase at higher elevations [20]. Overall, these studies highlight the crucial role of elevation in regulating snow cover dynamics and have established important statistical associations with climatic factors. However, a comprehensive, process-based understanding of the elevation dependency is still lacking. Statistical correlations, while valuable for identifying patterns, are insufficient to: (1) quantify the shifting relative contributions of temperature, precipitation, and other drivers across elevations; and (2) reveal the reorganization of key physical processes (e.g., precipitation phase partitioning and snowmelt dynamics) with elevation that ultimately produces the observed snow cover patterns.
To directly address these gaps and move beyond statistical descriptions, this study focuses on the Upper Yarkand River Basin (U-YRB). We employ an integrated analytical framework designed to uncover the physical mechanisms behind elevation-dependent snow cover changes. The framework proceeds in three steps. First, a Gradient-Boosted Decision Tree model quantifies the shifting dominance of climatic drivers. Next, key snow processes—snowfall (simulated via a dual-threshold temperature partitioning scheme) and snowmelt (simulated via a process-based degree-day model)—are compared across elevations. Finally, Structural Equation Modeling (SEM) deciphers the causal pathways and mechanistic transitions linking meteorological drivers to snow cover through these intermediate processes. The specific objectives are to: (1) quantify the elevation-dependent trends in Snow Cover Area and Snow Depth; (2) assess the relative impacts of key climatic factors on SCA and SD changes across elevation zones; (3) compare the contrasting elevational patterns of snowfall and snowmelt and evaluate their combined role in shaping the observed snow cover characteristics; and (4) reveal the shifts in the dominant physical mechanisms governing snowmelt and accumulation above and below a critical elevation threshold. Through this comprehensive analysis, the study aims to advance a process-based understanding of snow–climate interactions, moving beyond statistical correlations to provide a robust scientific foundation for elevation-stratified water resource management in the Yarkand River Basin and similar mountainous regions.
2. Study Area and Data
2.1. Study Area
The U-YRB is located on the northwest edge of the QTP (Figure 1). Sheltered by the towering Tianshan Mountains, Pamir Plateau, and Karakoram Mountains, the basin is largely isolated from oceanic monsoonal influences, resulting in a typical continental arid to semi-arid climate. Consequently, the region’s climate and cryospheric dynamics are primarily governed by the mid-latitude westerly circulation, which dictates the advection of moisture and energy, forming the large-scale climatic backdrop for its snow cover evolution [21]. The basin covers a total area of approximately 9.88 × 10⁴ km2 and includes major tributaries such as the Keleqing River (upper reaches) and the Taxkorgan River (middle reaches). The mainstream originates from the northern slopes of the Karakoram Mountains, and runoff recharge exhibits strong glacial dependency. Monitoring data from the Kaqun Station indicate that glacier melt contributes about 64.0% of the multi-year average runoff, while mixed rain-snow recharge accounts for 13.4%, and groundwater recharge makes up 22.6% [22]. Snow distribution across the U-YRB shows pronounced vertical differentiation and aspect-controlled variability. Perennial snow cover is mainly concentrated above 5000 m a.s.l., with notable differences between slopes: the snow cover rate on northwest-facing slopes (52.8%) is about 1.6 times higher than on south-facing slopes (20.0%). This distinct spatiotemporal snow pattern, combined with the fact that over 64% of the basin’s runoff derives from glacial and seasonal snowmelt, renders snow cover dynamics a critical factor for regional ecological security and agricultural water supply. These characteristics also establish the U-YRB as an ideal region for investigating the elevation dependency of snow cover.
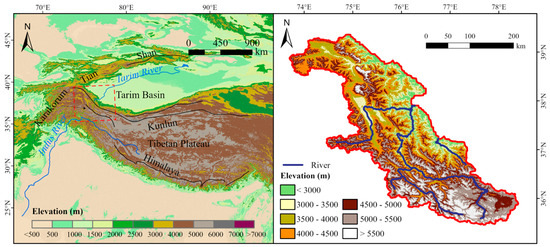
Figure 1.
Location and elevation distribution of the U-YRB. The basin boundary and river network were extracted from DEM using hydrological analysis (flow direction and flow accumulation). The red dashed rectangle in the left panel indicates the spatial extent of the study area shown in the right panel. The two rivers shown in the figure represent the main channel and a major tributary within the same basin, rather than two separate drainage basins.
2.2. Data
This study integrates multi-source remote sensing and reanalysis data from 2002 to 2020 to investigate snow cover dynamics. The primary datasets comprise: (1) daily fractional snow cover, (2) daily snow depth, (3) meteorological forcing data, and (4) daily land surface temperature. All datasets were reprojected and resampled to a consistent spatial grid to ensure analytical coherence. Detailed specifications of each dataset—including product name, spatial and temporal resolution, temporal coverage, and source—are provided in Table S1 (Supplementary Material).
2.2.1. Snow Cover Data
Snow cover data were obtained from the MODIS Daily Cloud-gap-filled Fractional Snow Cover Dataset of the Asian Water Tower Region (2000–2022), provided by the National Cryosphere Desert Data Center (http://www.ncdc.ac.cn) (Table S1) [23]. This dataset applies the MODAGE fractional snow cover inversion algorithm (MESMA-AGE) to Terra and Aqua MODIS surface reflectance version 6 data. It incorporates cloud-gap filling and spatiotemporal interpolation techniques to produce daily, seamless fractional snow cover products, which have been validated against ground observations and Landsat-8 imagery [24]. Considering the temporal coverage and availability of all datasets used in this study, we selected the 19-year period from 2002 to 2020 for analysis. SCA was extracted for each hydrological year, defined as the period from 1 September to 31 August of the following year. This dataset has been widely applied in regional studies and is considered reliable for the present analysis [25,26].
2.2.2. Snow Depth Data
Snow depth data were obtained from a daily 0.05° snow depth dataset for the Tibetan Plateau (2000–2021), available from the National Tibetan Plateau Data Center (http://data.tpdc.ac.cn). This dataset was produced by applying a spatiotemporal downscaling algorithm to an original 0.25° passive microwave snow depth product. The downscaling process uses the 8-day cloud-free MODIS Snow Cover Probability (SCP) as a high-resolution spatial weight to redistribute snow depth from each 0.25° pixel into its 25 constituent 0.05° sub-pixels, proportionally according to their SCP values. This approach effectively incorporates the spatial detail of optical remote sensing into the passive microwave product, yielding a snow depth dataset that has been validated to achieve significantly higher accuracy than the original coarse-resolution version [27].
2.2.3. Meteorological Data
Meteorological data were sourced from A High-Resolution Near-Surface Meteorological Forcing Dataset for the Third Pole Region (TPMFD, 1979–2023) [28]. This dataset provides a comprehensive suite of variables—including temperature, specific humidity, barometric pressure, wind speed, precipitation, and radiation—at a spatial resolution of 1/30° for the period 1979–2023. The TPMFD is recognized for its high reliability and accuracy over the Third Pole, achieved through the integration of short-term high-resolution WRF simulations, long-term ERA5 reanalysis, and dense station observations.
The processing methods for key variables are as follows: temperature, specific humidity, pressure, and wind speed were generated by merging short-term WRF simulations, ERA5 data, and station observations. Precipitation data are derived from the TPHiPr product, which was downscaled from ERA5 using high-resolution WRF simulations and machine learning, and subsequently fused with high-density station data. Downward shortwave radiation data integrate the ISCCP-ITP/ISCCP-ITP-CNN satellite retrievals with ERA5 to homogenize retrieval quality. Downward longwave radiation was calculated using the semi-physical CD99 model, based on the other processed meteorological variables (temperature, specific humidity, pressure, and shortwave radiation) [29,30,31].
2.2.4. Land Surface Temperature Data
Land surface temperature (LST) data were obtained from the Thermal and Reanalysis Integrating Moderate-resolution Spatial-seamless LST—Tibetan Plateau (TRIMS LST-TP) dataset, available from the National Tibetan Plateau/Third Pole Environment Data Center (http://data.tpdc.ac.cn) [32]. The dataset integrates Aqua MODIS LST products and GLDAS reanalysis data as primary inputs, with auxiliary data including satellite-derived vegetation indices and surface albedo. This fusion approach effectively combines the high-frequency signal from satellite thermal infrared observations with the low-frequency background and spatial coherence from reanalysis, resulting in a spatially seamless and temporally consistent LST product suitable for high-elevation environments [33,34].
3. Method
This study employed a multi-method approach to analyze the elevation-dependent snow cover dynamics in the U-YRB (Figure 2). The methodology comprised four key components: (1) quantifying the spatial-temporal trends of SCA and SD using the Sen’s slope method; (2) assessing the relative influence of climatic factors on snow cover changes across elevations using GBDT; (3) estimating snowfall through phase partitioning of precipitation; (4) calculating snowmelt using a degree-day model to assess snow mass balance; and (5) examining the causal pathways and mechanistic shifts through which key meteorological drivers affect snowmelt, snowfall, SCA, and SD across elevation gradients, using SEM.
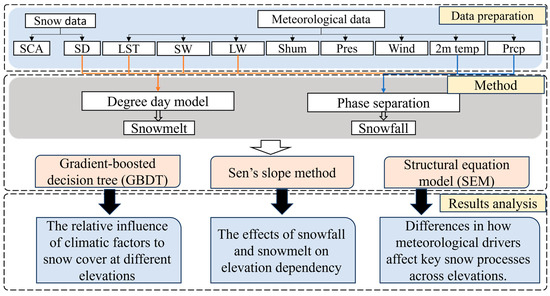
Figure 2.
Flowchart of the study workflow. (SCA: Snow Cover Area; SD: Snow Depth; LST: Land Surface Temperature; SW: Shortwave Radiation; LW: Longwave Radiation; Shum: Specific Humidity; Pres: Barometric Pressure; Wind: Wind Speed; 2 m temp: 2 m Air Temperature; Prcp: Precipitation).
3.1. Temporal Change Trend Analysis
A univariate linear regression model was used to analyze the temporal variation trend of SCA and SD, where the slope of the regression line quantifies the temporal variation rate, following Equation (1). The statistical significance of the derived trends was evaluated using the non-parametric Mann–Kendall test at the 95% confidence level (p < 0.05). In the corresponding figures, trends that are statistically significant (p < 0.05) are distinctly marked with darker colors.
where i is the serial number from 1 to 19 for the hydrological years from 2002 to 2020, and Xi is the pixel value in the ith year, representing the SCA, or SD. The greater the absolute value of slope, the faster the rate of change is indicated.
3.2. GBDT-Driven Factor Quantification
GBDT is a widely used machine learning algorithm for regression and classification, renowned for its high predictive accuracy and interpretability [35,36]. Its core mechanism involves sequentially combining multiple weak learners—typically decision trees—to form a powerful ensemble model. Through iterative gradient boosting, the model progressively minimizes a loss function to achieve optimal predictions. A key advantage of GBDT over traditional linear models lies in its ability to capture complex nonlinear relationships between dependent and independent variables without requiring prior assumptions about their functional form. Moreover, GBDT intrinsically provides variable importance estimates, which quantitatively indicate the relative contribution of each input feature to the prediction target. In this study, we leverage these attributes of the GBDT algorithm to evaluate the influence of different meteorological factors on snow cover changes.
3.3. Snowfall (Solid Precipitation) Calculation via Phase Partitioning
The snowfall (i.e., the water equivalent of solid precipitation reaching the surface) was derived from the TPMFD dataset by implementing a dual-threshold temperature phase partitioning scheme at the grid scale [37]. This method diagnoses the phase of precipitation input based on near-surface air temperature, and thus differs from the snow cover snow water equivalent (SWE) that is derived from snow depth and density. The partitioning is based on the following equation:
Psnow and P are snowfall and total precipitation, respectively (mm). Ts and Tl are the critical temperatures for snowfall and rainfall, which are 0 °C and 2 °C, respectively. These specific thresholds follow an established scheme [37], which has been demonstrated to be applicable through hydrological modeling in analogous arid basins of northwest China. This choice is fundamental to the analysis, as it directly governs the proportion of precipitation classified as snow, thereby fundamentally influencing the accuracy of estimated snow cover and all subsequent mass balance calculations.
3.4. Degree-Day-Based Snowmelt Estimation
Snowmelt is defined as the volume of water generated from the melting of snow cover over a given time period, representing a primary component of ablation in the snow mass balance and a key process in the hydrological cycle that influences runoff generation and water availability. In this study, daily snowmelt was simulated using an enhanced temperature-index model that incorporates radiative effects [38,39]. The model is formulated as follows:
where Tair is air temperature (°C). fM is the melt-rate factor (mm °C−1·d−1) and rsnow is the factor reflecting radiation absorption for snow (mm·(°C·d·W·m−2)−1), e is uniform snow of 1 mm; Sd illustrates SD with the unit mm. I refer to net radiation, which can be calculated using the following equation:
where SW↓ represents downwelling shortwave radiation (W·m−2). LW↓ downwelling longwave radiation (W·m−2), both obtained from the TPMFD. σ is the Stefan-Boltzmann constant, and Ts is the snow surface temperature. αsn refers to snow albedo, which can be calculated using the following equation:
For snow cover, the parameters used here are based on prior research conducted in this region, Td = −5 °C, T0 = 0 °C. αsn,min is 0.3, αsn,max is 0.8 [38].
3.5. Structural Equation Model
We utilized SEM with maximum likelihood estimation, a multivariate statistical approach for assessing causal relationships and latent structures among variables [40], to investigate the complex pathways through which meteorological factors influence snow-cover dynamics (Figure S1). When applying SEM, multicollinearity diagnosis and model-fit evaluation are essential for ensuring model robustness. High multicollinearity among predictors may distort path coefficients, causing certain factors to appear insignificant or invalid.
Model fit was assessed using widely accepted SEM approximate fit indices, including the standardized root mean square residual (SRMR), the comparative fit index (CFI), the root mean square error of approximation (RMSEA), and the chi-square (χ2) goodness-of-fit test with its p-value [41]. Generally, model performance improves when CFI and GFI values approach 1, RMSEA values approach 0, and SRMR values remain low. After screening the predictors using multicollinearity diagnostics, our final model retained four exogenous variables (temperature, precipitation, wind speed, and pressure) and four endogenous variables (snowmelt, snowfall, SCA, and SD), with snowmelt and snowfall treated as key mediators. Variables related to surface energy and moisture conditions, including downward shortwave radiation, downward longwave radiation, and specific humidity, were excluded due to severe multicollinearity—particularly their strong coupling with temperature at the daily timescale (Tables S2 and S3). All path coefficients were evaluated using a significance level of 95% (p < 0.05).
In SEM, the direct effect refers to the path coefficient linking two variables without mediation (e.g., temperature → snowmelt), whereas the indirect effect represents the influence transmitted through one or more mediators (e.g., temperature → snowmelt → SCA). The total effect is the sum of the direct and all indirect effects. Path coefficients were estimated using maximum likelihood estimation, and their significance (p < 0.05) was evaluated via bootstrapping with 5000 iterations. All SEM analyses were conducted in Python 3.9.
4. Results
4.1. Change Trend of Snow Cover in the U-YRB
During the 2002–2020 period, SCA and SD exhibited strong spatial heterogeneity across the U-YRB (Figure 3). High values of both SCA and SD were primarily distributed in the southwestern part of the basin, corresponding to the high-relief terrain of the Karakoram Mountains, whereas low values were found in the northeastern low-elevation plains (Figure 3a,c). This spatial pattern is not merely a function of geographic orientation but is predominantly controlled by topography: areas with higher elevations and rugged peaks retained more snow, while lower-elevation valleys and flatter terrain exhibited reduced snow cover. Consequently, snow distribution across the basin was highly uneven and showed a strong elevational dependence.
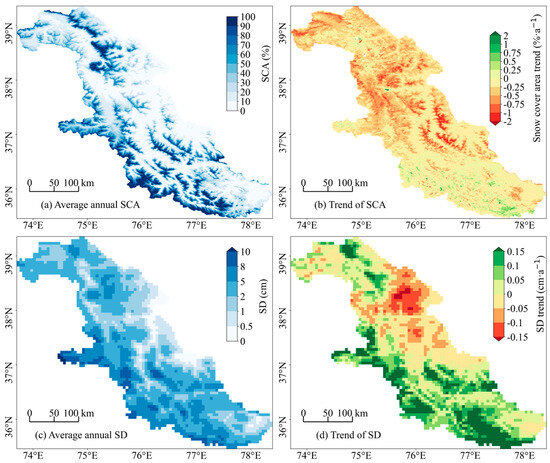
Figure 3.
Spatiotemporal patterns of SCA and SD changes in the U-YRB from 2002 to 2020. (a,c) show the average distribution of SCA and SD, respectively. (b,d) show the changing trends of SCA and SD, respectively (Sen’s slope).
Temporally, SCA generally displayed a decreasing trend over the 19-year study period (Figure 4a,b), with the lowest annual value recorded in 2017. In contrast, SD remained below the long-term average in most years but showed an overall increasing trend, most notably in 2018 (Figure 4d,e). Spatially, approximately 86.96% of the basin area exhibited a declining trend in SCA (slope < 0%·a−1), of which 16.39% showed a significant decrease (slope < −0.5%·a−1) (Figure 3b). Only 13.04% of the area displayed an increasing SCA trend, which was mainly concentrated in high-elevation zones. Overall, the U-YRB experienced a net decline in SCA at a rate of −0.25%·a−1.
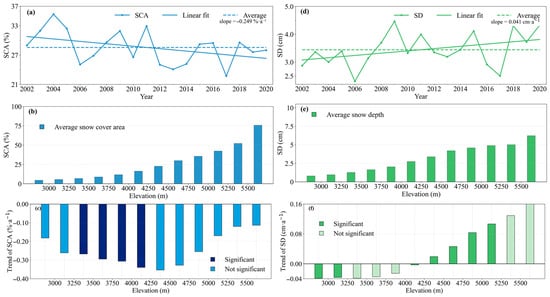
Figure 4.
Annual trends and elevation-dependent distributions of SCA and SD in the U-YRB. Values represent annual means derived from daily SCA and SD data, aggregated by elevation band. (a,d) Interannual variation trends; (b,e) elevation-dependent distributions; (c,f) trends across elevation zones. Darker bars indicate statistically significant trends (p < 0.05).
Elevation-dependent analysis across 12 altitudinal gradients reveals distinct patterns in SCA and SD changes (Figure 4). SCA consistently increased with elevation, reaching a mean of 75.8% in zones above 5500 m. Despite this general altitudinal increase, a predominant decreasing trend was observed across most elevation bands. The most pronounced decline occurred within the 4250–4500 m interval, at a rate of −0.35%·a−1. This is particularly notable given that perennial snow is mainly distributed above 4500 m; the reduction in permanent snow cover and its transition to seasonal cover are key factors contributing to the observed rise in the regional snowline [42]. Above 4500 m, the rate of SCA decline gradually weakened, indicating reduced sensitivity to climatic drivers under persistent snow conditions.
SD also demonstrated a clear positive correlation with elevation (Figure 4d–f), although the rate of increase diminished above 4250 m. Mean SD ranged from 0.8 cm in the lowest elevation zone to 6.22 cm in the highest, representing a difference of approximately 5 cm. A distinct transition in SD trend occurred between 4000 and 4250 m: below this threshold, SD exhibited a declining trend, most pronounced below 3000 m (−0.04 cm·a−1), which reflects a stronger climatic influence in lower-elevation zones. Above 4000 m, SD generally showed an increasing trend.
In summary, SCA declined more rapidly at lower elevations, with the rate of decrease slowing above 4500 m, while SD transitioned from a decreasing to an increasing trend around 4000 m. This contrasting pattern across the 4000 m threshold highlights a clear elevation-dependent response and signifies a fundamental transition in snow–climate interactions within the U-YRB.
4.2. Relative Influence of Climatic Factors on Snow Cover Across Elevations
Based on the GBDT analysis, the relative influence of key meteorological factors on Snow Cover Area changes across elevation gradients in the U-YRB (2002–2020) was quantified. Temperature was identified as the dominant factor driving SCA reduction, although its influence decreased consistently with elevation (Figure 5). In the mid-to-low elevation zone (3000–4000 m), temperature exerted the strongest control, explaining 68.88% to 69.30% of the variance (Figure 5a,b), confirming that warming is the primary driver of snow cover loss in this region. Within the mid-elevation zone (4000–5000 m), the influence of temperature declined to 59.25–66.12% (Figure 5c,d). Concurrently, the influence of precipitation peaked here (30.22–32.73%), suggesting that this band represents a critical transition zone where orographic uplift efficiently converts precipitation into snowfall. In high-elevation areas (4500–5500 m), the influence of temperature further decreased to 55.48–63.39% (Figure 5e,f), consistent with the thermal inertia of perennial snow cover and its narrower temperature range. Although absolute precipitation amounts may be higher, its relative influence on SCA dropped to 8.53–9.29% (Figure 5e–g), likely due to reduced accumulation efficiency under high winds and extreme cold. Above 5000 m, barometric pressure showed substantial influence (24.12–34.41%; Figure 5e,f), likely related to its role in modulating weather system stability and precipitation phase. Specific humidity was a notable factor in the 3000–4500 m range (3.87–13.21%; Figure 5a–c), especially below 3500 m, highlighting its importance for snow crystal growth and pack stability. In contrast, wind speed showed minimal influence (<3% across all gradients), with a slight peak of 2.12% only within the 4000–4500 m band (Figure 5c), indicating generally weak sensitivity of basin-scale SCA to wind, possibly due to topographic sheltering.
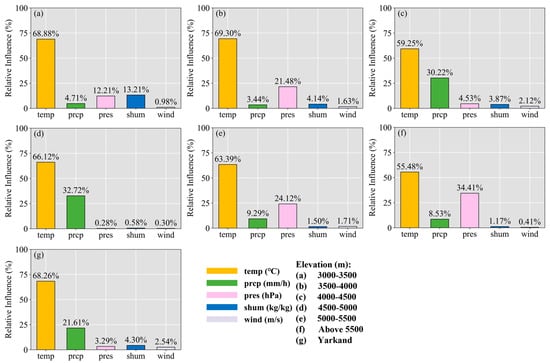
Figure 5.
Relative influence of different meteorological factors on SCA change in the U-YRB (GBDT). (a) Elevation zone 3000–3500 m; (b) Elevation zone 3500–4000 m; (c) Elevation zone 4000–4500 m; (d) Elevation zone 4500–5000 m; (e) Elevation zone 5000–5500 m; (f) Elevation zone >5500 m; (g) Entire study area.
The influence of meteorological factors on SD variation also exhibited marked elevation dependency (Figure 6). Below 4000 m, temperature was the predominant driver, accounting for 59.50% to 73.08% of the explained variance in SD changes (Figure 6a–c). This indicates that SD fluctuations in these zones are most directly tied to temperature variability. The influence of precipitation on SD strengthened with elevation, becoming particularly pronounced in the 4500–5000 m band, where it reached 48.76% (Figure 6d). This heightened role is likely linked to increased precipitation variability and the sensitivity of snow ablation to precipitation inputs within this mid-elevation transition zone. Specific humidity exerted a more substantial influence on SD in both lower and higher elevation regions compared to mid-elevations, underscoring its role in mediating snow cover stability, particularly for seasonal snow. While the influence of wind speed on SD was generally minimal, it showed a notable increase (10.94–12.22%) at elevations above 5000 m (Figure 6g). This can be attributed to the more exposed, open terrain at these high altitudes, where wind plays a more active role in snow redistribution and sublimation processes.
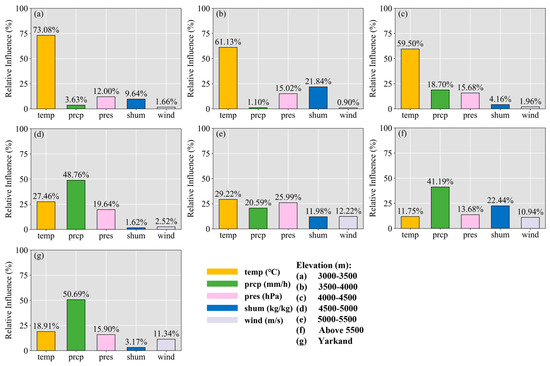
Figure 6.
Relative influence of different meteorological factors on SD change in the U-YRB (GBDT). (a) Elevation zone 3000–3500 m; (b) Elevation zone 3500–4000 m; (c) Elevation zone 4000–4500 m; (d) Elevation zone 4500–5000 m; (e) Elevation zone 5000–5500 m; (f) Elevation zone > 5500 m; (g) Entire study area.
It was reported that the decline in SD across the QTP from 1980 to 2014 was primarily driven by rising temperatures, with a stronger effect observed at higher elevations [18]. In contrast, our results for the U-YRB (2002–2020) reveal a different pattern: the influence of temperature on SD diminishes with increasing elevation, whereas precipitation becomes a more prominent driver at higher elevations. This discrepancy may stem from differences in the study period, regional climate characteristics, or methodological approaches. To further unravel the complex processes driving elevation-dependent snow cover variation, the following Section 4.3 examines the roles of snowfall and snowmelt from a mass-balance perspective.
In summary, the GBDT analysis demonstrates a clear elevation-dependent shift in the dominant climatic controls over SCA and SD in the U-YRB. At lower elevations, temperature is the primary factor governing both SCA reduction and SD decrease. With increasing elevation, the influence of temperature gradually weakens. For SCA, temperature remains the main driver across all elevations, with precipitation playing a secondary moderating role. For SD, however, the controlling factors transition: from temperature dominance at low elevations, to a synergistic control by temperature, humidity, and precipitation in mid-elevations, and finally to precipitation dominance at high elevations (>4500 m).
4.3. The Effects of Snowfall and Snow Melt on Elevation Dependency
To deepen the mechanistic understanding of elevation-dependent snow cover changes, it is essential to examine the distribution of key snow processes—snowfall and snowmelt—which jointly determine the net snow mass balance across elevation zones. Using data from 2002 to 2020, we calculated snowfall via a dual-threshold phase partitioning method and simulated snowmelt with a degree-day model. The difference between the two yields the net snow water equivalent (Net SWE), which directly quantifies the snow mass balance: positive values indicate net accumulation and negative values indicate net ablation.
Snowfall exhibited a consistent elevational increase across all years (Figure 7). In low-elevation areas (<3000 m), snowfall was generally low (0.05–0.17 mm). Within the mid-elevation band (3000–4500 m), especially between 4750 and 5000 m, snowfall peaked in 2018 and 2019 (0.71 mm and 0.68 mm, respectively), coinciding with lower mean annual temperatures. Above 4500 m, snowfall continued to increase with elevation but stabilized in the highest zones. After 2015, snowfall rose notably in the 5250–5500 m range and above, reaching 0.98 mm and 1.20 mm in 2019.
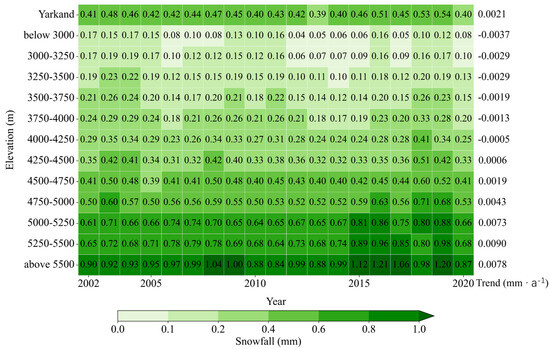
Figure 7.
Annual average snowfall data at different elevations. The trend in the figure refers to the annual trend of average snowfall in different elevation ranges.
Temporally, snowfall showed a decreasing trend at low elevations, which weakened with rising elevation and reversed to an increasing trend around 4000 m. This upward trend generally continued toward higher elevations, though observations above 5500 m suggest a possible moderation in the rate of increase.
Snowmelt, in contrast to snowfall, displayed a distinct elevational reversal (Figure 8). In most years, snowmelt increased with elevation up to approximately 4000 m, beyond which it consistently decreased. The multi-year mean snowmelt was 0.70 mm, 0.89 mm, and 0.21 mm for the low-, middle-, and high-elevation zones, respectively. Peak snowmelt consistently occurred between 3750 m and 4250 m. A notable maximum was observed in 2009, with an annual mean of 1.35 mm in the 4000–4750 m band. In certain years (e.g., 2003, 2004, and 2011), anomalous patterns emerged, characterized by relatively high melt at lower elevations. At higher elevations, snowmelt declined sharply, with mean annual values falling below 0.2 mm above 5000 m. Overall, the trend in snowmelt is characterized by an increase from 3000 m to a peak around 4000 m, followed by a progressive decrease from 4000 m to 5500 m. The rate of increase was most pronounced near 4000 m and subsequently moderated upon entering the high-elevation zone.
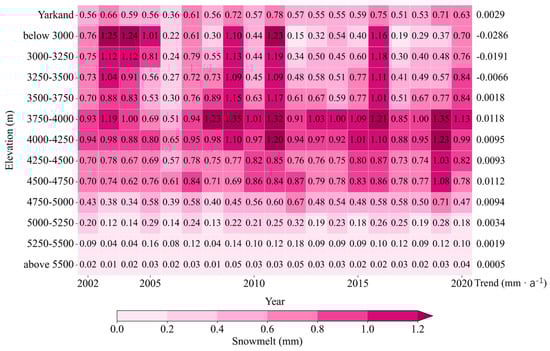
Figure 8.
Annual average snowmelt data at different elevations. The trend in the figure refers to the annual trend of average snowmelt in different elevation ranges.
By synthesizing the spatiotemporal distribution of snowfall and snowmelt (Figure 9), a clear elevational differentiation emerges between the two processes. In mid- to low-elevation regions, snow cover changes are predominantly influenced by variations in snowmelt. In contrast, only in limited high-elevation zones—where extremely low temperatures and strong winds suppress melt—does snowfall play a more prominent role in snow cover evolution. The elevational pattern of snowmelt exhibits a distinct reversal around 4000 m, a feature that aligns closely with the elevation-dependent trends observed for SCA and SD. While both SCA and SD generally increase with elevation, their rates of change do not increase monotonically. Similarly, snowfall rises with elevation, but snowmelt peaks near 4000 m and declines thereafter, highlighting a fundamental transition in process dominance across the elevation gradient.
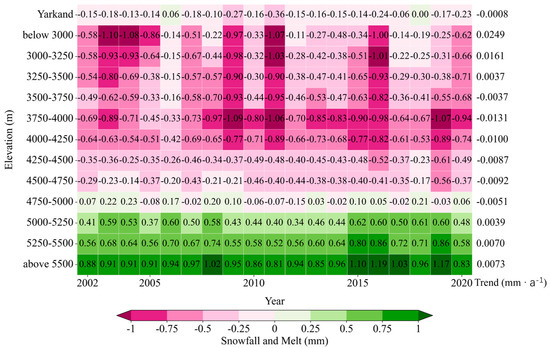
Figure 9.
Snow Mass Balance (Net SWE) across different elevations. The values represent the annual average net snow water equivalent (snowfall minus snowmelt). Positive values indicate net accumulation, and negative values indicate net ablation. The trend line refers to the annual trend of the net mass balance across elevation ranges.
In summary, the spatiotemporal distributions of snowfall and snowmelt in the U-YRB exhibit clear and contrasting patterns along the elevation gradient. Snowfall decreased at low elevations, with this declining trend gradually weakening and reversing to an increase above approximately 4000 m. Conversely, snowmelt increased from low to mid-elevations, peaked around 4000 m, and then decreased at higher elevations. From a mass balance perspective, snowmelt was identified as the dominant process controlling net snow cover, thereby directly influencing the observed patterns of SCA and SD. Building on this finding, the following section investigates how snowmelt governs the elevational differences in snow cover changes and examines the distinct mechanisms driving its variation between low- and high-elevation regions.
4.4. Causal Pathways and Mechanistic Shifts Governing Snow Cover Changes Across Elevation
Based on the previously revealed elevation dependency in snow cover variation, which shows a distinct shift around 4000 m, this section systematically analyzes the differences in driving mechanisms above and below this critical elevation threshold (Figure 10). Using SEM, we quantify the total indirect effects of key meteorological factors—including temperature, precipitation, wind speed, and pressure—on SCA and SD, which are fully mediated through the processes of snowmelt and snowfall, with an elevation of 4000 m as the cutoff. This framework reveals clear shifts in dominant climatic controls and pathway structures between low- and high-elevation regions.
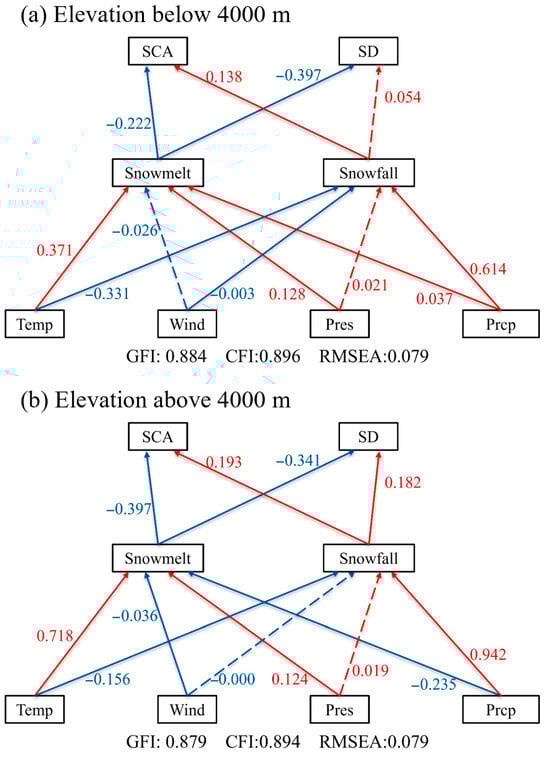
Figure 10.
Total effects of meteorological variables—temperature (Temp), precipitation (Prcp), wind speed (Wind), and pressure (pres) on SCA and SD, mediated by snowmelt and snowfall, in areas below and above 4000 m. Solid arrows indicate statistically significant paths; dashed arrows denote non-significant relationships. Red arrows represent positive effects; blue arrows represent negative effects.
In the low-elevation region (<4000 m), temperature remains the dominant driver. The total indirect effects of temperature on SCA (−0.128) and SD (−0.165) result from its opposing direct effects: a positive effect on snowmelt (0.371) and a negative effect on snowfall (−0.331). These impacts are transmitted through these melt–accumulation pathways (Tables S4 and S5). This indicates that temperature reduces snow cover mainly through enhanced melt and reduced fresh snowfall. Precipitation exhibits a small positive contribution to SCA (0.077) and a minimal effect on SD (0.018), reflecting the compensation between its modest enhancement of snowmelt (0.037) and its much stronger positive effect on snowfall (0.614). This confirms a limited but stabilizing net role of precipitation in this elevation zone. Wind speed shows negligible effects on snowmelt (−0.026), snowfall (−0.003), SCA (0.005), and SD (0.010), indicating that wind-related redistribution processes are weak at lower elevations. Pressure exerts a moderate positive effect on snowmelt (0.128) and a very weak positive effect on snowfall (0.021), but its total effects on SCA (−0.026) and SD (−0.050) remain small and negative, suggesting only minor contributions to snow cover loss.
Above 4000 m, the response pattern shifts substantially. Temperature continues to be a major driver, but its net influence on SCA (−0.315) and SD (−0.273) differs from that at lower elevations. Temperature strongly enhances snowmelt (0.718), while slightly reducing snowfall (−0.156), making the snowmelt-mediated pathway increasingly dominant at high elevations. Precipitation becomes a much stronger control at high elevations. Its effect on snowfall (0.942) is the largest among all variables, and although it slightly increases melt (−0.235), its net total effects on both SCA (0.275) and SD (0.252) are strongly positive. This indicates that accumulation processes dominate over melt in high-elevation snow cover. Wind speed shows essentially no effect on snowmelt (0.000) and only very small positive effects on SCA (0.014) and SD (0.012), consistent with minimal wind redistribution impacts in the high-elevation region. Pressure exhibits weak positive effects on snowmelt (0.124) and snowfall (0.019), but its net effects on SCA (−0.046) and SD (−0.039) remain small and negative, again indicating limited influence.
In summary, temperature remains the most influential factor governing snow cover dynamics across elevations, but the mechanism of its influence shows clear elevation dependency. Below 4000 m, temperature affects snow cover primarily through moderate increases in snowmelt and reductions in snowfall, resulting in modest negative total effects on both SCA and SD. Above 4000 m, however, the contribution of the melt-mediated pathway becomes much stronger, amplifying temperature’s indirect impacts. Precipitation transitions from a weak stabilizing factor at low elevations to a strong positive driver of snow cover at high elevations due to its dominant role in snowfall enhancement. Wind speed remains consistently weak across elevations, while pressure exerts only minor negative effects in both regions. These contrasting mechanisms underscore the non-linear response of mountain snow cover to climate forcing and highlight the need for elevation-stratified modeling in hydrological projections.
5. Discussion
Consistent with observed elevation-dependent warming patterns [43,44,45], our findings reveal correspondingly complex and elevation-stratified changes in snow cover [16]. Specifically, the rate of SCA decline was more pronounced below 4000 m, while SD decreased significantly below 3500 m but increased above 4000 m (Figure 3 and Figure 4). The concurrent decline in SCA and increase in SD at higher elevations—a surface inconsistency—reflects a characteristic elevation-dependent response of mountain snow cover to climate change [46]. This pattern arises from the differential sensitivity of snow metrics to climatic drivers: SCA is largely governed by ablation-related temperature effects, whereas SD is more strongly influenced by cold-season accumulation processes. In the U-YRB, pervasive warming drives the widespread reduction in SCA. Above 4000 m, however, increased solid precipitation can partially offset melt-induced losses, promoting net snow cover stability or even growth [17]. Our comparative analysis of snowfall and snowmelt, together with the driver analyses (Section 4.3 and Section 4.4), provides basin-scale evidence for this mechanistic shift.
These changes likely interact with regional warming through snow–climate feedbacks, which modulate surface temperature and radiation differently across elevations [2,47]. Positive snow-albedo feedback is recognized as an important amplifier of elevation-dependent warming [17,48]. In low-elevation regions, snow–temperature interactions accelerate surface warming and further enhance snowmelt. In contrast, at high elevations, more extensive and persistent snow cover weakens this feedback, decoupling snow dynamics from regional warming and resulting in slower temperature changes and distinct snow cover variability [49]. Consistent with this, the U-YRB exhibited clear elevation-dependent warming from 2001 to 2020, with warming rates attenuating above 4000 m and declining sharply above 4500 m (Figure 11a,b). This thermal pattern aligns with the reduced temperature influence on SCA at higher elevations shown in Figure 10, and corresponds to the weakening decline in SCA above 4000 m. These findings support previous indications that snow cover changes are smaller and snow-albedo feedback is weaker at higher elevations, although the quantitative role of this feedback in snow cover variations warrants further investigation.
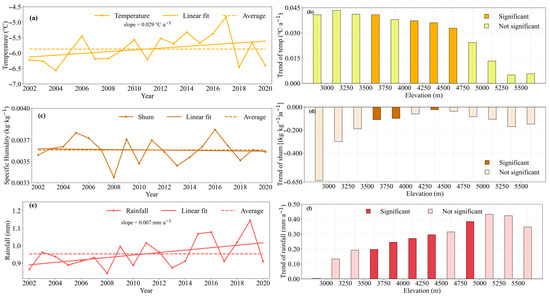
Figure 11.
Annual trends and elevational distribution of temperature, specific humidity, and rainfall in the U-YRB. (a,c,e) Annual average trends; (b,d,f) trends across elevations. Darker bars denote statistically significant trends (p < 0.05).
In the final SEM, specific humidity was not retained as an independent variable due to its high collinearity with air temperature. Nevertheless, its physical role in the surface energy balance remains important for understanding snowmelt processes. At lower elevations, snowmelt is influenced by the synergistic effects of temperature, wind speed, and specific humidity. Higher humidity typically enhances downwelling longwave radiation and increases latent heat release during condensation, both of which promote surface warming and can accelerate melt [50,51]. In contrast, the drier atmosphere characteristic of higher elevations weakens this radiative and latent-heat contribution, which may partially suppress melt (Figure 11c,d). Thus, while the independent statistical contribution of humidity is difficult to isolate within our multivariate framework, its thermodynamic effects are inherently embedded in the temperature and radiation variables included in the SEM. The elevation-dependent contrast in melt regimes is therefore governed by the integrated influence of these key factors, including the thermodynamic setting shaped by humidity.
In recent years, rainfall in the U-YRB has shown an increasing trend, particularly at higher elevations (Figure 11e,f). Rainfall influences the snow cover mainly by altering its internal and surface energy balance. First, rainwater introduces sensible heat into the snow cover when its temperature exceeds 0 °C. Second, infiltration increases the liquid water content and thermal conductivity of the snow, accelerating internal warming and reducing the cold content of the snow cover. In addition, wetting darkens the surface and lowers snow albedo, thereby enhancing shortwave radiation absorption [46,52]. It should be noted that although infiltrated water may refreeze under certain conditions and form thin ice layers, such crusts do not directly promote melting. In the U-YRB, the dominant mechanism by which rainfall affects the snow cover is through warming and wetting, rather than crust formation. However, above 5000 m, the rate of precipitation increase slows, and lower temperatures limit the warming effect of rainfall. As a result, the influence of rainfall on snowmelt weakens in the highest elevation zones. These elevation-dependent interactions illustrate how rainfall can modify the snow cover’s energy balance and affect melt rates [53]. Therefore, continuous monitoring of snowmelt dynamics, precipitation changes, and their impacts on snow-hydrological processes is crucial for developing regional adaptation strategies, reducing disaster risks, ensuring sustainable water supply, and maintaining ecosystem stability.
While this study focuses on elucidating the elevation-dependent physical mechanisms governing snow cover changes within the U-YRB, it is important to consider these findings within the broader context of large-scale atmospheric circulation. The observed wetting trend at high elevations, which contributed to increased snow depth, coincides with reported intensification and northward shifts in the westerly jet over Central Asia—a pattern known to enhance moisture transport toward the northwestern Tibetan Plateau [21,54]. Concurrently, the pronounced warming at lower elevations—the primary driver of accelerated snow cover area loss—aligns with the broader phenomenon of elevation-dependent warming on the Tibetan Plateau. This warming pattern has been linked to complex interactions involving atmospheric circulation changes, cloud feedbacks, and altered surface energy balance. Therefore, the local climatic drivers (temperature and precipitation) examined in this study can be viewed as modulated by these evolving synoptic-scale conditions. In summary, our work clarifies the key physical mechanisms that govern snow cover dynamics under this circulation setting, particularly the elevation-dependent reorganization of energy balance that ultimately shapes the observed spatial heterogeneity.
6. Conclusions
This study investigated the elevation-dependent characteristics and driving mechanisms of snow cover changes in the U-YRB from 2002 to 2020 using a GBDT model, a process-based degree-day model, and SEM. The main conclusions are as follows: (1) Observed Elevation-Dependent Trends. The SCA showed a significant overall declining trend (−0.25%·a−1). The rate of decrease accelerated below 4000 m but slowed above this elevation. SD displayed a distinct turning point around 4000 m. It decreased significantly below 3500 m but increased above 4000 m. (2) Shifting Dominance of Climatic Drivers. Temperature was the dominant factor reducing SCA across all elevations and decreasing SD at lower elevations. Its relative contribution, however, diminished with rising elevation. Precipitation played a critical yet contrasting role. While its net effect on SCA was limited, it became the primary positive driver for SD accumulation at high elevations (>4500 m), helping to offset melt losses. (3) Key Processes and Mechanistic Shift. Snowmelt was the key process governing elevation-dependent patterns. Snowfall increased with elevation, while snowmelt peaked around 4000 m. SEM clarified the variable interactions. It quantified how temperature, precipitation, wind speed, and pressure directly and indirectly (via snowmelt and snowfall) affect SCA and SD. A mechanistic shift occurs across the 4000 m threshold: Below it, snow cover loss is driven mainly by temperature’s direct effect and its role in enhancing snowmelt. Above it, the melt-mediated effect of temperature remains strong, while precipitation’s positive effect on snowfall emerges as the key driver for increased SD. This indicates a shift from melt-dominated dynamics at lower elevations to accumulation-influenced dynamics at higher elevations. This study advances the understanding of snow–climate interactions in alpine basins by revealing the underlying physical processes and their elevation-dependent reorganization. The contrasting mechanisms above and below 4000 m highlight the necessity of elevation-stratified modeling for hydrological projections. These findings provide a scientific basis for adaptive water resource management in the Yarkand River Basin and similar regions under climate change.
Supplementary Materials
The following supporting information can be downloaded at: https://www.mdpi.com/article/10.3390/rs18010080/s1, Figure S1: Schematic of the structural equation model (SEM). Table S1: Lists of datasets used in this study. Table S2: Variance inflation factors (VIF) of candidate meteorological predictors used in SEM. Table S3: Pearson correlation matrix among high-VIF meteorological variables at the daily timescale. Table S4: Total effects of meteorological variables on snowmelt, snowfall, SCA, and SD in the elevation zone below 4000 m. Table S5: Total effects of meteorological variables on snowmelt, snowfall, SCA, and SD in the elevation zone above 4000 m.
Author Contributions
Conceptualization, Z.T., H.C. and H.G.; methodology, X.J., H.C. and H.G.; software, X.J. and H.C.; validation, X.J. and H.C.; formal analysis, X.J.; investigation, X.J.; resources, Z.T. and H.G.; data curation, X.J. and H.C.; writing—original draft preparation, X.J.; writing—review and editing, Z.T., H.C., H.G., G.D., Y.Y. and H.H.; visualization, X.J.; supervision, Z.T.; project administration, Z.T. and H.C.; funding acquisition, Z.T. and H.G. All authors have read and agreed to the published version of the manuscript.
Funding
This study was supported by the National Natural Science Foundation of China (Grant No. 42471156, 42201017), the Scientific Research Foundation of Hunan Education Department, China (Grant No. 23A0363) and Teaching Reform Project for Degree and Graduate Education in Hunan Province, China (Grant No. 2025JGZD080).
Data Availability Statement
The MODIS Daily Cloud-gap-filled Fractional Snow Cover Dataset of the Asian Water Tower Region (2000–2022) can be obtained from https://www.ncdc.ac.cn/portal/metadata/10328ce3-3d5f-403c-b4b5-821d9cb6a5e8 (accessed on 15 December 2024) with doi number: 10.5281/zenodo.10005827. A daily 0.05° snow depth dataset for the Tibetan Plateau (2000–2021) can be obtained from https://data.tpdc.ac.cn/zh-hans/data/0515ce19-5a69-4f86-822b-330aa11e2a28 (accessed on 15 December 2024) with doi number: 10.1016/j.jhydrol.2021.127027. A high-resolution near-surface meteorological forcing dataset for the Third Pole region can be obtained from https://data.tpdc.ac.cn/zh-hans/data/44a449ce-e660-44c3-bbf2-31ef7d716ec7 (accessed on 15 December 2024) with doi number: 10.11888/Atmos.tpdc.300398. Thermal and Reanalysis Integrating Moderate-resolution Spatial-seamless LST–Tibetan Plateau can be obtained from https://data.tpdc.ac.cn/zh-hans/data/d09ebfe3-a8c9-49b5-aa22-1fd484751d70 (accessed on 15 December 2024) with doi number: 10.11888/Meteoro.tpdc.270953.
Acknowledgments
The authors would like to thank the National Cryosphere Desert Data Center (http://www.ncdc.ac.cn) and the National Tibetan Plateau Data Center for providing the datasets used in this study (http://data.tpdc.ac.cn).
Conflicts of Interest
The authors declare no conflicts of interest.
Abbreviations
The following abbreviations are used in this manuscript:
| U-YRB | The upper reaches of the Yarkand river basin |
| GBDT | Gradient-boosted decision tree |
| QTP | Qinghai–Tibet Plateau |
| FSC | Fractional snow cover |
| SEM | Structural equation model |
| MODIS | Moderate Resolution Imaging Spectroradiometer |
| SCA | Snow cover area |
| SD | Snow depth |
| Temp | Temperature |
| Prcp | Precipitation |
| Wind | Wind speed |
| Pres | Pressure |
References
- Barnett, T.P.; Dümenil, L.; Schlese, U.; Roeckner, E. The Effect of Eurasian Snow Cover on Global Climate. Science 1988, 239, 504–507. [Google Scholar] [CrossRef]
- Ghatak, D.; Sinsky, E.; Miller, J. Role of snow-albedo feedback in higher elevation warming over the Himalayas, Tibetan Plateau and Central Asia. Environ. Res. Lett. 2014, 9, 114008. [Google Scholar] [CrossRef]
- Immerzeel, W.W.; Lutz, A.F.; Andrade, M.; Bahl, A.; Biemans, H.; Bolch, T.; Hyde, S.; Brumby, S.; Davies, B.J.; Elmore, A.C.; et al. Importance and vulnerability of the world’s water towers. Nature 2020, 577, 364–369. [Google Scholar] [CrossRef]
- Tang, Z.; Wang, J.; Wang, X.; Peng, H.; Liang, J. Spatiotemporal Variation of Snow Cover in Tianshan Mountains based on MODIS. Remote Sens. Technol. Appl. 2017, 32, 556–563. [Google Scholar]
- Xu, Y.; Ramanathan, V.; Washington, W.M. Observed high-altitude warming and snow cover retreat over Tibet and the Himalayas enhanced by black carbon aerosols. Atmos. Chem. Phys. 2016, 16, 1303–1315. [Google Scholar] [CrossRef]
- Yao, T.; Qin, D.; Shen, Y.; Zhao, L.; Wang, N.; Lu, A. Cryospheric changes and their impacts on regional water cycle and ecological conditions in the Qinghai-Tibetan Plateau. Chin. J. Nat. 2013, 35, 179–186. [Google Scholar]
- Hahn, D.G.; Shukla, J. An Apparent Relationship between Eurasian Snow Cover and Indian Monsoon Rainfall. J. Atmos. Sci. 1976, 33, 2461–2462. [Google Scholar] [CrossRef]
- Verma, R.K.; Subramaniam, K.; Dugam, S.S. Interannual and long-term variability of the summer monsoon and its possible link with northern hemispheric surface air temperature. Proc. Indian Acad. Sci. Earth Planet. Sci. 1985, 94, 187–198. [Google Scholar] [CrossRef]
- Xu, W.; Ma, L.; Ma, M.; Zhang, H.; Yuan, W. Spatial–Temporal Variability of Snow Cover and Depth in the Qinghai–Tibetan Plateau. J. Clim. 2017, 30, 1521–1533. [Google Scholar] [CrossRef]
- Li, C.; Su, F.; Yang, D.; Tong, K.; Meng, F.; Kan, B. Spatiotemporal variation of snow cover over the Tibetan Plateau based on MODIS snow product, 2001–2014. Int. J. Climatol. 2017, 38, 708–728. [Google Scholar] [CrossRef]
- Brown, R.D.; Mote, P.W. The Response of Northern Hemisphere Snow Cover to a Changing Climate. J. Clim. 2009, 22, 2124–2145. [Google Scholar] [CrossRef]
- Harpold, A.; Brooks, P.; Rajagopal, S.; Heidbuchel, I.; Jardine, A.; Stielstra, C. Changes in snowpack accumulation and ablation in the intermountain west. Water Resour. Res. 2012, 48, W11501. [Google Scholar] [CrossRef]
- Kapnick, S.; Hall, A. Causes of recent changes in western North American snowpack. Clim. Dyn. 2012, 38, 1885–1899. [Google Scholar] [CrossRef]
- Räisänen, J. Warmer climate: Less or more snow? Clim. Dyn. 2008, 30, 307–319. [Google Scholar] [CrossRef]
- Ombadi, M.; Risser, M.D.; Rhoades, A.M.; Varadharajan, C. A warming-induced reduction in snow fraction amplifies rainfall extremes. Nature 2023, 619, 305–310. [Google Scholar] [CrossRef] [PubMed]
- Hammond, J.C.; Saavedra, F.A.; Kampf, S.K. Global snow zone maps and trends in snow persistence 2001–2016. Int. J. Climatol. 2018, 38, 4369–4383. [Google Scholar] [CrossRef]
- Huang, X.; Deng, J.; Wang, W.; Feng, Q.; Liang, T. Impact of climate and elevation on snow cover using integrated remote sensing snow products in Tibetan Plateau. Remote Sens. Environ. 2017, 190, 274–288. [Google Scholar] [CrossRef]
- Shen, L.; Zhang, Y.; Ullah, S.; Pepin, N.; Ma, Q. Changes in snow depth under elevation-dependent warming over the Tibetan Plateau. Atmos. Sci. Lett. 2021, 22, e1041. [Google Scholar] [CrossRef]
- Wang, H.; Zhang, X.; Xiao, P.; Zhang, K.; Wu, S. Elevation-dependent response of snow phenology to climate change from a remote sensing perspective: A case survey in the central Tianshan mountains from 2000 to 2019. Int. J. Climatol. 2022, 42, 1706–1722. [Google Scholar] [CrossRef]
- Yu, Y.; Zhou, Y.; Li, M.; Xue, W.; Liu, J.; Hu, Y. Elevation-dependent effects of snowfall and snow cover changes on runoff variations at the source regions of the Yellow River basin. J. Water Clim. Change 2024, 15, 3566–3581. [Google Scholar] [CrossRef]
- Yao, T.; Bolch, T.; Chen, D.; Gao, J.; Immerzeel, W.; Piao, S.; Su, F.; Thompson, L.; Wada, Y.; Wang, L.; et al. The imbalance of the Asian water tower. Nat. Rev. Earth Environ. 2022, 3, 618–632. [Google Scholar] [CrossRef]
- Wang, C.; Li, S.; Lei, J.; Yang, X.; Yang, F. Regional climatic characteristics and its change trend in Yeerqiang River basin. Reg. Clim. Charact. Its Change Trend Yeerqiang River Basin 2018, 32, 155–160. [Google Scholar] [CrossRef]
- Jiang, L. MODIS Daily Cloud-gap-filled Fractional Snow Cover Dataset of the Asian Water Tower Region (2000–2022). 2024. Available online: https://zenodo.org/records/10005827 (accessed on 15 December 2024).
- Pan, F.; Jiang, L.; Wang, G.; Pan, J.; Huang, J.; Zhang, C.; Cui, H.; Yang, J.; Zheng, Z.; Wu, S.; et al. MODIS daily cloud-gap-filled fractional snow cover dataset of the Asian Water Tower region (2000–2022). Earth Syst. Sci. Data 2024, 16, 2501–2523. [Google Scholar] [CrossRef]
- Tang, Y.; Chen, J.; Xu, J.; Xu, J.; Ni, J.; Zheng, Z.; Yu, B.; Wu, J.; Huang, Y. The Impact of Autumn Snowfall on Vegetation Indices and Autumn Phenology Estimation. Remote Sens. 2024, 16, 4783. [Google Scholar] [CrossRef]
- Li, Z.; Wu, X.; Zhang, W.; Zhong, X.; Yue, M.; Li, Y.; Shen, Y.; Chen, R. High-resolution snow water equivalent estimation derived from downscaled snow depth and non-constant snow density in Chinese Altai Mountains. J. Hydrol. 2025, 661, 133708. [Google Scholar] [CrossRef]
- Yan, D.; Ma, N.; Zhang, Y. Development of a fine-resolution snow depth product based on the snow cover probability for the Tibetan Plateau: Validation and spatial–temporal analyses. J. Hydrol. 2022, 604, 127027. [Google Scholar] [CrossRef]
- Yang, K.; Jiang, Y.; Tang, W.; He, J.; Shao, C.; Zhou, X.; Lu, H.; Chen, Y.; Li, X.; Shi, J. A High-Resolution Near-Surface Meteorological Forcing Dataset for the Third Pole Region (TPMFD, 1979–2023); National Tibetan Plateau Data Center, Ed.; National Tibetan Plateau Data Center: Beijing, China, 2025. [Google Scholar] [CrossRef]
- Jiang, Y.; Tang, W.; Yang, K.; He, J.; Shao, C.; Zhou, X.; Lu, H.; Chen, Y.; Li, X.; Shi, J. Development of a high-resolution near-surface meteorological forcing dataset for the Third Pole region. Sci. China Earth Sci. 2025, 68, 1274–1290. [Google Scholar] [CrossRef]
- Jiang, Y.; Yang, K.; Qi, Y.; Zhou, X.; He, J.; Lu, H.; Li, X.; Chen, Y.; Li, X.; Zhou, B.; et al. TPHiPr: A long-term (1979–2020) high-accuracy precipitation dataset (1∕30°, daily) for the Third Pole region based on high-resolution atmospheric modeling and dense observations. Earth Syst. Sci. Data 2023, 15, 621–638. [Google Scholar] [CrossRef]
- Shao, C.; Yang, K.; Tang, W.; He, Y.; Jiang, Y.; Lu, H.; Fu, H.; Zheng, J. Convolutional neural network-based homogenization for constructing a long-term global surface solar radiation dataset. Renew. Sustain. Energy Rev. 2022, 169, 112952. [Google Scholar] [CrossRef]
- Zhou, J.; Zhang, X.; Tang, W.; Ding, L.; Ma, J.; Zhang, X. Daily 1-km All-Weather Land Surface Temperature Dataset for Western China (TRIMS LST-TP; 2000–2023) V2; National Tibetan Plateau Data Center, Ed.; National Tibetan Plateau Data Center: Beijing, China, 2025. [Google Scholar] [CrossRef]
- Tang, W.; Zhou, J.; Ma, J.; Wang, Z.; Ding, L.; Zhang, X.; Zhang, X. TRIMS LST: A daily 1 km all-weather land surface temperature dataset for China’s landmass and surrounding areas (2000–2022). Earth Syst. Sci. Data 2024, 16, 387–419. [Google Scholar] [CrossRef]
- Zhang, X.; Zhou, J.; Liang, S.; Wang, D. A practical reanalysis data and thermal infrared remote sensing data merging (RTM) method for reconstruction of a 1-km all-weather land surface temperature. Remote Sens. Environ. 2021, 260, 112437. [Google Scholar] [CrossRef]
- Liu, Q.; Qiao, J.; Li, M.; Huang, M. Spatiotemporal heterogeneity of ecosystem service interactions and their drivers at different spatial scales in the Yellow River Basin. Sci. Total Environ. 2024, 908, 168486. [Google Scholar] [CrossRef]
- Chen, T.; Guestrin, C. XGBoost: A Scalable Tree Boosting System. In Proceedings of the 22nd ACM SIGKDD International Conference on Knowledge Discovery and Data Mining; Association for Computing Machinery: San Francisco, CA, USA, 2016; pp. 785–794. [Google Scholar] [CrossRef]
- Kang, E.; Cheng, G.; Lan, Y.; Jin, H. A model for simulating the response of runoff from the mountainous watersheds of inland river basins in the arid area of northwest China to climatic changes. Sci. China Ser. D Earth Sci. 1999, 42, 52–63. [Google Scholar] [CrossRef]
- Liu, X.; Xu, Z.; Yang, H.; Vaghefi, S.A. Responses of the Glacier Mass Balance to Climate Change in the Tibetan Plateau During 1975–2013. J. Geophys. Res. Atmos. 2021, 126, e2019JD032132. [Google Scholar] [CrossRef]
- Hock, R. A distributed temperature-index ice- and snowmelt model including potential direct solar radiation. J. Glaciol. 2017, 45, 101–111. [Google Scholar] [CrossRef]
- Hooper, D.; Coughlan, J.; Mullen, M.R. Structural equation modelling: Guidelines for determining model fit. Electron. J. Bus. Res. Methods 2008, 6, 53–60. [Google Scholar] [CrossRef]
- Fornell, C.; Larcker, D.F. Evaluating Structural Equation Models with Unobservable Variables and Measurement Error. J. Mark. Res. 1981, 18, 39–50. [Google Scholar] [CrossRef]
- Zhao, Y.; Tang, Z.; Yang, C.; Wang, X.; Jiang, X. Regional snowline altitude simulation based on multi-model ensemble learning: Case study of Yarkant River Basin. J. Glaciol. Geocryol. 2025, 47, 294–306. [Google Scholar] [CrossRef]
- Wang, Q.; Fan, X.; Wang, M. Recent warming amplification over high elevation regions across the globe. Clim. Dyn. 2014, 43, 87–101. [Google Scholar] [CrossRef]
- You, Q.; Zhang, Y.; Xie, X.; Wu, F. Robust elevation dependency warming over the Tibetan Plateau under global warming of 1.5 °C and 2 °C. Clim. Dyn. 2019, 53, 2047–2060. [Google Scholar] [CrossRef]
- You, Q.; Chen, D.; Wu, F.; Pepin, N.; Cai, Z.; Ahrens, B.; Jiang, Z.; Wu, Z.; Kang, S.; AghaKouchak, A. Elevation dependent warming over the Tibetan Plateau: Patterns, mechanisms and perspectives. Earth-Sci. Rev. 2020, 210, 103349. [Google Scholar] [CrossRef]
- Pepin, N.; Bradley, R.S.; Diaz, H.F.; Baraer, M.; Caceres, E.B.; Forsythe, N.; Fowler, H.; Greenwood, G.; Hashmi, M.Z.; Liu, X.D.; et al. Elevation-dependent warming in mountain regions of the world. Nat. Clim. Change 2015, 5, 424–430. [Google Scholar] [CrossRef]
- Guo, D.; Sun, J.; Yang, K.; Pepin, N.; Xu, Y. Revisiting Recent Elevation-Dependent Warming on the Tibetan Plateau Using Satellite-Based Data Sets. J. Geophys. Res. Atmos. 2019, 124, 8511–8521. [Google Scholar] [CrossRef]
- Li, B.; Dong, F.; Lian, L.; Pan, T.; Sun, W.; Sun, B.; Chen, Y.; Wang, Y.; Qin, Y.; Ding, M. Recent increase in snow cover as a contributing driver to autumn cooling in central Eurasia. Environ. Res. Lett. 2025, 20, 054068. [Google Scholar] [CrossRef]
- Yao, T.; Wang, W.; Yang, W.; Zhang, G.; Shi, J.; Wu, G.; Gao, J.; Che, T.; Liu, S.; Walter, I.; et al. Imbalance of the Asian Water Tower characterized by glacier and snow melt. Clim. Change Res. 2024, 20, 689–698. [Google Scholar] [CrossRef]
- Harpold, A.A.; Brooks, P.D. Humidity determines snowpack ablation under a warming climate. Proc. Natl. Acad. Sci. USA 2018, 115, 1215–1220. [Google Scholar] [CrossRef]
- Yang, D.; Wu, L.; Zhang, Y.; Wei, H.; Chen, D.; Xiong, L.; Du, J.; Jia, J. Subsurface-fed transpiration drives surface energy partitioning in soil-limited karst systems. J. Hydrol. 2025, 663, 134159. [Google Scholar] [CrossRef]
- Maina, F.Z.; Kumar, S.V. Global patterns of rain-on-snow and its impacts on runoff from past to future projections. Nat. Commun. 2025, 16, 4731. [Google Scholar] [CrossRef]
- Li, D.; Ouyang, W.; Wang, L.; Chen, J.; Zhang, H.; Sharkhuu, A.; Tseren-Ochir, S.-E.; Yang, Y. Revisiting snowmelt dynamics and its impact on soil moisture and vegetation in mid-high latitude watershed over four decades. Agric. For. Meteorol. 2025, 362, 110353. [Google Scholar] [CrossRef]
- Yao, T.; Xue, Y.; Chen, D.; Chen, F.; Thompson, L.; Cui, P.; Koike, T.; Lau, W.K.; Lettenmaier, D.; Mosbrugger, V.; et al. Recent Third Pole’s Rapid Warming Accompanies Cryospheric Melt and Water Cycle Intensification and Interactions between Monsoon and Environment: Multidisciplinary Approach with Observations, Modeling, and Analysis. Bull. Am. Meteorol. Soc. 2019, 100, 423–444. [Google Scholar] [CrossRef]


Disclaimer/Publisher’s Note: The statements, opinions and data contained in all publications are solely those of the individual author(s) and contributor(s) and not of MDPI and/or the editor(s). MDPI and/or the editor(s) disclaim responsibility for any injury to people or property resulting from any ideas, methods, instructions or products referred to in the content. |
© 2025 by the authors. Licensee MDPI, Basel, Switzerland. This article is an open access article distributed under the terms and conditions of the Creative Commons Attribution (CC BY) license.