Abstract
Thermokarst lakes are widely distributed on the Qinghai-Tibet Plateau (QTP). However, owing to the lack of high-precision remote sensing imagery and the difficulty of in situ monitoring of permafrost regions, quantifying the changes in the distribution of thermokarst lakes is challenging. In this study, we used four machine learning methods—random forest (RF), gradient boosting decision tree (GBDT), classification and regression tree (CART), and support vector machine (SVM)—and combined various environmental factors to assess the distribution of thermokarst lakes from 2015 to 2020 via the Google Earth Engine (GEE). The results indicated that the RF model performed optimally in the extraction of thermokarst lakes, followed by GBDT, CART, and SVM. From 2015 to 2020, the number of thermokarst lakes increased by 52%, and the area expanded by 1.6 times. A large proportion of STK lakes (with areas less than or equal to 1000 m2) gradually developed into MTK lakes (with areas between 1000 and 10,000 m2) in the central part of the QTP. Additionally, thermokarst lakes are located primarily at elevations between 4000 and 5000 m, with slopes ranging from 0 to 5°, and the sand content is approximately 65%. The normalized difference water index (NDWI) and enhanced vegetation index (EVI) were the most favourable factors for thermokarst lake extraction. The results provide a scientific reference for the assessment and prediction of dynamic changes in thermokarst lakes on the QTP in the future, which will have important scientific significance for the studies of carbon and water processes in alpine ecosystems.
1. Introduction
The global temperature for the last decade was 1.1 °C higher than that between 1850 and 1900, and each decade has been recorded as warmer than the previous decade since the 1990s [1]. Global climate change is accelerating the thawing of permafrost, which is the major cause of the formation of thermokarst [2]. The common thermokarst types are thermokarst lakes, thaw slumps, and thermal erosion gullies [3]. Thermokarst lakes play a vital role in various processes, including hydrological cycling, ecological systems, and geochemical transformations [4,5,6]. Thermokarst lakes are considered a major source of carbon dioxide and methane emissions [7], which may lead to temperatures rising by 0.39 °C by 2300 [4]. Zhao et al. [8] reported that the formation of thermokarst lakes significantly transformed the composition of soil microbes, with a notable presence of Bacteroidetes and Proteobacteria in sediment zones, in contrast to the predominant Actinobacteria and Acidobacteria communities in land regions near these lakes. Overall, a rise in both the number and area of thermokarst lakes is interpreted as an indicator of permafrost destabilization, and can serve as a sign of the degradation of ecosystems [9]. Quantifying the development and distribution of thermokarst lakes can help studies of carbon and water processes in alpine ecosystems. In this way, the results would provide a scientific basis for soil conservation and utilization in alpine regions. However, owing to the lack of high-precision remote sensing imagery and the difficulty of in situ monitoring of permafrost regions, quantifying the changes in the distribution of thermokarst lakes is challenging.
Recently, with advances in machine learning methods, numerous attempts have been made at the extraction of thermokarst lakes. Previous studies have concentrated on the distribution of thermokarst lakes via models such as random forest (RF), extremely randomized tree (EXT), and support vector machine (SVM) methods. Using an object-based observation method for the study of thermokarst lakes in four regions of Alaska, Nitze et al. [10] reported a decreasing trend in the area of thermokarst lakes from 1999 to 2014. Hu et al. [11] reported a significant decrease in the number of large lakes and the continuous formation of small lakes in Greenland from 2016 to 2018, which led to an increasing trend in the total number of thermokarst lakes. Qin et al. [12] constructed a framework for the automatic extraction of thermokarst lakes based on Sentinel-2 images and achieved good accuracy in the northern Seward Peninsula and the central Tibetan Plateau. Janiec et al. [13] reported that Siberia has 17,700 thermokarst lakes with a total area of 271.43 km2 and emphasized that the RF model is the most reliable among the SVM, RF, naive Bayes (NB), and classification and regression tree (CART) methods. However, due to the selection of environmental factors and the setting of model parameters, different methods for predicting the distribution of thermokarst lakes with high accuracy still exist. Therefore, it is of great significance to combine the results obtained from each model.
The Qinghai-Tibet Plateau (QTP) had the largest area of permafrost in low- and midlatitude regions [14], with approximately 90% of permafrost being degraded [15]. The QTP has developed many thermokarst lakes, which can transfer heat mainly downwards and laterally [16]. Recent studies have reported inconsistent trends in the number of thermokarst lakes in recent decades. Luo et al. [17] reported that the number of thermokarst lakes showed an overall increasing trend from 1969 to 2010, in which the number of individuals increased by 534 and the area covered expanded by 410 ha in the Beilu River Basin. Additionally, from 1969 to 2019, the surface area and size of thermokarst lakes generally tended to increase in the central QTP [18]. However, Șerban et al. [19] reported that the number of lakes larger than 0.36 ha decreased by 40% and the number of lakes smaller than 1 ha decreased by 44% between 1986 and 2015 in the northeastern QTP. Other studies have proposed that the area of thermokarst lakes will decrease to 37.06% under RCP8.5 in the future (2070s) [20]. Other studies also reported the various spatial distributions of lakes on the QTP. Through a susceptibility analysis of the thermokarst lakes near the Qinghai-Tibet Railway [21], more than 80% of the lakes were found to be located in high-susceptibility regions, and approximately 6.85% of the lakes were located in very high-risk areas [22]. Yu et al. [23] reported that there are approximately 380,477 thermokarst lakes, most of which are concentrated in plains where the thickness of the active layer is between 80 and 100 cm in the Lena Basin. However, owing to the difficulty of selecting appropriate environmental factors and optimal model parameterization, it is challenging to calculate the changes in the distribution of thermokarst lakes and identify the key environmental factors regulating their distribution. To address these issues, thermokarst lakes were extracted from 2015 to 2020. The main objectives of this study were (I) to quantify the distribution of thermokarst lakes based on the Google Earth Engine (GEE) via four machine learning methods (RF, CART, gradient boosting decision tree (GBDT) and SVM) and compare their accuracies, and (II) to identify key environmental variables affecting the distribution.
2. Materials and Methods
2.1. Study Area
The study was conducted on the QTP. The QTP has the largest extent of permafrost terrain among the mid- and low-latitude regions worldwide, with permafrost occupying 40% and seasonally frozen ground making up 56% of its total area [14] (Figure 1). The mean annual temperature ranges between −3.1 and 4.4 °C, and the mean annual precipitation ranges from 103 to 694 mm [24]. There are four main vegetation types on the QTP: alpine steppe, alpine desert, alpine swamp meadow, and alpine meadow. Alpine desert and alpine steppe are distributed mainly in the western tundra of the QTP, whereas alpine meadow and alpine swamp meadow are located predominantly in the eastern part [25]. The soil types of the QTP are Xerosols for the alpine steppe and Cambisols for the alpine meadow, based on the World Reference Base for Soil Resources classification [26,27]. The average active layer thickness is 2.3 ± 0.60 m [28], and currently unstable permafrost types account for approximately 21% of the total permafrost area of the QTP [29].
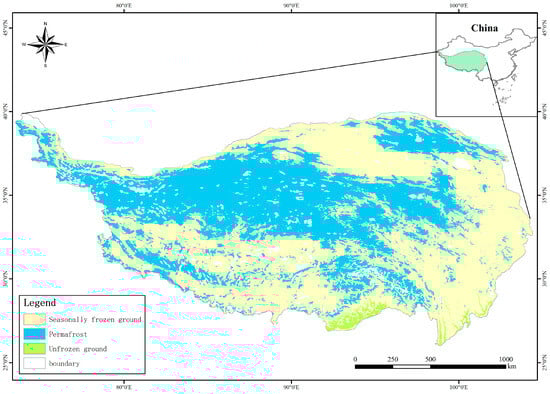
Figure 1.
Location of the study area (permafrost map from [14]).
2.2. Data Sources
The imagery used was obtained from the Landsat series of satellites. The images were derived from a programme led by the National Aeronautics and Space Administration (NASA) and the Department of Interior United States Geological Survey (USGS), which is the longest-running Earth observation programme, with nine satellites being launched thus far [30]. Due to the large area of the QTP and the lack of images, a single Landsat satellite image cannot achieve full coverage of the region in any given year, so we chose the Landsat 7/8 satellites, both of which have a spatial resolution of 30 m [31]. Due to the abundant snow cover in spring and winter on the QTP, we prioritized Landsat 8 images from early June and late October for the images from 2015 to 2020, and for regions not covered in 2020. We used full-year Landsat 8 images from 2018, 2019, and 2021, as well as Landsat 7 images from 2020 and 2021. Similarly, for areas not covered in 2015, we filled the gaps with the whole year Landsat 8 images from 2013, 2014, and 2016, along with the Landsat 7 images from 2013 and 2014, which are available for free on the GEE. In addition, we performed cloud removal, band matching, and radiometric normalization on the imagery, and the band numbers corresponding to each centre wavelength of Landsat 8 are different from those of Landsat 7, due to the different sensors carried by Landsat 7 and 8. Therefore, we used Landsat 8 as the standard for renaming the bands of Landsat 7, and the bands used included red, green, blue, near-infrared (NIR), shortwave infrared 1 (SWIR1), shortwave infrared 2 (SWIR2), and surface temperature (ST_B10) bands.
We selected environmental variables of five main categories: topography, vegetation, hydrology, climate, and soil. The topographic variables included elevation (DEM), slope, aspect, and topographic position index (TPI), and the vegetation variables included the normalized difference vegetation index (NDVI) and enhanced vegetation index (EVI). The hydrological variables included the topographic wetness index (TWI) and normalized difference water index (NDWI). The soil variables included the soil temperature at the 0–7 (SOIL1), 7–28 (SOIL2), and 28–100 (SOIL3) cm depths and their mean values (means). The climate data included surface temperature (ST_B10) and average annual precipitation (pre mean). The detailed data sources are shown in Table 1. The boundary data of the QTP were obtained from the National Tibetan Plateau Data Center (https://data.tpdc.ac.cn/home, accessed on 31 October 2023). In addition, to exclude the influence of rivers, we used river data, which were obtained from the OpenStreetMap website (https://www.openstreetmap.org, accessed on 14 March 2024), for masking after the lakes were obtained, and China’s border data also comes from these data.

Table 1.
Data sources for each variable.
2.3. Modelling Methods
GEE (https://earthengine.google.com, accessed on 5 November 2023) is a cloud-based platform that simplifies the use of advanced computing resources for handling extensive geospatial datasets [32]. Four modelling methods were selected for the study, namely, RF, GBDT, CART, and SVM.
RF is a collection of classification trees, each of which provides a vote for the most frequently assigned class of input data [33]. We directly used the ee.Classifier.smileRandomForest (numberOfTrees) function provided on GEE to execute a random forest model, and numberOfTrees refers to the count of decision trees within the model ensemble. Generally, increasing the number of trees tends to enhance both the stability and accuracy of the model; however, it also results in higher computational costs. By balancing accuracy and computational efficiency, multiple experiments have shown that setting the number of trees to 60 yields the most optimal results. VariablesPerSplit refers to the number of variables used at each split in the model, and we employed the square root of the number of variables (196) for this parameter. GBDT is an integrated machine learning algorithm that utilizes a variety of decision trees for foundational learning; moreover, each decision tree is interdependent, as the addition of a new tree places more focus on the samples that were misclassified by the earlier trees [34]. We conducted this process through the ee.Classifier.smileGradientTreeBoost (numberOfTrees) function. Similarly to RF, the argument numberOfTrees denotes the number of decision trees in the model. Through experimentation, the highest accuracy of the results was achieved when numberOfTrees was set to 4000. The argument maxNodes represents the maximum number of leaf nodes in each tree. During the running process, no limit was imposed on it. SVM map data were put into a new hyperspace by using a functional relationship called a kernel, in which complex patterns can be represented more simply [35]. Here, we used the ee.Classifier.libsvm (kernelType) function to achieve this goal, which incorporates two crucial arguments: svmType and kernelType. SvmType is the type of SVM, there are C_SVC, NU_SVC, ONE_CLASS, EPSILON_SVR, and NU_SVR, among which C_SVC is preferred for classification tasks due to its superior performance. The kernelType determines the kernel function, including LINEAR, POLY, RBF, and SIGMOID. We chose the Gaussian radial basis function (RBF), which is widely adopted in classification tasks as it requires adjusting only a single parameter, making it the most convenient and efficient choice [36]. CART creates a unified regression or classification tree by consistently dividing the data into distinct groups or nodes, aiming for maximum homogeneity in the output, and regression trees account for the variability of a single numeric response variable based on a set of explanatory variables [37]. We implemented the corresponding roles through the function ee.Classifier.smileCart. As with GBDT, the maxNodes argument is used to regulate model complexity and prevent overfitting, so we did not change its value. The minLeafPopulation argument specifies the minimum number of samples required in leaf nodes, and we set its value to 1 to prevent the overly granular segmentation of decision trees.
Moreover, we excluded the results of the SVM model in the subsequent calculation of the area due to its low accuracy (with a K value less than 0.8).
2.4. Accuracy Assessment
To assess the accuracy of our quantification, we selected several parameters, including the producer accuracy (PA), user accuracy (UA), overall accuracy (OA), and kappa coefficient (K), which are metrics of the accuracy of the characterization model obtained based on the confusion matrix [23]. They were calculated as follows:
where TP and TN are true positives and true negatives, P and N are real positives (lakes) and negatives (nonlakes), and FP and FN are false positives and false negatives, respectively [38].
The kappa coefficient is used to test for consistency, and its value ranges from −1 to 1. A value of K of less than 0 indicates no agreement, and the closer it is to 1, the closer it is to perfect agreement [39]. The kappa coefficient was estimated via the following equation:
where n is the total number of pixels, m is the total number of classes (here equal to 2), is the value of Column i and Row i, and and are the sums of Column i and Row i, respectively.
Furthermore, we also selected to estimate the accuracy, which was calculated on the basis of the PA and UA:
To ensure the accuracy of the results, we first validated them using field survey data from 2020 (Supplementary Figure S1). However, thanks to the limited sample size, further verification of the identification results was required. Therefore, we integrated findings from published studies and conducted visual interpretations using Google Earth Pro 7.3.2.5776 software.
2.5. Classification of Thermokarst Lakes
Based on previous studies [17,18,40], we developed a classification framework for thermokarst lakes according to lake size, in order to more accurately calculate their developmental trajectories. We categorized these lakes into four distinct types: those with areas less than or equal to 1000 m2, called small thermokarst lakes (STKs); those with areas between 1000 and 10,000 m2, called moderate-sized thermokarst lakes (MTKs); those with areas between 10,000 and 50,000 m2, called large thermokarst lakes (LTKs); and those with areas greater than 50,000 m2, called very large thermokarst lakes (VLTKs).
3. Results
3.1. Accuracy Assessment of the Distribution
Figure 2 shows the filtering of the collected environmental variables and the variables after filtering. The variables include data from five bands (SR_B2, SR_B3, SR_B4, SR_B6, and ST_B10), the DEM, slope, aspect, TPI, EVI, TWI, NDWI, mean soil temperature over a thickness of 0–100 cm, and mean annual precipitation. Figure 3 shows the contribution of each variable in the modelling process when the RF was taken as an example. The results revealed that the SR_B6 band was the dominant controlling factor, explaining 9.35% of the variation. Other important factors were the EVI, NDWI, and slope, with explanatory percentages of 9.21%, 8.92%, and 8.15%, respectively. The mean annual precipitation, SR_B2, and DEM were all in the ranges of 7.22%, 7.07%, and 7.05%, respectively. The contribution of the mean soil temperature was also in the range of 6.41%. In comparison, the TWI and aspect had the lowest contributions, and their values were 4.6%.
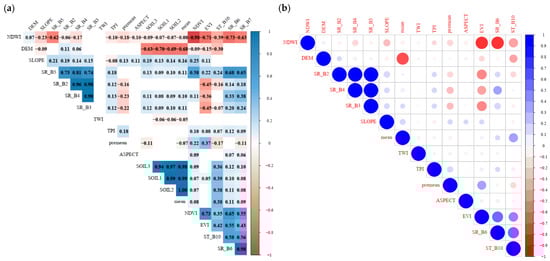
Figure 2.
Filtering of variables: (a) collected environmental variables and (b) variables after filtering.
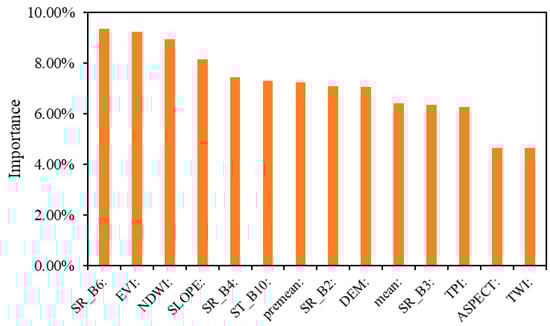
Figure 3.
The importance of the 14 features used in the classification (taking the random forest model as an example).
Table 2 shows the accuracy assessment of each model. The results showed that the RF model performed best in the extraction of thermokarst lakes, followed by the GBDT, CART, and SVM models. RF had the highest PA (98.08), UA (99.51), F1 (98.79), OA (98.90), and K (0.98) values, and GBDT also performed well, with PA = 96.15, UA = 98.52, F1 = 97.32, OA = 97.58, and K = 0.95. In contrast, SVM had the lowest accuracy for thermokarst lake extraction. In general, the OAs of all the models were above 95%, and the K values were above 0.9 except for the SVM, which indicates the reliable quantification of thermokarst lakes in this study.
Table 2.
Accuracy assessment of each model.
3.2. Changes in Thermokarst Lakes from 2015 to 2020 via RF, GBDT, CART, and SVM
The area and number of thermokarst lakes identified via the four machine learning methods from 2015 to 2020 are shown in Supplementary Table S1 and S2. According to the RF model, the number of thermokarst lakes was 88,901, with an area of 794.92 km2 in 2015, and the number and area were 192,778 and 2576.14 km2 in 2020, respectively. According to the GBDT model, the area of thermokarst lakes was 2585.66 km2 in 2020 and the number of thermokarst lakes was 242,518; in 2015, the number of thermokarst lakes was 162,728 and the area was 1107.39 km2. Similarly to the number obtained via GBDT, the number of thermokarst lakes identified via the CART model was 188,354, with a total area of 1020.91 km2 in 2015, and the number in 2020 was 235,645, with an area of 2557.24 km2. The number of thermokarst lakes was the largest in the SVM results, which was 388,224 in 2020, but the area obtained was the smallest (1837.97 km2). In addition, the number and area obtained in 2015 were 346,017 and 1595.25 km2, respectively. Supplementary Table S1 shows that the area of thermokarst lakes obtained via the SVM was mostly lower than 10,000 m2. Overall, the number of thermokarst lakes was 146,661, with an area of approximately 974.40 km2 in 2015 (Table 3 and Table 4), which increased to 223,647 in 2020, with an area increase of 2573.02 km2 (Table 5 and Table 6). The annual rate of increase in number was 15,397 year−1, and the annual rate of increase in area was 319.72 km2 year−1 from 2015 to 2020 (Table 7).
Table 3.
Proportion of various thermokarst lakes to the total number in 2015 (excluding SVM).
Table 4.
Proportion of various thermokarst lakes to the total area in 2015 (excluding SVM).
Table 5.
Proportion of various thermokarst lakes to the total number in 2020 (excluding SVM).
Table 6.
Proportion of various thermokarst lakes to the total area in 2020 (excluding SVM).
Table 7.
The number and area of thermokarst lakes increased from 2015 to 2020 (calculated according to the average of RF, CART, and GBDT models, i.e., excluding SVM).
Figure 4 shows the distributions of thermokarst lakes obtained via the RF, GBDT, CART, and SVM models. In 2015, STKs accounted for more than 50% of the total lake number (76,716), followed by MTKs (57,641), LTKs (9210), and VLTKs (3094), accounting for 39.1%, 6.6%, and 2.3%, respectively (Table 3). In 2020, the number of STKs increased to 86,555, which constituted 38.6% of the total number, and the number of MTKs rose to 102,337, accounting for 45.8%. The number of LTKs increased to 26,774, representing 12.0%, whereas the number of VLTKs increased to 7981, accounting for 3.6% (Table 5). The variations in thermokarst lake numbers differed in size, with the annual increase in number as follows: MTKs (8939 /year−1) > LTKs (3513 /year−1) > STKs (1968 /year−1) > VLTKs (977 /year−1) (Table 7). Notably, the variations in area demonstrated dramatic variations among the different lake sizes. From 2015 to 2020, the areas of STKs, MTKs, LTKs, and VLTKs expanded at annual rates of 0.98 km2/year−1, 34.11 km2/year−1, 74.55 km2/year−1, and 210.08 km2/year−1, respectively (Table 7). These findings indicated that the number of STKs and MTKs increased rapidly while their area grew slowly, whereas VLTKs presented the opposite pattern. From 2015 to 2020, the increase in the area of thermokarst lakes was dominated by LTKs and VLTKs, accounting for 89% of the total area of thermokarst lakes (23% and 66% for LTKs and VLTKs, respectively) (Table 7). In general, the number of thermokarst lakes on the QTP has shown an increasing trend in recent years. Moreover, STKs were distributed mainly in Ruoergai County, Sichuan Province. In the central part of the QTP, most STKs developed into MTKs. Compared with 2015, many MTKs were found in Zaduo County, which is located in Yushu Autonomous Prefecture. The thermokarst lakes are distributed mainly in the middle of the QTP and have gradually developed in the east in recent years.
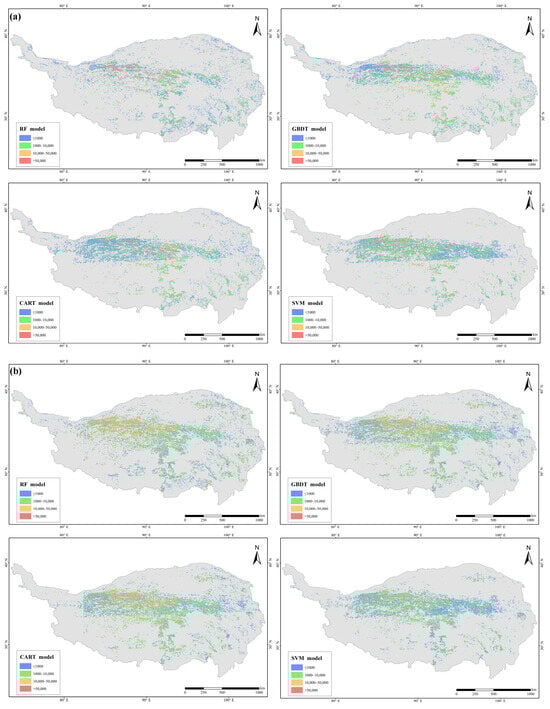
Figure 4.
Distribution of thermokarst lakes obtained via the RF, GBDT, CART, and SVM models: (a) in 2015 and (b) in 2020.
3.3. The Distribution of Thermokarst Lakes
Figure 5 shows the key environmental factors influencing the formation of thermokarst lakes. The environmental factors can be classified into two major categories, one of which does not undergo significant changes in a short period of time (NUSC), whereas the other undergoes drastic changes with time (UDC). The NUSC included elevation, slope, clay, sand, and soil bulk density, and the UDC included the NDVI, EVI, mean annual precipitation, mean annual temperature, soil temperature, and soil moisture content.
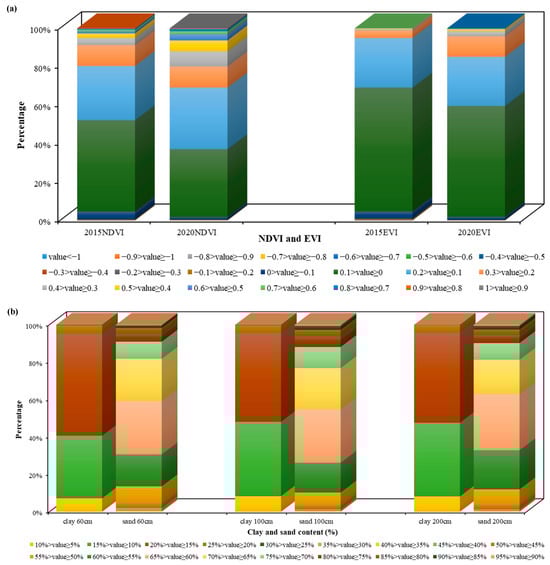
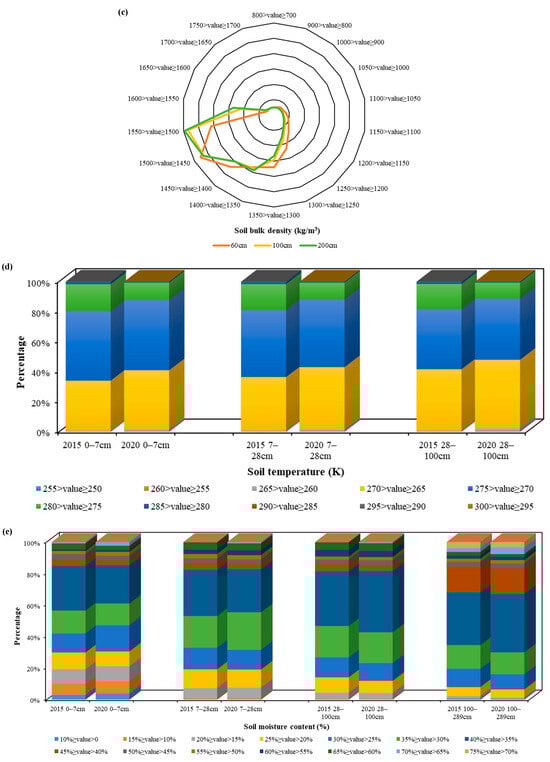
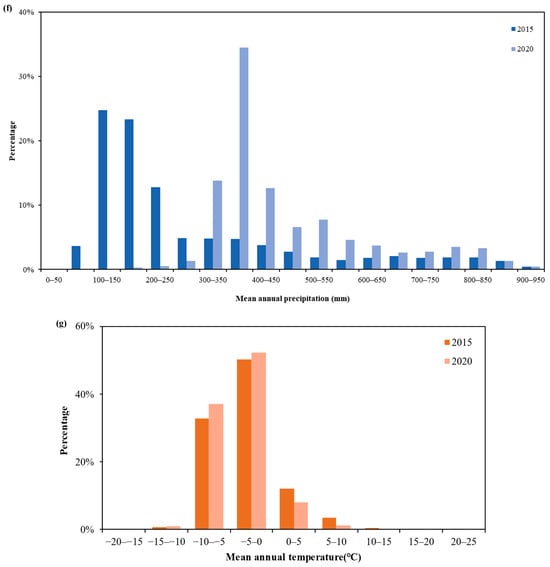
Figure 5.
Range statistics for each environmental variable: (a) NDVI and EVI, (b) clay and sand content, (c) soil bulk density, (d) soil temperature, (e) soil moisture content, (f) mean annual precipitation, and (g) mean annual temperature.
The results showed that, for the NUSC, most of the thermokarst lakes were located at elevations of 4000–5000 m, with slopes between 0 and 5 degrees. Most of the thermokarst lakes had clay and sand contents ranging from 15 to 20% and 60 to 65%, respectively (Figure 5). The thermokarst lakes had the same values of soil bulk density at soil depths of 100 cm and 200 cm, with values between 1.50 × 10³ and 1.55 × 10³ kg/m3, respectively, and their values were between 1.45 × 10³ and 1.50 × 10³ kg/m3, respectively, at a soil depth of 60 cm.
For the UDC, the NDVI and EVI figures for thermokarst lakes predominantly varied between 0 and 0.10 in 2015, increasing to between 0.10 and 0.20 in 2020. The thermokarst lakes were distributed mainly in areas with mean annual precipitation ranging from 100 to 150 mm in 2015 and 350 to 400 mm in 2020. The changes in annual temperature from 2015 to 2020 were not significant, and most of the thermokarst lakes were located between 0 °C and −5 °C. Most of the thermokarst lakes were associated with soil temperatures and soil moisture concentrations ranging from 270 to 275 K and 35 to 40%, respectively. Overall, the NDWI and EVI were the main controlling factors influencing the formation of thermokarst lakes, and the other important regulating factors included precipitation, temperature, DEM, and slope.
4. Discussion
4.1. RF Performed Best in the Extraction of Thermokarst Lakes
The results showed that RF performed best in quantifying thermokarst lakes out of the four methods, with an OA value of 98.90% and a K of 0.98. Compared with the SVM and CART methods, the RF method has been demonstrated to be fast to train and highly stable [41]. The accuracy of GBDT ranked second, whereas SVM had low accuracy. This result is consistent with those of previous studies [42], which demonstrated that RF outperformed SVM in the extraction of thermokarst lakes. In GEE, the importance of environmental factors in RF is calculated mainly on the basis of the Gini coefficient [23], and there is no uniform standard for the selection of conditional factors in modelling; the specific factors and their number tend to vary considerably in different studies [42]. So, RF and GBDT performed optimally in the extraction of thermokarst lakes.
4.2. Spatial and Temporal Variability of Thermokarst Lakes
The results revealed that the number of thermokarst lakes increased by 52.5% from 2015 to 2020, and the percentage increases in STKs, MTKs, LTKs, and VLTKs were 12.8%, 58.1%, 22.8%, and 6.3% (Table 7), respectively. The results of the number and area of thermokarst lakes were similar to those of previous studies [20,39]. The results also revealed that the increase in number was due to the sharp increases in MTKs and LTKs, possibly due to continued warming, which increased permafrost degradation [17]. Moreover, the area increased by approximately 1.6 times, and the percentage increases in area of STKs, MTKs, LTKs, and VLTKs were 0.3%, 10.7%, 23.3%, and 65.7% (Table 7), respectively, which was consistent with previous research [17,18]. Consequently, although the number of STKs is large, their contribution to the area is relatively small. The results are consistent with the results of using deep learning models, which showed that the number of small lakes accounts for a large proportion of the total number, but their proportion in the total area is very small [43]. The increase in number was caused mainly by MTKs and LTKs, and the increase in area was caused mainly by LTKs and VLTKs.
In terms of specific spatial distributions, the distributions of MTKs, LTKs, and VLTKs were relatively concentrated and were located mainly in the central part of the QTP in 2015 [17]. STKs were dispersed in the northern and southern parts of the QTP, with fewer MTKs found in the southeastern region. In 2020, VLTKs predominantly expanded in the central QTP, while the distributions of MTKs and LTKs were not as concentrated as they were in 2015. In 2020, STKs were primarily concentrated in the eastern part of the QTP, with few occurrences in the arid western regions [44]. Additionally, there has been significant development of MTKs near Zaduo County and Koucha Lake, along with the Beilu River basin and Wudaoliang region, compared with 2015. Many STKs have developed into MTKs, which has also resulted in more MTKs [45], suggesting that recent temperature changes have substantially impacted the region’s permafrost degradation. Furthermore, many STKs are distributed in Amdo and Ruoergai Counties, indicating that permafrost in these areas is vulnerable to thawing [45]. Overall, thermokarst lakes are predominantly located in the central part of the QTP, which is generally consistent with the distribution of permafrost [14].
4.3. The Environmental Factors Influencing the Formation of Thermokarst Lakes
The results revealed that the EVI and NDWI were the most important factors for identifying thermokarst lakes (Figure 3). NDWI is a remote sensing index specifically used for identifying and extracting water bodies, which plays a crucial role in the dynamic monitoring of thermokarst lakes. This is because water absorbs nearly all the incident energy in the NIR and SWIR bands, whereas the ground reflects a large amount of energy, making the NDWI particularly effective for the identification of water bodies [46]. Vegetation coverage could be associated with the occurrence of thermokarst lakes [16]. We also discovered low values of the EVI and NDVI for most thermokarst lakes [47], indicating that higher vegetation coverage might help retain permafrost, thereby inhibiting the formation of thermokarst lakes [16]. Nevertheless, compared with 2015, the EVI and NDVI increased in 2020 (Figure 5); this may be due to the fact that, with the maturation of the lake, the pH increases, which is conducive to the growth of phytoplankton and periphyton and thus leads to increasing trends in the NDVI and EVI [48].
The results revealed that the formation of thermokarst lakes depends on the underground ice content and that topography influences their distribution. Moreover, changes in temperature and precipitation create conditions for the melting of underground ice. Furthermore, vegetation has a protective effect on permafrost and inhibits the formation of thermokarst lakes. The results revealed that thermokarst lakes are typically distributed at elevations ranging from 4000 to 5000 m, with slopes between 0 and 5°. Previous studies have reported close associations between ice content and topography [29]. Additionally, flat terrain (with a slope <5°) is conducive to the deposition of fine soil, which in turn regulates surface drainage [49], whereas overly steep slopes limit the accumulation of water [21]. Therefore, slope plays a significant role in the identification of thermokarst lakes. Temperature and precipitation also strongly affect thermokarst lake formation. The temperature determines the intensity of freeze-thaw cycles, as rising temperatures accelerate permafrost thawing and the expansion of thermokarst lakes [16,17]. Precipitation-induced moisture enhances heat conduction into the ground, accelerating both top-down melting and the sudden thawing of permafrost [49]. We found that from 2015 to 2020, the annual precipitation increased from 100–200 mm to 350–400 mm. Consequently, frequent precipitation positively influences the water level of thermokarst lakes, leading to an increase in the lake’s surface area [17]. Notably, the sand content in most thermokarst lakes is relatively high, accounting for approximately 65%, whereas the clay content is only approximately 15%. This phenomenon can be explained in two ways: on the one hand, it may be determined by the preexisting soil on the QTP [50]; on the other hand, it may be related to soil erosion during freezing and thawing [51].
4.4. Limitations and Future Perspectives
In this study, we quantified changes in the spatial and temporal distributions of thermokarst lakes on the QTP from 2015 to 2020. There are some limitations to this study. First, the Landsat series of images with a low spatial resolution (30 m) was selected due to the lack of remote sensing images of the QTP, which is insufficient for the identification of smaller thermokarst lakes. In addition, because the QTP is large and sparsely populated, and because most of the thermokarst lakes are located in uninhabited areas, we were not able to carry out field monitoring of the thermokarst lakes, but we verified the results by synthesizing published papers and high-precision remote sensing images to increase their accuracy. Subsequently, model assumptions and the temporal limitations of the study period also have the potential to influence the results. In addition to the four models used in this study, recent studies have shown that convolutional neural networks and deep residual networks are better than traditional machine learning methods in landslide monitoring [52,53]; thus, they can be used to facilitate the identification of thermokarst lakes to reduce the inaccuracy of identifying smaller thermokarst lakes in future works, and could have implications for carbon emission predictions induced by thermokarst lakes.
5. Conclusions
In this study, RF and GBDT performed the best, with an OA of approximately 98%, and the K value was approximately 0.95 among the RF, GBDT, and CART models. The number and area of thermokarst lakes showed an increasing trend on the QTP between 2015 and 2020, during which the area expanded by 1598.60 km2, which was approximately 1.6 times the area in 2015, and the number increased by 76,986. Moreover, the number of STKs was the largest in 2015, while the proportion of MTKs in 2020 was the largest. A large proportion of STKs gradually developed into MTKs in the central part of the QTP. Although the numbers of LTKs and VLTKs did not fluctuate much, the area they increased contributed up to 89% of the total increased area. In addition, we found that the EVI, NDWI, SLOPE, mean annual precipitation, and mean annual temperature greatly helped in the identification of thermokarst lakes. The thermokarst lakes were generally located at elevations between 4000 and 5000 m with slopes between 0 and 5°, and the EVI and NDVI tended to increase with the development of the lakes. The results provide a reference for studying the dynamics of thermokarst lakes under climate change.
Supplementary Materials
The following supporting information can be downloaded at: https://www.mdpi.com/article/10.3390/rs17071174/s1, Figure S1: Map of field survey data from 2020; Table S1: Number of thermokarst lakes identified in 2015 via four machine learning methods: RF, GBDT, CART, and SVM; Table S2: Number of thermokarst lakes identified in 2020 via four machine learning methods: RF, GBDT, CART, and SVM; Table S3: Area of thermokarst lakes identified in 2015 via four machine learning methods: RF, GBDT, CART, and SVM; Table S4: Area of thermokarst lakes identified in 2020 via four machine learning methods: RF, GBDT, CART, and SVM.
Author Contributions
Conceptualization, R.W.; data curation, R.W. and S.Z.; formal analysis, R.W.; funding acquisition, X.H.; investigation, R.W., X.H. and S.Z.; methodology, R.W.; project administration, X.H.; resources, X.H. and S.Z.; software, R.W. and S.Z.; supervision, X.H.; validation, R.W. and S.Z.; visualization, R.W.; writing—original draft, R.W.; writing—review and editing, R.W., X.H. and S.Z. All authors have read and agreed to the published version of the manuscript.
Funding
This study was financially supported by the National Natural Science Foundation of China (Grant number: 42371107).
Data Availability Statement
The raw data supporting the conclusions of this article will be made available by the authors on request.
Conflicts of Interest
The authors declare no conflicts of interest.
References
- Intergovernmental Panel on Climate Change. Climate Change 2021–The Physical Science Basis; Cambridge University Press: Cambridge, UK; New York, NY, USA, 2023. [Google Scholar]
- Mu, C.; Shang, J.; Zhang, T.; Fan, C.; Wang, S.; Peng, X.; Zhong, W.; Zhang, F.; Mu, M.; Jia, L. Acceleration of thaw slump during 1997–2017 in the Qilian Mountains of the northern Qinghai-Tibetan plateau. Landslides 2020, 17, 1051–1062. [Google Scholar] [CrossRef]
- Jorgenson, M.T.; Osterkamp, T.E. Response of boreal ecosystems to varying modes of permafrost degradation. Can. J. For. Res. 2005, 35, 2100–2111. [Google Scholar] [CrossRef]
- Liebner, S.; Welte, C.U. Roles of Thermokarst Lakes in a Warming World. Trends Microbiol. 2020, 28, 769–779. [Google Scholar] [CrossRef]
- Manasypov, R.M.; Pokrovsky, O.S.; Shirokova, L.S.; Auda, Y.; Zinner, N.S.; Vorobyev, S.N.; Kirpotin, S.N. Biogeochemistry of macrophytes, sediments and porewaters in thermokarst lakes of permafrost peatlands, western Siberia. Sci. Total Environ. 2021, 763, 144201. [Google Scholar] [CrossRef]
- Ren, Z.; Ma, K.; Jia, X.; Wang, Q.; Zhang, C.; Li, X. Metagenomics Unveils Microbial Diversity and Their Biogeochemical Roles in Water and Sediment of Thermokarst Lakes in the Yellow River Source Area. Microb. Ecol. 2023, 85, 904–915. [Google Scholar] [CrossRef]
- Mu, C.; Mu, M.; Wu, X.; Jia, L.; Fan, C.; Peng, X.; Ping, C.-L.; Wu, Q.; Xiao, C.; Liu, J. High carbon emissions from thermokarst lakes and their determinants in the Tibet Plateau. Glob. Change Biol. 2023, 29, 2732–2745. [Google Scholar] [CrossRef]
- Zhao, Y.-D.; Hu, X. The diversity and function of microbial community in the sediment and terrestrial area of thermokarst lakes. CATENA 2023, 233, 107505. [Google Scholar] [CrossRef]
- Zakharova, E.A.; Kouraev, A.V.; Stephane, G.; Franck, G.; Desyatkin, R.V.; Desyatkin, A.R. Recent dynamics of hydro-ecosystems in thermokarst depressions in Central Siberia from satellite and in situ observations: Importance for agriculture and human life. Sci. Total Environ. 2018, 615, 1290–1304. [Google Scholar] [CrossRef]
- Nitze, I.; Grosse, G.; Jones, B.M.; Arp, C.D.; Ulrich, M.; Fedorov, A.; Veremeeva, A. Landsat-Based Trend Analysis of Lake Dynamics Across Northern Permafrost Regions. Remote Sens. 2017, 9, 640. [Google Scholar] [CrossRef]
- Hu, J.; Huang, H.; Chi, Z.; Cheng, X.; Wei, Z.; Chen, P.; Xu, X.; Qi, S.; Xu, Y.; Zheng, Y. Distribution and Evolution of Supraglacial Lakes in Greenland During the 2016–2018 Melt Seasons. Remote Sens. 2022, 14, 55. [Google Scholar] [CrossRef]
- Qin, Y.; Zhang, C.; Lu, P. A fully automatic framework for sub-pixel mapping of thermokarst lakes using Sentinel-2 images. Sci. Remote Sens. 2023, 8, 100111. [Google Scholar] [CrossRef]
- Janiec, P.; Nowosad, J.; Zwoliński, Z. A machine learning method for Arctic lakes detection in the permafrost areas of Siberia. Eur. J. Remote Sens. 2023, 56, 2163923. [Google Scholar] [CrossRef]
- Zou, D.; Zhao, L.; Sheng, Y.; Chen, J.; Hu, G.; Wu, T.; Wu, J.; Xie, C.; Wu, X.; Pang, Q.; et al. A new map of permafrost distribution on the Tibetan Plateau. Cryosphere 2017, 11, 2527–2542. [Google Scholar] [CrossRef]
- Ran, Y.; Li, X.; Cheng, G. Climate warming over the past half century has led to thermal degradation of permafrost on the Qinghai–Tibet Plateau. Cryosphere 2018, 12, 595–608. [Google Scholar] [CrossRef]
- Lin, Z.; Luo, J.; Niu, F. Development of a thermokarst lake and its thermal effects on permafrost over nearly 10 yr in the Beiluhe Basin, Qinghai-Tibet Plateau. Geosphere 2016, 12, 632–643. [Google Scholar] [CrossRef]
- Luo, J.; Niu, F.; Lin, Z.; Liu, M.; Yin, G. Thermokarst lake changes between 1969 and 2010 in the Beilu River Basin, Qinghai–Tibet Plateau, China. Sci. Bull. 2015, 60, 556–564. [Google Scholar] [CrossRef]
- Luo, J.; Niu, F.; Lin, Z.; Liu, M.; Yin, G.; Gao, Z. Abrupt increase in thermokarst lakes on the central Tibetan Plateau over the last 50 years. CATENA 2022, 217, 106497. [Google Scholar] [CrossRef]
- Șerban, R.-D.; Jin, H.; Șerban, M.; Luo, D. Shrinking thermokarst lakes and ponds on the northeastern Qinghai-Tibet plateau over the past three decades. Permafr. Periglac. Process. 2021, 32, 601–617. [Google Scholar] [CrossRef]
- Wang, R.; Guo, L.; Yang, Y.; Zheng, H.; Liu, L.; Jia, H.; Diao, B.; Liu, J. Thermokarst Lake Susceptibility Assessment Induced by Permafrost Degradation in the Qinghai–Tibet Plateau Using Machine Learning Methods. Remote Sens. 2023, 15, 3331. [Google Scholar] [CrossRef]
- Niu, F.; Lin, Z.; Lu, J.; Luo, J.; Wang, H. Assessment of terrain susceptibility to thermokarst lake development along the Qinghai–Tibet engineering corridor, China. Environ. Earth Sci. 2015, 73, 5631–5642. [Google Scholar] [CrossRef]
- Li, R.; Zhang, M.; Pei, W.; Melnikov, A.; Zhang, Z.; Li, G. Risk evaluation of thaw settlement using machine learning models for the Wudaoliang-Tuotuohe region, Qinghai-Tibet Plateau. CATENA 2023, 220, 106700. [Google Scholar] [CrossRef]
- Yu, Y.; Hui, F.; Zhou, Y.; Liu, C.; Cheng, X. The first 10 m resolution thermokarst lake and pond dataset for the Lena Basin in the 2020 thawing season. Big Earth Data 2024, 8, 302–332. [Google Scholar] [CrossRef]
- Wei, Z.; Du, Z.; Wang, L.; Zhong, W.; Lin, J.; Xu, Q.; Xiao, C. Sedimentary organic carbon storage of thermokarst lakes and ponds across Tibetan permafrost region. Sci. Total Environ. 2022, 831, 154761. [Google Scholar] [CrossRef] [PubMed]
- Wang, Z.-W.; Wang, Q.; Zhao, L.; Wu, X.-D.; Yue, G.-Y.; Zou, D.-F.; Nan, Z.-T.; Liu, G.-Y.; Pang, Q.-Q.; Fang, H.-B.; et al. Mapping the vegetation distribution of the permafrost zone on the Qinghai-Tibet Plateau. J. Mt. Sci. 2016, 13, 1035–1046. [Google Scholar] [CrossRef]
- Ding, J.; Chen, L.; Ji, C.; Hugelius, G.; Li, Y.; Liu, L.; Qin, S.; Zhang, B.; Yang, G.; Li, F.; et al. Decadal soil carbon accumulation across Tibetan permafrost regions. Nat. Geosci. 2017, 10, 420–424. [Google Scholar] [CrossRef]
- Lu, H.; Wu, N.; Gu, Z.; Guo, Z.; Wang, L.; Wu, H.; Wang, G.; Zhou, L.; Han, J.; Liu, T. Distribution of carbon isotope composition of modern soils on the Qinghai-Tibetan Plateau. Biogeochemistry 2004, 70, 275–299. [Google Scholar] [CrossRef]
- Ni, J.; Wu, T.; Zhu, X.; Hu, G.; Zou, D.; Wu, X.; Li, R.; Xie, C.; Qiao, Y.; Pang, Q.; et al. Simulation of the Present and Future Projection of Permafrost on the Qinghai-Tibet Plateau with Statistical and Machine Learning Models. J. Geophys. Res. Atmos. 2021, 126, e2020JD033402. [Google Scholar] [CrossRef]
- Ran, Y.; Li, X.; Cheng, G.; Nan, Z.; Che, J.; Sheng, Y.; Wu, Q.; Jin, H.; Luo, D.; Tang, Z.; et al. Mapping the permafrost stability on the Tibetan Plateau for 2005–2015. Sci. China Earth Sci. 2021, 64, 62–79. [Google Scholar] [CrossRef]
- Wulder, M.A.; Roy, D.P.; Radeloff, V.C.; Loveland, T.R.; Anderson, M.C.; Johnson, D.M.; Healey, S.; Zhu, Z.; Scambos, T.A.; Pahlevan, N.; et al. Fifty years of Landsat science and impacts. Remote Sens. Environ. 2022, 280, 113195. [Google Scholar] [CrossRef]
- Irons, J.R.; Dwyer, J.L.; Barsi, J.A. The next Landsat satellite: The Landsat Data Continuity Mission. Remote Sens. Environ. 2012, 122, 11–21. [Google Scholar] [CrossRef]
- Gorelick, N.; Hancher, M.; Dixon, M.; Ilyushchenko, S.; Thau, D.; Moore, R. Google Earth Engine: Planetary-scale geospatial analysis for everyone. Remote Sens. Environ. 2017, 202, 18–27. [Google Scholar] [CrossRef]
- Rodriguez-Galiano, V.F.; Chica-Olmo, M.; Abarca-Hernandez, F.; Atkinson, P.M.; Jeganathan, C. Random Forest classification of Mediterranean land cover using multi-seasonal imagery and multi-seasonal texture. Remote Sens. Environ. 2012, 121, 93–107. [Google Scholar] [CrossRef]
- Liang, W.; Luo, S.; Zhao, G.; Wu, H. Predicting Hard Rock Pillar Stability Using GBDT, XGBoost, and LightGBM Algorithms. Mathematics 2020, 8, 765. [Google Scholar] [CrossRef]
- Were, K.; Bui, D.T.; Dick, Ø.B.; Singh, B.R. A comparative assessment of support vector regression, artificial neural networks, and random forests for predicting and mapping soil organic carbon stocks across an Afromontane landscape. Ecol. Indic. 2015, 52, 394–403. [Google Scholar] [CrossRef]
- Drake, J.M.; Randin, C.; Guisan, A. Modelling ecological niches with support vector machines. J. Appl. Ecol. 2006, 43, 424–432. [Google Scholar] [CrossRef]
- González, C.; Mira-McWilliams, J.; Juárez, I. Important variable assessment and electricity price forecasting based on regression tree models: Classification and regression trees, Bagging and Random Forests. IET Gener. Transm. Distrib. 2015, 9, 1120–1128. [Google Scholar] [CrossRef]
- Frantz, D.; Haß, E.; Uhl, A.; Stoffels, J.; Hill, J. Improvement of the Fmask algorithm for Sentinel-2 images: Separating clouds from bright surfaces based on parallax effects. Remote Sens. Environ. 2018, 215, 471–481. [Google Scholar] [CrossRef]
- Wei, Z.; Du, Z.; Wang, L.; Lin, J.; Feng, Y.; Xu, Q.; Xiao, C. Sentinel-Based Inventory of Thermokarst Lakes and Ponds Across Permafrost Landscapes on the Qinghai-Tibet Plateau. Earth Space Sci. 2021, 8, e2021EA001950. [Google Scholar] [CrossRef]
- Plug, L.J.; Walls, C.; Scott, B.M. Tundra lake changes from 1978 to 2001 on the Tuktoyaktuk Peninsula, western Canadian Arctic. Geophys. Res. Lett. 2008, 35, L03502. [Google Scholar] [CrossRef]
- Belgiu, M.; Drăguţ, L. Random forest in remote sensing: A review of applications and future directions. ISPRS J. Photogramm. Remote Sens. 2016, 114, 24–31. [Google Scholar] [CrossRef]
- Wang, R.; Guo, L.; Yang, Y.; Zheng, H.; Jia, H.; Diao, B.; Li, H.; Liu, J. Thermokarst lake susceptibility assessment using machine learning models in permafrost landscapes of the Arctic. Sci. Total Environ. 2023, 900, 165709. [Google Scholar] [CrossRef] [PubMed]
- Zhang, K.; Feng, M.; Sui, Y.; Xu, J.; Yan, D.; Hu, Z.; Han, F.; Sthapit, E. Identifying thermokarst lakes using deep learning and high-resolution satellite images. Sci. Remote Sens. 2024, 10, 100175. [Google Scholar] [CrossRef]
- Zhou, L.; Yang, Y.; Zhang, D.; Yao, H. Recent advances in hydrology studies under changing permafrost on the Qinghai-Xizang Plateau. Res. Cold Arid. Reg. 2024, 16, 159–169. [Google Scholar] [CrossRef]
- Zhu, J.; Luo, J.; Zhang, H.; Zhang, J. Distribution and changes of thermokarst lakes along the Qinghai-Tibet Railway from 1991 to 2022. Res. Cold Arid. Reg. 2024. [Google Scholar] [CrossRef]
- Zhou, Y.; Dong, J.; Xiao, X.; Xiao, T.; Yang, Z.; Zhao, G.; Zou, Z.; Qin, Y. Open Surface Water Mapping Algorithms: A Comparison of Water-Related Spectral Indices and Sensors. Water 2017, 9, 256. [Google Scholar] [CrossRef]
- Liu, C.; Zhang, X.; Wang, T.; Chen, G.; Zhu, K.; Wang, Q.; Wang, J. Detection of vegetation coverage changes in the Yellow River Basin from 2003 to 2020. Ecol. Indic. 2022, 138, 108818. [Google Scholar] [CrossRef]
- Zabelina, S.A.; Shirokova, L.S.; Klimov, S.I.; Chupakov, A.V.; Lim, A.G.; Polishchuk, Y.M.; Polishchuk, V.Y.; Bogdanov, A.N.; Muratov, I.N.; Guerin, F.; et al. Carbon emission from thermokarst lakes in NE European tundra. Limnol. Oceanogr. 2021, 66, S216–S230. [Google Scholar] [CrossRef]
- Yin, G.; Luo, J.; Niu, F.; Zhou, F.; Meng, X.; Lin, Z.; Liu, M. Spatial Analyses and Susceptibility Modeling of Thermokarst Lakes in Permafrost Landscapes Along the Qinghai–Tibet Engineering Corridor. Remote Sens. 2021, 13, 1974. [Google Scholar] [CrossRef]
- Li, W.; Zhao, L.; Wu, X.; Wang, S.; Sheng, Y.; Ping, C.; Zhao, Y.; Fang, H.; Shi, W. Soil distribution modeling using inductive learning in the eastern part of permafrost regions in Qinghai–Xizang (Tibetan) Plateau. CATENA 2015, 126, 98–104. [Google Scholar] [CrossRef]
- Shi, Z.H.; Fang, N.F.; Wu, F.Z.; Wang, L.; Yue, B.J.; Wu, G.L. Soil erosion processes and sediment sorting associated with transport mechanisms on steep slopes. J. Hydrol. 2012, 454–455, 123–130. [Google Scholar] [CrossRef]
- Liu, R.; Yang, X.; Xu, C.; Wei, L.; Zeng, X. Comparative Study of Convolutional Neural Network and Conventional Machine Learning Methods for Landslide Susceptibility Mapping. Remote Sens. 2022, 14, 321. [Google Scholar] [CrossRef]
- Lv, L.; Chen, T.; Dou, J.; Plaza, A. A hybrid ensemble-based deep-learning framework for landslide susceptibility mapping. Int. J. Appl. Earth Obs. Geoinf. 2022, 108, 102713. [Google Scholar] [CrossRef]
Disclaimer/Publisher’s Note: The statements, opinions and data contained in all publications are solely those of the individual author(s) and contributor(s) and not of MDPI and/or the editor(s). MDPI and/or the editor(s) disclaim responsibility for any injury to people or property resulting from any ideas, methods, instructions or products referred to in the content. |
© 2025 by the authors. Licensee MDPI, Basel, Switzerland. This article is an open access article distributed under the terms and conditions of the Creative Commons Attribution (CC BY) license (https://creativecommons.org/licenses/by/4.0/).