Highlights
What are the main findings?
- The temporal extension of the spatial neighborhood sampling method used in radar data assimilation effectively resolves retrieval performance degradation from model temporal biases, resulting in improved sampling capability.
- Utilizing an optimized model with dual-polarization radar data to improve the initial moisture fields in Numerical Weather Prediction (NWP) models effectively enhances the forecasting capability for radar echoes and precipitation within the first 6 h.
What is the implication of the main finding?
- This study confirms the value of dual-polarization radar data assimilation based on a time-extended neighborhood sampling strategy, offering an effective reference for improving initial field construction and short-term forecasting in NWP models.
- The framework provides a feasible solution to overcome the limitations of spatial-only sampling under model temporal drift, with potential for extension to other rapidly evolving weather systems.
Abstract
In numerical weather prediction (NWP) models, radar data are commonly utilized to retrieve relative humidity fields, thereby mitigating forecast errors arising from uncertainties in the initial moisture field. This study addresses the degradation in convective structure retrieval capability caused by temporal biases in NWP when using spatial neighborhood sampling methods with radar data for relative humidity field retrieval. We developed a time-extended Bayesian retrieval method and constructed a dual-polarization radar data assimilation framework compatible with the China Meteorological Administration Mesoscale Model (CMA-MESO). The core of this approach lies in expanding the Bayesian retrieval sample library by integrating forecast fields from two hours before and after the assimilation time, thereby improving the inadequate performance of traditional spatial sampling under model temporal bias. When applied to a heavy rainfall event in North China in July 2023, this method effectively reduced retrieval errors. The subsequent assimilation of retrieved humidity fields enhanced the Threat Scores for 0–6 h precipitation forecasts and demonstrated improvement in overprediction bias. This confirms that the time-extended strategy can effectively enhance moisture field analysis and nowcasting accuracy by overcoming the inherent limitations of spatial-only sampling.
1. Introduction
Accurate representation of atmospheric water vapor is fundamental to the precision of precipitation forecasts in numerical weather prediction (NWP) models [1,2]. Conventional observation systems, however, struggle to provide data at the required resolution and accuracy. While widely used, radiosonde networks offer limited spatiotemporal coverage and can exhibit systematic biases, especially in humidity measurements during extreme weather events [3]. Similarly, spaceborne instruments observing the lower troposphere are often compromised by interference from clouds, aerosols, and molecular scattering [4,5]. Radar systems offer a valuable alternative, characterized by high spatiotemporal resolution and continuous monitoring capabilities. To address the resolution constraints of traditional humidity measurements, researchers such as Caumont et al. and Zhang C. et al. have developed innovative methods that establish quantitative relationships between radar reflectivity and atmospheric humidity profiles [6,7]. These approaches have significantly advanced the assimilation of radar data into meteorological models.
Current methodologies for assimilating radar data into weather models fall into two primary categories: direct and indirect assimilation. The direct approach, which incorporates radar reflectivity and Doppler radial velocity observations, has demonstrated operational value in convective-scale forecasting. For instance, Xiao et al. successfully assimilated radar radial velocity using a three-dimensional variational (3D-Var) system [8], while Tong et al. enhanced short-term predictions for severe storms by assimilating reflectivity data with an Ensemble Kalman Filter [9]. Such direct assimilation improves the forecast of a storm’s structure and position. However, this method faces significant challenges. Studies by Wang et al. and Putnam et al. have shown that the strong nonlinear relationship between radar observations and model states can introduce substantial errors during the linearization process required by many algorithms [10,11]. Furthermore, implementing direct assimilation necessitates complex nonlinear observation operators and their adjoints, which considerably increases both algorithmic complexity and computational cost.
In contrast, indirect assimilation methods circumvent these nonlinearity issues by first deriving model-compatible state variables from the radar data. A common technique within this framework is cloud analysis, which uses radar reflectivity to estimate hydrometeors and cloud water vapor content [12,13]. This method effectively improves the initial representation of cloud fields and shortens the model’s initialization period [14,15]. A key limitation, however, is its reliance on semi-empirical rules, which can create inconsistencies between the analyzed state and the model’s dynamics, leading to the rapid growth of forecast errors [16].
To overcome these limitations, Caumont et al. introduced an indirect assimilation technique that employs a Bayesian retrieval framework, utilizing spatial neighborhood sampling to assimilate radar reflectivity data [6]. This method offers two key advantages: it requires only a forward operator, thus circumventing linearization errors, and it ensures that the retrieved state is physically consistent with the model’s background field. This leverages the model’s inherent information to effectively correct positional displacements. Subsequent studies by Wattrelot et al. and Wu et al. have validated the efficacy of this Bayesian approach for both ground-based and spaceborne radar systems [17,18].
A significant advancement in radar technology has been the advent of dual-polarization radar, which provides critical microphysical insights—including hydrometeor type, shape, and size—that conventional Doppler radar cannot offer [19,20]. Building upon the foundational work of Caumont et al., Augros et al. integrated these dual-polarization variables into the Bayesian retrieval framework [6,21]. This integration significantly improved the method’s performance, particularly by enhancing its ability to retrieve accurate information in regions where the radar signal experiences strong attenuation.
While Bayesian methods have significantly advanced radar data assimilation, a critical challenge remains in addressing inherent temporal biases within Numerical Weather Prediction (NWP) models, which cannot be resolved through spatial information or conventional assimilation techniques alone [22,23,24,25]. To overcome these limitations, this study introduces a time-extended Bayesian retrieval framework that integrates dual-polarization radar parameters with a time-neighborhood sampling strategy. By incorporating time-extended forecast information, this approach enhances the spatiotemporal consistency of the retrieval process. We utilize a methodology combining one-dimensional retrieval with three-dimensional variational assimilation (1D+3D-Var), supported by the Accurate and Efficient Radar Operator developed by Zhejiang University (ZJU-AERO) [26,27,28].
Leveraging dual-polarization radar data—selected for its high spatial resolution and detailed microphysical information—we analyze both its vertical profile characteristics and the spatiotemporal evolution patterns from regional model forecasts. This enables the construction of a time-extended collaborative retrieval model. Case validation demonstrates that our approach effectively improves the assimilation accuracy of dual-polarization radar data and subsequently enhances the heavy rainfall prediction capability of the China Meteorological Administration Mesoscale Model (CMA-MESO).
2. Data and Methods
2.1. Radar Data and Processing
This study utilized observational data from 20 S-band dual-polarization weather radars across North China. Figure 1 illustrates their spatial distribution and composite coverage, with the study region marked by a blue box and radar coverage indicated in gray. The raw radar data underwent comprehensive quality control to ensure reliability. Following quality control, the data were interpolated onto the three-dimensional computational grid of the CMA-MESO model. Vertical interpolation was performed between model layers 15 and 42 at every third layer to maintain essential information while ensuring computational stability.
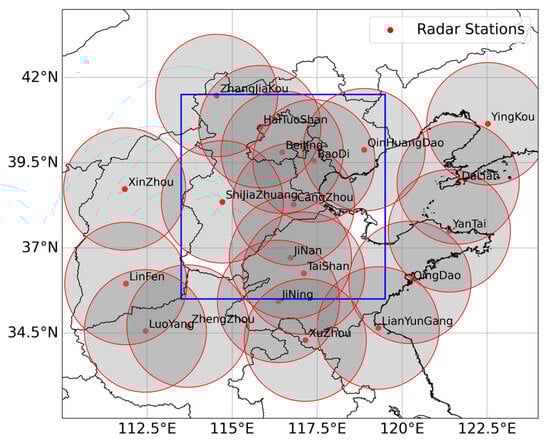
Figure 1.
S-band dual-polarization radar distribution and observation coverage diagram. The blue box indicates the experimental area, and the gray shading represents the radar observation coverage area, and the red circles denote the detection boundary of each radar station.
To maintain data quality for the inversion process, specific thresholds were applied. Grid points exhibiting horizontal reflectivity (ZH) below 5 dBZ but containing detectable signals were adjusted to a baseline value of 5 dBZ, while corresponding specific differential phase (KDP) values were discarded. Furthermore, only vertical profiles with maximum reflectivity exceeding 15 dBZ—a standard threshold for detectable precipitation [29]—were retained for subsequent inversion analysis, thereby enhancing the reliability of the retrieved parameters.
2.2. Assimilation System and Radar Observation Operator
The inversion process necessitates a forward radar operator to establish physical linkages between model state variables and radar observations. This study utilizes the ZJU-AERO dual-polarization forward observation operator proposed by Xie et al. [26]. Specifically developed for assimilating precipitation radar data, the ZJU-AERO operator is compatible with CMA-MESO. By employing the invariant-embedding T-matrix method, ZJU-AERO computes the optical properties of three hydrometeor categories (rain, snow, and graupel), enabling the simulation of ground-based radar reflectivity factors and dual-polarization variables. The operator’s multilayer optical database architecture balances computational efficiency with adjustable morphological and orientation parameters for hydrometeors, establishing a robust physical mapping between radar observations and model state variables.
Assimilation experiments were conducted using the CMA-MESO model, which has demonstrated superior performance in forecasting heavy rainfall, torrential rain, and localized severe convective weather Huang et al. [30]. The CMA-MESO V6.0 configuration employs a horizontal spatial resolution of 1 km, a 1-h cycling assimilation frequency, 71 vertical layers, and a model top at 10 hPa. Retrieved humidity fields were assimilated via 3D-Var within the CMA-MESO framework. The hourly precipitation fusion product from the China Meteorological Administration Multi-Source Precipitation Analysis System (CMPAS) served as the observational benchmark to quantitatively evaluate the contribution of data assimilation to precipitation forecasting improvements [31].
2.3. Time-Extended Bayesian Method
The 1D+3D-Var radar data assimilation methodology operates through two sequential stages. First, a time-extended Bayesian framework integrates dual-polarization radar measurements—specifically horizontal ZH, KDP and differential reflectivity (ZDR)—with forward operator simulations to generate pseudo-observations of relative humidity. Second, these pseudo-observations are assimilated using the three-dimensional variational (3D-Var) technique.
This study employs the formulation refined by Augros et al. [21] for dual-polarization radar data, which builds upon the original 1D+3D-Var technique developed by Caumont et al. [6] for assimilating radar observations in high-resolution NWP models. The mathematical expression of this approach is as follows:
Here, is the final relative humidity pseudo-observation profile from the retrieval; represents the relative humidity profiles involved in the weighting calculation, and denotes their corresponding weights; denotes the number of variables, set to 3 in this study; represents the effective observational layers per profile, with a maximum of 10 layers in the experiments; is the observation operator; corresponds to the model profile with index i in the sampling library; And is the observational error covariance matrix.
In data assimilation experiments for S-band radar, the standard deviation of error for ZH is typically set between 1–2 dBZ [32,33]. For dual-polarization variables, reported error standard deviations are 0.3–0.5 dB for ZDR and 0.04–0.14°/km for KDP [34], respectively. To accentuate the contribution of dual-polarization parameters, this study intentionally adopted a larger standard deviation for reflectivity , along with comparatively smaller error standard deviations for and .
The conventional 1D+3D-Var method relies on two key assumptions for accurate retrieval: first, that the NWP model accurately simulates both the intensity and vertical structure of the weather system; and second, that errors in the model background field are predominantly systematic spatial displacements. However, operational forecasts often exhibit temporal phase errors, such as the delayed or premature onset of weather systems, which cannot be captured by single-time-step sampling. To address this limitation, we developed a novel approach by extending the Bayesian framework into the temporal dimension. Specifically, the sampling library is expanded to incorporate short-term forecast fields from adjacent time steps alongside the original background field. This temporal extension enables the retrieval process to account for and correct timing biases in NWP models. Consequently, the fundamental principle of the time-extended Bayesian retrieval method can be mathematically represented by reformulating Equation (1) as Equation (4):
Here, k is the number of extended time windows. For example, taking 1200 UTC as the observation time and extending the retrieval time window to two hours before and after, the sampling library for this retrieval then covers five time steps ranging from 1000 UTC to 1400 UTC. In this case, the value of k is 5.
In the spatial domain, a square sampling window with an edge length of 192 km was centered on each observed profile to define the search area. To prevent excessive data density from introducing spurious horizontal correlations—which can adversely affect assimilation quality—both the observational data and the profiles within the sampling library were systematically subsampled at a 6-km resolution prior to assimilation. This process created a 33 × 33 grid-based library for each target profile. This subsampling strategy was implemented after our analysis revealed that without it, the optimal weights in the retrieval process would become overly concentrated on a very small number of immediately adjacent profiles. Although a denser sample might retain finer microphysical details, such weight concentration contradicts the fundamental principle of the Bayesian method, which is to construct an optimal ensemble of similar profiles to reduce dependence on exact single-point matching. The 192-km spatial scale and 6-km sampling interval were selected based on the high resolution of the CMA-MESO model and the demonstrated impact of spatial configuration on retrieval robustness, as validated in prior studies [17,21]. For a single time step, this configuration yields 1089 profiles per observed location. The total library size is therefore 1089 k profiles, where k represents the number of time steps incorporated in the temporal dimension.
3. Experiments and Results Analysis
3.1. Case and Experimental Designs
To evaluate the performance of the time-extended Bayesian method for assimilating dual-polarization radar data in the CMA-MESO model, this study examines a representative extreme precipitation event: the historic July 2023 heavy rainfall in North China, induced by the remnant circulation of Typhoon Doksuri. After making landfall in Fujian Province on 28 July 2023, Doksuri weakened but its remnant circulation persisted and moved northward. From 29 July to 1 August, its interaction with a stationary high-pressure system and moisture transport associated with Typhoon Khanun resulted in an unprecedented extreme rainfall event [35]. This precipitation event was notable for its exceptional duration, intensity, and spatial extent.
Three primary experiments were designed: a control experiment (CTRL), an experiment using the traditional Bayesian retrieval method (designated No Extend), and an experiment employing the time-extended Bayesian method (designated Extend) (Table 1). Given that forecast deviations for severe convective weather in mesoscale NWP models are typically concentrated within a 1–3 h window [23,25], the Extend configuration was further divided into three sensitivity experiments based on the duration of the temporal extension: Extend-1 h, Extend-2 h, and Extend-3 h. The relative humidity pseudo-observations retrieved from the Extend-2 h experiment were selected for the final data assimilation cycle.

Table 1.
Experimental Design.
The experimental domain covers the area from 36.5°N to 41.5°N and 113.5°E to 119.5°E. The assimilation experiment was initialized at 12:00 UTC on 29 July 2023. Hourly assimilation of relative humidity pseudo-observations was performed from 22:00 UTC on 29 July to 00:00 UTC on 30 July 2023. The impact of this assimilation was subsequently evaluated using model forecasts initialized from 00:00 UTC on 30 July 2023.
3.2. Analysis of Bayesian Retrieval Results
The study focuses on three key regions labeled in Figure 2a. Comparative analysis between the observed radar data (Figure 2a,e,i) and CTRL simulations without data assimilation (Figure 2b,f,j) reveals that simulated echo intensities in regions A and C are substantially overestimated relative to observations, whereas strong echo features observed in region B are not adequately reproduced by the CTRL experiment. Comparing the retrieval results from the No Extend and the Extend experiments, echo intensities in both the northeastern and southwestern regions are effectively corrected. However, the central region exhibited suboptimal inversion performance in the No Extend experiment (Figure 2c,g,k). In contrast, the Extend experiment achieved accurate echo inversion in this region, with results closely corresponding to actual observations (Figure 2d,h,l).
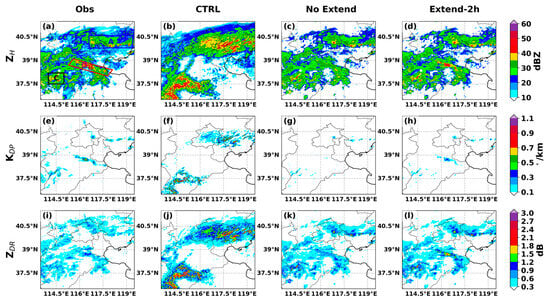
Figure 2.
Echo distributions at model layer 27 observed at 00:00 UTC on 30 July 2023. Column 1: Observation; Column 2: Control Experiment (CTRL) simulation; Columns 3–4: Retrieved results from the No Extend and the Extend experiments, respectively. Rows 1–3 correspond to horizontal reflectivity (ZH), specific differential phase (KDP), and differential reflectivity (ZDR) from top to bottom. The three rectangles in (a) delineate three key echo regions (A, B, and C). The purple square marks the key observation point. Note that the results for the Extend experiment are represented using the Extend-2 h configuration as an example. (a) Obs ZH; (b) CTRL ZH; (c) No Extend ZH; (d) Extend-2 h ZH; (e) Obs KDP; (f) CTRL KDP; (g) No Extend KDP; (h) Extend-2 h KDP; (i) Obs ZDR; (j) CTRL ZDR; (k) No Extend ZDR; (l) Extend-2 h ZDR.
Figure 3 presents the vertical profile characteristics of a convective cell in the central region (indicated by the purple square in Figure 2a) at 00:00 UTC. Observational data reveal pronounced echo signals in the mid-lower troposphere, with maximum reflectivity exceeding 40 dBZ. In contrast, the control experiment (CTRL) fails to accurately capture this feature, exhibiting maximum reflectivity below 15 dBZ. Both the Extend and the No Extend exhibit improved vertical profiles compared to CTRL (Figure 3a–c). The vertical humidity profiles from the experiments indicated that the retrieval experiments retrieved stronger radar echo signals and higher relative humidity (Figure 3d). Furthermore, while the three sensitivity experiments—“Extend-1 h,” “Extend-2 h,” and “Extend-3 h”—outperformed the “No Extend” experiment in reconstructing radar parameters, they also retrieved vertical relative humidity profiles that more closely approached saturation within the convective region.
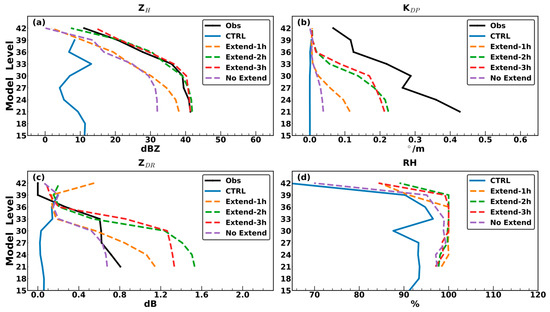
Figure 3.
Vertical profiles derived from actual radar observations, Control Experiment simulations, and two retrieval experiments within a 6-km domain centered at 116.3°E, 38.8°N (marked by the purple square in Figure 2a) at 00 UTC on 30 July 2023: (a) ZH, (b) KDP, (c) ZDR, and (d) relative humidity (RH).
In this case, since the NWP forecasts lag behind the actual observations, the majority of the sampled profiles are concentrated in the time steps following the assimilation time. For the illustrated observation point, the vertical profiles retrieved by the No Extend experiment are concentrated in the northeastern sector of the sample domain (Figure 4d). Due to the absence of convective regions with high intensity similar to the observations within its sampling range, the reflectivity intensities of the retrieved profiles are significantly weaker than the observations (Figure 3a). In contrast, the profiles retrieved by the three Extend experiments are primarily distributed in the southwestern sectors of their respective sample libraries (Figure 4). Furthermore, the reconstructed profiles show closer agreement with the observations (Figure 3a–c)—this indicates that the temporal extension enables the Bayesian method to locate convective systems consistent with the observations.
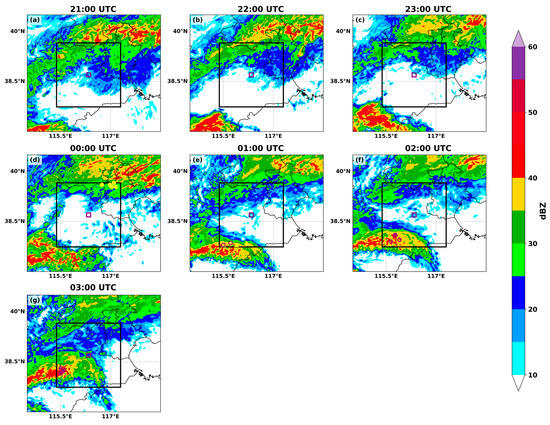
Figure 4.
Spatial schematic of the retrieval process for the observation point (116.3°E, 38.8°N). The black box denotes the spatial domain of the sample library, and the purple square marks the location of the observation point. The yellow solid circles, yellow solid triangles, purple hollow circles, and purple hollow triangles represent the five nearest samples from the No Extend, Extend-1 h, Extend-2 h, and Extend-3 h experiments. (a–g) represent the sample libraries at different time points: (a) 21:00 UTC; (b) 22:00 UTC; (c) 23:00 UTC; (d) 00:00 UTC; (e) 01:00 UTC; (f) 02:00 UTC; (g) 03:00 UTC.
During the Bayesian retrieval process, it is assumed that retrieved profiles more closely resembling actual radar observations correspond to more accurate retrieval results, which implies smaller root mean square errors (RMSE). As shown in Figure 5, while the RMSE of reconstructed radar parameters from all retrieval experiments showed a significant reduction compared to the CTRL experiment, the Extend experiment demonstrated clear advantages over the No Extend experiment. This indicates that the sampling library of the temporally extended method effectively captures vertical profiles closely matching observations, thereby substantially improving the reconstruction accuracy.
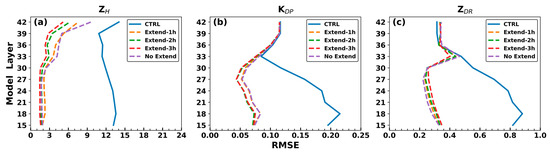
Figure 5.
RMSE between radar observations and the CTRL simulations versus retrievals from the No Extend and the Extend experiments: (a) ZH, (b) KDP, and (c) ZDR.
For the three Extend sensitivity experiments, a broader temporal extension range resulted in smaller deviations between the retrieved profiles and actual radar observations (Figure 5). From a reconstruction perspective, a broader temporal extension range implies higher reconstruction accuracy, although this approach entails increased computational demands and the potential risk of retrieving erroneous convective systems due to excessively broad time windows.
Analysis of the retrieval experiments revealed that the No Extend experiment produced weaker retrieval results. This limitation arose because the traditional retrieval method’s sample library relied solely on the spatial neighborhood of the current time step. When the background field within the spatial neighborhood of the observation point lacked convective structures resembling actual observations, the retrieval effectiveness was consequently constrained. In contrast, the Extend experiment demonstrated superior accuracy in reconstructing the vertical profiles of radar parameters, achieving closer consistency with the observed values. It successfully retrieved convective structures consistent with actual observations, yielding more pronounced humidity profiles and creating favorable conditions for the model to trigger convection in regions with strong echoes. This demonstrates the advantage of the Time-Extended Bayesian method over approaches relying solely on spatial neighborhoods in retrieval. Meanwhile, the smaller reconstruction errors also indicate that a broader temporal extension range offers certain advantages in the retrieval process.
3.3. Analysis of Assimilation Results
3.3.1. Analysis of Humidity Increments
The Extend experiment demonstrated advantages in one-dimensional Bayesian retrievals. To further investigate the contribution of radar data assimilation to model forecasting, the relative humidity pseudo-observations retrieved by the Extend experiment were incorporated into the CMA-MESO model as sounding data. A 3D-Var assimilation experiment was subsequently conducted to analyze the improvements in model forecast performance resulting from the combination of the extended Bayesian method and 3D-Var for assimilating dual-polarization radar data.
Figure 6a–f present the relative humidity background field, analysis field, their differences, and corresponding wind field characteristics at 00:00 UTC on 30 July 2023. The results demonstrate that in Region B (where prominent echoes were observed but not accurately simulated by the control experiment, CTRL), the assimilation of humidity pseudo-observations induced pronounced moistening at both the 850 hPa and 700 hPa levels. Specifically, the area with relative humidity exceeding 96% at 850 hPa expanded markedly, accompanied by a notable enlargement of the saturated zone at 700 hPa. In contrast, Region A (particularly its northern part), where CTRL overestimated echo intensity, exhibited a substantial reduction in humidity. Similarly, Region C exhibited distinct drying characteristics at 700 hPa. Overall, positive humidity increments corresponded to areas where observed echoes were stronger than simulated values, while negative increments predominated in regions with weaker observed echoes.
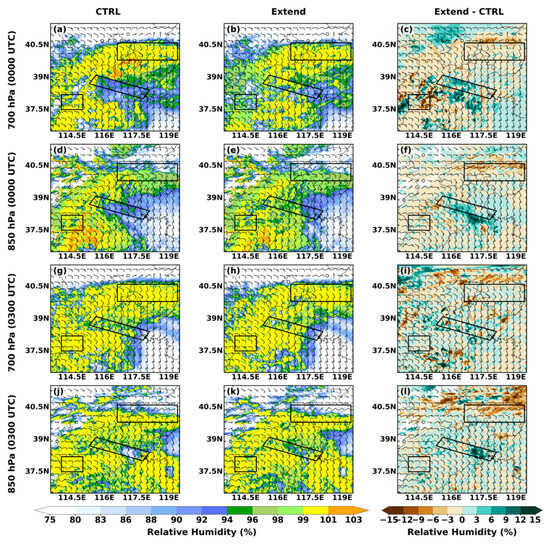
Figure 6.
RH and wind field distributions at 850 hPa and 700 hPa pressure levels for 00:00 UTC (rows 1–2) and 03:00 UTC (rows 3–4) on 30 July 2023. Results from the CTRL experiment (left column), Extend experiment (middle column), and their humidity differences (right column) are shown. The boxes (corresponding to Figure 2a) mark three key echo regions. (a) CTRL RH at 00:00 UTC 700 hpa; (b) Extend RH at 00:00 UTC 700 hpa; (c) humidity differences at 00:00 UTC 700 hpa; (d) CTRL RH at 00:00 UTC 850 hpa; (e) Extend RH at 00:00 UTC 850 hpa; (f) humidity differences at 00:00 UTC 850 hpa; (g) CTRL RH at 03:00 UTC 700 hpa; (h) Extend RH at 03:00 UTC 700 hpa; (i) humidity differences at 03:00 UTC 700 hpa; (j) CTRL RH at 03:00 UTC 850 hpa; (k) Extend RH at 03:00 UTC 850 hpa; (l) humidity differences at 03:00 UTC 850 hpa. The three black rectangles correspond to the three key regions in Figure 2.
Further analysis of the humidity fields after the 3-h forecast (Figure 6g–l) reveals that the negative humidity increments in Region A from the Extend experiment persisted, continuing to suppress humidity in this area. In Region B, strong positive humidity increments at 850 hPa remained evident, whereas the negative increments in Region C weakened after 3 h. Collectively, the assimilation of relative humidity pseudo-observations exerted sustained and effective influences on subsequent forecasts.
3.3.2. Echo Forecasts
Alterations in the initial moisture field invariably influence hydrometeor generation in subsequent forecast stages. Figure 7 presents a comparative analysis of the observed composite reflectivity against forecast results from the CTRL and Extend experiments during the first three hours of integration. Observations indicate that echoes exhibited a northeast-southwest orientation and gradually propagated northward in conjunction with the northward movement of the residual circulation of Typhoon Doksuri. Strong echoes were predominantly concentrated in Region B, where the interaction between circulation and topography led to persistent stationary characteristics. In contrast, the CTRL experiment showed forecast deviations: its predicted echoes were fragmented into two isolated regions (northeast and southwest), thereby failing to capture the central strong echo region (Region B). Additionally, CTRL overestimated echo intensities in Regions A and C relative to observations, indicating pronounced overprediction.
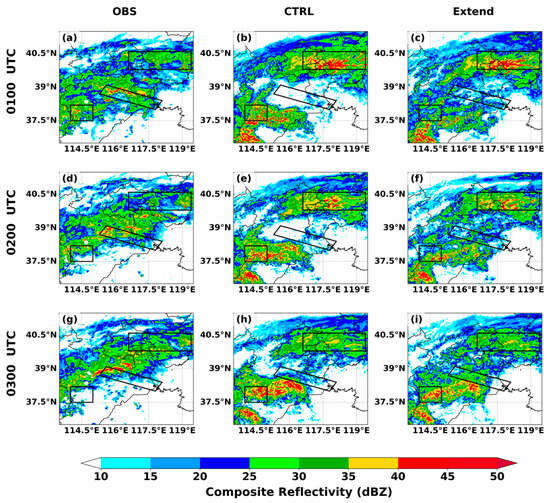
Figure 7.
Hourly ground-based radar composite reflectivity distributions from 0100 to 0300 UTC on 30 July 2023: observed data (left column), CTRL experiment (middle column), and Extend experiment (right column). (a) OBS 01:00 UTC; (b) CTRL 01:00 UTC; (c) Extend 01:00 UTC; (d) OBS 02:00 UTC; (e) CTRL 02:00 UTC; (f) Extend 02:00 UTC; (g) OBS 03:00 UTC; (h) CTRL 03:00 UTC; (i) Extend 03:00 UTC. The three black rectangles correspond to the three key regions in Figure 2.
Echo forecasts from the Extend experiment exhibited closer agreement with actual observations. In Region B, Extend successfully simulated coherent echo patterns, thereby mitigating the underprediction issue present in CTRL. These forecasts persisted for over three hours and aligned more closely with the spatiotemporal evolution of observed echoes. In Region A, overprediction was substantially reduced, with the spatial extent of intense echoes (40 dBZ) decreasing markedly. Similarly, in Region C, the assimilation process effectively suppressed overprediction, resulting in a significant reduction in strong echo areas.
Comprehensive analysis demonstrates that the assimilation of humidity pseudo-observations improved the overall structure of echo forecasts and effectively constrained the spatial extent of intense echo regions. These improvements exhibited consistent stability, progressively converging toward actual observations as the forecast lead time increased, and were stably maintained for over three hours.
3.3.3. Precipitation Forecasts
The improvement in radar echo forecasts demonstrates that the assimilation of pseudo-observations has exerted a positive impact on the generation and evolution processes of hydrometeors. Such modifications in hydrometeors will directly influence precipitation formation. Figure 8a–c present the 3-h accumulated precipitation distributions from 00:00 to 03:00 UTC on 30 July 2023. The results indicate that the Extend experiment, as a result of positive relative humidity increments generated through assimilation, produced higher precipitation amounts in Region B compared to CTRL, with spatial distributions more closely matching observations. Furthermore, negative relative humidity increments in northern Region A (Figure 6c,f) in the Extend experiment shifted the coverage of heavy rainfall (10 mm/3 h) southward relative to CTRL, effectively alleviating the overprediction issue. Additionally, the Extend experiment suppressed precipitation in Region C and surrounding areas, further enhancing the consistency between forecasts and observations.
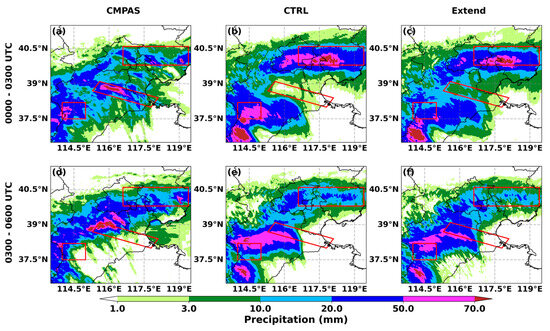
Figure 8.
3-h accumulated precipitation distributions on 30 July 2023: CMPAS observations (left column), CTRL experiment (middle column), and Extend experiment (right column) for 00:00–03:00 UTC (top row) and 03:00–06:00 UTC (bottom row). (a) CMPAS 00:00 UTC–03:00 UTC; (b) CTRL 00:00 UTC–03:00 UTC; (c) Extend 00:00 UTC–03:00 UTC; (d) CMPAS 03:00 UTC–06:00 UTC; (e) CTRL 03:00 UTC–06:00 UTC; (f) Extend 03:00 UTC–06:00 UTC. The three red rectangles correspond to the three key regions in Figure 2.
The 3-h accumulated precipitation from 03:00 to 06:00 UTC (Figure 8d–f) shows that the Extend experiment reduced the forecasted spatial coverage of torrential rainfall (50 mm/3 h) near Region B, while expanding the area of heavy rainfall (20 mm/3 h) in northern Region B, resulting in precipitation distributions that are more consistent with observations. This improvement is attributed to the transport of humidity increments resulting from assimilation into northern Region B, which intensified precipitation in this area relative to CTRL during 03:00–06:00 UTC. Additionally, negative humidity increments in Region C effectively mitigated precipitation overprediction in the later hours, thereby improving forecast accuracy. In Region A, persistent negative humidity increments at 03:00 UTC resulted in underestimated precipitation during the 03:00–06:00 UTC period.
Figure 9 and Figure 10 assess the impact of assimilation on precipitation forecasts based on the Threat Score (TS) and forecast bias (Bias). For 0–3 h precipitation (Figure 9a), the Extend experiment outperformed CTRL across all thresholds below 50 mm, with the most pronounced TS improvements observed at thresholds 10 mm. The forecast bias (Figure 10a) was slightly higher for Extend at thresholds 10 mm compared to CTRL, but all biases remained below 1.3, indicating only minor overprediction. At higher thresholds (20 mm and 50 mm), Extend exhibited significantly lower biases (Bias 20 mm = 1.377, Bias 50 mm = 1.924) compared to CTRL (Bias 20 mm = 1.620, Bias 50 mm = 3.871), with values closer to the ideal value of 1. This improvement was primarily attributable to the southward contraction of the 20 mm precipitation boundary in Region A and the substantial reduction in 50 mm precipitation coverage in Region C (Figure 8a–c). For 3–6 h forecasts, TS scores at thresholds 10 mm were comparable between experiments, but Extend demonstrated superior performance at the 20 mm threshold (CTRL: TS 20 mm = 0.281 vs. Extend: TS 20 mm = 0.336) (Figure 9b). Additionally, the 50 mm threshold bias was markedly reduced in Extend (CTRL: Bias 50 mm = 2.067 vs. Extend: Bias 50 mm = 1.438) (Figure 10b).
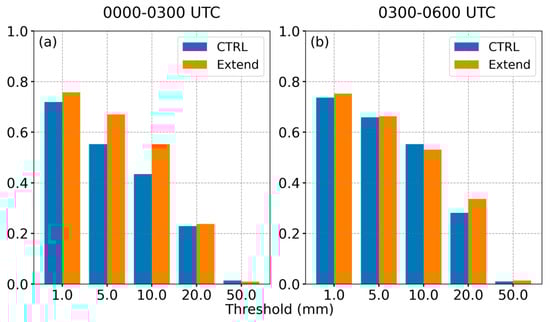
Figure 9.
TS for 3-h accumulated precipitation forecasts from the comparison experiments between CTRL and Extend: (a) 0–3 h forecast lead time; (b) 3–6 h forecast lead time. The x-axis represents the precipitation threshold (mm), and the y-axis represents the TS score.
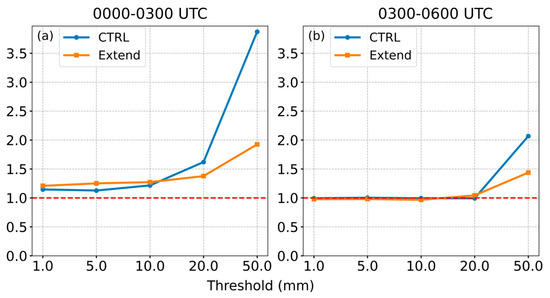
Figure 10.
Bias score for 3-h precipitation forecasts from the comparison experiments between CTRL and Extend: (a) Forecast period 00:00–03:00 UTC; (b) Forecast period 03:00–06:00 UTC. The x-axis represents the precipitation threshold (mm), and the y-axis represents the Bias score. The red dotted line indicates a bias of 1.
In this case study, the CTRL experiment exhibited substantial overprediction of heavy precipitation, with bias values significantly exceeding 1. However, the assimilation of humidity pseudo-observations effectively mitigated this overestimation, demonstrating its effectiveness in suppressing excessive forecasts of intense rainfall. Overall, the assimilation improved precipitation forecasts across all intensity levels for the 0–3 h period, while improvements in the 3–6 h forecasts were primarily observed for heavy precipitation events (20 mm).
In addition, we applied this method to a widespread precipitation event over North China on 28 July 2025. The assimilation experiment results showed slight improvements in precipitation forecasts during the first 6 h, while also demonstrating notable improvement at higher thresholds (Figure 11).
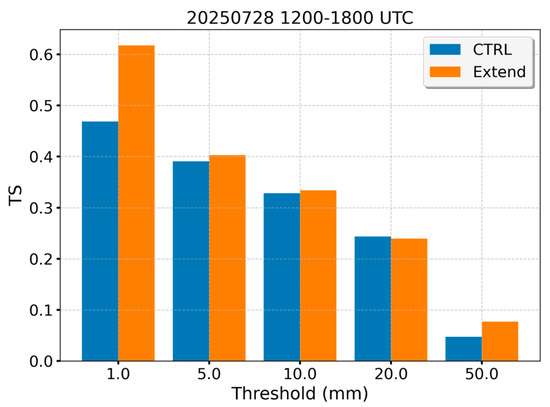
Figure 11.
TS scores for the 6-h precipitation forecasts initialized at 1200 UTC 28 July 2025 from the CTRL and Extend experiments. The x-axis represents the precipitation threshold (mm), and the y-axis represents the TS scores.
4. Discussion
This study proposed a time-extended Bayesian retrieval method to effectively overcome the limitations associated with sampling errors caused by model temporal drift in conventional radar data assimilation, which relies on spatial sampling techniques. By constructing a time-dimension sampling strategy, this method enables the effective extraction of key information from observations even when the model’s temporal phasing is inaccurate, thereby improving initial field analysis and convective precipitation forecasting.
Unlike the approach of Mulder et al. [36], which used InSAR data to directly correct temporal errors, this study addresses the issue at the retrieval stage by integrating multi-temporal observation information within a Bayesian framework, reducing dependence on a single precise timestep. The results indicate that this method can better capture the fine-scale structures of convective systems, likely because the time-extended sampling library incorporates more information from critical phases of convective development, thus optimizing moisture analysis. This improvement is directly reflected in the enhanced skill of precipitation location and intensity forecasts.
However, this study has certain limitations. While case-based analysis demonstrates the method’s potential, statistical validation through more weather events and batch experiments is required to comprehensively assess its stable impact on precipitation forecasting. Furthermore, as the precision of numerical weather prediction models continues to improve, the scale of the time-extended sampling library will keep growing. Balancing retrieval accuracy with computational cost will become a significant practical consideration for operational application.
Looking ahead, radar observables (particularly dual-polarization variables) exhibit stronger physical connections and higher signal sensitivity to hydrometeors. Therefore, a promising direction for future research is the Bayesian-based joint retrieval of hydrometeor spatiotemporal distributions directly from radar reflectivity and dual-polarization data. Assimilating such retrieval products into numerical models could more directly optimize microphysical process parameterizations, potentially leading to further improvements in precipitation forecasting, particularly for severe convective events.
5. Conclusions
To mitigate the performance degradation in radar data assimilation caused by model temporal errors in numerical weather prediction, this study developed a time-extended Bayesian retrieval method. By introducing a time-dimension observational information library, this method significantly reduces the representativeness error of traditional spatial sampling techniques when model timing is misaligned. Based on detailed case study assimilation experiments, the main conclusions of this study are as follows:
- (1)
- Compared to traditional approaches, the time-extended Bayesian method effectively captures fine-scale structural features of convective systems and intense echo regions. It enhances the similarity between observations and retrievals, thereby optimizing moisture analysis in the model’s initial fields.
- (2)
- Assimilation of relative humidity pseudo-observations retrieved from radar reflectivity and dual-polarization parameters has improved the forecasting accuracy of convective echo structures. Furthermore, Threat Score and Bias score evaluations demonstrate that the time-extended method enhances the prediction capability for both precipitation location and intensity.
In summary, the time-extended Bayesian retrieval method proposed in this study provides a new approach to addressing the challenge of temporal misalignment in radar data assimilation. It holds positive significance for improving the accuracy of convective-scale numerical weather prediction.
Author Contributions
J.Y.: Data Curation, Formal analysis, Methodology, Software, Visualization, Investigation, Writing—review and editing. C.W.: Conceptualization, Funding acquisition, Project administration, Resources, Supervision. X.S.: Software, Formal analysis, Investigation. Y.C.: Validation, Resources. All authors have read and agreed to the published version of the manuscript.
Funding
This work was funded under the auspices of the National Natural Science Foundation of China (42305156), the National Key Research and Development Program of China (2023YFC3007501), the Independent Research Project of National Key Laboratory of Severe Weather (2025QZA05) and the Young Innovation Team on Quality Control and Product Development of New Data Types (NMIC-2024-QN02), National Meteorological Information Center.
Data Availability Statement
The dual-polarization radar network dataset used in this study has been deposited at https://data.mendeley.com/datasets/t3m3fmpv6m/1 (accessed on 27 October 2025). The accumulated precipitation was validated by the multi-source observed precipitation products gridded at 1 km resolution [31]. The radar operator ZJU-AERO software package v0.5.0 used in this study, along with its latest user manual, is publicly available at https://zenodo.org/records/10300452 (accessed on 8 December 2023).
Acknowledgments
The authors are grateful to the China Meteorological Administration for data support and to the reviewers for their constructive suggestions on this article.
Conflicts of Interest
The authors declare no conflict of interest.
Abbreviations
| 1D+3DVar | one-dimensional (1-D) retrieval followed by a three-dimensional variational assimilation technique |
| 3D-Var | Three-Dimensional Variational Data Assimilation |
| CMA-MESO | China Meteorological Administration Mesoscale Model |
| CMPAS | CMA Multi-source Precipitation Analysis System |
| KDP | Specific Differential Phase |
| NWP | Numerical Weather Prediction |
| TS | Threat Score |
| ZDR | Differential Reflectivity |
| ZH | Horizontal Reflectivity |
| ZJU-AERO | Accurate and Efficient Radar Operator designed by ZheJiang University |
References
- Xue, J. Scientific Issues and Perspective of Assimilation of Meteorolo Gical Satellite Data. J. Meteor. Res. 2009, 67, 903–911. (In Chinese) [Google Scholar] [CrossRef]
- Ge, G.; Gao, J.; Xue, M. Impacts of Assimilating Measurements of Different State Variables with a Simulated Supercell Storm and Three-Dimensional Variational Method. Mon. Weather Rev. 2013, 141, 2759–2777. [Google Scholar] [CrossRef]
- Sun, L.; Zhao, S. Research on Humidity Measurement Error of Radiosonde and Its Influence on Cloud Recognition. Adv. Earth Sci. 2018, 33, 85–92. (In Chinese) [Google Scholar] [CrossRef]
- Zhang, G.; Xu, J.; Huang, Y. Remote Sensing of Total Column Perceptible Water Vapor with Two Sun Reflectance Channels of FY-1C Satellite. J. Appl. Meteor. Sci. 2003, 14, 385–394. (In Chinese) [Google Scholar]
- Davis, S.M.; Damadeo, R.; Flittner, D.; Rosenlof, K.H.; Park, M.; Randel, W.J.; Hall, E.G.; Huber, D.; Hurst, D.F.; Jordan, A.F.; et al. Validation of SAGE III/ISS Solar Water Vapor Data With Correlative Satellite and Balloon-Borne Measurements. J. Geophys. Res. Atmos. 2021, 126, e2020JD033803. [Google Scholar] [CrossRef]
- Caumont, O.; Ducrocq, V.; Wattrelot, É.; Jaubert, G.; Pradier-Vabre, S. 1D+3DVar Assimilation of Radar Reflectivity Data: A Proof of Concept. Tellus A 2010, 62, 173–187. [Google Scholar] [CrossRef]
- Zhang, C.; Xue, J.; Zhang, L.; Wan, Q. Study of the “1D+3D Var” Assimilation of the Rain Rate Retrieved from Radar Reflectivity and Its Experiments. J. Meteor. Res. 2012, 70, 1128–1136. (In Chinese) [Google Scholar] [CrossRef]
- Xiao, Q.; Kuo, Y.-H.; Sun, J.; Lee, W.-C.; Lim, E.; Guo, Y.-R.; Barker, D.M. Assimilation of Doppler Radar Observations with a Regional 3DVAR System: Impact of Doppler Velocities on Forecasts of a Heavy Rainfall Case. J. Appl. Meteorol. Climatol. 2005, 44, 768–788. [Google Scholar] [CrossRef]
- Tong, C.; Jung, Y.; Xue, M.; Liu, C. Direct Assimilation of Radar Data With Ensemble Kalman Filter and Hybrid Ensemble-Variational Method in the National Weather Service Operational Data Assimilation System GSI for the Stand-Alone Regional FV3 Model at a Convection-Allowing Resolution. Geophys. Res. Lett. 2020, 47, e2020GL090179. [Google Scholar] [CrossRef]
- Wang, H.; Sun, J.; Fan, S.; Huang, X.-Y. Indirect Assimilation of Radar Reflectivity with WRF 3D-Var and Its Impact on Prediction of Four Summertime Convective Events. J. Appl. Meteorol. Climatol. 2013, 52, 889–902. [Google Scholar] [CrossRef]
- Putnam, B.; Xue, M.; Jung, Y.; Snook, N.; Zhang, G. Ensemble Kalman Filter Assimilation of Polarimetric Radar Observations for the 20 May 2013 Oklahoma Tornadic Supercell Case. Mon. Weather Rev. 2019, 147, 2511–2533. [Google Scholar] [CrossRef]
- Albers, S.C.; McGinley, J.A.; Birkenheuer, D.L.; Smart, J.R. The Local Analysis and Prediction System (LAPS): Analyses of Clouds, Precipitation, and Temperature. Weather Forecast. 1996, 11, 273–287. [Google Scholar] [CrossRef]
- Zhang, J. Moisture and Diabatic Initialization Based on Radar and Satellite Observations. Ph.D. Thesis, University of Oklahoma, Norman, OK, USA, 1999. [Google Scholar]
- Wang, J.; Liu, L. Assimilation of Microphysical Adjustments Using Reflectivityof CINRAD/CD Doppler Radar For Meso-Scale Model. Plateau Meteorol. 2009, 28, 173–185. (In Chinese) [Google Scholar]
- Qu, Y.; Lu, W.; Cai, R.; Yang, Y.; Jiang, D.; Liu, L. Design and Experiment of GRAPES-Meso Cloud Analysis System. Meteorol. Mon. 2010, 36, 37–45. (In Chinese) [Google Scholar]
- Tong, C. Limitations and Potential of Complex Cloud Analysis and Its Improvement for Radar Reflectivity Data Assimilation Using OSSEs. Ph.D. Thesis, University of Oklahoma, Norman, OK, USA, 2015. [Google Scholar]
- Wattrelot, E.; Caumont, O.; Mahfouf, J.-F. Operational Implementation of the 1D+3D-Var Assimilation Method of Radar Reflectivity Data in the AROME Model. Mon. Weather Rev. 2014, 142, 1852–1873. [Google Scholar] [CrossRef]
- Wu, Z.; Han, W.; Xie, H.; Ye, M.; Gu, J. Assimilation of FY-3G Ku-band Radar Observations with 1D Bayesian Retrieval and 3DVAR in CMA-MESO. Q. J. R. Meteorol. Soc. 2025, e4964. [Google Scholar] [CrossRef]
- Zhang, G.; Vivekanandan, J.; Brandes, E. A Method for Estimating Rain Rate and Drop Size Distribution from Polarimetric Radar Measurements. IEEE Trans. Geosci. Remote Sens. 2001, 39, 830–841. [Google Scholar] [CrossRef]
- Zhao, K.; Huang, H.; Wang, M.; Lee, W.-C.; Chen, G.; Wen, L.; Wen, J.; Zhang, G.; Xue, M.; Yang, Z.; et al. Recent Progress in Dual-Polarization Radar Research and Applications in China. Adv. Atmos. Sci. 2019, 36, 961–974. [Google Scholar] [CrossRef]
- Augros, C.; Caumont, O.; Ducrocq, V.; Gaussiat, N. Assimilation of Radar Dual-polarization Observations in the AROME Model. Q. J. R. Meteorol. Soc. 2018, 144, 1352–1368. [Google Scholar] [CrossRef]
- Lu, H.; Xu, Q.; Yao, M.; Gao, S. Time-Expanded Sampling for Ensemble-Based Filters: Assimilation Experiments with Real Radar Observations. Adv. Atmos. Sci. 2011, 28, 743–757. [Google Scholar] [CrossRef]
- Song, X.; Han, W.; Sun, H.; Wang, H.; Xu, X. Correcting Forecast Time Biases in CMA-MESO Using Himawari-9 and Time-Shift Method. Remote Sens. 2025, 17, 617. [Google Scholar] [CrossRef]
- Zhang, H.; Gao, J.; Xu, Q.; Ran, L. Applying Time-Expended Sampling to Ensemble Assimilation of Remote-Sensing Data for Short-Term Predictions of Thunderstorms. Remote Sens. 2023, 15, 2358. [Google Scholar] [CrossRef]
- Wu, Y.; Li, Y.; Li, X.; Feng, X.; Jiang, X. Verification of Precipitation Refinement Forecast of Regional Numerical Models in the Warm Season of Hainan Island. Meteorol. Mon. 2023, 49, 235–248. (In Chinese) [Google Scholar] [CrossRef]
- Xie, H.; Bi, L.; Han, W. ZJU-AERO V0.5: An Accurate and Efficient Radar Operator Designed for CMA-GFS/MESO with the Capability to Simulate Non-Spherical Hydrometeors. Geosci. Model Dev. 2024, 17, 5657–5688. [Google Scholar] [CrossRef]
- Xie, H.; Bi, L.; Wang, Z.; Han, W. Modeling of Melting Layer in Cross-Platforms Radar Observation Operator ZJU-AERO: Multi-Stage Melting Particle Model, Scattering Computation, and Bulk Parameterization. J. Geophys. Res. Atmos. 2024, 129, e2024JD040725. [Google Scholar] [CrossRef]
- Xie, H.; Bi, L.; Han, W. Efficient Forward Radar Operator Simulations in Melting Layer Scenarios and Evaluations of Melting Layer Scheme in ZJU-AERO Based on Ground-Based and Spaceborne Radar Observations. J. Geophys. Res. Atmos. 2025, 130, e2024JD043140. [Google Scholar] [CrossRef]
- Chen, Q.; Zeng, G.; Feng, H.; Sui, P.; Zhu, W. Estimation of Total Precipitation and Precipitation Efficiency in Convective Clouds. J. Appl. Meteorol. Sci. 2005, 16, 260–263. (In Chinese) [Google Scholar]
- Huang, L.; Deng, L.; Wang, R.; Zhuang, Z.; Jiang, Y.; Xu, Z.; Zhu, L.; Zhang, J.; Wang, L.; Yu, F.; et al. Key Technologies of CMA-MESO and Application to Operational Forecast. J. Appl. Meteor. Sci. 2022, 33, 641–654. (In Chinese) [Google Scholar] [CrossRef]
- Pan, Y.; Gu, J.; Xu, B.; Shen, Y.; Han, S.; Shi, C. Advances in Multi-Source Precipitation Merging Research. Adv. Meteorol. Sci. Technol. 2018, 8, 143–152. [Google Scholar] [CrossRef]
- Li, X.; Mecikalski, J.R.; Posselt, D. An Ice-Phase Microphysics Forward Model and Preliminary Results of Polarimetric Radar Data Assimilation. Mon. Weather Rev. 2017, 145, 683–708. [Google Scholar] [CrossRef]
- Ryzhkov, A.V.; Giangrande, S.E.; Melnikov, V.M.; Schuur, T.J. Calibration Issues of Dual-Polarization Radar Measurements. J. Atmos. Ocean. Technol. 2005, 22, 1138–1155. [Google Scholar] [CrossRef]
- Augros, C.; Caumont, O.; Ducrocq, V.; Gaussiat, N.; Tabary, P. Comparisons between S-, C-, and X-Band Polarimetric Radar Observations and Convective-Scale Simulations of HyMeX First Special Observing Period. Q. J. R. Meteorol. Soc. 2016, 142, 347–362. [Google Scholar] [CrossRef]
- Chen, T.; Chen, Y.; Fang, C.; Dong, L.; Fu, J.; Li, X.; Chen, S.; Shi, Y.; Shen, Y.; Xu, X.; et al. Fine Characteristics of the July 2023 Extreme Rainfall in North China and Associated Synoptic Weather Patterns. J. Meteor. Res. 2024, 82, 600–614. (In Chinese) [Google Scholar] [CrossRef]
- Mulder, G.; Barkmeijer, J.; De Haan, S.; Van Leijen, F.; Hanssen, R. On the Use of InSAR for Estimating Timing Errors in Harmonie-Arome Water Vapor Fields. J. Geophys. Res. Atmos. 2025, 130, e2023JD040566. [Google Scholar] [CrossRef]


Disclaimer/Publisher’s Note: The statements, opinions and data contained in all publications are solely those of the individual author(s) and contributor(s) and not of MDPI and/or the editor(s). MDPI and/or the editor(s) disclaim responsibility for any injury to people or property resulting from any ideas, methods, instructions or products referred to in the content. |
© 2025 by the authors. Licensee MDPI, Basel, Switzerland. This article is an open access article distributed under the terms and conditions of the Creative Commons Attribution (CC BY) license (https://creativecommons.org/licenses/by/4.0/).