Highlights
What is the main finding?
- We have developed an end-to-end multimodal disease detection and counting model that accurately detects and counts trees affected by various types of diseases in forest imagery by integrating rotational position encoding with a gated bidirectional cross-attention mechanism.
What is the implication of the main finding?
- This technological approach provides a scientific basis for forest ecological environment monitoring and forest disease prevention and control, facilitating the timely identification of disease risks and promoting the healthy development and sustainable management of ecosystems.
Abstract
With the large-scale invasion of alien species, forest ecosystems are facing severe challenges, and the health of trees is increasingly threatened. Accurately detecting and counting trees affected by such invasive species has become a critical issue in forest conservation and resource management. Traditional detection methods usually rely only on the information of a single modality of an image, lack linguistic or semantic guidance, and often can only model a specific diseased tree situation during training, making it difficult to achieve effective differentiation and generalization of multiple diseased tree types, which limits their practicality. To address the above challenges, we propose an end-to-end multimodal diseased tree detection model. In the visual encoder of the model, we introduce rotational positional encoding to enhance the model’s ability to perceive detailed structures of trees in images. This design enables more accurate extraction of features related to diseased trees, especially when processing images with complex environments. At the same time, we further introduce a cross-attention mechanism between image and text modalities, so that the model can realize the deep fusion of visual and verbal information, thus improving the detection accuracy based on understanding and recognizing the semantics of the disease. Additionally, this method possesses strong generalization capabilities, enabling effective recognition based on textual descriptions even when samples are not available. Our model achieves optimal results on the Larch Casebearer dataset and the Pests and Diseases Tree dataset, verifying the effectiveness and generalizability of the method.
1. Introduction
Trees are an indispensable part of the earth’s ecosystem; they not only provide us with valuable resources such as oxygen, timber, and medicinal herbs, but also play a vital role in regulating the climate, purifying the air, and preventing soil erosion. By absorbing carbon dioxide, forest ecosystems reduce greenhouse gas and mitigate global warming, and are a key component in the global carbon cycle. However, with the continuous invasion of invasive alien species (IAS), the growth of trees faces unprecedented threats. These IAS not only compete with native tree species for living space, nutrients, and water, but also seriously disturb the ecological balance of forests by spreading pests and diseases. Their invasion has already caused a great disaster to forestry ecology, affecting the health and sustainable development of forests. With the growing seriousness of this problem, it has become imperative to protect and restore forest ecosystems, resist invasive alien species, and detect and count the diseases of invasive alien species.
With the advancement of remote sensing technology, image recognition, computer vision, and artificial intelligence, more and more studies are exploring automated tree disease detection methods [1] based on image analysis. These efforts aim to improve the efficiency, accuracy, and intelligence of forest pest and disease monitoring. By collecting tree images and processing them with deep learning models, automatic identification and localization of diseases can be achieved, greatly reducing the workload of manually detecting diseased trees.
Following these advancements, numerous detection and recognition models have been developed. For instance, the You Only Look Once (YOLO) series [2] enables the identification of diseased trees by extracting visual features and performing multi-scale predictions on input images, while the Segment Anything Model (SAM) [3] provides powerful segmentation capabilities that precisely delineate tree regions for accurate disease localization and analysis. In 2020, Alaa et al. [4] proposed a palm tree disease detection method combining a convolutional neural network (CNN) [5] and a support vector machine (SVM) [6], effectively integrating the deep learning model’s feature extraction ability with the robust classification strength of traditional machine learning to distinguish visually similar disease symptoms. More recently, Lin et al. [7] introduced a Transformer-based model with graph-structured modulation, in which attention and feature centrality graphs jointly refine self-attention and feature representations, mitigating attention homogenization and improving detection accuracy. Despite these advances, current models still face significant challenges that limit their performance in complex real-world scenarios.
- In many complex and dense scenes, a large number of trees are clustered together with different sizes of individuals, and this high density and scale difference significantly increase the detection difficulty, which seriously affects the recognition and localization ability of the model.
- The generalization ability of many models is weak, as they usually only perform well on trained data and are less effective in recognizing unseen samples, making it difficult to adapt to complex and changing practical application scenarios.
- Traditional models rely only on single-modal information, which leads to their lack of sufficient semantic expressiveness to effectively capture richer and deeper semantic features, and the recognition accuracy of the models is greatly reduced when facing similar categories.
To cope with these challenges, this paper proposes a multimodal tree disease detection model, as shown in Figure 1, which is able to distinguish different classes of trees in an image compared to the traditional model that only realizes one modality as input. Thanks to the introduction of a textual modality [8], our model shows unprecedented multi-scene adaptability, and is able to efficiently train and differentiate statistics on tree images taken by unmanned aerial vehicles (UAVs) with multiple complex conditions at the same time. This breakthrough design covers different physiological states, including healthy, diseased, and insect-infested trees. We introduce rotational attention encoding [9] in the visual coder to enable the model to capture local and global features in the image more efficiently. In order to better fuse the image information and text information, we introduce gated bidirectional cross-attention [10] and a contrastive loss function, which deeply interact with the image information and text information to enhance the alignment and fusion of multimodal features. Finally, the fused multimodal features are inputted into the downstream task module of diseased tree detection and statistics to obtain accurate diseased tree conditions, which provides an efficient and accurate technical solution for forestry ecological protection.
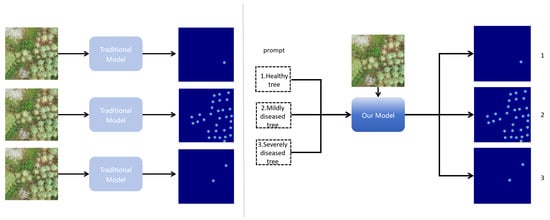
Figure 1.
Traditional methods vs. text-guided statistical methods: traditional methods are trained separately for each scenario and accept only one input modality, while our model is trained jointly across multiple scenarios and leverages text guidance together with image input to distinguish different classes.
In summary, our contributions are as follows:
- We propose an end-to-end deep learning model for disease detection that incorporates rotational position encoding in the image encoder, which allows the model to better understand the positional information of the trees in the image, and improves the model’s ability to capture the trees in complex scenes, thus increasing the accuracy.
- Our model demonstrates exceptional generalization capabilities, enabling it to extract universal features based on existing knowledge and adapt to diverse datasets, even when distributions shift. When confronted with unseen data scenarios, it maintains robust recognition performance, overcoming the limitations of traditional models that require extensive re-training in new environments.
- Our model fuses visual and textual information in a gated bidirectional cross-attention module, and the ability to incorporate textual information enables the model to be dynamically adapted to a wider range of real-world scenarios based on user-input descriptions or specific needs.
The rest of the paper is organized as follows: In Section 2, we describe the development of traditional disease detection with the emerging large model. In Section 3, we present the general architecture of our model, with each subsection describing each part of the model. In Section 4, we describe the experimental setup and experimental results, and show visualization images. In the Section 5 and Section 6, we present our discussion and conclusions.
2. Related Work
2.1. Breakthrough in Disease Detection
Since 2016, plant disease detection has advanced rapidly with the development of increasingly efficient and intelligent models. Anand et al. [11] first employed a K-means clustering algorithm to segment leaf images and extract texture features of diseased areas, followed by classification using neural networks, achieving accurate identification of diseased eggplant leaves and laying the groundwork for subsequent research. By 2019, Pantazi et al. [12] enhanced recognition accuracy by adopting the local binary pattern (LBP) for image feature extraction and integrating it with support vector machines (SVMs), enabling robust classification of multiple diseased leaf types without reliance on large-scale labeled datasets—an important step toward small-sample disease detection. In 2022, Abu-Zanona et al. [13] proposed a lightweight CNN architecture with only four convolutional and one fully connected layer, significantly reducing computational costs and training time while maintaining high classification performance, thereby providing an efficient solution for palm tree disease identification under resource-constrained environments. With the emergence of more powerful detection frameworks, Lyu et al. [14], in 2024, successfully applied YOLOv8 for efficient plant disease detection, leveraging its end-to-end capability, real-time inference speed, and superior localization precision to transform disease detection from simple classification into precise, target-level identification. By 2025, Amin et al. [15] introduced a Transformer-based model incorporating a multi-head external attention mechanism and synthetic data generation for Pine Wilt Disease (PWD) detection, effectively addressing data scarcity and computational complexity while maintaining high accuracy. In the same year, Li et al. [16] developed a large-scale real-world dataset for apricot tree disease and pest detection and proposed a lightweight detection framework, APNet, which integrates an Adaptive Thresholding Algorithm and multi-scale feature fusion to enhance small-target recognition under complex backgrounds. Around the same time, another lightweight single-stage model, PWDViTNet [17], was designed for early PWD detection in pine forests, combining the local feature extraction of CNNs with the global modeling capability of Vision Transformers, further enhanced by multi-scale fusion and attention mechanisms. Collectively, these advancements have enabled more accurate, automated, and efficient plant disease monitoring, laying a solid foundation for the continued evolution of intelligent agricultural technologies.
Although there are many models that can realize the classification and detection of diseased trees, their performance tends to degrade in complex scenes with dense targets and overlap between trees. To cope with such challenges, we introduce a rotational attention mechanism in the image encoder, which enhances the model’s ability to perceive details and thus localize each tree crown more accurately. In addition, we incorporate the density map point location information to effectively improve the model’s detection accuracy in complex environments.
2.2. Pre-Trained Large Models
Large models are pre-trained on large-scale datasets and mainly include large language models [18] and multimodal large models [19]. With powerful capabilities, such models have demonstrated excellent performance in many downstream tasks, which not only enhance the task-solving efficiency, but also promote the development and innovation of related fields.
Since 2017, large models have undergone rapid development, evolving from unimodal to multimodal domains. In 2017, Vaswani et al. [20] proposed the Transformer architecture in Attention Is All You Need, a brand-new model based entirely on the attention mechanism, which abandons the traditional convolutional neural network architecture and revolutionized the field of natural language processing. In 2018, the introduction of the Bidirectional Encoder Representations from Transformers (BERT) model [21] marked the successful application of the bidirectional Transformer architecture. By combining pre-training and fine-tuning strategies, BERT significantly improved the performance of the model and ushered in the era of pre-trained models. In the same year, ChatGPT series [22] appeared, and GPT-1 proposed the concept of generative pre-training for the first time, providing a new way of thinking about natural language generation tasks. Subsequently, GPT-2 and GPT-3 further expanded the scale and capability of the model, laying a solid foundation for large-scale language modeling. Progress in cross-modal learning has been equally impressive. For example, the Contrastive Language–Image Pre-training (CLIP) model [23] achieves efficient alignment of text and image information by pre-training on a large-scale dataset containing 400 million image–text pairs, which significantly improves performance on cross-modal tasks. In 2024, Zang et al. [24] proposed the ContextDET framework, pioneering the application of multimodal large language models to ‘contextual object detection’. Through an integrated generation–detection design, the model simultaneously localizes and recognizes visual objects within language completion, description, and question-answering tasks, transcending the limitations of traditional closed-class detection. In 2024, Zhu et al. [25] proposed the VA-Count framework, employing visual association and contrastive learning to address zero-shot object counting. Its sample augmentation and noise suppression modules significantly enhanced counting accuracy and generalization capabilities under unlabeled conditions. In 2025, Binyamin et al. [26] introduced the CountGen method, enabling diffusion models to accurately generate specified quantities of objects. By identifying object-specific features within self-attention layers and incorporating the layout correction network ReLayout, it achieves text-to-image generation with controllable quantity. These innovations further advance the multimodal field and greatly enhance the application potential of the models, opening up new possibilities for research and practice in computer vision [27], natural language processing [28], and cross-modal tasks [29].
Our model makes full use of the multimodal alignment capability of the large model to accurately detect and count the corresponding diseased trees through the text-guided model, providing an efficient and intelligent solution for forestry disease monitoring.
2.3. Zero-Shot Learning
In target detection and recognition tasks, traditional deep learning methods usually rely on sufficient pre-training for all target categories. Zero-shot learning is an innovative approach that can achieve accurate recognition and classification of unseen categories by exploiting semantic information between categories or other a priori knowledge without pre-training for a specific target category, thus demonstrating stronger generalization ability and flexibility to effectively deal with scenarios with new categories and sparse data.
The concept of zero-shot learning [30] was first introduced by Lampert et al. to address the problem of classification without training samples. They proposed two methods—direct attribute prediction and indirect attribute prediction—to classify unseen categories by attribute information. This research direction quickly attracted a lot of attention. In 2013, Norouzi et al. [30] proposed a method to establish the linkage between old and new categories using word vectors by generating an embedded representation of an image by using the probabilities of the old categories as the weighted weights of the word vectors, and then calculating the probabilities of the new categories by utilizing the cosine similarity between the word vectors of the new categories and the embedded representation of the image. Subsequently, Zhang et al. [31] found that projecting image features from visual space to semantic space leads to dimensionality catastrophe. For this reason, they proposed, in 2017, an inverse projection method to map semantic information to visual space, thus optimizing the distance between the image embedding representation and the label vector. In the same year, Kodirov et al. [32] projected visual features into semantic space based on encoder and decoder structures, and effectively mitigated the projection bias problem in zero-shot learning by reconstructing the original visual features. In 2019, Hou et al. [33] proposed the cross-domain adversarial generative network, which combines the traditional generative adversarial network with the variational autocoder, and is capable of generating samples of unseen categories to improve the zero-shot classification performance. Subsequently, with the advent of pre-trained models such as CLIP in 2021, image information was highly aligned with textual information, which significantly improved the performance of zero-shot classification tasks. After this, more and more large-scale pre-trained models continued to appear, such as Distillation with No Labels (DINO) [34], BLIP, etc., and the research focus shifted to how to efficiently utilize large-scale pre-trained models, cross-modal alignment techniques, and generative models to further improve the performance and generalization ability of zero-shot learning.
Building on the strengths of large-scale pre-trained models, our approach emphasizes robust generalization capabilities. This powerful generalization capability enables the model to effectively handle new scenarios.
3. Methods
As shown in Figure 2, the image and the prompt indicating the condition type of the trees are first used as inputs. A trainable image encoder and text encoder are then employed to generate corresponding image and text embeddings. The image embeddings are enhanced through a CNN and a self-attention mechanism, and then dynamically fused with the text embeddings via a bidirectional cross-attention gating mechanism. The decoder subsequently outputs the density features of the images, which are used to identify and count the number of diseased trees.
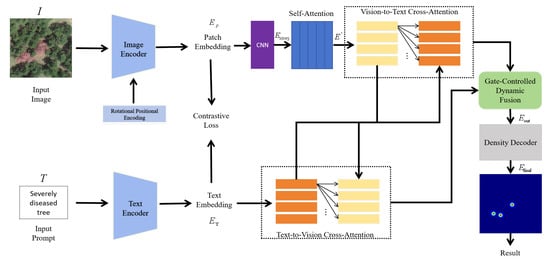
Figure 2.
General architecture diagram, showing the complete processing pipeline from feature extraction and multimodal fusion to density map generation and tree counting.
3.1. CLIP Base
CLIP [23] is a cross-modal learning model proposed by OpenAI, which is able to process images and text simultaneously and learn the association between them. The core of CLIP is to reinforce the similarity between the corresponding images and texts by mapping the images and texts to the shared embedding space by means of comparative learning. Specifically, by inputting an image and a text description , CLIP maps to the shared embedding space using an image encoder and a text encoder, respectively.
is image embedding and is text embedding. Then, CLIP computes the similarity between the text embedding and the image embedding by calculating the cosine similarity between the two.
Here, · is the dot product of the image embedding and the text embedding, and is the L2 paradigm (the modulus of the vectors).
3.2. Rotational Positional Encoding
In the image encoder, we incorporate rotational positional encoding [9], which utilizes an approach that deals with vector embedding in the two-dimensional case. It differs from traditional positional embedding in that it transforms the feature vectors by rotating them through a rotation matrix, encoding positional coding information directly into the feature space. This approach not only avoids the introduction of additional learnable parameters, but also efficiently captures the sequence or the spatial distribution in positional relationships in both visual and verbal tasks. After that, a scale factor is further introduced to enable the position coding to perceive information at different scales, thus enhancing the robustness and expressiveness of the model in dealing with multi-scale targets, such as the scale changes caused by differences in height and tree species in UAV images.
The core idea behind rotational positional encoding is to leverage frequency and angular information to construct rotation matrices using cosine and sine functions, which are then applied to feature vectors as rotation transformations. This rotation operation inherently preserves the vector magnitude while integrating positional cues into the feature representation. In this work, we become the first to apply rotational positional encoding to tree disease detection and counting. In the context of aerial images of dense tree canopies, we introduce a scale factor based on the actual scene, enabling the model to better capture the spatial distribution and relative arrangement of overlapping tree crowns, and thus improving its ability to accurately distinguish and count trees under complex canopy densities and varying spatial orientations.
where is a constant to control the rotation angle, is the element of row i and column j of the projection matrix for Query/Key, is a given vector, and m denotes the position. In the image processing task of diseased trees, rotational attention coding significantly improves the model’s ability to recognize complex disease tree features through its unique orientation adaptation and dynamic weight assignment mechanism, and is the scale factor. is the scale function and is the position index in the image block.
3.3. Contrastive Loss Function
We invoke a text-patch contrast loss function [35] designed to maximize textual cues and cue-related image-patch mutual information. The method maps the feature map to the same channel dimension as the text embedding through a linear projection to ensure that both can be learned in the same feature space for comparison:
In Equation (6), we use to refer to the resulting patch embedding of the input image. In order to determine the location of the object, the ground truth density map y is maximally pooled, and thus the patch-level mask is obtained. For more accurate statistics, we introduce a contrastive loss function :
In Equation (7), P and N represent the positive and negative sample sets of patch embeddings, respectively, according to the corresponding masks, represents the cosine similarity, and is a temperature parameter. The core objective of this contrast loss is to bring the positive sample embeddings closer to the corresponding text embeddings in the feature space, while reducing the similarity between the negative samples and the text embeddings. This strategy is consistent with the optimization goal of CLIP pre-training, and experimental validation shows that jointly optimizing patch embeddings and text embeddings can significantly improve the overall performance of the model.
3.4. Gated Bidirectional Cross-Attention Module
This section proposes a structural module for deep fusion of image and text modalities, centered on a bidirectional cross-attention mechanism and a gated dynamic fusion mechanism. The designed bidirectional cross-attention simultaneously models semantic dependencies between modalities in both visual-to-text and text-to-visual directions. This overcomes the limitations of traditional unidirectional attention, which inadequately models modal information, enabling fine-grained, bidirectional semantic interaction. Building upon this foundation, the gated dynamic fusion mechanism is introduced. This mechanism employs a lightweight gated network to adaptively adjust the fusion weights of cross-attention information from both directions, enabling dynamic routing and weighted integration of intermodal information. The module first extracts the local structural features of the image by convolutional operations and up-samples or down-samples them according to a set target resolution to unify the feature scale. Subsequently, the module applies a self-attention mechanism [36] on the image features to enhance their contextual representation. Next, the text-to-image cross-attention mechanism and image-to-text cross-attention mechanism are executed sequentially to obtain corresponding multimodal information [37]. Subsequently, a weighted fusion is achieved through a gated dynamic fusion mechanism.
In UAV-acquired dense forest canopy imagery, the gated bidirectional cross-attention modules are designed to leverage textual cues, enabling more precise guidance of visual feature extraction and improved alignment between tree attributes and visual regions. The gating component selectively controls the flow of information, allowing the most relevant textual prompts describing tree attributes to guide visual feature extraction, while the bidirectional design reinforces this guidance by letting visual features and textual cues interact continuously. This dual mechanism helps the model focus on target areas, reduces misidentification, and ultimately improves overall prediction accuracy in dense and diverse forest environments.
where is the activation function, is the sampling function, and Dropth is a random discard function that we customized. is the self-attention layer, is the cross-attention layer, LN is the normalization layer, is the convolutional layers, scale is the scaling factor, is a function that performs gated dynamic fusion on the integration of two types of information, and is the multilayer perceptron.
3.5. Counting Decoder Module
The decoder consists of multiple convolutional layers, each of which progressively reduces the number of channels and improves the spatial resolution through convolutional, normalization, and activation operations, and gradually restores the size to the target size by bilinearly interpolating and up-sampling the feature maps at each layer.
where is the convolutional layers, is the scaling factor, is the sampling function, is the size of the target image, is the Sigmoid function, is the mean square error loss function, is the predicted result of the ith image, is the true result of the ith image, SUM is the sum of all elements in the image, and n is the number of quantities.
4. Experimentation and Analysis
4.1. Experimental Setup
Datasets: (1) We utilize the open-source dataset Larch Casebearer (Swedish Forest Agency (2021): Forest Damages – Larch Casebearer 1.0. National Forest Data Lab, Dataset) [38], which is a project initiated by the Swedish Forest Agency with support from Microsoft that monitors forest areas affected by the white moth. The project annotates the locations of healthy, mildly diseased, and highly diseased trees across five distinct regions. Healthy trees exhibit green foliage with no visible discoloration. Mildly diseased trees show slight yellowing of leaves or minor thinning. Severely diseased trees display severe discoloration or even dieback. In total, the dataset contains more than 1500 images of over 40,000 trees. Several sample images from dataset 1 are displayed within the black dashed box in Figure 3.
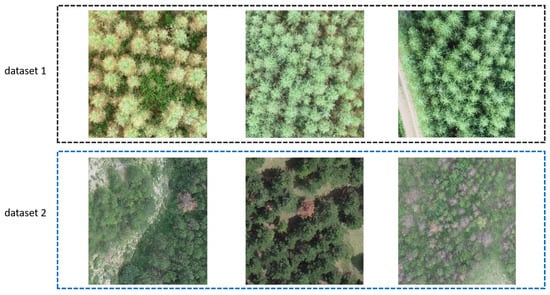
Figure 3.
Sample diagram of the dataset, showing several randomly selected UAV-captured images.
(2) The open-source dataset PDT dataset (PDT: Uav Target Detection Dataset for Pests and Diseases Tree; Mingle Zhou, Rui Xing, Delong Han, Zhiyong Qi, Gang Li*; ECCV 2024) [39], which is from the Shandong Computer Science Center, is also utilized to collect aerial images of the pine forest area. It contains more than 4000 images with two types of trees in each image, healthy trees and trees damaged by the red fat-sized borer. Several sample images from dataset 2 are displayed within the blue dashed box in Figure 3.
Both datasets consist of aerial forest images captured vertically by unmanned aerial vehicles (UAVs). For both datasets, images with incomplete or missing annotations were removed to ensure data validity. In the Larch Casebearer dataset, this resulted in approximately 800 images with roughly 44,000 annotated instances used for experiments. Similarly, in the PDT dataset, around 3900 images with approximately 110,000 annotations were retained after filtering. To ensure consistency, all images were resized to a uniform resolution of 384 × 384 pixels. The datasets were divided into training, validation, and test sets with a ratio of approximately 5:1:1. All textual inputs in our framework are expressed as natural language prompts.
4.2. Comparison Methods
In order to validate the effectiveness of our model, we chose to focus on deep learning methods to compare with our method, which are as follows:
ALEXTNET [40]: The first model to apply deep convolutional neural networks to large-scale image classification and achieve a breakthrough.
RESNET50 [5]: A 50-layer convolutional neural network that introduces residual connectivity to solve the difficulty of training deep networks.
UNET [41]: Supports density map generation through fine segmentation capability, suitable for small-target or sparse counting tasks, with jump–junction fusion of multilayer features.
EFFICIENTNET [42]: An image classification model that combines high accuracy and efficiency through a composite scaling strategy.
ICC [43]: Rich features are extracted by multi-scale convolution, and accuracy and computational efficiency are balanced in counting.
MCNN [44]: A crowd counting model based on multi-column convolutional branching, adapting to different density and scale variations.
COUNTX [45]: A single-level model that does not distinguish between categories and can count the number of instances of any category based on image and text descriptions.
CLIP-COUNT [35]: A text-guided zero-shot object counting model capable of automatically completing object counting based on natural language prompts, demonstrating considerable application potential.
MSTNET [46]: A Transformer-based network for remote sensing segmentation that captures multi-scale features to improve accuracy.
GRAMFORMER [7]: A graph-modulated Transformer for crowd counting that diversifies attention maps via an anti-similarity graph and modulates node features using centrality encoding to address homogenization in dense scenes.
VL-COUNTER [47]: A text-guided zero-shot object counting model that leverages CLIP’s visual–linguistic alignment capability to generate high-quality density maps for unseen open-vocabulary objects.
DAVE [48]: A zero-shot object counting model that identifies and leverages high-quality exemplars to accurately count objects.
VA-COUNT [25]: An object counting model that combines detection and verification to reliably estimate counts.
4.3. Evaluation Metrics
In this paper, we use the mean absolute error (MAE) and the root mean square error (RMSE) to evaluate the performance of the model.
where is the predicted number of the ith sample, is the true number of the ith sample, and n is the total number of samples.
We also use the structural similarity index measure (SSIM) and the peak signal-to-noise ratio (PSNR) to evaluate the similarity between the predicted and ground truth density maps. Equation (21) presents the formula for SSIM, and Equation (22) presents the formula for PSNR.
where , , , , and represent the mean, variance, and covariance of x and y, and are constant values to prevent the division of zeros, and signifies the density map’s maximum value.
4.4. Measurement Setup
During the experiments, we use the ViT-B/16 encoder from the CLIP model as the image encoder, decoder-depth is set to 4, and decoder-head is set to 8. For MSE loss training, we perform 200 rounds, with 28 rounds of contrastive loss training before that, using a batch size of 32, with a learning rate set to 0.0001, and the adamw optimizer is used; the training is performed on an nvdia rtx- 4090 GPU. The image size of our dataset is 384 × 384.
4.5. Comparison Experiment
To demonstrate the reliability of our model, we introduce multiple comparative experiments across two datasets. In the Larch Casebearer dataset, we test three types: healthy, mildly diseased, and severely diseased. In the PDT dataset, we conduct tests on the severely diseased condition.
In the Larch Casebearer dataset, single-mode models struggle to effectively train across multiple tree typess simultaneously. To address this limitation, we adopt a strategy of independently training and testing each tree type. In contrast, our approach enables unified training of all types within a single framework by leveraging distinct prompts. For fair comparison with other models, we also employ type-wise testing during the evaluation phase.
As shown in Table 1, our model consistently achieves lower MAE and RMSE, and higher SSIM and PSNR across all test scenarios, outperforming the other comparative models. In addition, Table 2 shows that while the MAE of the other models generally exceeds 3, our model achieves a much lower MAE of 2.85, which is about 0.4 lower than the lowest MAE among the other models. Moreover, our model attains an SSIM of 92.1, whereas none of the other models exceed 90, and achieves a PSNR of 28.4, which is 0.7 higher than the best among the others. It can be observed that our model achieves the lowest MAE and RMSE, as well as the highest SSIM and PSNR across both datasets, suggesting that it not only delivers more accurate count estimations but also generates density maps with improved structural consistency. These comparative results clearly demonstrate the superior performance of our model in category-specific scenarios, thereby further validating its effectiveness.

Table 1.
Comparison experiments using Larch Casebearer dataset. We tested our model against other models on the Larch Casebearer dataset, with the optimal results highlighted in bold.
Table 2.
Comparison experiments using the PDT dataset. We tested our model against other models on the PDT dataset, with the optimal results highlighted in bold.
By accurately counting diseased trees within the target areas, our model not only proves its high precision and robustness in practical applications, but also provides a scientific foundation for disease monitoring and forest management. Specifically, the model enables efficient identification and counting of diseased trees, substantially reducing the cost and time of manual surveys while improving data accuracy and reliability. This achievement offers strong technical support for forest protection and ecological restoration, highlighting the great potential of deep learning technologies in natural resource management.
4.6. Ablation Experiment
To better validate each module in the model, we perform ablation experiments on it.
Our design idea is to use the image encoder and text encoder to output the corresponding information. We design the visual cue optimization in the image encoder, and we set the contrast loss function between the two corresponding outputs of the two modalities of information; after that, we fuse the two kinds of information, then generate the corresponding density maps by the decoder, and then compare them with the real density maps.
Firstly, we verify the reliability of our multimodal model by incorporating and removing textual information. As shown in Table 3 and Table 4, experiments are conducted on two datasets. The results clearly demonstrate that the MAE and RMSE values are consistently lower, while the SSIM and PSNR values are higher when textual input is included. These findings fully validate the effectiveness of our proposed multimodal model.
Table 3.
Ablation experiment comparing model performance with and without textual input on the PDT dataset. The best results are highlighted in bold.
Table 4.
Ablation experiment comparing model performance with and without textual input on the PDT dataset.
We define three variables: rotational position encoding (Rotate), contrast loss (Contrast), and fusion module (Fusion). ✓ indicates that the variable is enabled, while ✗ indicates that it is disabled. In the fusion module, Cross represents the fusion of image information and text information through a gated bidirectional cross-attention mechanism, and Add represents the operation of adding image information and text information. By designing these three variables, the effects of different variables on the model can be effectively observed. By choosing to enable and disable each module, the effectiveness of each module can be demonstrated. Val MAE and Val RMSE represent the mean absolute error and root mean square error of the validation set, and Test MAE and Val RMSE represent the mean absolute error and root mean square error of the test set, respectively. SSIM and PSNR denote the structural similarity index measure and peak signal-to-noise ratio, which are reported as the average values across the validation and test sets. In Table 5, it is easy to find that the model achieves the best results when using the rotational position encoding, contrast loss, and gated bidirectional cross-attention module, with a mean absolute error of 3.50 and a root mean square error of 4.75 for the validation set, and a mean absolute error of 3.62 and a root mean square error of 5.02 for the test set. In addition, the model attains an SSIM of 91.2 and a PSNR of 28.2, further demonstrating its superior reconstruction quality.
Table 5.
Ablation experiments on the Larch Casebearer dataset, presenting the impact of different model components on the performance of the Larch Casebearer dataset. The best results are highlighted in bold.
In a continuation of the above design ideas, in Table 6, we find that when using the rotational position encoding, contrast loss, and gated bidirectional cross-attention module, the model achieves the best results, with a mean absolute error of 2.85 and a root mean square error of 4.17 in the validation set, and a mean absolute error of 2.91 and a root mean square error of 4.18 in the test set. Moreover, the model attains an SSIM of 92.1 and a PSNR of 28.4, further confirming the superior reconstruction quality and the reasonableness of introducing each module.
Table 6.
Ablation experiments on the PDT dataset, presenting the impact of different model components on the performance of the PDT dataset. The best results are highlighted in bold.
4.7. Case Study
In order to better demonstrate the test results of our model on the two datasets, we have designed the “Case Study” Section. In this section, we will show some specific visualization results to visualize the prediction performance of our model in complex scenarios. We hope to convey the reliability of the model’s predictions more clearly through these specific cases.
Figure 4 shows the effect of the model’s visual recognition of diseased trees. The first row is the original image, the second row is the real point map, and the third row is the model-predicted point map. The colors of the points indicate different tree health states: orange for healthy trees, cyan for mildly diseased trees, and purple for severely diseased trees. The number following the color above each image is the number of trees of that type represented by that color. All images are taken from the Larch Casebearer dataset.
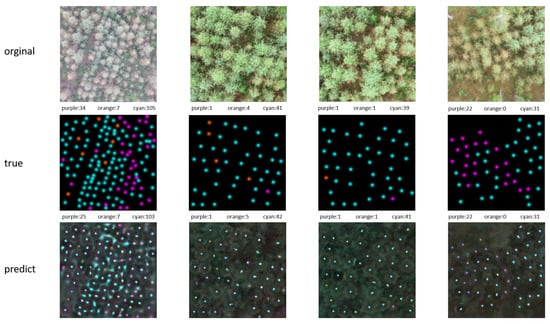
Figure 4.
Visualization of test results: The first row is the original image, the second row is the real point map, and the third row is the model-predicted point map. The colors of the points indicate different tree health states: orange for healthy trees, cyan for mildly diseased trees, and purple for severely diseased trees. The number following the color above each image is the number of trees of that type represented by that color.
From the four examples in Figure 4, we can observe that even in complex scenarios such as dense trees and overlapping tree canopies, our model is still able to accurately localize the trees from the images according to the cue words. This is in comparison to traditional tree detection models, where usually, each model can only be trained for a single scene or a specific class of trees, and cannot handle tree detection tasks under different conditions. Our approach undoubtedly improves the practicality and simplicity by allowing the model to handle multiple tree types simultaneously during a single training session through a multi-task learning strategy. This not only improves the adaptability and robustness of the model, but also significantly enhances its practicality and simplicity.
4.8. Generalization Ability Test
To rigorously assess the generalization capability of our model, we conducted experiments on previously unseen test datasets from different geographic regions. This evaluation relies on quantitative performance metrics, allowing us to systematically examine the model’s robustness and adaptability across diverse spatial contexts. The results provide a comprehensive validation of the model’s effectiveness and reliability in scenarios not encountered during training.
The Kampe area is one of the four regions included in the Larch Casebearer dataset. It contains the largest number of annotations, and also has the highest average number of annotations per image. There are approximately 170 images from the Kampe area, with around 15,000 annotations. As shown in Table 7, although our model exhibits some decline in MAE, RMSE, SSIM, and PSNR, these metrics still remain within a reasonable range. This shows that the model not only is able to learn the features of a specific dataset, but also has some cross-domain adaptability, which validates the effectiveness and robustness of our approach when dealing with unknown data.
Table 7.
Generalization experiment in Kampe area. We use images from the four locations in the Larch Casebearer dataset, excluding the Kampe area, as the training set, and evaluate the model on the Kampe area data to assess its generalization ability to unseen locations.
The reason for our model’s strong generalization capability in classification, detection, and counting, which can effectively detect and roughly count trees in different scenarios even if it is not specifically trained on a specific dataset, is the model’s strong generalization performance and the migration learning mechanism, which extracts generalized features from existing knowledge and applies them to unknown data distributions.
5. Discussion
This study proposes an efficient approach to distinguish trees with varying health conditions for forestry statistical analysis, providing robust technical support for ecological monitoring and tree disease prevention. The proposed method demonstrates significant potential in assessing tree health status based on remote sensing data, offering strong support for the efficient management of forest resources. However, certain uncertainties remain, as the model’s performance may be affected by factors such as illumination conditions, shooting angles, atmospheric variations, and background interference.
In the experimental stage, two large-scale datasets were employed to provide a solid and representative foundation for model training. In the future, with the incorporation of more diverse and heterogeneous datasets, the diversity and coverage of training data are expected to be further enhanced. We plan to continuously collect and integrate additional relevant data resources to improve the model’s robustness and generalization ability under varying data distributions. The support of larger-scale data will not only optimize the model training process but also enhance its stability and accuracy in complex and diverse scenarios, thereby improving its adaptability and practical value. Furthermore, we intend to extend this method to broader geographic regions and integrate it with UAV-based canopy feature analysis to enhance its spatial scalability in diverse forest environments.
Our model is about 1.1 GB in size and processes each image in approximately 46 ms. It performs efficiently, but the speed is still not sufficient for real-time UAV aerial analysis. In future work, we will develop lighter and more optimized structures to improve real-time performance and deployment feasibility.
6. Conclusions
In this paper, we further improved the CLIP model by introducing rotational position encoding in the image encoder to improve the model’s ability to perceive diseased trees at different locations in the image, realized multimodal feature alignment and fusion through the gated bidirectional cross-attention module and the contrast loss function, utilized the decoder to generate the corresponding density map information for quantity counting, and ultimately constructed a deep learning model for diseased tree counting.
This deep learning model is applied to the task of recognizing and counting diseased trees in forests. It effectively extracts key regions from disease-affected images and integrates textual descriptions—such as disease types and characteristic terms—for accurate identification and classification. By enhancing the automation and precision of disease tree detection and tree counting, the proposed model holds promise for supporting forest resource protection and pest management. It can assist relevant authorities in early warning and informed decision-making, thereby providing technological support for ecological security and sustainable development.
Author Contributions
Conceptualization, R.Z.; Methodology, R.Z., Z.C., G.H. and X.Z.; Validation, R.Z., Z.C., G.H. and X.Z.; Formal analysis, R.Z.; Investigation, R.Z., Z.C., G.H. and X.Z.; Data curation, R.Z., Z.C., G.H. and X.Z.; Writing—original draft preparation, R.Z.; Writing—review and editing, R.Z., Z.C., G.H., X.Z., L.M. and W.L. All authors have read and agreed to the published version of the manuscript.
Funding
The research project is supported by the National Key Research and Development Program of China (2023YFC2605200).
Data Availability Statement
The raw data supporting the conclusions of this article will be made available by the authors on request.
Conflicts of Interest
The authors declare no conflicts of interest.
Abbreviations
The following abbreviations are used in this manuscript:
| IAS | Invasive Alien Species |
| UAVs | Unmanned Aerial Vehicles |
| SAM | Segment Anything Model |
| YOLO | You Only Look Once |
| CLIP | Contrastive Language–Image Pre-Training |
| BLIP | Bootstrapping Language-Image Pre-Training |
| SVM | Support Vector Machine |
| CNN | Convolutional Neural Network |
| DINO | Distillation with No Labels |
| BERT | Bidirectional Encoder Representations from Transformers |
| MAE | Mean Absolute Error |
| RMSE | Root Mean Square Error |
| RESNET50 | Residual Network 50-Layer |
| MCNN | Multi-Column Convolutional Neural Network |
| VL-COUNTER | Visual–Linguistic Counter |
| ICC | Inception-Based Crowd Counting |
| PDT | Unmanned Aerial Vehicle Target Detection Dataset for Pests and Diseases Tree |
References
- Fang, S.; Cui, R.; Wang, Y.; Zhao, Y.; Yu, K.; Jiang, A. Application of multiple spectral systems for the tree disease detection: A review. Appl. Spectrosc. Rev. 2023, 58, 83–109. [Google Scholar] [CrossRef]
- Redmon, J.; Divvala, S.; Girshick, R.; Farhadi, A. You only look once: Unified, real-time object detection. In Proceedings of the IEEE Conference on Computer Vision and Pattern Recognition, Las Vegas, NV, USA, 27–30 June 2016; pp. 779–788. [Google Scholar]
- Kirillov, A.; Mintun, E.; Ravi, N.; Mao, H.; Rolland, C.; Gustafson, L.; Xiao, T.; Whitehead, S.; Berg, A.C.; Lo, W.-Y.; et al. Segment anything. In Proceedings of the IEEE/CVF International Conference on Computer Vision, Paris, France, 2–3 October 2023; pp. 4015–4026. [Google Scholar]
- Alaa, H.; Waleed, K.; Samir, M.; Tarek, M.; Sobeah, H.; Salam, M.A. An intelligent approach for detecting palm trees diseases using image processing and machine learning. Int. J. Adv. Comput. Sci. Appl. 2020, 11, 434–441. [Google Scholar] [CrossRef]
- He, K.; Zhang, X.; Ren, S.; Sun, J. Deep residual learning for image recognition. In Proceedings of the IEEE Conference on Computer Vision and Pattern Recognition, Las Vegas, NV, USA, 27–30 June 2016; pp. 770–778. [Google Scholar]
- Cortes, C.; Vapnik, V. Support-vector networks. Mach. Learn. 1995, 20, 273–297. [Google Scholar] [CrossRef]
- Lin, H.; Ma, Z.; Hong, X.; Shangguan, Q.; Meng, D. Gramformer: Learning crowd counting via graph-modulated transformer. In Proceedings of the AAAI Conference on Artificial Intelligence, Vancouver, BC, Canada, 20–27 February 2024; Volume 38, pp. 3395–3403. [Google Scholar]
- Bader, M. Multimodal Fusion of Visual and Textual Data for Robust Retail Product Recognition and Classification. 2025. Available online: https://papers.ssrn.com/sol3/papers.cfm?abstract_id=5523762 (accessed on 28 September 2025).
- Su, J.; Ahmed, M.; Lu, Y.; Pan, S.; Bo, W.; Liu, Y. Roformer: Enhanced transformer with rotary position embedding. Neurocomputing 2024, 568, 127063. [Google Scholar] [CrossRef]
- Li, X.; Gwan, C.; Zhao, S.; Gao, X.; Zhu, Y. Multimodal temperature prediction for lithium-ion battery thermal runaway using multi-scale gated fusion and bidirectional cross-attention mechanisms. J. Energy Storage 2025, 116, 116098. [Google Scholar] [CrossRef]
- Anand, R.; Veni, S.; Aravinth, J. An application of image processing techniques for detection of diseases on brinjal leaves using k-means clustering method. In Proceedings of the 2016 International Conference on Recent Trends in Information Technology (ICRTIT), Chennai, India, 8–9 April 2016; pp. 1–6. [Google Scholar]
- Pantazi, X.E.; Moshou, D.; Tamouridou, A.A. Automated leaf disease detection in different crop species through image features analysis and One Class Classifiers. Comput. Electron. Agric. 2019, 156, 96–104. [Google Scholar] [CrossRef]
- Abu-zanona, M.; Elaiwat, S.; Younis, S.; Innab, N.; Kamruzzaman, M.M. Classification of palm trees diseases using convolution neural network. Int. J. Adv. Comput. Sci. Appl. 2022, 13, 943–949. [Google Scholar] [CrossRef]
- Lyu, Z.; Yu, T.; Pan, F.; Zhang, Y.; Luo, J.; Zhang, D.; Chen, Y.; Zhang, B.; Li, G. A survey of model compression strategies for object detection. Multimed. Tools Appl. 2024, 83, 48165–48236. [Google Scholar] [CrossRef]
- Amin, S.U.; Jung, Y.; Fayaz, M.; Kim, B.; Seo, S. Enhancing pine wilt disease detection with synthetic data and external attention-based transformers. Eng. Appl. Artif. Intell. 2025, 159, 111655. [Google Scholar] [CrossRef]
- Li, M.; Tao, Z.; Yan, W.; Lin, S.; Feng, K.; Zhang, Z.; Jing, Y. ApNet: Lightweight network for apricot tree disease and pest detection in real-world complex backgrounds. Plant Methods 2025, 21, 4. [Google Scholar] [CrossRef]
- Chen, Z.; Lin, H.; Bai, D.; Qian, J.; Zhou, H.; Gao, Y. PWDViTNet: A lightweight early pine wilt disease detection model based on the fusion of ViT and CNN. Comput. Electron. Agric. 2025, 230, 109910. [Google Scholar] [CrossRef]
- Naveed, H.; Khan, A.U.; Qiu, S.; Saqib, M.; Anwar, S.; Usman, M.; Akhtar, N.; Barnes, N.; Mian, A. A comprehensive overview of large language models. arXiv 2023, arXiv:2307.06435. [Google Scholar] [CrossRef]
- Wu, J.; Gan, W.; Chen, Z.; Wan, S.; Yu, P.S. Multimodal large language models: A survey. In Proceedings of the 2023 IEEE International Conference on Big Data (BigData), Sorrento, Italy, 15–18 December 2023; pp. 2247–2256. [Google Scholar]
- Vaswani, A.; Shazeer, N.; Parmar, N.; Uszkoreit, J.; Jones, L.; Gomez, A.N.; Kaiser, Ł.; Polosukhin, I. Attention is all you need. Adv. Neural Inf. Process. Syst. 2017, 30, 5998–6008. [Google Scholar]
- Devlin, J.; Chang, M.-W.; Lee, K.; Toutanova, K. BERT: Pre-training of deep bidirectional transformers for language understanding. In Proceedings of the 2019 Conference of the North American Chapter of the Association for Computational Linguistics: Human Language Technologies, Minneapolis, MN, USA, 2–7 June 2019; pp. 4171–4186. [Google Scholar]
- Ray, P.P. ChatGPT: A comprehensive review on background, applications, key challenges, bias, ethics, limitations and future scope. Internet Things Cyber-Phys. Syst. 2023, 3, 121–154. [Google Scholar] [CrossRef]
- Radford, A.; Kim, J.W.; Hallacy, C.; Ramesh, A.; Goh, G.; Agarwal, S.; Sastry, G.; Askell, A.; Mishkin, P.; Clark, J.; et al. Learning transferable visual models from natural language supervision. In Proceedings of the International Conference on Machine Learning, Virtual, 18–24 July 2021; pp. 8748–8763. [Google Scholar]
- Zang, Y.; Li, W.; Han, J.; Zhou, K.; Loy, C.C. Contextual object detection with multimodal large language models. Int. J. Comput. Vis. 2025, 133, 825–843. [Google Scholar] [CrossRef]
- Zhu, H.; Yuan, J.; Yang, Z.; Guo, Y.; Wang, Z.; Zhong, X.; He, S. Zero-shot object counting with good exemplars. In Proceedings of the European Conference on Computer Vision, Milan, Italy, 29 September–4 October 2024; Springer Nature: Cham, Switzerland, 2024; pp. 368–385. [Google Scholar]
- Binyamin, L.; Tewel, Y.; Segev, H.; Hirsch, E.; Rassin, R.; Chechik, G. Make it count: Text-to-image generation with an accurate number of objects. In Proceedings of the Computer Vision and Pattern Recognition Conference, Nashville, TN, USA, 11–15 June 2025; pp. 13242–13251. [Google Scholar]
- Voulodimos, A.; Doulamis, N.; Doulamis, A.; Protopapadakis, E. Deep learning for computer vision: A brief review. Comput. Intell. Neurosci. 2018, 2018, 7068349. [Google Scholar] [CrossRef]
- Chowdhary, K.R. Natural language processing. In Fundamentals of Artificial Intelligence; Springer: Berlin/Heidelberg, Germany, 2020; pp. 603–649. [Google Scholar]
- Shin, A.; Ishii, M.; Narihira, T. Perspectives and prospects on transformer architecture for cross-modal tasks with language and vision. Int. J. Comput. Vis. 2022, 130, 435–454. [Google Scholar] [CrossRef]
- Norouzi, M.; Mikolov, T.; Bengio, S.; Singer, Y.; Shlens, J.; Frome, A.; Corrado, G.S.; Dean, J. Zero-shot learning by convex combination of semantic embeddings. arXiv 2013, arXiv:1312.5650. [Google Scholar]
- Zhang, L.; Xiang, T.; Gong, S. Learning a deep embedding model for zero-shot learning. In Proceedings of the IEEE Conference on Computer Vision and Pattern Recognition, Honolulu, HI, USA, 21–26 July 2017; pp. 2021–2030. [Google Scholar]
- Kodirov, E.; Xiang, T.; Gong, S. Semantic autoencoder for zero-shot learning. In Proceedings of the IEEE Conference on Computer Vision and Pattern Recognition, Honolulu, HI, USA, 21–26 July 2017; pp. 3174–3183. [Google Scholar]
- Hou, B.; Liu, Q.; Wang, H.; Wang, Y. From W-Net to CDGAN: Bitemporal change detection via deep learning techniques. IEEE Trans. Geosci. Remote Sens. 2019, 58, 1790–1802. [Google Scholar] [CrossRef]
- Caron, M.; Touvron, H.; Misra, I.; Jégou, H.; Mairal, J.; Bojanowski, P.; Joulin, A. Emerging properties in self-supervised vision transformers. In Proceedings of the IEEE/CVF International Conference on Computer Vision, Montreal, QC, Canada, 11–17 October 2021; pp. 9650–9660. [Google Scholar]
- Jiang, R.; Liu, L.; Chen, C. Clip-count: Towards text-guided zero-shot object counting. In Proceedings of the 31st ACM International Conference on Multimedia, Ottawa, ON, Canada, 29 October–3 November 2023; pp. 4535–4545. [Google Scholar]
- Shaw, P.; Uszkoreit, J.; Vaswani, A. Self-attention with relative position representations. arXiv 2018, arXiv:1803.02155. [Google Scholar] [CrossRef]
- Li, H.; Wu, X.-J. CrossFuse: A novel cross attention mechanism based infrared and visible image fusion approach. Inf. Fusion 2024, 103, 102147. [Google Scholar] [CrossRef]
- Swedish Forest Agency. Forest Damages—Larch Casebearer 1.0. National Forest Data Lab, Dataset. 2021. Available online: https://lila.science/datasets/forest-damages-larch-casebearer/?utm_source=chatgpt.com (accessed on 15 July 2025).
- Zhou, M.; Xing, R.; Han, D.; Qi, Z.; Li, G. PDT: UAV Target Detection Dataset for Pests and Diseases Tree. In Proceedings of the European Conference on Computer Vision (ECCV 2024), Milan, Italy, 29 September–3 October 2024; pp. 56–72. [Google Scholar]
- Krizhevsky, A.; Sutskever, I.; Hinton, G.E. ImageNet classification with deep convolutional neural networks. Commun. ACM 2017, 60, 84–90. [Google Scholar] [CrossRef]
- Ronneberger, O.; Fischer, P.; Brox, T. U-net: Convolutional networks for biomedical image segmentation. In Medical Image Computing and Computer-Assisted Intervention–MICCAI 2015; Springer: Berlin/Heidelberg, Germany, 2015; pp. 234–241. [Google Scholar]
- Tan, M.; Le, Q. EfficientNet: Rethinking model scaling for convolutional neural networks. In Proceedings of the International Conference on Machine Learning, PMLR, Long Beach, CA, USA, 9–15 June 2019; pp. 6105–6114. [Google Scholar]
- Szegedy, C.; Vanhoucke, V.; Ioffe, S.; Shlens, J.; Wojna, Z. Rethinking the inception architecture for computer vision. In Proceedings of the IEEE Conference on Computer Vision and Pattern Recognition, Las Vegas, NV, USA, 27–30 June 2016; pp. 2818–2826. [Google Scholar]
- Zhang, Y.; Zhou, D.; Chen, S.; Gao, S.; Ma, Y. Single-image crowd counting via multi-column convolutional neural network. In Proceedings of the IEEE Conference on Computer Vision and Pattern Recognition, Las Vegas, NV, USA, 27–30 June 2016; pp. 589–597. [Google Scholar]
- Amini-Naieni, N.; Amini-Naieni, K.; Han, T.; Zisserman, A. Open-world text-specified object counting. arXiv 2023, arXiv:2306.01851. [Google Scholar]
- Shao, K.; Wang, M.; Wang, G. Transformer-based multiscale remote sensing semantic segmentation network. CAAI Trans. Intell. Syst. 2024, 19, 920–929. [Google Scholar] [CrossRef]
- Kang, S.; Moon, W.; Kim, E.; Heo, J.-P. Vlcounter: Text-aware visual representation for zero-shot object counting. Proc. AAAI Conf. Artif. Intell. 2024, 38, 2714–2722. [Google Scholar] [CrossRef]
- Pelhan, J.; Zavrtanik, V.; Kristan, M. Dave—A detect-and-verify paradigm for low-shot counting. In Proceedings of the IEEE/CVF Conference on Computer Vision and Pattern Recognition, Seattle, WA, USA, 16–22 June 2024; pp. 23293–23302. [Google Scholar]
Disclaimer/Publisher’s Note: The statements, opinions and data contained in all publications are solely those of the individual author(s) and contributor(s) and not of MDPI and/or the editor(s). MDPI and/or the editor(s) disclaim responsibility for any injury to people or property resulting from any ideas, methods, instructions or products referred to in the content. |
© 2025 by the authors. Licensee MDPI, Basel, Switzerland. This article is an open access article distributed under the terms and conditions of the Creative Commons Attribution (CC BY) license (https://creativecommons.org/licenses/by/4.0/).