Highlights
What are the main findings?
- MODIS MCD43A3 daily albedo is in good agreement with in situ measurements at THAAO, in northwestern Greenland.
- The agreement is excellent in snow-free days and worst for mixed and snow-covered conditions.
What are the implications of the main findings
- MODIS albedo product has limitations when fast changes in albedo are occurring.
- The use of MODIS albedo values with best-quality flags is recommended.
Abstract
The surface albedo, , is one of the key climate parameters since it regulates the shortwave radiation absorbed by the Earth’s surface. An accurate determination of the albedo is crucial in the polar regions due to its variations associated with climate change and its role in the strong feedback mechanisms. In this work, satellite and in situ measurements of broadband surface albedo at the Thule High Arctic Atmospheric Observatory (THAAO) on the northwestern coast of Greenland (76.5°N, 68.8°W) are compared. Measurements of surface albedo were started at THAAO in 2016. They show a large variability mainly in the transition seasons, suggesting that THAAO is a very interesting site for verifying the satellite capabilities in challenging conditions. The comparison of daily ground-based and MODIS-derived albedo covers the period July 2016–October 2024. The analysis has been conducted for all-sky and cloud-free conditions. The mean bias and mean squared difference between the two datasets are −0.02 and 0.09, respectively, for all sky conditions and −0.03 and 0.06 for cloud-free conditions. Very good agreement is found in summer in snow-free conditions, when the mean albedo is 0.17 in both datasets under cloud-free conditions. On the contrary, the capability to determine the surface albedo from space is largely reduced in the transition seasons, when significant differences between ground- and satellite-based albedo estimates are found. Differences for all-sky conditions may be as large as 0.3 in spring and autumn. These maximum differences are significantly reduced for cloud-free conditions, although a negative bias of MODIS data with respect to measurements at THAAO is generally found in spring. The combined analysis of the albedo, cloudiness, air temperature, and precipitation characteristics during two periods in 2023 and 2024 shows that, although satellite observations provide a reasonable picture of the long-term albedo evolution, they are not capable of following fast changes in albedo values induced by precipitation of snow/rain or temperature variations. Moreover, as expected, cloudiness plays a large role in affecting the satellite capabilities. The use of MODIS albedo data with the best value of the quality assurance flag (equal to 0) is recommended for studies aimed at determining the daily evolution of the surface radiation and energy budget.
1. Introduction
The surface albedo (), or the ratio of the energy radiant flux density reflected from the Earth’s surface to the incident flux density, is a key forcing parameter controlling the planetary radiative energy budget and the partitioning of radiative energy between the atmosphere and the surface. The surface albedo changes significantly with the surface properties. For example, the ocean broadband albedo, with the sun at the zenith, is generally less than 0.06 [1], while the snow albedo may reach very high values, up to 0.9 for fresh snow [2,3,4]. In the polar regions, the high albedo of snow and ice helps to maintain low surface temperatures by reflecting most of the incident solar energy. As the temperature of the atmosphere rises and the ice and the snow melt, the amount of absorbed energy increases, leading to more melting and further warming. This process, particularly evident for sea ice and open ocean surfaces, is known as ice–albedo feedback, which is positive and is one of the main processes responsible for Arctic Amplification, the phenomenon leading the Arctic to warm faster than the lower latitudes [5,6]. Rapid albedo changes can lead to considerable changes in the energy absorbed by the surface. For example, the formation of melting pods on the ice-covered surface of the high latitude ocean can induce a decrease in the value of albedo up to 50% [7]. Pirazzini et al. [8] observed a daily cycle in the coastal sea ice albedo in the Baltic Sea linked to the solar radiation action: the daytime melting and the nighttime refreezing impact the snow/ice metamorphism and change the surface reflectivity.
In recent decades, the snow-covered area has progressively reduced, inducing a reduction in the surface albedo during summer and increasing the rate of snow melting in other seasons [9]. Temperature is not the only factor affecting albedo reduction in the Arctic. Impurities such as dust [10] and the aging of snow can significantly reduce the albedo from ∼0.9 (fresh/pure snow) to ∼0.4 [11]. Long-term changes in surface albedo have also been detected, especially over the Greenland Ice Sheet (GrIS), where the albedo has been observed to decrease at a rate of per decade after 2000 [12]. Decadal albedo measurements from satellites allowed the identification of a significant and extended decrease in albedo of the GrIS caused by the 2019 extreme early-season melt event [13].
Continuous measurements of the albedo are therefore fundamental to a better understanding of Arctic warming [14]. This is possible by using in situ measurements from permanent observatories, which are scarce in the Arctic, or during intensive field campaigns such as the Surface Heat Budget of the Arctic Ocean (SHEBA; [15]) project or the Multidisciplinary drifting Observatory for the Study of Arctic Climate (MOSAiC) expedition [16]. When in situ measurements are not available, remote sensing instruments such as those satellites are crucial.
Satellite imagery is commonly used to examine the spatial and temporal variability in albedo of the Earth surface. In recent years, many albedo products were derived using geostationary and polar orbiting satellite observations [17,18]. One of the instruments providing these observations is the MODerate resolution Imaging Spectrometer (MODIS) on board the Terra (launched in 1999, with data available from 2000) and Aqua (launched in 2002) satellites, whose measurements cover more than 20 years. All satellite-derived albedo products have inherent limitations due to their different spatial, spectral, and temporal resolutions and their active lifetime. Due to the generally coarse spatial resolution (>100 m), satellite measurements cannot resolve small-scale spatial patterns of albedo [19]. Satellite-based instruments with better spatial resolution do not provide a long historical series of data [20]. Moreover, clouds are a significant limitation to albedo observations from satellite platforms, in particular in the polar regions [21] as the detection of clouds over bright surfaces is very challenging due to their very similar reflectance properties across many spectral bands [22]. Thus, the comparison between ground-based and satellite determinations of the surface albedo is crucial to assessing the reliability of satellite-derived products. Inter-comparisons of satellite-derived albedo and in situ observations have been extensively conducted at the global level, as well as at polar sites. However, studies at polar sites mainly focus only on snow-covered surfaces (e.g., [23,24]) or on snow-free sites (e.g., [25]). Comparisons between ground-based and MODIS data were conducted in Greenland (e.g., [14]), in particular over the GrIS (e.g., [26,27,28]), neglecting transition periods when the satellite retrieval can be problematic.
Other studies and comparisons in Greenland were conducted over its western coast and over the GrIS, using a product based on the Advanced Very High Resolution Radiometer (AVHRR) instrument on board NOAA-17, -18, and MetOp satellites [29].
In this work, the 500 m MODIS 16-day BRDF/Albedo daily data product (MCD43A3) v061 is compared with in situ broadband albedo measurements obtained at the Thule High Arctic Atmospheric Observatory (THAAO, 76.5°N, 68.8°W, 220 m a.s.l., https://www.thuleatmos-it.it/, accessed on 15 September 2025) situated on the northwest coast of Greenland, where a strong seasonal change in snow cover is present and a significant albedo spatial variability is found mainly in the transition season. This is a particularly interesting site for assessing the reliability of satellite albedo determinations for varying surface conditions.
This paper is structured as follows. Section 2 describes MODIS satellite-based albedo retrievals, ground-based measurements, and the methods used to select the observations and detect cloud-free conditions for in situ albedo determinations, , and MODIS albedo estimates, . Results are presented in Section 3. In Section 4, two case studies characterized by snowfall and rainfall events are discussed in detail to better assess the accuracy of MODIS albedo estimates in those conditions characterized by rapid albedo changes. The conclusions are discussed in Section 5.
2. Data
2.1. In Situ Measurements at THAAO
The Thule High Arctic Atmospheric Observatory is located on South Mountain, at 220 m a.s.l., South of the Pituffik Space Base (formerly known as Thule Air Base), along the northwestern coast of Greenland (Figure 1). The site is about 3 km south-east of the coastline, 2 km south of the terminus of the Wolstenholme Fjord, and about 20 km west of the GrIS. Its position is occasionally influenced by strong katabatic winds from the GrIS and sea breeze during summer when sea ice is absent.
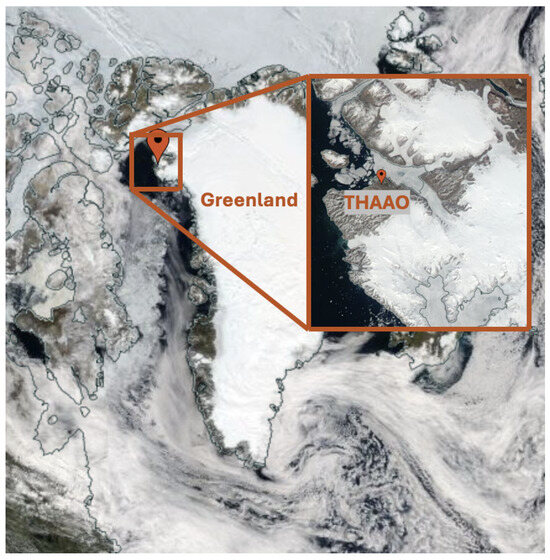
Figure 1.
Position of THAAO (Credits: NASA Aqua/MODIS World-view 30 June 2020. https://worldview.earthdata.nasa.gov/, accessed on 15 September 2025).
Continuous observations of many atmospheric parameters are performed at THAAO, which contributes to the Network for the Detection of Atmospheric Composition Change (NDACC). The existing measurements include meteorological variables, temperature, and humidity profiles, radiation, total column and middle atmospheric vertically resolved water vapour, cloud liquid water path, shortwave and longwave irradiance, photosynthetically active radiation, cloud properties, columnar aerosol optical properties and in situ PM concentration and chemical composition, trace gas atmospheric concentration, and characteristics of precipitating droplets and particles [30,31,32,33,34,35,36].
In this study we use the measurements of downward and upward shortwave irradiance, from which the surface broadband albedo is calculated, and the zenith infrared brightness temperature in the 9.6–11.5 m spectral interval for the selection of the cloud-free intervals. The analysis of two case studies also takes advantage of the ancillary information on the precipitation amount and phase from a rain gauge and a disdrometer, and of the surface air temperature.
The radiometer for the downward shortwave irradiance (DSI) was installed at South Mountain in 2009 and moved to the roof of THAAO (about 5 m a.g.l) in September 2012. The pyranometer’s model was an Eppley Precision Spectral Pyranometer (PSP) from February 2009 to March 2018 and then a Kipp&Zonen CMP21 afterwards. The pyranometers are ventilated to prevent ice and snow formation and periodically calibrated, with shortwave irradiance measurements traceable to the World Radiation Reference. The pyranometers’ measurements are corrected for the thermal offset using the net longwave irradiance by a co-located pyrgeometer; see [35] for details. A downward-looking PSP was installed in July 2016 to continuously measure the upwelling shortwave irradiance (USI). The PSP was substituted by a Kipp&Zonen CMP21 in June 2024. The USI pyranometer is located about 2.3 m a.g.l. on a mast about 50 m south-west of the main building and is not ventilated. No thermal correction is required for the pyranometers facing the surface. The irradiance measurements are acquired every 30 s; 5 min averages are used in this study. is calculated as the ratio of the upwelling and the downwelling measured irradiance. Detailed information about these measurements, the calibration procedure, and the applied corrections are provided by [35].
The estimated uncertainty on depends on the downwelling irradiance and on the value of the surface albedo. The maximum absolute uncertainty on is about 0.06 for values of the downwelling irradiance of 50 W/m2 and is about 0.02 for a downwelling irradiance of 700 W/m2. Possible influence of obstacles in specific observation geometries and inhomogeneities of the upwelling radiance have been neglected. The standard deviation of the diurnal albedo averages was also calculated but is generally smaller than the estimated absolute uncertainty. However, the standard deviation is useful for detecting cases with rapid changes in albedo associated with snowfall or fast melting.
In this work, we compare the measurements conducted from July 2016 to October 2024, during which there is a good record of instrument characterization and calibration traceability. In these years, a few interruptions occurred due to technical problems: from end of August to end of September 2018, from May to mid-July 2019, mid-August 2020, and from mid-May to mid-June 2020, for a total of 135 missing days. The number of diurnal albedo measurements at THAAO is 2055.
The infrared zenith sky brightness temperature (IBT) in the 9.6–11.5 m spectral range is measured with a Heitronics KT19.85 II Infrared Radiation Pyrometer. The instrument is calibrated to −100 °C and has a response linearity that deteriorates between −100 °C and −150 °C with a field of view of approximately 2.6° [36]. In addition to the analysis of long-term albedo observations, data from a Thies Clima Laser Precipitation Monitor (LPM), a MPS System Total Rain weighing Sensor (TRwS), a sky camera, and a webcam are used to address specific case studies in which rapid changes in in situ surface albedo are related with the satellite-derived values. The TRwS is a precipitation gauge for measuring liquid, solid, and mixed precipitation based on weighting principles, even in harsh snow and wind conditions, with an accuracy of 0.01 mm and 1 min sampling resolution [37]. The LPM is an optical sensor designed to estimate the intensity and type of precipitation from the attenuation of the laser beam, related to the particle size and fall speed. By using empirical relationships between the two quantities, the precipitation classification (liquid, solid, mixed) is derived. The limitations and constraints of the instrument have been widely discussed (e.g., [37,38]). While the discrimination of snowfall and rainfall by the disdrometer is reliable, the classification of mixed-phase precipitation may be more challenging [38]. Images from the webcam facing the mast where downward-looking radiometers are placed were used to qualitatively assess the surface snow cover. A selection of images is shown in the Supplementary Materials.
The annual evolution of the diurnal (i.e., the average of the 5 min measurements corresponding the solar zenith angles below 85°) surface broadband albedo at THAAO in the years from 2016 to 2024 is shown in Figure 2.
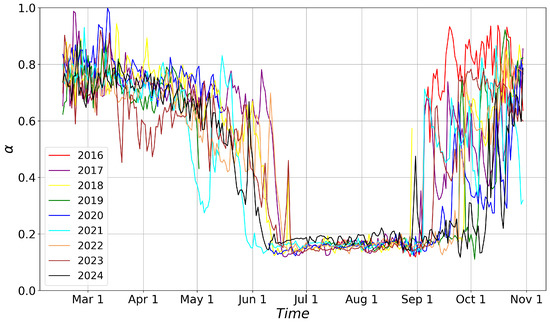
Figure 2.
Evolution of diurnal value of surface broadband albedo from 2016 to 2024 at THAAO.
The values are generally high (above 0.6) from February to April. The transition period May–June is characterized by rapidly changing conditions due to snowfall and snow removed by liquid precipitation or winds. During summer the surface is free of snow, and the average bare soil albedo is about 0.16. Starting from September, precipitation and snow transport by winds determine a large variability in surface albedo. Meloni et al. [35] has discussed the variability in relation to some cases of strong temperature anomalies or delayed surface-snow-free seasons.
A sensitivity test was carried out to assess the differences obtained considering a maximum SZA limit of 75° instead of 85°, and by weighting the albedo values for the downward solar irradiance (keeping the SZA limit to 85°), thus decreasing the relevance of the albedo values retrieved under low irradiance conditions, potentially affected by larger uncertainties.
Compared to the albedo daily data obtained with the SZA ≤ 85°, the number of data used in the averages is reduced by 24% when the albedo is calculated for the SZA ≤ 75°, and nearly one month of data at the beginning and one month at the end of the sunlit period are missing. These months are characterized by high albedo values; thus, the results of the comparison with MODIS in the whole considered period may be biased. In addition, the full evolution of the diurnal albedo may be missed when the SZA interval is reduced. When considering the irradiance-weighted albedo, the mean bias and root mean squared difference with respect to the simple average (both using measurements with the SZA ≤ 85°) are 0.003 and 0.012, respectively. Most of the values of the seasonal differences are lower than the minimum uncertainty on . Thus, the diurnal albedo calculated by averaging the 5 min data with the SZA ≤ 85° provides a robust estimate of the daily albedo and was used in the comparison with .
2.2. Satellite Albedo Measurements
In this work the MODIS/Terra + Aqua BRDF/Albedo (MCD43A3) and quality (MCD43A2) Level 3 gridded data products were used. They were produced daily using 16 days of Terra and Aqua MODIS observations at 500 m resolution [39]. The RossThickLiSparse-Reciprocal Bidirectional Distribution Reflectance Model (BRDF) model was retrieved using all cloud-free surface reflectances collected over a 16-day period [40]. If a sufficient number of observations was available to sample the surface anisotropy, the BRDF model was retrieved and, from that, the albedo. If the anisotropic reflectance model could not be confidently retrieved with a full inversion due to either more than 7 days of cloudy sky observations out of 16 days, or if the solar zenith angle (SZA) was higher than 75°, a backup algorithm was employed [41], which uses a prior BRDF database to provide a less accurate but still useful set of parameters. The data are available at the Earthdata Search portal https://search.earthdata.nasa.gov/search (last access 28 July 2025) and were selected in the area around the coordinates of THAAO (see Section 3.1 for details).
The MCD43A3 product provides black-sky shortwave albedo (directional hemispherical reflectance, BSA) at solar noon and white-sky shortwave albedo (diffuse spectral bi-hemispherical reflectance under isotropic illumination, WSA). This product is widely used in global energy budget studies [42,43,44]. In our analysis, the blue-sky albedo (bSA) is derived by combining the BSA and WSA using a value for the diffuse to global irradiance ratio calculated with a radiation transfer model for clear-sky conditions, as discussed in Section 2.3.
The MCD43A3 product [45] also includes the albedo quality assurance information by specifying quality flags (QAs), which can take a value from 0 to 7 for every pixel [41]. indicates sufficient, angularly well-distributed measurements to retrieve the BRDF, whereas indicates that a backup algorithm is applied [14]. A QA of 2 or more indicates that the value can be affected by problems on specific MODIS bands.
Only data with full BRDF () or those with use of the backup algorithm () were considered in this study, while those with MODIS band 6 detection problems ( and ) were disregarded. The number of days fulfilling these conditions is 1920 out of the total of 2190 (87.7%) available in the period under investigation.
The MCD43A2 product provides the information on the SZA, land/water type and snow fraction. Schaaf et al. [46] show that a SZA higher than 70° can affect the albedo determinations. The SZA for MODIS acquisitions is lower than 70° in the period from April 6 until September 7. The land/water type product provides an identification of the surface type, e.g., ocean (0), only land (1), ocean or lake shorelines (2), or inland water (3). These values are useful for detecting only land type for the spatial domain analysis (Section 3.1). The snow fraction index is equal to 1 if the pixel is covered by snow and is 0 if the pixel is snow-free. The MODIS snow fraction index was used to investigate the influence of surface properties on the agreement between satellite and ground-based albedo.
2.3. Derivation of bSA from MODIS Measurements
The period considered for the analysis starts in July 2016 and ends in October 2024. Albedo data from 1 March to 31 October are used in the comparison. Before comparing and , the Blue-Sky albedo (bSA) was calculated from WSA and BSA, as follows:
where is the ratio between diffuse and global irradiance. was calculated using the MODerate-resolution atmospheric radiance and TRANsmittance model (MODTRAN), version 6.0 ([47]), for cloud-free and aerosol-free conditions and assuming a sub-Arctic summer atmospheric profile. Calculations were performed for four values of the SZA, i.e., 53°, 63°, 73°, and 83°, and a quadratic fit was applied to obtain a continuous function of the SZA.
Calculations were carried out for two different surface albedo spectra available in the model: the granite representative for bare soil (low ) and the fresh snow for snow-covered surface (high ). This choice is based on the seasonal variability in the measured surface albedo (Figure 2) and to test the sensitivity of on different albedo values. Figure 3 shows the calculated values of and the derived fitting curves for the two selected spectral albedo curves.
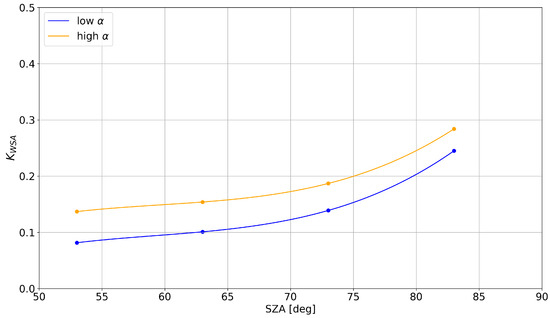
Figure 3.
Polynomial fit used to evaluate the equations for the bSA. Here, the polynomial fit for diffuse/global radiation is represented.
Although they represent extremely different conditions, the values do not dramatically differ, as shown in Figure 3.
The difference between WSA and BSA is not large, especially in summer, as shown in Figure 4 for the year 2023.
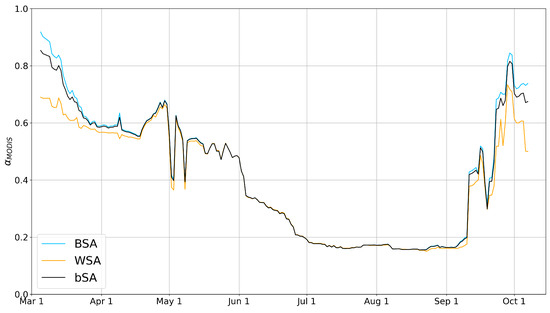
Figure 4.
Evolution of WSA and BSA compared with the bSA for the year 2023.
We chose to apply the values calculated with the granite surface albedo to the cases with below 0.3 and the values obtained for fresh snow to the rest of the cases. A sensitivity study was carried out to assess the impact of applying the functions for three thresholds, of 0.3, 0.4, and 0.5. The analysis was focused on the months of May and September of the whole period, when the albedo changes from values below 0.35 up to above 0.5. The results showed that the average difference is very small, 0.0002 (0.0003), when using 0.4 (0.5) instead of 0.3 as the limit value.
2.4. Selection of Cloud-Free Cases
The comparison of and was carried out first for all-sky conditions, and subsequently for a subset of data corresponding to cloud-free conditions. For the THAAO dataset, the algorithm developed by [36], based on the measurements of infrared zenith sky brightness temperature (IBT) obtained with the pyrometer, was applied to identify cloud-free conditions. Clouds are expected to induce an increase in both IBT and, for most cloud types, its variability. Thus, the algorithm uses a threshold on IBT and, for low values of IBT ( K), on the IBT standard deviation calculated over 15 min. Periods with values of K or K and their respective standard deviations lower than the threshold were classified as clear-sky. Since the pyrometer measures only clouds falling into the instrument field, a temporal window of one hour was considered.
For the cloud-free cases, if the algorithm detected clouds, the corresponding daily was discarded. If cloud-free conditions were detected in the 1 h interval centred in the local solar noon, the corresponding daily value of albedo (averaged value of the 1 h interval around solar noon) was considered. Applying this filter, the number of days available for the comparison decreased from 2055 to 730 out of the total of 2190 (from 93.8% to 33.3%).
For the MODIS dataset, only data whose QA value was equal to 0 in all pixels considered during the spatial average were defined as “good quality” and selected for the cloud-free comparison. The number of days available for the MODIS dataset was reduced to 597 out of 2190 (27.3%).
For the comparison, data from MODIS and THAAO needed to be simultaneously defined as clear-sky, so the number of days comprised in the comparison was reduced to 224 (10.2% of the total). The analysis of cloud-free days was carried out until 4 October 2024, when the pyrometer was removed from the roof of THAAO.
3. Results
3.1. Satellite Spatial Domain
Due to the coastal location of THAAO, the choice of the area over which MODIS observations are considered was crucial because pixels could include sea-ice/ocean surfaces.
Thus, the was averaged over different areas (i.e., number of pixels) and compared with in situ observations to assess the role of spatial resolution in improving MODIS albedo estimates. No filter for clear sky was applied in this analysis. Squared areas of different sizes centred around THAAO were considered: 0.5 km × 0.5 km, 1 km × 1 km, and 2 km × 2 km, including 1, 4, or 16 pixels, respectively. Areas larger than 4 km2 also included ocean pixels and were not considered for this comparison. The limited number of pixels where the albedo was retrieved by applying a full inversion () may influence the statistics, and for this reason pixels with were also considered.
The mean values of and ; the mean bias (MB), calculated as ; and the root mean squared difference (RMSD) are summarized in Table 1 considering the three areas and the different surface conditions. Results are calculated separately for full snow-covered pixels (only snow fraction index = 1), snow-free pixels (only snow fraction index = 0), and mixed pixels (both pixel types present in the domain).

Table 1.
Mean bias () and RMSD for different satellite spatial domains and for different surface conditions retrieved by MODIS. No mixed conditions are possible for the single-pixel area.
The largest RMSD is evidently found for mixed conditions, both for the 4- and the 16-pixel areas. The smallest bias occurs for cases of snow-free surface. Thus, the surface conditions, and in particular the surface homogeneity, play a role in determining the agreement between satellite and in situ data.
The largest values of RMSD are found for the single-pixel analysis. The 1 km × 1 km area produces smaller values of MB for all surface conditions, and this area is used in the following comparison. The number of days with both MODIS and THAAO albedo is 1660.
Figure 5 focuses on 2023 as an example to assess the differences in MODIS-estimated values of albedo when considering the three spatial domains. During the spring months of 2023, values show sudden and significant variations, whereas data do not follow these rapid changes. Between mid-March and mid-April, the 1 km × 1 km area shows the closest values to the THAAO albedo. It also appears to match the best the albedo evolution measured at THAAO at the end of September.
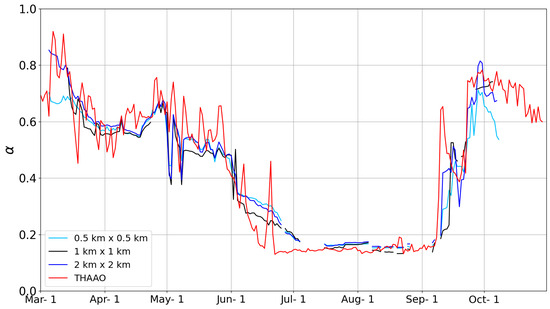
Figure 5.
Evolution of derived over the three area domains and for the year 2023.
3.2. Comparison for All-Sky Conditions
Figure 6 shows and for each year of the 2016–2024 period. shows smoother variations with time compared to due to its 16-day temporal window. Periods with missing ground-based measurements in 2018–2021 are due to technical problems.
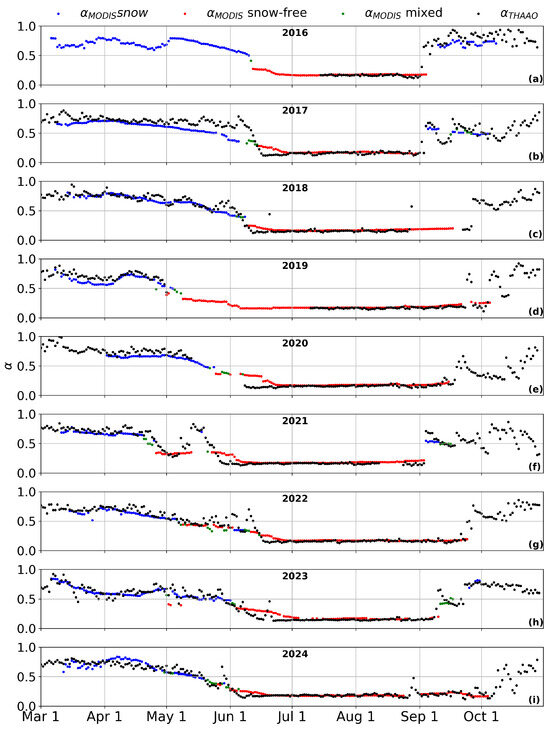
Figure 6.
Time evolution of and daily measurements of albedo for all-sky conditions from 2016 to 2024 (a–i). The black dots represent , the blue dots represent evaluated on snow conditions, the red dots represent evaluated on snow-free conditions, and green dots represent evaluated on both snow-covered and snow-free conditions. The time evolution covers the period from March to October for each year, the period in which the amount of light is enough to obtain measurements of . Periods in which no black dots are shown are due to technical issues and a lack of data from ground measurements as described in Section 2.1.
A preliminary analysis was carried out by comparing with 16-day running average values of . As discussed above (see Section 2.2), it must be taken into account that the MODIS surface reflectance observations over 16 days are used to model the surface BRDF, and only observations in cloud-free conditions are considered. These may occur at any time during the 16-day period, and the satellite-derived albedo is not an average over the 16-day period. The comparison of with 16-day running average values for in fact produces somewhat worse results than with daily values (i.e., a larger bias and lower correlation), and we preferred to use daily in situ data in the following analysis.
The value of the snow fraction index is also displayed in Figure 6. Albedo differences as large as 0.3 may be found in May–June and in some cases during the fall season, affecting the transition periods from snow-covered to snow-free surfaces in particular. During spring, the MODIS sensor generally appears to underestimate the albedo measured at the surface, as for the years 2017, 2019, and 2020. During September and beginning of October, is generally similar to , as shown in Figure 6 for the years 2017, 2019, 2021, 2023, and 2024. The monthly mean values of and and the bias and RMSD are reported in Table 2. The largest values of RMSD are found in the transition months of May, June, September, and October. The largest occurrence of mixed surface conditions is found in May (31.3% of the cases). The months of March and October are characterized by a lower amount of data due to poor sunlight conditions for MODIS measurements.
Table 2.
Comparison of monthly averages of and for all-sky conditions. The MODIS data used for this analysis contain and and both snow-covered and snow-free pixels. The number of days available for the comparison in each month is reported in brackets.
When all data are considered together, the MB and RMSD for all-sky conditions are −0.02 and 0.09, respectively.
Stroeve et al. [48] found similar results for all-sky conditions, though they conducted their work over the GrIS, where the changes in albedo are not as rapid as at THAAO, with a mean difference between MODIS estimates and field-based measurements of about 0.02.
Figure 7 shows the scatterplot between and grouped by year. The correlation coefficient () represents the correlation over the whole period considered from 2016 to 2024. The good summer agreement is evident, with an apparent overestimate of satellite observations. A large spread is present for intermediate values of , and is somewhat reduced for high value of the albedo. For these values in general the satellite albedo underestimates the in situ data, as also shown in Table 1.
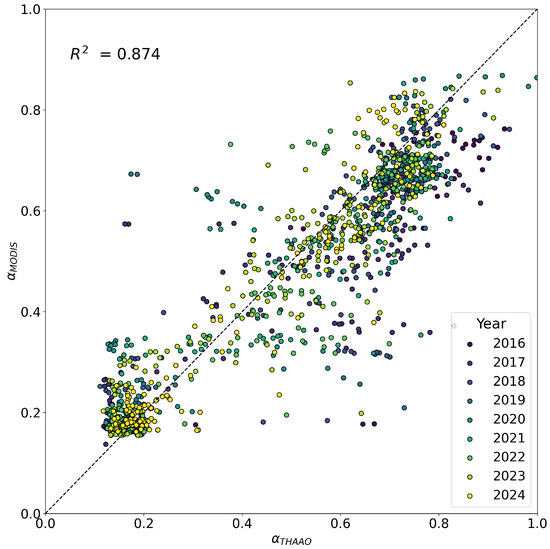
Figure 7.
Scatterplot between and for all-sky conditions grouped by year from 2016 to 2024.
3.3. Comparison for Cloud-Free Conditions
As discussed above, the daily value of for cloud-free conditions was calculated as the mean value in the one-hour interval centred at the local solar noon. Only the 1 h intervals declared as cloud-free, using the algorithm described in Section 2.4, and only the values of with QA =0 are considered for this comparison.
Figure 8 shows the evolution of and in cloud-free conditions for each year. In the figure, the snow cover conditions in which are evaluated is highlighted based on the MODIS snow fraction product. The days considered for the comparison, 224, are those in which both ground-based and satellite data are present. The number of available days is not sufficiently large to perform an analysis based on monthly means. Based on the snow fraction index, there are 165 days of snow-free, 58 days of snow-covered, and 1 day of mixed conditions. The mean bias and RMSD for snow-covered and snow-free conditions are reported in Table 3. As found for all-sky conditions, the two albedo determinations are in very good agreement for snow-free conditions, while there is a relatively large underestimation of MODIS with respect to in situ data for cases of snow-covered surface.

Figure 8.
Time evolution of (black dots), for snow-free conditions (red dots), and for snow-covered conditions (blue dots), for cloud-free days from 2016 to 2024 (a–i).
Table 3.
Mean bias and RMSD for cloud-free days, during snow-covered and snow-free conditions.
These results show that the bias in the summer period, when snow-free conditions occur, is lower than the bias in all-sky conditions, leading to better agreement between and .
The overall MB and RMSD for cloud-free conditions are −0.03 and 0.06, respectively.
As for the previous analysis, Figure 9 shows the scatterplot for days with cloud-free conditions grouped by years and the correlation coefficient for the whole period. The correlation is clearly driven by the distribution of the values for snow-free and snow-covered conditions. Better agreement for the snow-free cases with respect to the all-sky cases emerges, while a more clear underestimation of MODIS with respect to in situ data for snow-covered cases appears. It is also interesting to note that most of the intermediate albedo cases disappear when cloudy cases are removed, possibly because of high cloudiness in the transition months.
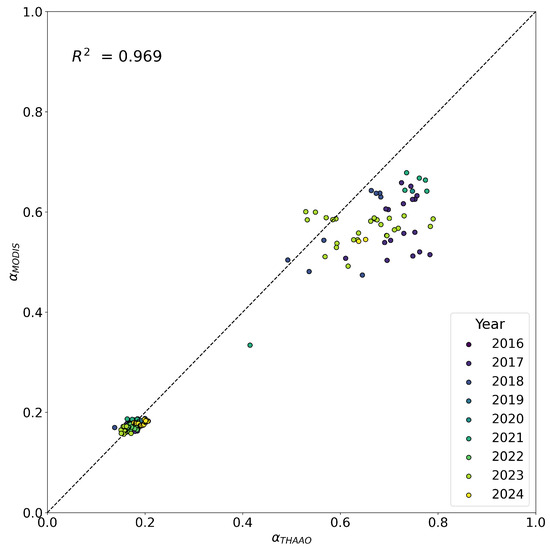
Figure 9.
The same as Figure 7 but for cloud-free conditions.
Previous studies conducted in Greenland found somewhat different results over snow- and ice-covered areas. Wright et al. [26] compared in situ and MODIS albedo determinations at Summit station, in the central part of Greenland, during summer 2011 using MCD43 (V006) data. The authors report a mean bias of −0.018 and an RMSD of 0.029 for GrIS when the mean albedo was around 0.85. The location of Summit over the GrIS, where the seasonal variation in the surface albedo is much lower than in coastal sites, and the shorter period investigated, hinders comparison with our findings. Stroeve et al. [14] compared the MODIS MCD43 (V005) albedo product with in situ data from 17 automatic weather stations in Greenland during the summer seasons of the period 2000–2012 for cloud-free conditions. They found that slightly overestimates in situ data by 0.022, with a RMSD of 0.067. The stations are located on GrIS, where albedo seasonal changes are low, and most of them are at high elevation. A few stations at lower elevation close to ablation areas display larger albedo seasonal changes. In these stations the correlation between MODIS and in situ albedo remains high (>0.9), demonstrating that the MODIS sensor, similarly to that observed at THAAO, is able to capture the occurring seasonal changes.
4. Case Studies
Specific cases were analysed to improve the understanding of the albedo differences between MODIS and THAAO data. These cases, marked by MODIS albedo over- or under-estimating ground-based observations, are characterized by rapid and significant changes in . Data from the early summer of 2023 and 2024, for which detailed characterization of the meteorological parameters and the precipitation classification and intensity are available, were investigated. For the analysis, the dataset including all-sky measurements was used.
To improve the understanding of the ongoing process, measurements from several instruments installed at THAAO were considered. The all-sky camera on the roof of the Observatory provides an image every minute with a hemispherical field of view. DSI was considered, along with IBT, to analyse the presence of clouds. Pictures of the area around the radiometers were taken into account, and they are available for specific days in the Supplementary Materials. Information on the precipitation amount and phase were taken from the rain gauge and the disdrometer. The air temperature and its anomaly, calculated as the difference between daily temperature and mean value over the period July 2016–December 2024, were also considered for this analysis as a correlation was observed at THAAO between changes in surface albedo and temperature anomalies [35].
4.1. June 2023
Figure 10 shows the time series of measured surface albedo with high temporal resolution (5 min averages), the amount of precipitation (PR) measured by TRwS, the precipitation size distribution measured by the disdrometer, and daily average values of and , temperature (), and temperature anomaly () during June 2023. The detected precipitation types derived from the disdrometer observations are also reported during the precipitation events. In addition, the shading in the bottom figure allows to identify days with cloud-free conditions at least during 50% of the day and days with solid, liquid, and mixed precipitation.
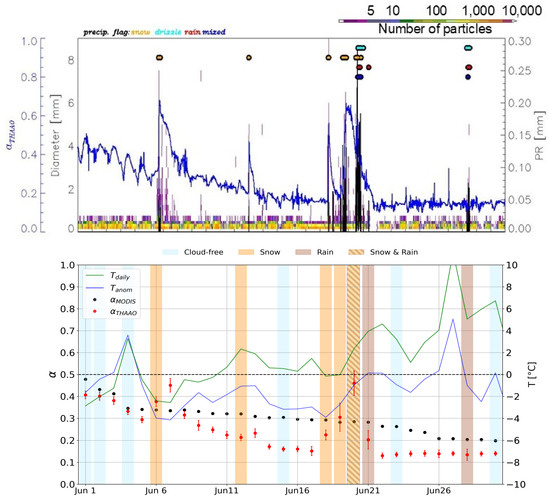
Figure 10.
Top panel: time series of measured surface albedo (blue line) and amount of precipitation (black line), based on 5 min averages; precipitation size distribution data at 1 min time resolution are also shown (number of particles, in colour, with respect to size). The precipitation type derived from disdrometer data is also indicated on the top part of the figure (legend on the top left). Bottom panel: time series of daily average temperature (green line), temperature anomaly (blue line), (with uncertainty) (red dots), and (black dots) in June 2023. Snowfall, rainfall, and clear-sky conditions are highlighted by orange, brown, and light blue vertical lines, respectively. The hatched lines identify mixed precipitation of snow and rain. Days with no background colours identify cloudy conditions without precipitation.
Daily air temperature is above freezing on 4 June and after 10 June. Cloud-free conditions occur during the first days of the month and in isolated days on 15, 23, and 30 June. A progressive decrease in occurs during the month, in agreement with increasing temperature, which facilitates snow melting at the surface. Three events with an albedo increase, around 6–7, 13, and 18–20 June, are present. increases on 6–7 June as a consequence of the snowfall event on the afternoon of 6 June, also thanks to the low values of and . The precipitation event is clearly detected by the increase in the amount of PR (in Figure 10) and in the number of particles with large diameters. As the temperature increases, progressively decreases, and the particle size distributions return to background values. The slight increase on 13 June is associated with a modest solid precipitation event in the afternoon of 12 June. This limited increase in daily surface albedo on 13 June, followed by its rapid decrease, is likely due to the small amount of precipitation occurring on 12 June combined with the surface temperature being above freezing. The snow precipitation events occurring on 18, 19, and early 20 June produce a significant increase in the daily albedo, up to about 0.45 on 20 June. In the afternoon of 20 June, mixed precipitation, with rain, combined with relatively high temperatures, induces a sudden decrease in the surface albedo. In the following days, with well above 0 °C, the typical summer low values are present and remain nearly constant. In Figure S1 of the Supplementary Materials, images of the webcam that show these rapid changes are provided.
data show a constant decrease in the period, from 0.49 to 0.2, but are not able to capture the rapid evolution of the local albedo. The comparison of and shows that there is reasonable agreement between the two datasets at the beginning of the month, when there are a few days of cloud-free conditions. In addition, an analysis conducted using the snow-cover product of MODIS highlights that only the first day of June is detected as snow-covered, with mixed conditions on 2 and 3 June and snow-free conditions for the rest of the month. The snowfall captured by ground-based measurements is not detected from the satellites. This could be due to the rapid evolution of snowfall and melting and the presence of clouds that do not allow the satellite to evaluate correctly the snow cover of the soil.
It is interesting to note that, even if cloud-free conditions occur on isolated days, there is limited agreement between the two quantities during most of the month. In particular, rapid changes are not detected in . As expected, when snow melts due to rain events and high temperatures, the surface albedo variability reduces, and better agreement is found even if there are few cloud-free days.
4.2. May–June 2024
Figure 11 is similar to Figure 10 but covers the period from mid-May to mid-June 2024. progressively decreases from about 0.55 in mid-May to about 0.15 in mid-June, with few short periods when undergoes rapid increases (17 May, 27–28 May, and less rapid on 9–11 May). The small increase on 17 May and the larger one of 27–28 May occur after a snowfall event with and below 0 °C. After the first one, cloud-free days with increasing temperature determine the reduction in from 0.58 to 0.34. The peak of 0.67 on 28 May is reached after two days of solid precipitation and low temperatures. The webcam images reported in Figure S2 of the Supplementary Materials show the widest snow cover on this day. The rapid decrease occurring on 29 May seems to be driven by absorption of solar radiation in clear-sky conditions, while the progressive decrease seems to slow down the following day due to additional, albeit limited, snowfall, which does not significantly affect the albedo. The average temperature remains below freezing until 5 June, except for a transitory peak around 20 May. It is generally close to 0 °C or positive after 5 June, with a maximum of about +8 °C on 9 June. In general, seems to correctly reproduce the overall evolution during the month, although it does not appear capable of following fast changes. The snow cover product identifies the soil as snow-covered for the days from 15 May to 19 May and is able to detect snow also on 29 May. Apart from 5 June, has only a moderate increase on 28 May, followed by a decrease.
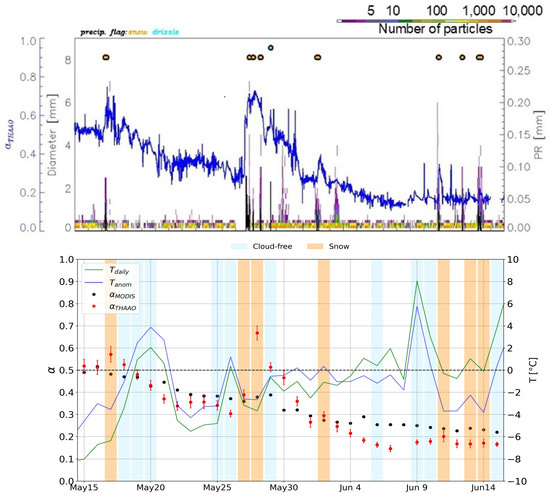
Figure 11.
The same as Figure 10 during the period mid-May and mid-June 2024. on 8 June is missing due to maintenance of the pyranometers.
Some discrepancies are also evident during some of the cloud-free days. This could be due to the higher inhomogeneity of the ground in this transition period. In fact, MODIS identifies mixed conditions in several days with a total of 31% of the period. The satellite data appear to totally miss the albedo increases occurring on 17 May and 9 June; the latter is detected as snow-free by MODIS. Some evidence of an increase appears in the satellite record on 28 and 29 May, although it is much smaller than that found in the ground-based observations. This increase may be related to cloud-free days shortly before and after the snow precipitation event.
The overall agreement between MODIS and in situ observations seems improved in this period of 2024 compared to the previous case of 2023, possibly because of a larger frequency of occurrence of cloud-free days. Also during this period, the critical role played by cloud cover emerges, leading to being evaluated using the backup algorithm, as well as the limitations of the MODIS sensor in detecting fast changes, which lead to an underestimation during the snowfall events.
5. Conclusions
In the Arctic region, the albedo plays a key role in the surface radiation budget and in some of the complex acting feedback mechanisms, and the detection of albedo changes is crucial for the understanding of Arctic climate. Satellites are fundamental in capturing these changes thanks to their wide spatial coverage. However, several limitations pertain to the satellite observational capabilities at high latitudes, and a verification against the sparse in situ observations is necessary. The 500 m MODIS 16-day BRDF/Albedo product (MCD43A3) was compared in this work to ground-based measurements at THAAO, located on the northwest coast of Greenland, from 2016 to 2024.
Three spatial domains with a different number of MODIS pixels around the ground-based site were considered in the analysis. Only land pixels were taken into account, as well as the discrimination between snow-free, snow-covered, and mixed surface conditions according to the MODIS MCD43A2 product. Data on the 1 km2 domain produced the smallest bias with respect to in situ data, and averages of MODIS albedo values over this area were used in the comparison.
The first comparison between and was conducted considering all-sky conditions. Although general good agreement between MODIS and in situ albedo determinations (mean bias of −0.02) is found, large monthly differences are evident, as assessed by the root mean squared deviation value of 0.09. The best agreement is found in July and August, in snow-/ice-free conditions, when the values are 0.16–0.17, with mean bias of 0.01 and root mean squared differences of 0.02–0.04. During May and June (melting season) and September, MODIS cannot capture the rapid changes in albedo associated with snowfall, rain, and snow melt. Cases with MODIS albedo under- and over-estimating the in situ measurements are common in the transition season, and may reach differences up to 0.3. The mean bias is the largest in May (−0.07), when mixed surface conditions are more frequent (31.3%); the root mean squared deviation is the largest in September and October, with values of 0.11 and 0.14. MODIS indicators of the surface conditions (i.e., snow-covered, mixed, and snow-free) were also used in the analysis. The comparison between MODIS and in situ for mixed surface conditions produces the largest values of RMSD (0.12) and among the largest values of MB (−0.06). Thus, the combination of non homogeneous snow cover conditions at the surface, which is expected to enhance the influence of spatial resolution differences, and the large effect of cloudiness, which prevents continuous direct satellite observations of the surface, appears to play a significant role in producing good agreement between satellite and in situ observations. The root mean squared deviation between satellite and ground-based albedo in all-sky conditions and over all seasons in the 2016–2024 period is 0.09. The mean bias is the smallest in July and August (+0.01) and the largest in May (−0.07), when mixed surface conditions are more frequent (31.3%); the root mean squared deviation is the largest in September and October, with a value of 0.11 and 0.14.
The second part of the analysis was focused on cloud-free conditions. The algorithm described in [36] for ground-based observations and a selective choice of quality factors for MODIS data were applied to select the days of cloud-free conditions. This selection reduced the number of days available for the comparison from 1660 to 224. The analysis was conducted for snow-covered and snow-free conditions separately. Also for cloud-free conditions, the best agreement for all nine years was found during the snow-free season, with zero mean bias and 0.01 RMSD, while generally MODIS underestimates in situ data during the snow-covered season, with a mean bias of −0.10 and a RMSD of 0.12.
In the last part of this work, two case studies were selected in periods when measurements of the precipitation amount and characteristics were also available (June 2023 and mid-May–mid-June 2024). In the two periods, all-sky daily albedo values from MODIS and THAAO were compared and then correlated with in situ precipitation and temperature measurements. In both periods snowfall or rain/mixed precipitation occurred and induced rapid changes in the albedo. Snowfall was dominant in both years until mid-June, while mixed precipitation and rain occurred afterwards. Temperature also appears to play a role, with faster albedo decreases occurring when temperatures rise above freezing. Although the overall general evolution of the albedo seems to be detected by MODIS, most of the fast events are not captured. Cloud cover appears to play a significant role, especially during the melting months when snowfall and snow melting occur rapidly. During cloudy days is evaluated using its backup algorithm that is not able to follow these rapid changes.
These results show that large differences between in situ and satellite-derived albedo may be found when MODIS surface observations are impaired by clouds and MODIS albedo estimates are based on an interpolation algorithm. The use of MODIS albedo values, which correspond to the best values of the quality assurance flags (QA = 0) is recommended. The retrieval of the albedo in cases of inhomogeneous surface conditions is also problematic.
Supplementary Materials
The following supporting information can be downloaded at https://www.mdpi.com/article/10.3390/rs17243952/s1, Figure S1: Images of the snow cover evolution from 17 to 22 June 2023; Figure S2: Images of the snow cover evolution from 26 to 31 May 2024.
Author Contributions
Conceptualization, M.T., D.M. and A.G.d.S.; Data curation, A.I.; Investigation, C.S., G.M., A.G.d.S., D.M., M.T., F.C.Q., G.P. and V.C.; Writing—original draft, M.T., D.M. and A.G.d.S.; Writing—review & editing, F.C.Q., V.C., T.D.I., D.M., G.M., G.P. and A.G.d.S.; Supervision, D.M., A.G.d.S. and G.M. All authors have read and agreed to the published version of the manuscript.
Funding
This research has been supported by the Italian Ministry for University ad Research through the projects “Study of the water Vapour in the polar AtmosPhere” (SVAAP); “Observations of the Arctic Stratosphere In Support of YOPP” (OASIS-YOPP); and “Clouds And Radiation in the Arctic and Antarctica” (CLARA2), funded by the Italian Antarctic research program (PNRA) and through the project “Effects of Changing Albedo and Precipitation on the Arctic Climate” (ECAPAC) funded by the Italian Arctic Research Programme (PRA). INGV and ENEA provide financial support for the Italian scientific activities at THAAO. INGV supports THAAO within the framework of the Pianeta Dinamico project, the Multidisciplinary Analysis of Climate change indicators in the Mediterranean And Polar regions (MACMAP) project, and through agreements with the National Science Foundation (USA) and Inussuk (DK).
Data Availability Statement
MODIS MCD43A3 Albedo and MCD43A2 Quality products were downloaded from the Earthdata Search portal https://search.earthdata.nasa.gov/search (accessed on 15 September 2025). The data at the temporal resolution used in this study are available upon request to the authors. The data at lower time resolution can be visualized and accessed at the THAAO web site: https://www.thuleatmos-it.it/ (accessed on 15 September 2025).
Acknowledgments
These observations also contributed to various field campaigns and international programs, such as SVAAP, the Year of Polar Prediction (YOPP), and the Arctic Radiation-Cloud-Aerosol-Surface Interaction EXperiment (ARCSIX). YOPP is a flagship activity of the Polar Prediction Project (PPP), initiated by the World Weather Research Programme (WWRP) of the World Meteorological Organization (WMO). We acknowledge the WMO WWRP for its role in coordinating this international research activity. Contributions from two anonymous reviewers, who helped improving the paper, are gratefully acknowledged. The authors acknowledge the National Science Foundation for hosting THAAO within the Pituffik Space Base.
Conflicts of Interest
The authors declare no conflicts of interest.
References
- Jin, Z.; Charlock, T.P.; Smith, W.L., Jr.; Rutledge, K. A parameterization of ocean surface albedo. Geophys. Res. Lett. 2004, 31, L22301. [Google Scholar] [CrossRef]
- Conway, H.; Gades, A.; Raymond, C.F. Albedo of dirty snow during conditions of melt. Water Resour. Res. 1996, 32, 1713–1718. [Google Scholar] [CrossRef]
- Baker, D.G.; Ruschy, D.L.; Wall, D.B. The albedo decay of prairie snows. J. Appl. Meteorol. Climatol. 1990, 29, 179–187. [Google Scholar] [CrossRef]
- Perovich, D.K.; Maykut, G.A.; Grenfell, T.C. Optical Properties Of Ice And Snow In The Polar Oceans. I: Observations. Ocean Opt. VIII 1986, 637, 232–241. [Google Scholar] [CrossRef]
- Serreze, M.C.; Barry, R.G. Processes and impacts of Arctic amplification: A research synthesis. Glob. Planet. Change 2011, 77, 85–96. [Google Scholar] [CrossRef]
- Previdi, M.; Smith, K.L.; Polvani, L.M. Arctic amplification of climate change: A review of underlying mechanisms. Environ. Res. Lett. 2021, 16, 093003. [Google Scholar] [CrossRef]
- Graversen, R.G.; Langen, P.L.; Mauritsen, T. Polar Amplification in CCSM4: Contributions from the Lapse Rate and Surface Albedo Feedbacks. Am. Meteorol. Soc. 2014, 27, 4433–4450. [Google Scholar] [CrossRef]
- Pirazzini, R.; Vihma, T.; Granskog, M.A.; Cheng, B. Surface albedo measurements over sea ice in the Baltic Sea during the spring snowmelt period. Ann. Glaciol. 2006, 44, 7–14. [Google Scholar] [CrossRef]
- Marcianesi, F.; Aulicino, G.; Wadhams, P. Arctic sea ice and snow cover albedo variability and trends during the last three decades. Polar Sci. 2021, 27, 100617. [Google Scholar] [CrossRef]
- Dou, T.; Xiao, C. An overview of black carbon deposition and its radiative forcing over the Arctic. Adv. Clim. Change Res. 2016, 7, 115–122. [Google Scholar] [CrossRef]
- Willeit, M.; Ganopolski, A. The importance of snow albedo for ice sheet evolution over the last glacial cycle. EGU Clim. Past 2018, 14, 697–707. [Google Scholar] [CrossRef]
- He, T.; Liang, S.; Yu, Y.; Wang, D.; Gao, F.; Liu, Q. Greenland surface albedo changes in July 1981–2012 from satellite observations. Environ. Res. Lett. 2013, 8, 044043. [Google Scholar] [CrossRef]
- Elmes, A.; Levy, C.; Erb, A.; Hall, D.K.; Scambos, T.A.; DiGirolamo, N.; Schaaf, C. Consequences of the 2019 Greenland Ice Sheet Melt Episode on Albedo. Remote Sens. 2021, 13, 227. [Google Scholar] [CrossRef]
- Stroeve, J.; Box, J.E.; Wang, Z.; Schaaf, C.; Barrett, A. Re-evaluation of MODIS MCD43 Greenland albedo accuracy and trends. Remote Sens. Environ. 2013, 138, 199–214. [Google Scholar] [CrossRef]
- Persson, P.O.G.; Fairall, C.W.; Andreas, E.L.; Guest, P.S.; Perovich, D.K. Measurements near the Atmospheric Surface Flux Group tower at SHEBA: Near-surface conditions and surface energy budget. J. Geophys. Res. Oceans 2002, 107, 8045. [Google Scholar] [CrossRef]
- Light, B.; Smith, M.; Perovich, D.; Webster, M.; Holland, M.; Linhardt, F.; Raphael, I.; Clemens-Sewall, D.; Macfarlane, A.; Anhaus, P.; et al. Arctic sea ice albedo: Spectral composition, spatial heterogeneity, and temporal evolution observed during the MOSAiC drift. Elem. Sci. Anth. 2022, 10, 000103. [Google Scholar] [CrossRef]
- Liang, S.; Wang, K.; Zhang, X.; Wild, M. Review on Estimation of Land Surface Radiation and Energy Budgets From Ground Measurement, Remote Sensing and Model Simulations. IEEE J. Sel. Top. Appl. Earth Obs. Remote Sens. 2010, 3, 225–240. [Google Scholar] [CrossRef]
- Qu, Y.; Liang, S.; Liu, Q.; He, T.; Liu, S.; Li, X. Mapping Surface Broadband Albedo from Satellite Observations: A Review of Literatures on Algorithms and Products. Remote Sens. 2015, 7, 990–1020. [Google Scholar] [CrossRef]
- Ryan, J.C.; Hubbard, A.; Irvine-Fynn, T.D.; Doyle, S.H.; Cook, J.M.; Stibal, M.; Box, J.E. How robust are in situ observations for validating satellite-derived albedo over the dark zone of the Greenland Ice Sheet? Geophys. Res. Lett. 2017, 44, 6218–6225. [Google Scholar] [CrossRef]
- Feng, S.; Cook, J.M.; Anesio, A.M.; Benning, L.G.; Tranter, M. Long time series (1984–2020) of albedo variations on the Greenland ice sheet from harmonized Landsat and Sentinel 2 imagery. J. Glaciol. 2023, 69, 1169–1184. [Google Scholar] [CrossRef]
- Van Tricht, K.; Lhermitte, S.; Lenaerts, J.T.M.; Gorodetskaya, I.V.; L’Ecuyer, T.S.; Noël, B.; van den Broeke, M.R.; Turner, D.D.; van Lipzig, N.P.M. Clouds enhance Greenland ice sheet meltwater runoff. Nat. Commun. 2016, 7, 10266. [Google Scholar] [CrossRef]
- Gladkova, I.; Shahriar, F.; Grossberg, M.; Frey, R.A.; Menzel, W.P. Impact of the Aqua MODIS Band 6 Restoration on Cloud/Snow Discrimination. J. Atmos. Ocean. Technol. 2013, 30, 2576–2582. [Google Scholar] [CrossRef]
- Urraca, R.; Lanconelli, C.; Cappucci, F.; Gobron, N. Comparison of Long-Term Albedo Products against Spatially Representative Stations over Snow. Remote Sens. 2022, 14, 3745. [Google Scholar] [CrossRef]
- Ding, A.; Liang, S.; Ma, H.; He, T.; Jia, A.; Wang, Q. Improved estimation of daily blue-sky snow shortwave albedo from MODIS data and reanalysis information. Sci. Remote Sens. 2024, 10, 100163. [Google Scholar] [CrossRef]
- Cescatti, A.; Marcolla, B.; Vannan, S.K.S.; Pan, J.Y.; Romain, M.O.; Yang, X.; Ciais, P.; Cook, R.B.; Law, B.E.; Matteucci, G.; et al. Intercomparison of MODIS albedo retrievals and in situ measurements across the global FLUXNET network. Remote Sens. Environ. 2012, 121, 323–334. [Google Scholar] [CrossRef]
- Wright, P.; Bergin, M.; Dibb, J.; Lefer, B.; Domine, F.; Carman, T.; Carmagnola, C.; Dumont, M.; Courville, M.; Schaaf, C.; et al. Comparing MODIS daily snow albedo to spectral albedo field measurements in Central Greenland. Remote Sens. Environ. 2014, 140, 118–129. [Google Scholar] [CrossRef]
- Moustafa, S.E.; Rennermalm, A.K.; Román, M.O.; Wang, Z.; Schaaf, C.B.; Smith, L.C.; Koenig, L.S.; Erb, A. Evaluation of satellite remote sensing albedo retrievals over the ablation area of the southwestern Greenland ice sheet. Remote Sens. Environ. 2017, 198, 115–125. [Google Scholar] [CrossRef]
- Wang, Z.; Schaaf, C.B.; Chopping, M.J.; Strahler, A.H.; Wang, J.; Román, M.O.; Rocha, A.V.; Woodcock, C.E.; Shuai, Y. Evaluation of Moderate-resolution Imaging Spectroradiometer (MODIS) snow albedo product (MCD43A) over tundra. Remote Sens. Environ. 2012, 117, 264–280. [Google Scholar] [CrossRef]
- Riihelä, A.; Laine, V.; Manninen, T.; Palo, T.; Vihma, T. Validation of the Climate-SAF surface broadband albedo product: Comparisons with in situ observations over Greenland and the ice-covered Arctic Ocean. Remote Sens. Environ. 2010, 114, 2779–2790. [Google Scholar] [CrossRef]
- Di Biagio, C.; di Sarra, A.; Muscari, G.; de Zafra, R.L.; Fiocco, G.; Fiorucci, I.; Fuà, D. Evolution of temperature, O3, CO, and N2O profiles during the exceptional 2009 Arctic major stratospheric warming as observed by lidar and millimeter-wave spectroscopy at Thule (76.5° N, 68.8° W), Greenland. J. Geophys. Res. 2010, 115, D24315. [Google Scholar] [CrossRef]
- Muscari, G.; di Biagio, C.; di Sarra, A.; Cacciani, M.; Ascanius, S.E.; Bertagnolio, P.P.; Cesaroni, C.; de Zafra, R.L.; Eriksen, P.; Fiocco, G.; et al. Observations of surface radiation and stratospheric processes at Thule Air Base, Greenland, during the IPY. Ann. Geophys. Spec. Issue Geophys. Monit. Earth’s Polar Reg. 2014, 57, SS0323. [Google Scholar] [CrossRef]
- Fiorucci, I.; Muscari, G.; Froidevaux, L.; Santee, M.L. Ground-based stratospheric O3 and HNO3 measurements at Thule, Greenland: An intercomparison with Aura MLS observations. Atmos. Meas. Tech. 2013, 6, 2441–2453. [Google Scholar] [CrossRef]
- Becagli, S.; Caiazzo, L.; Di Iorio, T.; di Sarra, A.; Meloni, D.; Muscari, G.; Pace, G.; Severi, M.; Traversi, R. New insights on metals in the Arctic aerosol in a climate changing world. Sci. Total Environ. 2020, 741, 140511. [Google Scholar] [CrossRef]
- Calì Quaglia, F.; Meloni, D.; Muscari, G.; Di Iorio, T.; Ciardini, V.; Pace, G.; Becagli, S.; Di Bernardino, A.; Cacciani, M.; Hannigan, J.W.; et al. On the Radiative Impact of Biomass-Burning Aerosols in the Arctic: The August 2017 Case Study. Remote Sens. 2022, 14, 313. [Google Scholar] [CrossRef]
- Meloni, D.; Calì Quaglia, F.; Ciardini, V.; Di Bernardino, A.; Di Iorio, T.; Iaccarino, A.; Muscari, G.; Pace, G.; Scarchilli, C.; di Sarra, A. Shortwave and longwave components of the surface radiation budget measured at the Thule High Arctic Atmospheric Observatory, Northern Greenland. Earth Syst. Sci. Data 2024, 16, 543–558. [Google Scholar] [CrossRef]
- Pace, G.; di Sarra, A.; Calì Quaglia, F.; Ciardini, V.; Di Iorio, T.; Iaccarino, A.; Meloni, D.; Muscari, G.; Scarchilli, C. Verification of parameterizations for clear sky downwelling longwave irradiance in the Arctic. Atmos. Meas. Tech. 2024, 17, 1617–1628. [Google Scholar] [CrossRef]
- Scarchilli, C.; Ciardini, V.; Grigioni, P.; Iaccarino, A.; De Silvestri, L.; Proposito, M.; Dolci, S.; Camporeale, G.; Schioppo, R.; Antonelli, A.; et al. Characterization of snowfall estimated by in situ and ground-based remote-sensing observations at Terra Nova Bay, Victoria Land, Antarctica. J. Glaciol. 2022, 68, 467–483. [Google Scholar] [CrossRef]
- Fehlmann, M.; Rohrer, M.; von Lerber, A.; Stoffel, M. Automated precipitation monitoring with the Thies disdrometer: Biases and ways for improvement. Atmos. Meas. Tech. 2020, 13, 4683–4698. [Google Scholar] [CrossRef]
- Strahler, A.H.; Muller, J.-P.; MODIS Science Team Members. MODIS BRDF/Albedo Product: Algorithm Theoretical Basis Document Version 5.0; NASA: Greenbelt, MD, USA, 1999. [Google Scholar]
- Lucht, W.; Schaaf, C.B.; Strahler, A.H. An Algorithm for the retrieval of albedo from space using semiempirical BRDF models. IEEE Trans. Geosci. Remote Sens. 2000, 38, 977–998. [Google Scholar] [CrossRef]
- Schaaf, C.L.B.; Gao, F.; Strahler, A.H.; Lucht, W.; Li, X.; Tsang, T.; Strugnell, N.C.; Zhang, X.; Jin, Y.; Muller, J.-P.; et al. First operational BRDF, albedo and Nadir reflectance products from MODIS. Remote Sens. Environ. 2002, 83, 135–148. [Google Scholar] [CrossRef]
- Shao, C.; Shuai, Y.; Tuerhanjiang, L.; Ma, X.; Hu, W.; Zhang, Q.; Xu, A.; Liu, T.; Tian, Y.; Wang, C.; et al. Cross-Comparison of Global Surface Albedo Operational Products-MODIS, GLASS, and CGLS. Remote Sens. 2021, 13, 4869. [Google Scholar] [CrossRef]
- Qu, Y.; Liang, S.; Liu, Q.; Li, X.; Feng, Y.; Liu, S. Estimating Arctic sea-ice shortwave albedo from MODIS data. Remote Sens. Environ. 2016, 186, 32–46. [Google Scholar] [CrossRef]
- Wang, X.; Zender, C.S. MODIS snow albedo bias at high solar zenith angles relative to theory and to in situ observations in Greenland. Remote Sens. Environ. 2010, 114, 841–851. [Google Scholar] [CrossRef]
- Schaaf, C.; Wang, Z. MODIS/Terra+Aqua BRDF/Albedo Quality Daily L3 Global—500 m V061 [Data Set]; NASA Land Processes Distributed Active Archive Center: Sioux Falls, SD, USA, 2021. [Google Scholar] [CrossRef]
- Schaaf, C.B.; Wang, Z.; Strahler, A.H. Commentary on Wang and Zender—MODIS snow albedo bias at high solar zenith angles relative to theory and to in situ observations in Greenland. Remote Sens. Environ. 2011, 115, 1296–1297. [Google Scholar] [CrossRef]
- Berk, A.; Conforti, P.; Kennett, R.; Perkins, T.; Hawes, F.; van den Bosch, J. MODTRAN6: A major upgrade of the MODTRAN radiative transfer code. Proc. SPIE 2014, 9088, 90880H. [Google Scholar] [CrossRef]
- Stroeve, J.; Box, J.E.; Gao, F.; Liang, S.; Nolin, A.; Schaaf, C. Accuracy assessment of the MODIS 16-day albedo product for snow: Comparisons with Greenland in situ measurements. Remote Sens. Environ. 2005, 94, 46–60. [Google Scholar] [CrossRef]
Disclaimer/Publisher’s Note: The statements, opinions and data contained in all publications are solely those of the individual author(s) and contributor(s) and not of MDPI and/or the editor(s). MDPI and/or the editor(s) disclaim responsibility for any injury to people or property resulting from any ideas, methods, instructions or products referred to in the content. |
© 2025 by the authors. Licensee MDPI, Basel, Switzerland. This article is an open access article distributed under the terms and conditions of the Creative Commons Attribution (CC BY) license (https://creativecommons.org/licenses/by/4.0/).