Highlights
What are the main findings?
- A multi-track InSAR framework identified 530 active landslides in Jishi Mountain, with reliability enhanced by geometric masking and C-Index checks.
- The application of a local parallel flow model derived 2D deformation fields for 154 landslides, enabling their classification into five movement patterns.
What is the implication of the main finding?
- The approach offers a transferable, non-contact solution for interpreting landslide mechanisms in complex and remote terrains.
- The movement pattern classification supports differentiated risk assessment and informs targeted mitigation strategies.
Abstract
Frequent extreme climate events have intensified landslide hazards in mountainous regions, necessitating efficient identification and classification to understand movement mechanisms and mitigate risks. This study develops a novel, non-contact InSAR framework that seamlessly integrates three key steps—Identification, Inversion, and Classification—to address this challenge. By applying this framework to ascending and descending Sentinel-1 data in the complex terrain of the Jishi Mountain region, we first introduce geometric distortion masking and a C-Index deformation consistency check, which enables the reliable identification of 530 active landslides, with 154 detected in both orbits. Second, we employ a local parallel flow model to invert the landslide movement geometry without relying on DEM-derived prior assumptions, successfully retrieving the two-dimensional (sliding and normal direction) deformation fields for all 154 consistent landslides. Finally, by synthesizing these 2D deformation patterns with geomorphological features, we achieve a systematic classification of movement types, categorizing them into retrogressive translational (31), progressive translational (66), rotational (19), composite (24), and earthflows (14). This integrated methodology provides a validated, transferable solution for deciphering landslide mechanisms and assessing risks in remote, complex mountainous areas.
1. Introduction
As one of the most prevalent and destructive geological hazards in mountainous regions, landslides severely threaten human lives, property, and critical infrastructure (e.g., roads, bridges, and tunnels). They can also trigger secondary disasters like landslide dams and debris flows, thereby jeopardizing regional socio-economic development [1,2,3]. Compounding these threats, global climate change is increasing the frequency of extreme rainfall, which exacerbates landslide activity and leads to new characteristics such as greater frequency, sudden onset, and cascading effects [4]. These developments underscore the critical need to enhance the early identification, dynamic monitoring, and investigation of landslide evolutionary mechanisms for effective hazard prevention and risk management.
Interferometric Synthetic Aperture Radar (InSAR) technology, renowned for its broad coverage, high precision, and all-weather, day-and-night operational capabilities, has become a vital tool for landslide monitoring at regional to individual slope scales [5,6]. However, the side-looking imaging geometry of SAR fundamentally constrains InSAR to measuring deformation solely along the line-of-sight (LOS) direction, thereby hindering the accurate characterization of true three-dimensional landslide movements [7,8]. To overcome this limitation, several methods have been developed to obtain more comprehensive deformation information. These approaches include: (1) integrating multi-platform and multi-track InSAR observations [9,10,11]; (2) combining LOS deformation with azimuthal measurements from Pixel Offset Tracking (POT) or Multiple Aperture Interferometry (MAI) [12,13]; and (3) incorporating prior geophysical assumptions for deformation decomposition [14,15]. Nonetheless, these methods commonly face challenges, including difficulties in acquiring multi-source data, complex processing workflows, and a heavy reliance on topographic prior information derived from digital elevation models (DEMs). In areas where the actual movement geometry of a landslide deviates from the slope and aspect, or where differential sliding occurs, deformation decomposition methods based on DEM assumptions can introduce significant errors [16,17].
Currently, InSAR applications in landslide research primarily emphasize identification, monitoring, and early warning; however, their potential for systematic classification remains underexploited [18]. This gap is critical because the landslide type, governed by distinct displacement patterns and failure mechanisms, directly defines the potential hazard impact area. For instance, translational landslides typically exhibit greater mobility and longer runout distances than rotational ones [19]. Therefore, accurate landslide classification is fundamental for understanding movement mechanisms and assessing associated risks. Conventional classification methods primarily rely on field surveys, drilling, and optical remote sensing interpretation, which are not only labor-intensive and costly but also highly subjective [20,21].
In recent years, advanced methods have emerged to address these challenges. On one hand, several studies have begun to explore InSAR-based classification, which primarily follows two technical pathways: (1) decomposing deformation into east–west and vertical components using combined ascending and descending observations [22]; and (2) assuming slope-parallel movement to decompose deformation into slope-parallel and slope-normal directions, incorporating topographic information to identify movement patterns [23]. However, these methods remain constrained by geometrical assumptions and decomposition accuracy, often yielding coarse categorizations (e.g., broadly rotational or translational) that fail to capture finer kinematic patterns such as retrogressive or progressive movement [22,23,24]. On the other hand, deep learning approaches have achieved significant progress in automatically detecting and mapping landslides from optical imagery and topographic data [25,26,27]. Nevertheless, these models primarily recognize geomorphological signatures and remain largely incapable of deciphering the ongoing kinematic patterns and movement mechanisms from static imagery, which is crucial for a mechanistic classification [22]. The limitations of both technical pathways result in limited applicability and reliability for complex terrains and landslides exhibiting significant movement heterogeneity.
Located in the transition zone between the Tibetan Plateau and the Loess Plateau, the Jishi Mountain region is characterized by active tectonics and complex geomorphology, leading to frequent occurrences of diverse landslide types. This region has historically witnessed several high-consequence landslide events. For instance, the 1983 Saleshan high-speed long-runout landslide caused 237 fatalities [28]. More recently, frequent landslides in the Hualong Basin have severely damaged provincial highways [29]. Furthermore, intensive human engineering activities, notably long-term irrigation in areas such as Heifangtai, have triggered numerous loess landslides, posing persistent threats to residential areas and infrastructure safety [30,31]. These hazards exhibit high complexity in their genetic mechanisms, spatial distribution, and movement characteristics. The diversity of landslide types and the uncertainty in their disaster patterns significantly complicate the identification and mitigation of regional risks.
Consequently, establishing a systematic technical framework for landslide identification, monitoring, and classification is of great scientific significance and practical urgency. While multi-geometry satellite InSAR has been proven powerful for mechanistic interpretation of individual slopes [14], its application for reliable regional identification and systematic classification remains challenging. A primary obstacle is the pervasive presence of geometric distortions and noise in complex terrains, which can lead to false or missed identifications if not rigorously addressed. To bridge this gap, our study develops a comprehensive ‘Identification–Inversion–Classification’ framework. The novelty of this framework lies not only in its end-to-end workflow but also in its core preprocessing module: the integrated use of geometric distortion masking and deformation consistency checks (C-Index) as essential reliability controls. This proactive filtering ensures the generation of a robust landslide inventory, which in turn provides a reliable foundation for the subsequent inversion of two-dimensional deformation fields via a local parallel flow model and the final systematic classification of movement patterns. This framework and the resultant classification are essential for revealing regional disaster mechanisms, enhancing the accuracy of risk assessment, and facilitating the development of differentiated prevention strategies, particularly in remote, data-scarce mountainous regions.
2. Study Area and Datasets
2.1. Study Area
This study selects the Jishi Mountain region as the study area (Figure 1), located in the transition zone between the Tibetan Plateau and the Loess Plateau (102°5′–103°32′E, 35°5′–36°17′N), with an approximate total area of 17,000 km2. The topography is generally characterized by higher elevations in the southwest and lower elevations in the northeast. The region exhibits intense tectonic activity and is traversed by several major deep faults, including the Laji Mountain Fault, Daotanghe–Linxia Fault, and the Northern Margin Fault of the West Qinling Mountains, resulting in an extremely complex geological environment [32,33,34].
The western part of the study area, located within the Tibetan Plateau, exhibits a relatively complete sequence of exposed strata. The primary landslide-prone strata in this area consist of Paleogene–Neogene mudstone and sandstone, as well as Lower Pleistocene lacustrine semi-lithified claystone and Upper Pleistocene loess. In contrast, the eastern part, which is part of the Loess Plateau, is widely covered by the Neogene Linxia Formation, overlain by Quaternary aeolian loess. This loess is characterized by a loose structure, well-developed vertical joints, and a tendency to soften upon contact with water, making it the primary landslide-prone stratum in this section [35,36].
Climatically, the region experiences a continental monsoon mountain climate, situated deep within the continent’s interior. The mean annual temperature is approximately 4 °C, and the average annual precipitation from 2017 to 2021 was approximately 562 mm. Precipitation is concentrated between May and September, often occurring as heavy rain or rainstorms, which readily trigger geological hazards such as landslides and debris flows.

Figure 1.
Overview of the study area. (a) Topography and spatial coverage of SAR imageries; (b) geographical location of the study area; and (c) geological map of the study area [37].
2.2. Datasets
To derive surface deformation covering the Jishi Mountain region, this study utilized C-band, VV-polarized Sentinel-1A SAR images from both ascending and descending orbits for processing and analysis. The Sentinel-1 satellite, operating in Interferometric Wide (IW) swath mode, provides SAR imagery with a swath width of 250 km and a revisit period of 12 days over the study area. Its globally free and open data policy offers strong support for large-scale InSAR deformation monitoring. Figure 1a shows the spatial coverage of the used ascending (black rectangles) and descending (purple rectangles) SAR images, where the ascending data was mosaicked from two standard frames. The detailed parameters of the SAR datasets are listed in Table 1. It should be noted that, to avoid potential contamination of the deformation signals by the Ms 6.2 Jishi Mountain earthquake in late 2023, the SAR image time series used in this study concludes in June 2023. We verified against major seismic catalogs that no earthquakes (M ≥ 2.5) occurred within the study area or its immediate vicinity (30 km) during our investigation period (January 2020 to June 2023). This confirms that the detected deformation is not systematically affected by other seismic events.

Table 1.
Detailed parameters of the ascending and descending Sentinel-1 SAR datasets.
3. Methodology
Following the overarching “Identification–Inversion–Classification” framework, this section outlines the technical roadmap and core methodologies, which build upon the previously established geological context and data sources. First, the SBAS-InSAR technique is applied to derive the LOS deformation fields from both ascending and descending orbits over the study area. The reliability of these results is enhanced through geometric distortion masking and C-Index deformation consistency analysis, culminating in a robust inventory of active landslides. Subsequently, a 2D deformation inversion method based on a local parallel flow model is employed to retrieve the sliding direction and normal direction displacements for landslides detected in both ascending and descending tracks. Finally, a non-contact landslide classification system is developed by integrating the retrieved 2D deformation fields with geomorphological features interpreted from high-resolution optical remote sensing imagery. The overall technical workflow is summarized in Figure 2.
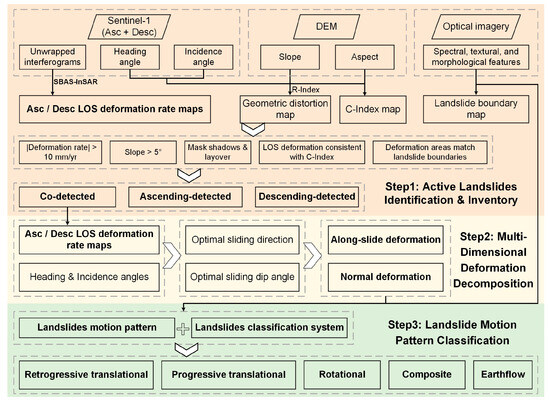
Figure 2.
Research flow chart.
3.1. SBAS-InSAR
This study utilized the Hybrid Pluggable Processing Pipeline (HyP3) cloud platform for the automated processing of InSAR from Sentinel-1 SAR data. This platform, which operates within the Amazon Web Services (AWS) cloud computing environment using GAMMA software (version 20240627), effectively reduces dependency on specific hardware/software configurations and mitigates the operational complexities associated with conventional InSAR processing. The processing chain primarily includes data preprocessing, interferogram generation, co-registration and refinement, phase unwrapping, and geocoding with product output. During preprocessing, spatiotemporal baseline thresholds were applied (temporal baseline: 60 days; spatial baseline: 300 m; see Figure 3). Topographic phase was removed using the Copernicus GLO-30 DEM, noise was suppressed via multi-looking (10 × 2), and phase unwrapping was performed using the minimum cost flow (MCF) algorithm, resulting in products that included unwrapped interferograms and coherence maps. Subsequently, time-series InSAR analysis was conducted using MintPy (version 1.6.0.post14, date 17 April 2024) [38]. The time-series displacement was inverted via the Weighted Least Squares (WLS) SBAS algorithm. Corrections were applied for solid Earth tides, atmospheric delays (based on the ERA5 model), and topographic residuals, while images exhibiting high noise phases were removed. Finally, a high-coherence stable building located within Jishi Mountain County was selected as the reference point to calculate the mean deformation velocity across the study area.
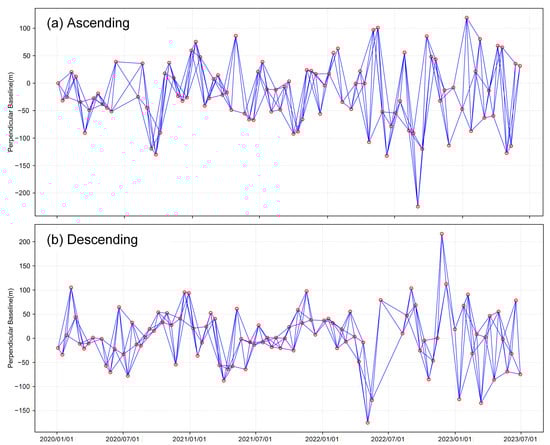
Figure 3.
Temporal-spatial baseline plot of Sentinel-1 SAR datasets. (a) Ascending dataset; (b) Descending dataset.
3.2. Geometric Distortion
Due to the side-looking imaging geometry of SAR satellites, images of areas with pronounced topographic relief, such as the Jishi Mountain region, are prone to geometric distortion, including shadow and layover effects. Therefore, the accurate identification and subsequent masking of these distorted areas are crucial for enhancing the precision of landslide identification using InSAR. This study integrated the R-Index [39] and a hillshade model [40] for the identification of geometric distortion. The R-Index was primarily used to identify active geometric distortion induced by the terrain itself, encompassing active shadow, active layover, and foreshortening. Conversely, the hillshade model was employed to discriminate passive geometric distortion influenced by adjacent topography, such as passive shadow and passive layover. In this model, the radar satellite is conceptualized as a light source, enabling the identification of passive distortion zones by simulating the propagation path of the radar beam. The specific parameter settings were as follows: for shadow identification, the satellite azimuth angle (, : heading angle) and satellite elevation angle () were used; for layover identification, the satellite azimuth angle () and satellite elevation angle () were applied. Based on the DEM data, areas of shadow () and layover () were assigned a value of 0, while all other areas were assigned a value of 1. Following computation and reclassification, six distinct geometric visibility types were ultimately derived; the specific classification scheme is detailed in Table 2.
Table 2.
Geometric visibility classification criteria for the hillshade model.
3.3. C-Index
C-Index is a scaling factor used to quantify the degree to which the potential downslope movement direction of a slope is projected into the InSAR LOS direction [41]. Its value ranges from −1 to 1. This index provides an intuitive indication of the consistency between the deformation signal and the topographic movement direction: a negative C-Index value indicates slope movement away from the satellite, while a positive value indicates movement towards the satellite. When C-Index = −1 or 1, it signifies that InSAR can fully capture the entire deformation component moving away from or towards the satellite, respectively.
Under the premise that landslide movement is primarily gravity-driven and occurs downslope along the slope direction () at the slope angle (), the C-Index can be calculated using the following formula, incorporating the SAR image′s heading angle () and incidence angle ():
3.4. Two-Dimensional Deformation
This study introduces a local parallel flow model to retrieve the 2D deformation field (in both sliding and normal directions), thereby obtaining key information that more accurately reflects the mechanisms of landslide movement. By jointly utilizing ascending and descending InSAR observations under the assumption of a basal sliding surface approximately parallel to the slope (noting potential deviations [42,43]), this method estimates a high-precision 2D deformation field without relying on DEM-derived prior assumptions.
Within this framework, the LOS deformation measurements from ascending and descending ( and ) are related to the sliding direction displacement () and normal direction displacement () through the following linear geometric relationship:
Here, the coefficients and are determined by both the satellite geometric parameters (incidence angle , heading angle ) and the geometric parameters of the sliding surface (dip angle , sliding direction ).
By solving this system of equations, the 2D motion field of the sliding mass can be retrieved. For the detailed mathematical derivation of this method, please refer to our previously published study [43].
3.5. Landslide Movement Pattern Classification
This study utilizes the derived 2D deformation fields, combined with topographic and geomorphological features from optical imagery, to achieve a systematic classification of landslide movement patterns. Based on the classical classification systems of Varnes [44] and Hungr [45], landslides are categorized into three primary types: rotational landslides, translational landslides (including retrogressive and progressive subtypes, the most common), and earthflows (the least common, Figure 4). Their specific characteristics are as follows:
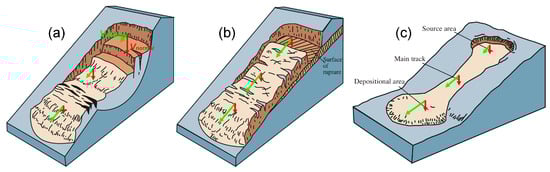
Figure 4.
Schematic diagram of landslide classification [46]. Red and green arrows denote normal and sliding direction displacements, respectively, with their lengths proportional to the displacement magnitudes. (a) Rotational landslide; (b) translational landslide; and (c) earthflow.
- (1)
- Rotational landslides are characterized by comparable magnitudes of sliding and normal direction displacements, which exhibit distinct spatial distributions. The normal direction displacement is concentrated in the rear scarp area and decreases downslope, whereas the sliding direction displacement predominates in the frontal zone and increases downslope. These landslides typically occur on steep slopes and are marked by a distinct head scarp and a compressed, bulging toe. The toe deposits are heterogeneous and mixed. Characteristic cracking patterns include arcuate tensile cracks at the crown and radial tensile cracks at the toe (Figure 4a).
- (2)
- Translational landslides are dominated by sliding direction displacement. The normal direction displacement is concentrated either at the front (retrogressive) or rear (progressive) portion, exhibiting opposing trends along the slope, whereas the sliding-direction displacement remains relatively uniform. These landslides often occur on gentler slopes. Surface cracks are typically parallel or linear and aligned with the sliding direction. The toe deposits are relatively coherent and exhibit low fragmentation (Figure 4b).
- (3)
- Earthflows are overwhelmingly dominated by sliding direction displacement, with negligible spatial variation in the normal direction component. Movement is typically slow and fluid-like. The ground surface may exhibit elongated longitudinal and transverse cracks. The deposits are loose and irregularly shaped, often showing evidence of breakup and redistribution along the flow path (Figure 4c).
It is noteworthy that some landslides exhibit composite characteristics, incorporating movement patterns from multiple types described above.
4. Results and Analysis
4.1. SBAS-InSAR Results
4.1.1. Deformation Velocity Maps
Figure 5a,b present the surface deformation velocity maps along the LOS direction for the Jishi Mountain region, derived from ascending and descending SBAS-InSAR processing, respectively. Positive values (blue) indicate movement towards the satellite, while negative values (red) represent movement away from the satellite. Statistical results (Figure 5c,d) indicate that the mean absolute LOS deformation velocities are 3 mm/yr (ascending) and 6 mm/yr (descending), with standard deviations (σ) of 4 mm/yr and 5 mm/yr, respectively. These low velocity values and standard deviations indicate stable and reliable deformation monitoring results. Furthermore, stable areas [47], defined as those with LOS deformation rates within ±10 mm/yr (2σ) [48], constitute 95.8% and 85.4% of the total study area for the ascending and descending datasets, respectively. This confirms the overall stability of the Jishi Mountain region. No large-scale, systematic deformation patterns were detected across the study area. The detected deformation is predominantly characterized by localized, small-scale clusters, which are largely associated with specific geological hazards, including landslides, collapses, and ground subsidence. The maximum deformation rates observed in the LOS velocity maps are −181 mm/yr and −185 mm/yr for the ascending and descending directions, respectively.
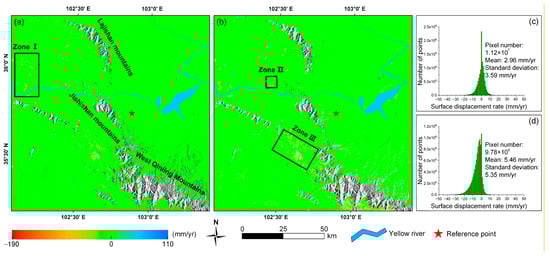
Figure 5.
Surface deformation velocity maps derived from SBAS-InSAR. (a) Deformation velocity map (ascending); (b) deformation velocity map (descending); (c) histogram of deformation velocity distribution (ascending); and (d) histogram of deformation velocity distribution (descending).
In Figure 5a, Zone Ι represents a typical small-scale surface deformation concentration zone, with an enlarged view provided in Figure 6. This area is situated within the Jianzha Basin of Hualong County, Qinghai Province. The region comprises numerous landslide-prone strata with low weathering resistance, including Lower Pleistocene clays, mudstones, and sandy conglomerates, as well as red mudstones and sandy conglomerates from the Neogene, Paleogene, and Cretaceous systems [29]. Additionally, long-term erosion and incision by the Yellow River and its tributaries have resulted in numerous high and steep slopes. Coupled with intense tectonic activity, this has formed a fragmented topography characterized by alternating deep gullies and ridges [49]. These factors collectively provide favorable geological and topographic conditions for the concentrated development of landslides.
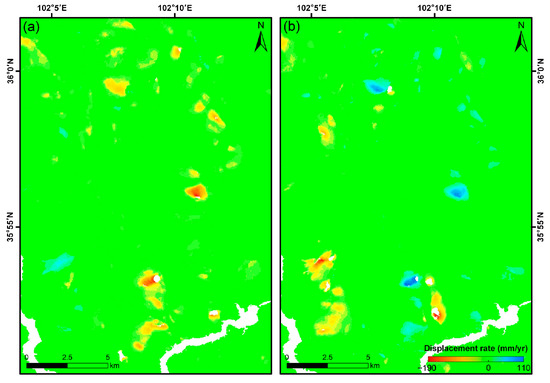
Figure 6.
Typical surface deformation concentration Zone Ι (as outlined in Figure 5) identified by SBAS-InSAR. (a) Ascending dataset; (b) descending dataset.
Effective surface deformation measurements could not be retrieved in several mountainous areas, including the Laji Mountain, Jishi Mountain, and branches of the West Qinling Mountains, due to severe decorrelation caused by dense vegetation or perennial snow cover (Figure 5a,b). The lithology in these areas primarily comprises stable Precambrian metamorphic rocks and gneisses, as well as Paleozoic limestones and shales, and Mesozoic–Cenozoic igneous and intrusive rocks. The rock mass structure is stable, resulting in an overall low landslide susceptibility; consequently, these areas were excluded from further analysis. Significant topography-correlated atmospheric delay errors are evident in Zones II and III. Although various correction methods were applied, including linear [50], numerical weather [51], and GACOS models [52], they failed to effectively mitigate these errors, likely due to the extreme local topographic complexity. Similar challenges have been documented in previous studies of this region [53,54,55]. Given that the affected area accounts for only 2.5% of the total study area and is characterized by low-susceptibility rocky terrain, potential landslides therein are not discussed in this study.
4.1.2. Accuracy Assessment
Due to the inherent difficulty in directly determining the direction and dip angle of slope movement, it is challenging to project ascending and descending LOS deformations onto a common datum for direct comparison. To address this, this study assumes that flat areas with slopes less than 5° undergo predominantly vertical deformation [56,57]. Such areas were selected as validation targets. Within these areas, the LOS deformation from both ascending and descending was projected onto the vertical direction for cross-validation, thereby assessing the consistency and reliability of the SBAS-InSAR monitoring results.
As shown in Figure 7, the Jishi Mountain region is characterized by steep terrain and complex topography. Flat areas, which account for approximately 10% of the total study area, are primarily distributed across geomorphological units, including valleys (Region IV), river terraces (Region V), and loess tablelands (Region VI). Within these flat areas, approximately 2 million common pixels, monitored by both ascending and descending InSAR, were identified. The mean and standard deviation of the differences in the absolute vertical deformation between the two tracks were calculated to be 3 mm/yr and 2 mm/yr, respectively (Figure 8). The error distribution histogram follows a Gaussian pattern, with a correlation coefficient (R2) of 0.98. These results indicate good consistency and reliability between the ascending and descending SBAS-InSAR monitoring results, further validating the effectiveness of the methodology.
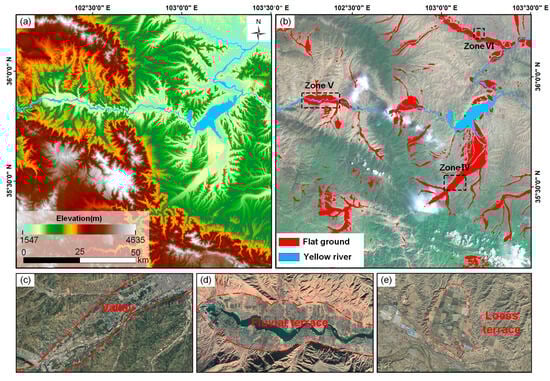
Figure 7.
(a) Topographic map of the study area; (b) distribution map of flat terrain in the study area; (c) flat area: valley (Region IV); (d) flat area: river terrace (Region V); and (e) flat area: loess tableland (Region VI).
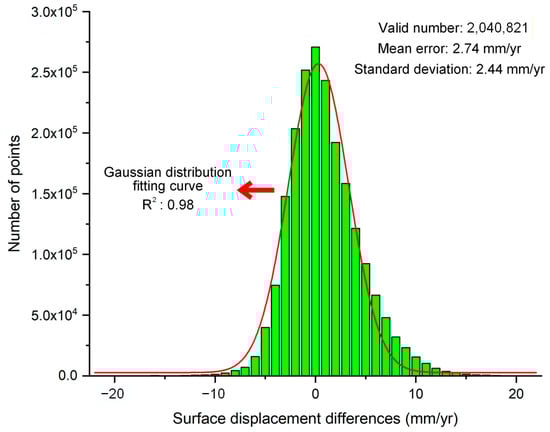
Figure 8.
Statistical distribution histogram of the vertical absolute deformation velocity difference between ascending and descending SBAS-InSAR results.
4.2. Active Landslide Inventory
4.2.1. Analysis of Active Landslide Identification Results
Figure 9 compares optical remote sensing images of typical landslides identified via the SBAS-InSAR technique with their corresponding deformation velocity maps, obtained from ascending and descending InSAR data. The boundaries of the active landslides, as delineated by the InSAR surface deformation rates, exhibit strong consistency with those interpreted from the optical imagery. This agreement further validates the reliability of the SBAS-InSAR deformation monitoring results. The five landslides in Figure 9(a-2)–(e-2),(a-3)–(e-3) are clearly detected in both the ascending and descending deformation velocity maps. In contrast, the two landslides in Figure 9(f-2)–(g-2),(f-3)–(g-3) are only detected in a single track (ascending and descending, respectively). This contrast highlights the need to integrate multi-track InSAR observations to mitigate the geometric distortions inherent to side-looking SAR geometry in mountainous terrain, thereby enhancing landslide detection completeness.

Figure 9.
SBAS-InSAR deformation velocity maps of typical landslides. Red arrows in the first column indicate the sliding directions of the landslides. (a-1)–(g-1) Optical images of the landslides; (a-2)–(g-2) surface deformation velocity maps (ascending); and (a-3)–(g-3) surface deformation velocity maps (descending).
Moreover, some landslides (e.g., Figure 9c-3) exhibited spatially discontinuous deformation signals, increasing their risk of being overlooked during regional InSAR-based identification. This omission is primarily due to two factors. First, SAR image coherence can vary significantly across different acquisition tracks [58]. Consequently, applying a uniform coherence threshold during processing may inadvertently mask or remove these low-coherence areas. Second, differences in incidence angles between tracks introduce local geometric distortions (e.g., shadow and layover), which degrade both coherence and integrity of the deformation signal [59].
4.2.2. Active Landslide Distribution Inventory
This study systematically identified and cataloged active landslides in the Jishi Mountain region by integrating ascending and descending surface deformation velocity results derived from SBAS-InSAR, DEM data, and multi-temporal optical remote sensing imagery. The specific technical workflow is as follows: (1) LOS surface deformation maps were generated from ascending and descending SAR imagery to preliminarily identify deformation areas. Slope and aspect information were extracted from the DEM and combined with SAR imaging geometry to produce geometric distortion maps and C-Index maps. Concurrently, the morphological features of landslides, such as scarps, cracks, and bulges were extracted using optical remote sensing imagery. (2) Criteria were established to classify areas with slopes greater than 5° and absolute LOS deformation rates greater than 10 mm/yr as suspected deformation zones. Misclassified pixels located within shadow and layover areas were subsequently removed, and deformation areas where the deformation direction was inconsistent with the sign of the C-Index were excluded. (3) By integrating the landslide boundaries identified in the optical imagery, unreliable identifications were filtered out, ultimately yielding a reliable active landslide inventory.
- Geometric Distortion
This study employed the R-Index [39] to identify terrain-induced geometric distortion (active shadow, active layover, and foreshortening), while utilizing the hillshade model [40] to identify passive geometric distortion (passive layover and passive shadow) influenced by adjacent slopes. Integrating the heading angles and incidence angles of the ascending and descending Sentinel-1 imagery with the slope and aspect information derived from the DEM, geometric distortion distribution maps for the Jishi Mountain region were generated (Figure 10).
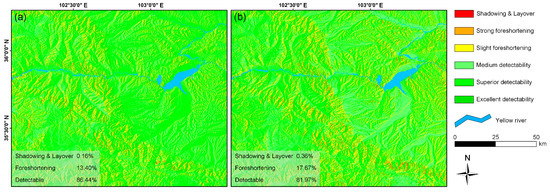
Figure 10.
Geometric distortion maps of SAR imagery in the Jishi Mountain region. (a) Ascending; (b) descending.
The results indicate that for the ascending Sentinel-1 data, the effective observation area (including areas with slight foreshortening and medium to high visibility) accounts for approximately 86.4% of the study area. Areas of strong foreshortening constitute about 13.4%, while shadow and layover areas account for merely 0.2%, with distortions primarily distributed on west-facing slopes. For the descending track data, the effective observation area accounts for approximately 82%, strong foreshortening areas for about 17.6%, and shadow and layover areas for about 0.4%, with distortions mostly concentrated on east-facing slopes. After combining the ascending and descending track data, the coverage of the effective observation area increased to 91.3%, demonstrating the complementary advantages of multi-track observations in complex terrain. Although strong foreshortening can reduce the accuracy of deformation measurements and obscure landslide boundaries, it does not significantly compromise the detectability of landslide deformation signals [60]. Consequently, in compiling the landslide inventory, only shadow and layover areas were masked and excluded.
- C-Index
Figure 11 shows the spatial distribution of the C-Index for the ascending and descending Sentinel-1 imagery over the Jishi Mountain region. Taking the Lashagou slope as an example, based on its aspect and the SAR imaging geometry, the LOS deformation in this region should theoretically be negative (indicating movement away from the satellite) in the ascending imagery and positive (indicating movement towards the satellite) in the descending imagery. Suppose the observed deformation direction in a suspected deformation area contradicts the direction predicted by the C-Index. In that case, the signal may originate from interfering factors such as geometric distortion, phase unwrapping errors, or atmospheric delays. Such areas are consequently excluded from the final active landslide inventory.
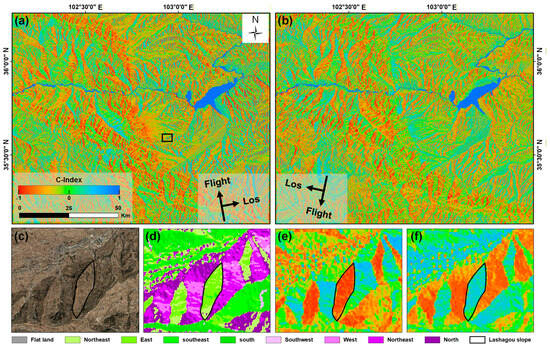
Figure 11.
C-Index maps of the Jishi Mountain region. (a) C-Index map (ascending); (b) C-Index map (descending); (c) optical image of the Lashagou slope; (d) aspect map of the Lashagou slope; (e) Sentinel-1 ascending C-Index map of the Lashagou slope; and (f) Sentinel-1 descending C-Index map of the Lashagou slope.
- Active Landslide Distribution Inventory
Based on the aforementioned technical flow for active landslide identification and inventory compilation, this study established an inventory map of active landslide distribution for the Jishi Mountain region (Figure 12). A total of 530 active landslides were identified using the SBAS-InSAR technique. Among these, 378 landslides (red and purple) were detected by the ascending data, and 306 (blue and purple) by the descending data, with 154 landslides (purple) detected by both tracks. Furthermore, 26 loess tableland subsidence areas (yellow) were identified by both ascending and descending. This subsidence phenomenon is primarily caused by the settlement of collapsible loess induced by agricultural irrigation, particularly flood irrigation [30,31].
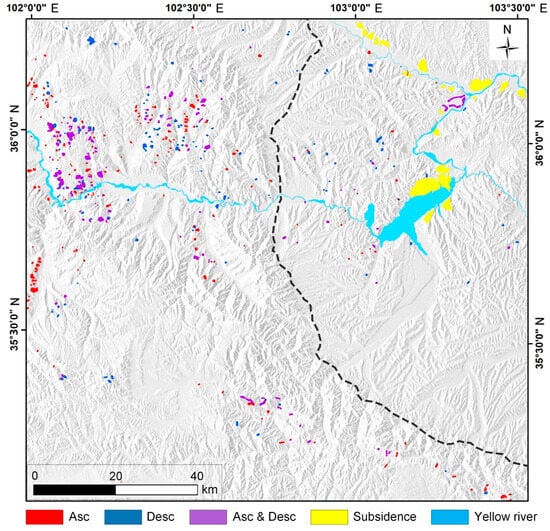
Figure 12.
Active landslide inventory map of the Jishi Mountain region derived from SBAS-InSAR.
Spatially, the study area is divided into the Tibetan Plateau and Loess Plateau regions by the black dashed line in Figure 12. Approximately 87% of the identified active landslides are located within the western Tibetan Plateau region. This distribution disparity is attributed to intense tectonic activity in the region and is further correlated with the scale of the landslides. Previous studies indicate that large to giant landslides are prevalent between the Lagan and Sigou gorges in the upper Yellow River [49]. In contrast, the Loess Plateau region is dominated by small to medium-sized landslides [61]. Due to the spatial resolution of the InSAR deformation maps (approximately 40 m), this study was unable to reliably detect landslides with spatial extents smaller than 200 m. Consequently, the number of landslides identified in the Tibetan Plateau region significantly exceeds that in the Loess Plateau region.
4.3. Two-Dimensional Deformation of a Typical Landslide
The Lashagou landslide, situated in the central Jishi Mountain region, is a characteristic example of landslides induced by highway construction. Its formation is primarily attributed to cut-slope excavation during the construction of the G310 highway between 2011 and 2013 [43,62,63]. To investigate its movement mechanism in greater detail, this study utilized ascending and descending Sentinel-1 SAR data, building upon prior studies. The 2D deformation field of the landslide—comprising sliding-direction and normal-direction displacements—was retrieved using an inversion method based on the local parallel flow model [43] (Figure 13). Cross-validation with GNSS measurements revealed strong agreement in both the geometric movement parameters (mean absolute error (MAE) < 3.07°) and the time-series displacements (e.g., MAE < 2.35 mm for BZ02; see Figure 13d,e), collectively demonstrating the high reliability of the 2D deformation inversion method. The results indicate that the landslide undergoes significant eastward and downward movement. The maximum sliding direction displacement reaches 55.4 mm/yr, whereas the maximum normal direction displacement is −10.4 mm/yr. The displacement in the frontal section is significantly greater than in the rear section, displaying characteristics typical of a retrogressive landslide. This high-precision 2D deformation field clearly delineates differential movement across landslide sections, providing a reliable basis for the subsequent kinematic classification of landslides. For detailed methodology and validation, refer to our previous study [63].
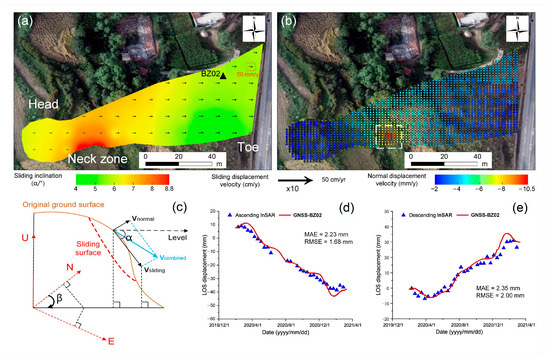
Figure 13.
Two-dimension deformation field of Lashagou landslide and validation with GNSS data. (a) Sliding direction displacement and dip angle, where colors represent variations in the sliding dip angle, black arrows indicate the direction and magnitude of the horizontal projection of the sliding vector, and the black triangle marks the location of GNSS station BZ02; (b) normal direction displacement; and (c) schematic diagram of the geometric decomposition of the 2D displacement vector [63]; (d,e) time-series comparison of LOS displacements from ascending and descending InSAR with GNSS station BZ02 [43].
4.4. Landslides Classification
Following the successful validation of the 2D deformation inversion method (Section 4.3), it was applied to all landslides detected in both ascending and descending tracks to classify their movement patterns. Based on an analysis of the spatial variation in sliding- and normal direction displacement vectors, integrated with topographic and geomorphological interpretation, 154 active landslides in the Jishi Mountain region were remotely classified. The classification results reveal the presence of 31 retrogressive translational, 66 progressive translational, 19 rotational, 24 composite, and 14 earthflow landslides in the study area. The characteristic features of these five dominant landslide types are detailed below.
- Retrogressive Translational Landslides
Retrogressive translational landslides are characterized by displacement dominated by the sliding direction, with normal direction displacement primarily concentrated in the frontal section. The rear section undergoes integral retrogressive sliding along a basal sliding surface. Landslide #1 is presented as a representative case of this type.
Landslide #1 measures approximately 900 m in length, 370 m in width, and covers an area of about 0.29 km2. As shown in Figure 14b,c, this landslide is characterized by a dominant sliding direction displacement, with a magnitude approximately 2.5 times greater than that of the normal direction displacement. The sliding direction displacement increases gradually from the rear to the front, reaching a maximum of 84 mm/yr. In contrast, the normal direction displacement is concentrated in the frontal part, with a maximum of approximately 35 mm/yr. Furthermore, the landslide front exhibits intensive tensile cracks and steps caused by the vertical dislocation of local blocks (Figure 14a). The integration of InSAR-derived sliding and normal direction movement characteristics with geomorphological features interpreted from optical remote sensing imagery confirms that Landslide #1 is a retrogressive translational landslide.
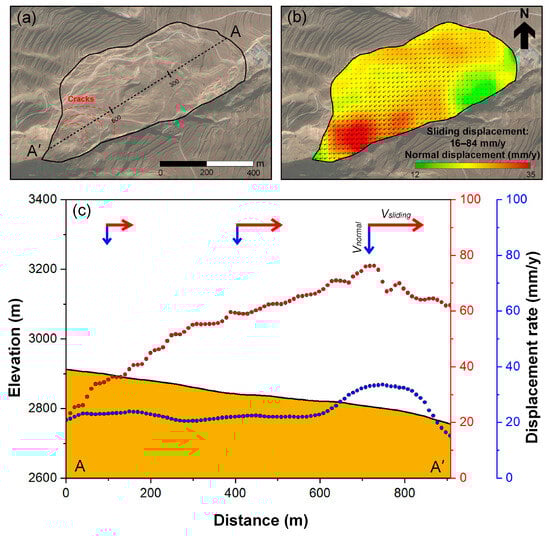
Figure 14.
Two-dimension displacement and geomorphological characteristics of a retrogressive translational landslide. (a) Geomorphological features; (b) sliding direction and normal direction displacement characteristics; and (c) spatial variation in 2D displacement along the profile.
- Progressive Translational Landslides
Progressive translational landslides are characterized by displacement dominated by the sliding direction, with normal direction displacement primarily concentrated in the rear section. This driving force propels the frontal section to slide integrally along a basal sliding surface. Landslide #2 is presented as a representative example of this type.
Landslide #2 measures approximately 620 m in length, 400 m in width, and covers an area of about 0.2 km2. As shown in Figure 15b,c, the rear section of Landslide #2 is particularly active, exhibiting an average deformation magnitude approximately ten times greater than that of the frontal section. Both sliding and normal direction displacements decrease from the rear to the front, with the sliding direction displacement being the dominant one. The integration of InSAR-derived kinematic characteristics indicates that Landslide #2, pushed from the rear, undergoes integral sliding under the influence of gravity, confirming its classification as a progressive translational landslide. Notably, optical remote sensing imagery reveals no distinct geomorphological features such as obvious cracks, scarps, or steps, rendering direct identification of the landslide type difficult. This case highlights the advantage of utilizing InSAR-derived 2D displacement fields to reveal kinematic characteristics for non-contact landslide classification.
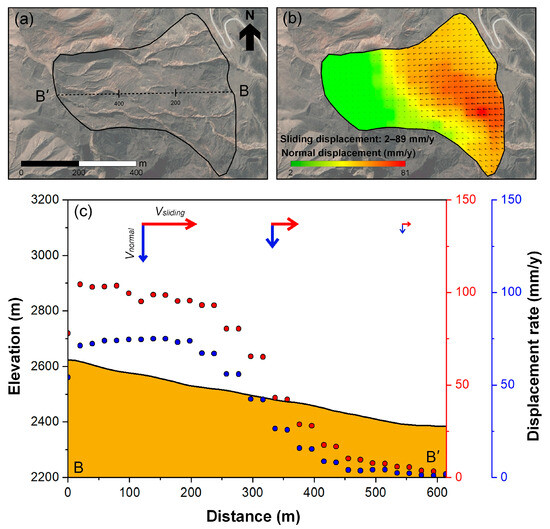
Figure 15.
Two-dimensional displacement and geomorphological characteristics of a progressive translational landslide. (a) Geomorphological features; (b) sliding direction and normal direction displacement characteristics; and (c) spatial variation in 2D displacement along the profile.
- Rotational Landslides
The movement characteristics of rotational landslides are primarily manifested by normal direction displacement at the rear and sliding direction displacement at the front, resulting in overall sliding along a curved basal sliding surface. Landslide #3 serves as a representative case of this type.
Landslide #3 measures approximately 1650 m in length, 1100 m in width, and covers an area of about 1.68 km2. As shown in Figure 16b,c, the rear section of the landslide is dominated by normal direction displacement, with an average magnitude approximately twice that of the sliding direction displacement. In contrast, the frontal section is dominated by sliding direction displacement, averaging about four times the magnitude of the normal direction displacement. Downslope, the normal direction displacement gradually decreases while the sliding direction displacement increases, achieving a balance approximately 800 m from the rear scarp. Furthermore, the rear scarp exhibits a steep slope with a height difference of approximately 20 m, and a distinct bulging toe is evident in the middle section (Figure 16a). The bulging toe forms due to compression and soil accumulation from the rear section as the sliding mass enters flatter terrain, serving as a key geomorphological indicator for rotational landslides. The integration of InSAR-derived movement characteristics with geomorphological features from optical imagery confirms the classification of Landslide #3 as a rotational landslide.
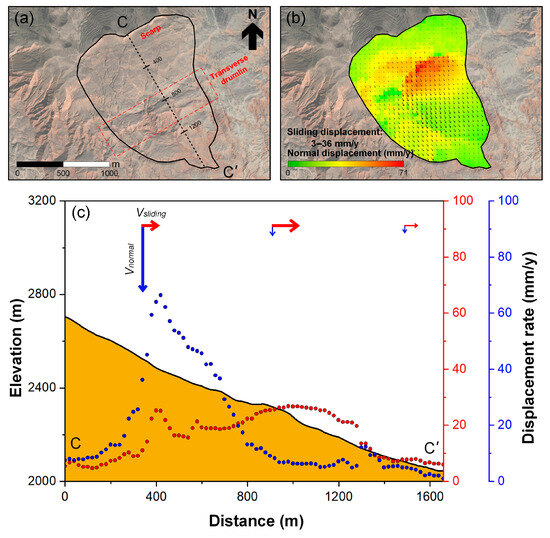
Figure 16.
Two-dimensional displacement and geomorphological characteristics of a rotational landslide. (a) Geomorphological features; (b) sliding direction and normal direction displacement characteristics; and (c) spatial variation in 2D displacement along the profile.
- Composite Landslides
Composite landslides incorporate movement characteristics of multiple landslide types. Landslide #4 is presented as a representative example.
Landslide #4 measures approximately 2000 m in length, 420 m in width, and covers an area of about 0.68 km2. As shown in Figure 17b,c, displacements in both the sliding and normal directions gradually increase from the rear to approximately 900 m downslope, exhibiting a typical retrogressive movement pattern. From the 900 m point to the front, both displacement components decrease gradually, exhibiting characteristics of a progressive movement pattern. Additionally, the middle section of the landslide exhibits numerous tensile cracks, whereas the rear and frontal sections show fewer cracks (Figure 17a). The integration of InSAR-derived movement characteristics with the geomorphological structure interpreted from optical imagery confirms the classification of Landslide #4 as a composite landslide. Its movement mechanism involves the middle section pushing the frontal area while simultaneously pulling the rear section, resulting in integral sliding.
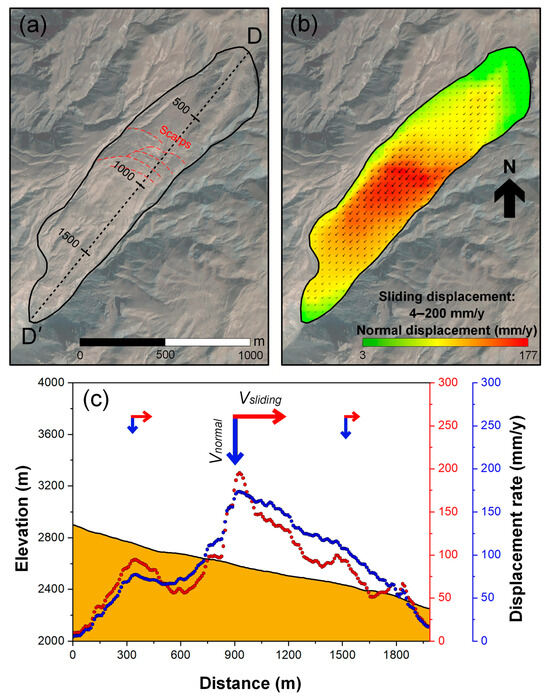
Figure 17.
Two-dimension displacement and geomorphological characteristics of a complex landslide. (a) Geomorphological features; (b) sliding direction and normal direction displacement characteristics; and (c) spatial variation in 2D displacement along the profile.
- Earthflows
Earthflows are characterized by overwhelmingly dominant sliding direction displacement, with minimal spatial variation in the normal direction component. Landslide #5 serves as a representative example of this type.
Landslide #5 measures approximately 2800 m in length and 350 m in average width, covering an area of about 0.84 km2. As shown in Figure 18b,c, Landslide #5 is predominantly characterized by sliding direction displacement, with an average magnitude approximately twice that of the normal direction displacement. The earthflow moves relatively slowly, exhibiting fluid-like behavior of the soil mass. The maximum sliding direction displacement is approximately 79 mm/yr, and the maximum normal direction displacement is about 37 mm/yr. The narrow middle section (approximately 1200~2000 m from the rear) features a steeper slope, which accelerates the flow velocity and directly causes the failure of a retaining wall. Furthermore, deep shear cracks along both sides of the middle section form distinct flow bands (Figure 18a). As the soil mass enters the wide, gentle frontal area, its flow velocity gradually decreases. The integration of InSAR-derived kinematic characteristics with geomorphological features from optical imagery confirms that Landslide #5 is classified as an earthflow.
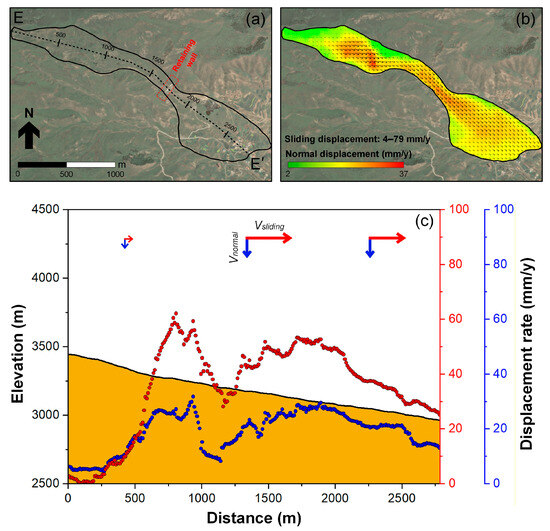
Figure 18.
Two-dimensional displacement and geomorphological characteristics of a complex landslide. (a) Geomorphological features; (b) sliding direction and normal direction displacement characteristics; and (c) spatial variation in 2D displacement along the profile.
Regarding the reliability of classification using InSAR-derived parameters alone, our framework demonstrates that a primary classification can be achieved based on the spatial patterns of the 2D deformation fields ( and ). Key discriminators include the ratio and the spatial concentration of (head vs. toe). However, for robust and accurate classification, integration with geomorphological features from high-resolution optical imagery is considered essential. This synergy is particularly critical for distinguishing between rotational and composite landslides, as their InSAR deformation patterns can be similar, both exhibiting significant at the head and at the toe. In such cases, optical imagery provides critical evidence, such as the presence of a continuous arcuate scarp and a bulging toe for rotational slides, which may be absent or more complex in composite ones. To synthesize the diagnostic criteria and provide a clear guideline for application, Table 3 summarizes the characteristic InSAR signatures and the supporting role of optical imagery for each movement pattern.
Table 3.
Diagnostic guide for landslide movement pattern classification based on InSAR-derived 2D deformation fields and optical imagery.
To explicitly validate the proposed classification system and address its inherent subjectivity, we conducted a statistical review of the interpretation process for the 154 landslides. The vast majority (~90%) exhibited clear and diagnostic characteristics in both the 2D deformation fields and optical imagery, allowing for straightforward and confident classification. A smaller subset (~10%) presented ambiguous or hybrid characteristics that required careful manual interpretation and consensus among multiple authors. These challenging cases were predominantly classified as composite landslides, as their deformation patterns and geomorphology integrated features of multiple types (e.g., exhibiting both retrogressive and progressive movement patterns within a single slope). This analysis confirms that while our framework is highly effective for most landslides, the integration of multi-source data and expert judgment remains crucial for handling complex cases. Looking forward, machine learning techniques trained on the quantitative parameters derived from our 2D deformation fields (e.g., ratios, spatial displacement gradients) could be employed to quantify classification confidence and further minimize subjectivity in future large-scale applications.
The development of this non-contact classification system for landslide movement patterns carries substantial implications for both theoretical research and hazard management. From an academic standpoint, the method advances landslide analysis beyond qualitative geomorphic interpretation by introducing a quantifiable framework based on 2D deformation fields. This enables a more mechanistic understanding of kinematic behavior and evolutionary pathways across diverse landslide types, thereby refining theoretical models of slope failure in complex terrains. From a practical perspective, the classification output directly supports differentiated risk assessment and informs targeted mitigation strategies. For instance, identifying a retrogressive translational landslide prioritizes intervention at the toe, whereas a progressive type necessitates scrutiny of the crown area. Rotational failures, marked by substantial subsidence at the crown and pronounced bulging at the toe, call for holistic slope stability evaluation. Earthflows require monitoring of their protracted, flow-like deformation potential, and composite landslides demand integrated approaches due to their combined failure mechanisms. This capacity to discern distinct movement mechanisms is especially critical for proactive risk management in remote or inaccessible mountainous regions.
5. Discussion
5.1. Sensitivity and Condition Number
To ensure the reliability of the 2D deformation inversion method, we have systematically analyzed its error propagation characteristics in our previous study [63]. Since the satellite heading and incidence angles can be precisely obtained from the metadata files and remain essentially constant even in complex mountainous terrain, the primary uncertainties originate from the extraction errors of landslide geometric parameters (slope and aspect, corresponding to the dip angle and sliding direction of the sliding surface). Our analysis demonstrates that when slope and aspect contain ±5% errors, the resulting errors in the inverted sliding-direction and normal-direction displacements are less than 2% and 3%, respectively, confirming the robustness of our method against parameter uncertainties.
To further complement the error propagation analysis and directly assess the numerical stability of the inversion system (Equations (2) and (3)), we calculated the condition number of the inversion matrix at the pixel scale for the entire landslide. The statistics of the condition number are presented in Figure 19. The results show that the system is well-conditioned over the vast majority of the landslide body, which is consistent with the low error propagation rates noted above. The few outliers with relatively high condition numbers are primarily located in areas with extremely steep local topography or where there are abrupt changes in the landslide’s geometric parameters. In these specific locations, the similarity between the observation equations increases, potentially leading to a less stable solution. However, these areas are spatially limited and do not compromise the overall reliability and stability of the inversion results for the landslide as a whole.
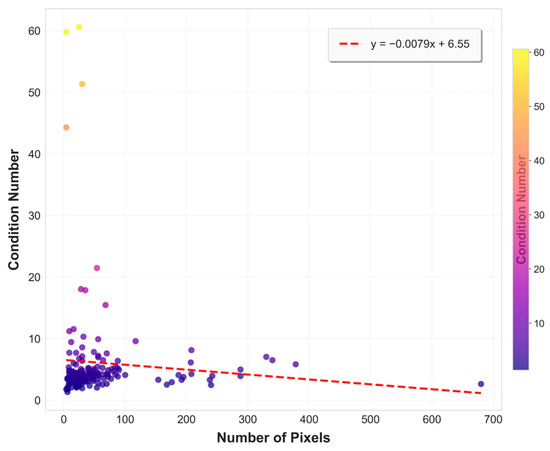
Figure 19.
Scatter plot of landslide condition number statistic.
5.2. Applicability and Limitations of the Local Parallel Flow Model
The local parallel flow model utilized in this study, which assumes landslide movement parallel to a topography-aligned basal surface, demonstrates high efficacy in the Jishi Mountain area. Here, most landslides are translational or composite types within weathered or unconsolidated materials, where failure surfaces typically develop parallel to the slope due to gravitational stress and material homogeneity. The model’s principal strength lies in providing a non-contact, mathematically robust method to retrieve key kinematic parameters—sliding direction and dip—without relying on potentially erroneous DEM-derived assumptions.
However, the model’s core assumption is prone to violation in complex geological environments. In deep-seated rock slides controlled by structural discontinuities (e.g., joints, bedding planes, or faults) non-parallel to the slope, or in multi-layered failures with contrasting rheologies, the actual sliding geometry may significantly deviate from topography. A steeper failure surface would cause overestimation of normal displacement and underestimation of sliding displacement, and vice versa for a shallower surface. Furthermore, the model cannot accurately represent non-planar or rotational failure mechanisms. While integration with geomorphological features (Section 3.5) helps identify such anomalies, caution is advised when applying this method in strongly fractured bedrock or areas with complex subsurface structures. In such settings, validation using geophysical data or drilling is strongly recommended.
5.3. Regional Validation of Landslide Kinematics
To address the need for regional-scale validation beyond the GNSS-verified Lashagou landslide, we implemented a correlation-based assessment across all 154 landslides identified in both ascending and descending tracks. This approach evaluates the consistency between observed InSAR displacements and simulated displacements based on slope-parallel movement assumptions [42]. The validation results demonstrate strong regional reliability of our 2D deformation inversion method, with 90 landslides (58.4%) exhibiting strong correlations (|r| > 0.5) in at least one acquisition geometry. The overall mean relative RMS of 3.74 further confirms the method’s accuracy, with 78.6% of landslides showing values below 3.0.
The correlation analysis reveals diverse landslide kinematics across the study area. Strong positive correlations (r > 0.5) were observed in 33 landslides for the descending track and 53 landslides for the ascending track, indicating good agreement with slope-parallel movement assumptions. Conversely, 30 landslides exhibited strong negative correlations (r < −0.5) in at least one track, suggesting complex movement mechanisms that deviate from simple slope-parallel motion. These variations likely reflect the diverse landslide types identified in our classification scheme and highlight the method’s ability to capture the full spectrum of landslide behaviors in this complex mountainous region.
6. Conclusions
This study developed a comprehensive technical framework for landslide identification, 2D deformation inversion, and movement pattern classification in the Jishi Mountain region by integrating ascending and descending Sentinel-1 SAR data. The main conclusions are as follows:
- (1)
- The SBAS-InSAR technique proved highly capable of identifying landslides in complex mountainous terrain. Integrating ascending and descending data with geometric distortion masking and C-Index consistency checks effectively mitigated the risks of false and missed identifications. A total of 530 active landslides were identified, 154 of which were detected in both acquisition tracks, providing a robust foundation for subsequent in-depth analysis.
- (2)
- The two-dimensional deformation inversion method, based on the local parallel flow model, overcomes the reliance on DEM-derived prior assumptions. This method only requires InSAR observations from two distinct imaging geometries to successfully retrieve the sliding and normal direction components of landslide deformation, offering a novel approach for analyzing movement mechanisms in complex terrain.
- (3)
- A non-contact landslide classification system was established based on the 2D deformation fields and geomorphological characteristics. The landslides were categorized into five distinct types: retrogressive translational (31), progressive translational (66), rotational (19), composite (24), and earthflows (14). This systematic classification not only reveals the diversity of regional landslide movements but also provides a scientific basis for formulating differentiated mitigation strategies.
In summary, the “Identification–Inversion–Classification” framework presented in this study constitutes a transferable approach for deciphering landslide mechanisms and assessing associated risks in complex mountainous environments. The movement pattern classification system, as its cornerstone, delivers not only fundamental insights into the spectrum of landslide kinematics but also an actionable foundation for devising mechanism-specific early warning and mitigation strategies.
Author Contributions
Conceptualization: Q.F., Y.N. and S.Z.; methodology: X.L. and Q.F.; software: X.L. and Q.F.; validation: X.L., J.S., Z.W. and Z.J.; formal analysis: X.L.; investigation: X.L. and Q.F.; resources: Q.F., Y.N., S.Z., J.Z. and Z.L.; data curation: X.L., J.S., Z.W. and Z.J.; writing—original draft preparation: X.L.; writing—review and editing: Q.F., Y.N. and Z.L.; visualization: X.L. and Q.F.; supervision: Q.F., Y.N., S.Z., J.Z. and Z.L.; funding acquisition: J.Z., Y.N. and Z.L. All authors have read and agreed to the published version of the manuscript.
Funding
This study is supported by the Key Laboratory of National Geographic Census and Monitoring, Ministry of Natural Resources, under grant 2023NGCM12; in part by Hebei Natural Science Foundation of China, under grant D2023402033; in part by National Natural Science Foundation of China, under grant 42307255 and grant 41901286; in part by the Fundamental Research Funds for the Central Universities of China, under the project under grant 2025-KJJC-A03.
Data Availability Statement
The data presented in this study are available on request from the corresponding author.
Conflicts of Interest
The authors declare no conflicts of interest.
References
- Sünnetci, M.O.; Ersoy, H.; Firat, E.A. Numerical and back analysis-based methodology for support design of cut slopes at the Turkish—Georgian Border (NE Turkey). J. Mt. Sci. 2021, 18, 1678–1695. [Google Scholar] [CrossRef]
- Pradhan, S.; Toll, D.G.; Rosser, N.J.; Brain, M.J. An investigation of the combined effect of rainfall and road cut on landsliding. Eng. Geol. 2022, 307, 106787. [Google Scholar] [CrossRef]
- Zhang, J.; Lu, M.; Zhang, L.; Xue, Y. Assessing indirect economic losses of landslides along highways. Nat. Hazards 2021, 106, 2775–2796. [Google Scholar] [CrossRef]
- Segoni, S.; Piciullo, L.; Gariano, S.L. A review of the recent literature on rainfall thresholds for landslide occurrence. Landslides 2018, 15, 1483–1501. [Google Scholar] [CrossRef]
- Intrieri, E.; Raspini, F.; Fumagalli, A.; Lu, P.; Conte, S.D.; Farina, P.; Ferretti, A.; Casagli, N. The Maoxian landslide as seen from space: Detecting precursors of failure with Sentinel-1 data. Landslides 2018, 15, 123–133. [Google Scholar] [CrossRef]
- Fuhrmann, T.; Garthwaite, M.C. Resolving three-dimensional surface motion with InSAR: Constraints from multi-geometry data fusion. Remote Sens. 2019, 11, 241. [Google Scholar] [CrossRef]
- Shi, X.; Zhang, L.; Zhou, C.; Li, M.; Liao, M. Retrieval of time series three-dimensional landslide surface displacements from multi-angular SAR observations. Landslides 2018, 15, 1015–1027. [Google Scholar] [CrossRef]
- Delbridge, B.G.; Bürgmann, R.; Fielding, E.; Hensley, S.; Schulz, W.H. Three-dimensional surface deformation derived from airborne interferometric UAVSAR: Application to the Slumgullion Landslide. J. Geophys. Res. Solid Earth 2016, 121, 3951–3977. [Google Scholar] [CrossRef]
- Hu, C.; Deng, Y.; Tian, W.; Zhao, Z. Optimal geometry to resolve 3D deformation from multiple GB-DInRad. Electron. Lett. 2019, 55, 953–955. [Google Scholar] [CrossRef]
- Zeng, T.; Mao, C.; Hu, C.; Yang, X.; Tian, W. Multi-static MIMO-SAR three dimensional deformation measurement system. In Proceedings of the 2015 IEEE 5th Asia-Pacific Conference on Synthetic Aperture Radar (APSAR), Singapore, 1–4 September 2015; pp. 297–301. [Google Scholar] [CrossRef]
- Li, Y.; Jiao, Q.; Hu, X.; Li, Z.; Li, B.; Zhang, J.; Jiang, W.; Luo, Y.; Li, Q.; Ba, R. Detecting the slope movement after the 2018 Baige Landslides based on ground-based and space-borne radar observations. Int. J. Appl. Earth Obs. Geoinf. 2020, 84, 101949. [Google Scholar] [CrossRef]
- Handwerger, A.L.; Booth, A.M.; Huang, M.H.; Fielding, E.J. Inferring the subsurface geometry and strength of slow-moving landslides using 3-D velocity measurements from the NASA/JPL UAVSAR. J. Geophys. Res. Earth Surf. 2021, 126, e2020JF005898. [Google Scholar] [CrossRef]
- Raucoules, D.; Michele, M.D.; Malet, J.P.; Ulrich, P. Time-variable 3D ground displacements from high-resolution synthetic aperture radar (SAR). Application to La Valette landslide (South French Alps). Remote Sens. Environ. 2013, 139, 198–204. [Google Scholar] [CrossRef]
- Eriksen, H.Ø.; Lauknes, T.R.; Larsen, Y.; Corner, G.D.; Bergh, S.G.; Dehls, J.; Kierulf, H.P. Visualizing and interpreting surface displacement patterns on unstable slopes using multi-geometry satellite SAR interferometry (2D InSAR). Remote Sens. Environ. 2017, 191, 297–312. [Google Scholar] [CrossRef]
- Gu, X.; Li, Y.; Zuo, X.; Huang, C.; Xing, M.; Ruan, Z.; Yu, Y.; Shi, C.; Xiao, J.; Zou, Q. Analysis of geometric distortion in sentinel-1 images and multi-dimensional spatiotemporal evolution characteristics of surface deformation along the central Yyunnan water diversion project. Remote Sens. 2025, 17, 3250. [Google Scholar] [CrossRef]
- Frattini, P.; Crosta, G.B.; Rossini, M.; Allievi, J. Activity and kinematic behaviour of deep-seated landslides from PS-InSAR displacement rate measurements. Landslides 2018, 15, 1053–1070. [Google Scholar] [CrossRef]
- Liu, X.; Zhao, C.; Zhang, Q.; Yin, Y.; Lu, Z.; Samsonov, S.; Yang, C.; Wang, M.; Tomás, R. Three-dimensional and long-term landslide displacement estimation by fusing C-and L-band SAR observations: A case study in Gongjue County, Tibet, China. Remote Sens. Environ. 2021, 267, 112745. [Google Scholar] [CrossRef]
- Cascini, L.; Fornaro, G.; Peduto, D. Advanced low-and full-resolution DInSAR map generation for slow-moving landslide analysis at different scales. Eng. Geol. 2010, 112, 29–42. [Google Scholar] [CrossRef]
- Qarinur, M. Landslide runout distance prediction based on mechanism and cause of soil or rock mass movement. J. Civ. Eng. Forum 2015, 1, 29–36. [Google Scholar] [CrossRef]
- Xia, W.; Chen, J.; Liu, J.; Ma, C.; Liu, W. Landslide extraction from high-resolution remote sensing imagery using fully convolutional spectral–topographic fusion network. Remote Sens. 2021, 13, 5116. [Google Scholar] [CrossRef]
- McCann, D.M.; Forster, A. Reconnaissance geophysical methods in landslide investigations. Eng. Geol. 1990, 29, 59–78. [Google Scholar] [CrossRef]
- Meng, Q.; Confuorto, P.; Peng, Y.; Raspini, F.; Bianchini, S.; Han, S.; Liu, H.; Casagli, N. Regional recognition and classification of active loess landslides using two-dimensional deformation derived from Sentinel-1 interferometric radar data. Remote Sens. 2020, 12, 1541. [Google Scholar] [CrossRef]
- Zhu, Y.; Yao, X.; Yao, C.; Zhou, Z.; Gu, Z.; Yao, L. Integration of vertical and horizontal deformation derived by SAR observation for identifying landslide motion patterns in a basaltic weathered crust region of Guizhou, China. Remote Sens. 2022, 14, 4014. [Google Scholar] [CrossRef]
- Ren, J.; Yang, W.; Ma, Z.; Li, W.; Zeng, S.; Fu, H.; Wen, Y.; He, J. Remote Sensing-Based Detection and Analysis of Slow-Moving Landslides in Aba Prefecture, Southwest China. Remote Sens. 2025, 17, 1462. [Google Scholar] [CrossRef]
- Huang, F.; Yan, J.; Fan, X.; Yao, C.; Huang, J.; Chen, W.; Hong, H. Uncertainty pattern in landslide susceptibility prediction modelling: Effects of different landslide boundaries and spatial shape expressions. Geosci. Front. 2022, 13, 101317. [Google Scholar] [CrossRef]
- Wang, K.; Han, L.; Liao, J. A study of high-resolution remote sensing image landslide detection with optimized anchor boxes and edge enhancement. Eur. J. Remote Sens. 2024, 57, 2289616. [Google Scholar] [CrossRef]
- Zhang, C.; Luo, J.; Li, Z. An Automatic Detection Method of Slow-Moving Landslides Using an Improved Faster R-CNN Model Based on InSAR Deformation Rates. Remote Sens. 2025, 17, 3243. [Google Scholar] [CrossRef]
- Zhang, Z.; Chen, S.; Tao, L. 1983 Sale Mountain landslide, Gansu Province, China. In Catastrophic Landslides: Effects, Occurrence, and Mechanisms; Geological Society of America: Boulder, CO, USA, 2002. [Google Scholar] [CrossRef]
- Yang, D.; Qiu, H.; Zhu, Y.; Liu, Z.; Pei, Y.; Ma, S.; Du, C.; Sun, H.; Liu, Y.; Cao, M. Landslide characteristics and evolution: What we can learn from three adjacent landslides. Remote Sens. 2021, 13, 4579. [Google Scholar] [CrossRef]
- Xu, H.; Shu, B.; Zhang, Q.; Xiong, G.; Wang, L. Combining InSAR and Time-Series clustering to reveal deformation patterns of the Heifangtai loess terrace. Remote Sens. 2025, 17, 429. [Google Scholar] [CrossRef]
- Zhang, F.; Wang, G. Effect of irrigation-induced densification on the post-failure behavior of loess flowslides occurring on the Heifangtai area, Gansu, China. Eng. Geol. 2018, 236, 111–118. [Google Scholar] [CrossRef]
- Shi, P.; Liu, F.; Meng, X.; Zhou, Q.; Yu, D.; Chen, Q.; Liu, L.; Fang, W.; Xiao, C.; He, C.; et al. Recent Jishishan earthquake ripple hazard provides a new explanation for the destruction of the prehistoric Lajia Settlement 4000a BP. Sci. Rep. 2024, 14, 11630. [Google Scholar] [CrossRef] [PubMed]
- Huang, Y.; Xu, C.; He, X.; Cheng, J.; Xu, X.; Tian, Y. Landslides induced by the 2023 Jishishan Ms6. 2 earthquake (NW China): Spatial distribution characteristics and implication for the seismogenic fault. npj Nat. Hazards 2025, 2, 14. [Google Scholar] [CrossRef]
- Ma, K.; Liu, Y.; Hu, Q.; Yang, J.; Wang, L. Fault geometry and slip distribution of the 2023 Jishishan earthquake based on sentinel-1A and ALOS-2 data. Remote Sens. 2025, 17, 2310. [Google Scholar] [CrossRef]
- Wang, Y.; Wang, P.; Chang, W.; Wang, H.; Xu, S.; Xu, S.; Yu, H. Hazard assessment of seismic-collapsed loess landslides on the Loess Plateau as exemplified by the M6. 2 earthquake in Jishishan County, China. Front. Earth Sci. 2024, 12, 1402922. [Google Scholar] [CrossRef]
- Saylor, J.E.; Jordan, J.C.; Sundell, K.E.; Wang, X.; Wang, S.; Deng, T. Topographic growth of the Jishi Shan and its impact on basin and hydrology evolution, NE Tibetan Plateau. Basin Res. 2018, 30, 544–563. [Google Scholar] [CrossRef]
- Steinshouer, D.W.; Qiang, J.; McCabe, P.J.; Ryder, R.T. Maps Showing Geology, Oil and Gas Fields, and Geologic Provinces of the Asia Pacific Region; US Geological Survey: Reston, VA, USA, 1999; 16p. [CrossRef]
- Zhang, Y.; Fattahi, H.; Amelung, F. Small baseline InSAR time series analysis: Unwrapping error correction and noise reduction. Comput. Geosci. 2019, 133, 104331. [Google Scholar] [CrossRef]
- Notti, D.; Meisina, C.; Zucca, F.; Colombo, A. Models to predict Persistent Scatterers data distribution and their capacity to register movement along the slope. In Proceedings of the Fringe 2011 Workshop, Frascati, Italy, 19–23 September 2011. [Google Scholar]
- Cigna, F.; Bateson, L.B.; Jordan, C.J.; Dashwood, C. Simulating SAR geometric distortions and predicting Persistent Scatterer densities for ERS-1/2 and ENVISAT C-band SAR and InSAR applications: Nationwide feasibility assessment to monitor the landmass of Great Britain with SAR imagery. Remote Sens. Environ. 2014, 152, 441–466. [Google Scholar] [CrossRef]
- van Natijne, A.L.; Bogaard, T.A.; van Leijen, F.J.; Hanssen, R.F.; Lindenbergh, R.C. World-wide InSAR sensitivity index for landslide deformation tracking. Int. J. Appl. Earth Obs. Geoinf. 2022, 111, 102829. [Google Scholar] [CrossRef]
- Song, C.; Yu, C.; Li, Z.; Pazzi, V.; Soldato, M.D.; Cruz, A.; Utili, S. Landslide geometry and activity in Villa de la Independencia (Bolivia) revealed by InSAR and seismic noise measurements. Landslides 2021, 18, 2721–2737. [Google Scholar] [CrossRef]
- Zhang, S.; Fan, Q.; Niu, Y.; Qiu, S.; Si, J.; Feng, Y.; Zhang, S.; Song, Z.; Li, Z. Two-dimensional deformation monitoring for spatiotemporal evolution and failure mode of Lashagou landslide group, Northwest China. Landslides 2023, 20, 447–459. [Google Scholar] [CrossRef]
- Varnes, D.J. Landslide types and processes. Landslides Eng. Pract. 1958, 24, 20–47. [Google Scholar]
- Hungr, O.; Leroueil, S.; Picarelli, L. The Varnes classification of landslide types, an update. Landslides 2014, 11, 167–194. [Google Scholar] [CrossRef]
- Highland, L.; Johnson, M. Landslide Types and Processes. United States Geological Survey. 2016. Available online: https://pubs.usgs.gov/fs/2004/3072/fs-2004-3072.html (accessed on 25 September 2025).
- Chen, B.; Li, Z.; Song, C.; Yu, C.; Zhu, W.; Liu, Z.; Han, B.; Du, J.; Zhang, C.; Xu, F.; et al. Automatic detection of active geohazards with millimeter-to-meter-scale deformation and quantitative analysis of factors influencing spatial distribution: A case study in the Hexi corridor, China. Int. J. Appl. Earth Obs. Geoinf. 2024, 131, 103995. [Google Scholar] [CrossRef]
- Liu, X.; Zhao, C.; Yin, Y.; Tomás, R.; Zhang, J.; Zhang, Q.; Wei, Y.; Wang, M.; Lopez-Sanchez, J. Refined InSAR method for mapping and classification of active landslides in a high mountain region: Deqin County, southern Tibet Plateau, China. Remote Sens. Environ. 2024, 304, 114030. [Google Scholar] [CrossRef]
- Ji, Y.Q.; Su, S.R.; Simoni, A.; Huang, Q. Giant paleo-landslides in the upper reaches of the Yellow River: Spatio–temporal distribution, and possible controlling factors. J. Palaeogeogr. 2025, 14, 391–412. [Google Scholar] [CrossRef]
- Doin, M.P.; Lasserre, C.; Peltzer, G.; Cavalié, O.; Doubre, C. Corrections of stratified tropospheric delays in SAR interferometry: Validation with global atmospheric models. J. Appl. Geophys. 2009, 69, 35–50. [Google Scholar] [CrossRef]
- Jolivet, R.; Grandin, R.; Lasserre, C.; Doin, M.P.; Peltzer, G. Systematic InSAR tropospheric phase delay corrections from global meteorological reanalysis data. Geophys. Res. Lett. 2011, 38, L17311. [Google Scholar] [CrossRef]
- Yu, C.; Li, Z.; Penna, N.T.; Crippa, P. Generic atmospheric correction model for interferometric synthetic aperture radar observations. J. Geophys. Res. Solid Earth 2018, 123, 9202–9222. [Google Scholar] [CrossRef]
- Du, J.; Li, Z.; Song, C.; Zhu, W.; Ji, Y.; Zhang, C.; Chen, B.; Su, S. InSAR-based active landslide detection and characterization along the upper reaches of the Yellow River. IEEE J. Sel. Top. Appl. Earth Obs. Remote Sens. 2023, 16, 3819–3830. [Google Scholar] [CrossRef]
- Jiang, Z.; Zhao, C.; Liu, X.; Shi, G.; Yan, M.; Zhang, Q.; Peng, J. The regional differentiation on the spatial distribution and influencing factors of potential landslides across the entire Loess Plateau, China based on InSAR and sub-region XGBoost-SHAP model. IEEE J. Sel. Top. Appl. Earth Obs. Remote Sens. 2024, 18, 2024–2041. [Google Scholar] [CrossRef]
- Wei, Y.; Qiu, H.; Liu, Z.; Huangfu, W.; Zhu, Y.; Liu, Y.; Yang, D.; Kamp, U. Refined and dynamic susceptibility assessment of landslides using InSAR and machine learning models. Geosci. Front. 2024, 15, 101890. [Google Scholar] [CrossRef]
- Reinosch, E.; Buckel, J.; Dong, J.; Gerke, M.; Baade, J.; Riedel, B. InSAR time series analysis of seasonal surface displacement dynamics on the Tibetan Plateau. Cryosphere 2020, 14, 1633–1650. [Google Scholar] [CrossRef]
- Li, P.; Wang, H.; Li, H.; Ni, Z.; Deng, H.; Sui, H.; Xu, G. Refined landslide susceptibility mapping considering land use changes and InSAR deformation: A case study of Yulin City, Guangxi. Remote Sens. 2024, 16, 3016. [Google Scholar] [CrossRef]
- Villarroya-Carpio, A.; Lopez-Sanchez, J.M.; Engdahl, M.E. Sentinel-1 interferometric coherence as a vegetation index for agriculture. Remote Sens. Environ. 2022, 280, 113208. [Google Scholar] [CrossRef]
- He, L.; Pei, P.; Zhang, X.; Qi, J.; Cai, J.; Cao, W.; Ding, R.; Mao, Y. Sensitivity evaluation of time series InSAR monitoring results for landslide detection. Remote Sens. 2023, 15, 3906. [Google Scholar] [CrossRef]
- Dai, K.; Tie, Y.; Xu, Q.; Feng, Y.; Zhuo, G.; Shi, X. Early Identification of potential landslide geohazards in alpine-canyon terrain based on SAR interferometry—A case study of the middle section of Yalong River. J. Radars 2020, 9, 554–568. [Google Scholar] [CrossRef]
- Zhuang, J.; Peng, J.; Wang, G.; Javed, I.; Wang, Y.; Li, W. Distribution and characteristics of landslide in Loess Plateau: A case study in Shaanxi province. Eng. Geol. 2018, 236, 89–96. [Google Scholar] [CrossRef]
- Fan, Q.; Zhang, S.; Niu, Y.; Si, J.; Li, X.; Wu, W.; Zeng, X.; Jiang, J. Formative period tracing and driving factors analysis of the Lashagou landslide group in Jishishan County, China. Remote Sens. 2024, 16, 1739. [Google Scholar] [CrossRef]
- Fan, Q.; Zhang, S.; Niu, Y.; Zeng, X.; Si, J.; Li, X.; Wu, W.; Jiang, J.; Qiu, S.; Kang, Y. A non-contact quantitative risk assessment framework for translational highway landslides: Integration of InSAR, geophysical inversion, and numerical simulation. Eng. Geol. 2024, 343, 107818. [Google Scholar] [CrossRef]
Disclaimer/Publisher’s Note: The statements, opinions and data contained in all publications are solely those of the individual author(s) and contributor(s) and not of MDPI and/or the editor(s). MDPI and/or the editor(s) disclaim responsibility for any injury to people or property resulting from any ideas, methods, instructions or products referred to in the content. |
© 2025 by the authors. Licensee MDPI, Basel, Switzerland. This article is an open access article distributed under the terms and conditions of the Creative Commons Attribution (CC BY) license (https://creativecommons.org/licenses/by/4.0/).