Highlights
What are the main findings?
- MT-InSAR results using multi-frequency SAR datasets reveal total surface uplift of approximately 9.2 cm in Gimhae City, South Korea.
- The spatiotemporal features of deformation are strongly related to hydrogeological factors, indicating that groundwater level rise induced surface uplift.
What are the implications of the main findings?
- Analyzing deformation patterns by combining MT-InSAR with hydrogeological data enables the effective inference of subsurface processes.
- A long-term rise in the groundwater level can trigger sustained deformation, with residual displacement persisting even after the groundwater level has stabilized.
Abstract
By altering aquifer storage capacity, groundwater level (GWL) plays a critical role in driving surface deformation, including ground subsidence and uplift. Groundwater depletion can induce sinkholes or subsidence, whereas recharge can cause surface uplift. These processes pose significant risks to soft grounds composed of soft alluvial sediments, emphasizing the importance of regular monitoring. In this study, we applied the small baseline subset (SBAS) technique to conduct a time-series analysis of surface deformation in Gimhae City, South Korea, where a continuous GWL increase was observed. Seasonal trend decomposition using the Loess (STL) method was employed to isolate the long-term GWL trend by removing seasonal variability. Multi-frequency synthetic aperture radar datasets, including ALOS PALSAR, COSMO-SkyMed, and Sentinel-1, revealed a cumulative surface uplift of approximately 9.2 cm, primarily concentrated along the deepest GWL contour line and confined between two lineament structures. The decomposed velocities from Sentinel-1 highlighted the predominance of vertical displacement over horizontal movement. Time-series analyses consistently showed uplift patterns, whereas correlation analysis demonstrated a strong relationship (R2 > 0.75) between surface deformation and GWL changes from 2013 to 2021. These results suggest a significant link between surface uplift and the rising GWL in Gimhae City, providing insights into the hydrogeological processes that influence ground deformation. Furthermore, a time lag between the GWL changes and surface displacement was identified, providing valuable insights into the dynamics of groundwater-related surface deformation.
1. Introduction
Groundwater level (GWL), also referred to as the water table or hydraulic head, is a critical parameter for assessing groundwater presence and storage within an aquifer [1]. Natural factors, such as seasonal precipitation, and anthropogenic activities, including artificial injection and groundwater extraction, influence GWL fluctuations. These fluctuations are not confined to the subsurface and have significant implications for surface deformation (Figure 1). Particularly, variations in the GWL induce volume changes in aquifer systems that manifest as surface deformations [2,3]. Groundwater depletion results in a reduction in pore pressure, leading to land subsidence caused by a decrease in the ability of an aquifer to support the overlying load [4,5]. This phenomenon has been reported globally, prompting numerous studies aimed at mitigating its impacts [6,7,8,9]. Conversely, an increase in the GWL through natural recharge or artificial fluid injection expands the aquifer volume, potentially resulting in surface uplift [10,11,12,13]. These processes highlight the complex relationship between subsurface hydrodynamics and surface deformation, underscoring the importance of understanding GWL variation. Such knowledge is essential for developing effective groundwater management strategies to mitigate environmental risks and promote sustainable water use.
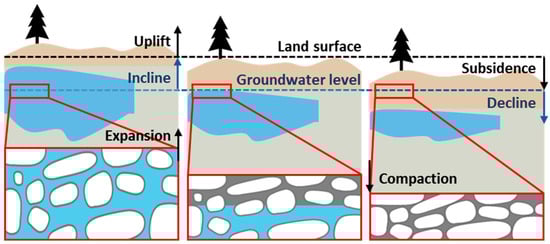
Figure 1.
Schematic illustration of surface deformation caused by groundwater changes.
Terrestrial geodetic surveys, often combined with traditional hydrogeological techniques, such as electrical resistivity or in situ measurements, have been widely employed to investigate surface deformation caused by groundwater depletion or recharge [14,15,16]. Although these methods allow for high-accuracy measurements with high temporal resolution, their application is constrained by their low spatial resolution, which limits their effectiveness in capturing detailed spatial patterns of deformation. By contrast, differential interferometric synthetic aperture radar (DInSAR) offers a robust solution for measuring surface displacement with a high spatial resolution and precision ranging from centimeters to millimeters [17]. The ability of DInSAR to detect surface deformation caused by hydrological processes provides a valuable complement to GWL data, enabling the quantification of aquifer properties and improving our understanding of subsurface dynamics [18,19]. To further extend the capabilities of DInSAR, advanced multi-temporal interferometric SAR (MT-InSAR) techniques such as the small baseline subset (SBAS) and persistent scatterer interferometry (PSI) have been developed. These algorithms allow the observation of long-term deformation and have been successfully applied to measure surface displacement with high temporal and spatial resolution [20,21]. Time-series analyses based on MT-InSAR have been extensively used in studies investigating surface deformation related to earthquakes, volcanic activity, subsidence, landslides, and groundwater [22,23,24,25,26]. In particular, severe deformation of groundwater can be induced by anthropogenic activities, leading to various hazards such as sinkholes and land subsidence, thereby highlighting the necessity of MT-InSAR observations [27,28]. Both subsidence and uplift phenomena have been monitored continuously over long periods through the accumulation of satellite observations. Based on these long-term datasets, ongoing studies have focused on integrating the modeling of surface deformation induced by groundwater dynamics and estimating correlations or time-delay effects between aquifer response and surface displacement [29,30,31,32]. Moreover, MT-InSAR has been increasingly combined with machine learning in various studies to enhance disaster prediction [33,34]. Integrating advanced remote sensing with traditional hydrogeological methods enhances our understanding of surface deformation and subsurface hydrological interactions, which are essential for addressing groundwater management and land stability challenges in regions affected by hydrological change.
In this study, we applied the SBAS time-series algorithm to Gimhae City, Republic of Korea, where the GWLs have steadily increased. Although previous studies have demonstrated the effectiveness of comparing GWL variations with InSAR-derived deformation, most have focused on subsidence caused by groundwater extraction. By contrast, uplift associated with groundwater recharge is significantly rare and has rarely been reported in South Korea. Our study investigated a localized area exhibiting long-term uplift that had not previously been recognized as susceptible to groundwater-induced surface deformation. To enable the effective interpretation and capture of long-term deformation, we utilized multi-frequency SAR datasets composed of L-, C-, and X-band observations. A signal decomposition method was applied to remove seasonal effects and isolate the long-term variability. Spatiotemporal analyses were conducted using hydrogeological data to investigate the relationship between the deformation and groundwater variation. This approach provides new insights into the mechanisms driving surface deformation, enhancing our understanding of regional hydrogeological processes and supporting strategies for sustainable groundwater management and urban resilience in geologically complex environments. Therefore, the primary aim of this study is to investigate the long-term deformation associated with GWL variations in Gimhae City by integrating multi-frequency InSAR datasets with hydrological observations.
2. Study Area and Datasets
2.1. Study Area
We analyzed the time-series surface deformation within the central urban area of Gimhae City, South Korea, using the SBAS algorithm (Figure 2). Situated in the upper part of the Nakdong River Basin, the study area is underlain by extensive alluvial deposits composed of unconsolidated Quaternary sediments (Figure 2c). According to the hydrogeological map, a widespread aquifer system is present beneath the urbanized area (Figure 2b,c), characterized by high porosity and intergranular flow, suggesting favorable conditions for groundwater storage and movement. These hydrogeological characteristics indicate that Gimhae City is underlain by soft, unconsolidated sediments and is highly sensitive to variations in the GWL. However, detailed subsurface information, such as aquifer depth and thickness of unconsolidated sediments, is not publicly available for the study area; therefore, our interpretation is based on surface geology and groundwater level observations.
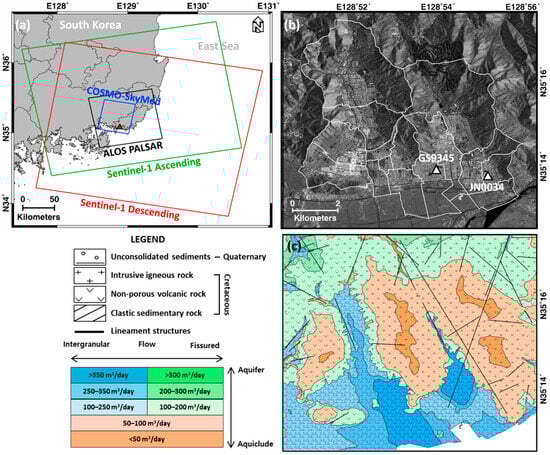
Figure 2.
(a) Swaths of SAR datasets were utilized in this study. ALOS PALSAR and COSMO-SkyMed SAR data are shown by the black and blue rectangles, whereas Sentinel-1 descending and ascending tracks are depicted by the red and green rectangles. The location of the study area is marked with a red triangle. (b) Average amplitude image of the study area derived from COSMO-SkyMed data. The two groundwater monitoring stations are marked with white triangles, and the weather station, where precipitation data was collected, is located at the same site as GS9345. A white line outlines the administrative boundary of Gimhae City. (c) Hydrogeological map of Gimhae City showing major geological features and the distribution of the aquifer system. The black solid lines denote the identified lineament structures.
Gimhae City has undergone rapid urban development in recent decades. Originally dominated by agricultural land, the area transformed into an industrial complex between the late 1980s and the early 1990s. In recent years, many of these industrial facilities have ceased operation, leading to a mixed industrial–residential landscape with ongoing development plans. Such rapid and large-scale land-use changes can alter both the purpose and volume of groundwater, resulting in fluctuations in the GWLs. Daily GWL measurements from the monitoring stations at Gimhae Samjeong (GS9345) and Jinae (JN0034), located within the study area, revealed a continuous long-term increase in GWL (Figure 3). The underlying cause of the continuous increase in the GWL in this area has not been identified through field investigations and warrants further study for effective groundwater management. Nonetheless, a long-term increase in the GWL has been observed since the installation of the monitoring stations. The most plausible explanation for the increase in GWL is a shift in groundwater usage patterns, potentially due to enhanced recharge or reduced extraction [35]. Although seasonal variations in natural rainfall typically manifest over short periods, ranging from days to weeks [36], the observed GWL trend represents a persistent and long-term hydrological shift. These long-term fluctuations can induce sustained surface deformation in soft ground environments, highlighting the need for a systematic investigation from an urban risk management perspective. Therefore, in this study, we aimed to monitor the long-term deformation time series in the study area and evaluate its relationship with GWL variations.
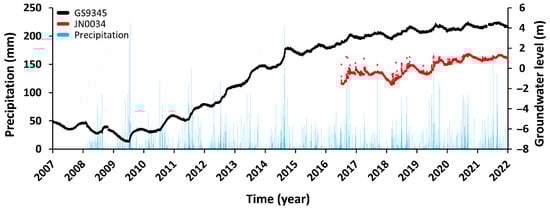
Figure 3.
Time-series graph of groundwater level (GWL) measurements and precipitation. Cyan bars represent precipitation data recorded between 25 February 2008 and 16 December 2021. Daily GWL data from station GS9345 (1 January 2007 to 31 December 2021) are black dots, whereas red dots indicate GWL data from station JN0034 (4 July 2016 to 31 December 2021).
2.2. Hydrogeological Datasets
We utilized daily average GWL data measured at the Gimhae Samjeong monitoring station (GS9345) from 1 January 2007 to 31 December 2021, operated by the Ministry of Environment and the Korea Water Resources Corporation (K-water). Additionally, GWL data from the Gimhae Jinae monitoring station (JN0034), collected from 4 July 2016 to 31 December 2021, and operated by the local municipality, were also used. The GS9345 station is located at a depth of 70 m within the confined aquifer, whereas the JN0034 station is located at a depth of 20 m within the unconfined aquifer. The hydraulic conductivity, which indicates the permeability of aquifer materials to fluid flow, was measured as 4.93 × 10⁻⁴ cm/s at GS9345 through an experiment conducted in 1995, whereas it was not provided for JN0034. In addition, no two-dimensional (2D) hydraulic conductivity map is available for the study area. These datasets were obtained from the National Groundwater Information Management and Service Center (GIMS). Both GWL datasets exhibited a seasonal component with a recurring annual cycle, which was closely aligned with the precipitation data from the Korea Meteorological Administration (Figure 3). This cyclical pattern may reflect the influence of seasonal rainfall on GWLs. Hydrogeological map data, including the GWL contour map and flow directions, were collected from GIMS to analyze the spatial characteristics of the surface deformation. The Ministry of Land, Infrastructure, and Transport and K-water initially investigated these maps from January 2004 to December 2005. The Korea Institute of Geoscience and Mineral Resources provided information on the locations of the two lineament structures incorporated into the analysis [37]. These additional data facilitate a comprehensive understanding of the hydrogeological and structural factors influencing surface deformation.
2.3. Multi-Frequency Synthetic Aperture Radar
We collected four SAR datasets comprising X-, C-, and L-band data to observe long-term surface deformation and examine its relationship with groundwater fluctuations. The datasets were carefully selected to provide the optimal temporal and spatial coverage of the study area. For the X-band, we employed 184 COSMO-SkyMed descending HIIMAGE single-look complex (SLC) images obtained from 9 January 2013 to 20 April 2019. We analyzed C-band data from Sentinel-1 satellites, including 164 descending interferometric wide (IW) mode SLC images collected between 8 January 2016 and 14 October 2021, and 141 ascending IW mode SLC images acquired between 20 January 2016 and 8 October 2021. In addition, we utilized 19 ALOS PALSAR ascending L0 raw images acquired from 15 September 2007 to 24 December 2010. The incidence angles of the datasets ranged from 32.2° to 41.7°, ensuring compatibility with the surface deformation analysis. Table 1 provides further technical details of each dataset. These SAR datasets offer diverse wavelengths and acquisition geometries, enabling a robust comparison of surface deformation patterns and their correlations with GWL fluctuations over different periods and observation modes.

Table 1.
List of multi-frequency SAR datasets utilized in this study.
3. Methodology
3.1. Seasonal Trend Decomposition
To distinguish between seasonal and long-term factors contributing to the observed GWL increase at the monitoring stations, we applied seasonal trend decomposition using the Loess (STL) method to the time-series data. This approach allowed for a clear interpretation of the primary drivers of surface deformation. Monthly averaged GWL data were used, with the seasonal cycle set to 1 year to account for rainfall effects. In addition to anthropogenic factors, rainfall is the most influential natural factor affecting the GWL variation. Owing to the climatic characteristics of the study area, precipitation exhibits a distinct annual cycle, as shown in Figure 3. Therefore, a 1-year window was selected for STL decomposition to remove seasonal variations. STL is a widely used technique for time-series analysis, owing to its conceptual simplicity and flexibility in handling various data patterns. It decomposes time-series data into three components: trend, seasonal, and residual, using a locally estimated scatter plot smoother (Loess) regression function [38]. This method allowed us to isolate the long-term rising trend from seasonal fluctuations, enabling a focus on the groundwater recharge patterns potentially influenced by anthropogenic or climatic factors.
3.2. MT-InSAR Processing
We conducted a time-series analysis using the SBAS algorithm implemented using GAMMA software (20241205) [20,39]. SBAS is a multi-temporal InSAR method that utilizes interferogram pairs with small spatial and temporal baselines to maintain high coherence and minimize decorrelation caused by large baselines. This approach was particularly practical for long-term deformation studies, and the overall workflow for data processing and analysis used in this study is shown in Figure 4. For co-registration, the first acquisition date from each dataset was selected as the reference image. Interferogram networks were generated using sensor-specific maximum perpendicular and temporal baselines tailored to the wavelength and spatial resolution of each SAR platform. Network connectivity between interferogram pairs was ensured, and baseline thresholds were selected to remain within the critical baseline. The temporal baseline included interferogram pairs spanning up to 1 year to capture long-term deformation. Owing to its longer wavelength, the L-band ALOS PALSAR data maintained high coherence, even with a large baseline. By contrast, the X-band COSMO-SkyMed data achieved highly coherent interferograms owing to their high spatial resolution despite having shorter wavelengths than the L- and C-band data [40,41].
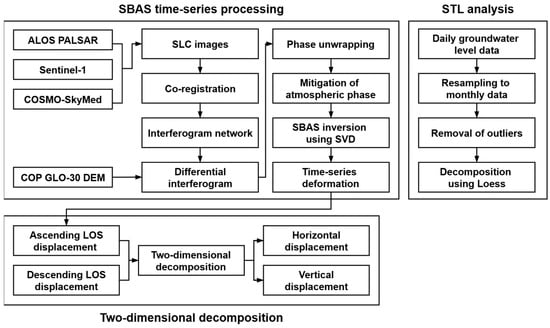
Figure 4.
Workflow illustrating the entire sequence of data processing.
Differential interferograms were generated by removing the topographic phase using the Copernicus GLO-30 digital elevation model (DEM) [42]. Multi-looking processing and adaptive phase filtering were used to suppress phase noise [43]. Based on the pixel spacing of each SAR sensor, the multi-looking factors were set to 4 × 12, 4 × 4, and 10 × 2 in range and azimuth for ALOS PALSAR, COSMO-SkyMed, and Sentinel-1, respectively. To reduce phase biases in individual interferogram pairs, an average coherence threshold was applied, and low-quality interferograms were excluded from processing. A minimum cost flow algorithm was employed for phase unwrapping, and the consistency of the unwrapped phases was assessed and corrected using a simulated unwrapped phase model [44,45]. The residual orbital errors were adjusted and removed by applying a polynomial model to the linear phase ramp. Atmospheric phase delays, randomly distributed in both spatial and temporal domains, were mitigated using spatial filtering and temporal smoothing factors [46]. The unwrapped differential interferograms were converted into line-of-sight (LOS) time-series displacements using the singular value decomposition (SVD) and least squares (LS) methods [20]. A reference point with a consistently high coherence across all interferograms, which was assumed to be deformation-free, was selected for each dataset [47]. The final time-series SBAS results were geocoded using the DEM and masked using coherence and standard deviation thresholds.
To obtain the horizontal and vertical deformations, we decomposed the LOS displacements from the ascending and descending orbits into 2D components (east–west and vertical) [48]. This decomposition, performed under the assumption of negligible north–south deformation, uses the incidence angle (θ) and heading angle (α) for each orbit, as expressed in Equation (1) [49].
This approach overcomes the limitations of LOS observations imposed by the satellite geometry, enabling multifaceted analyses and facilitating their application across a wide range of studies [50,51]. Based on the decomposed results, all LOS displacements were projected in the vertical direction using Equation (2) and the respective incidence angle, as the deformation associated with groundwater fluctuations primarily manifests as vertical movement.
4. Results
4.1. MT-InSAR Observations
We generated four deformation velocity maps in the LOS direction (Figure 5a–d) and two decomposed velocity maps in the horizontal (east–west) and vertical (up–down) directions (Figure 6a,b). Although GNSS data were unavailable, making direct validation of each dataset difficult, both the COSMO-SkyMed and Sentinel-1 results showed uplift signals in spatially similar regions. However, no clear changes were observed in GWL during the ALOS PALSAR observation period; consequently, no significant surface displacement was detected. Therefore, this study places more emphasis on interpreting surface deformation during the period of GWL increase.
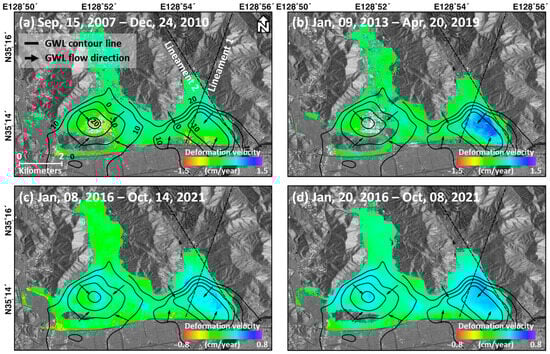
Figure 5.
Deformation velocity maps in the line-of-sight (LOS) direction were generated as follows: (a) from L-band ALOS PALSAR data, (b) from X-band COSMO-SkyMed, and (c,d) from C-band Sentinel-1 data in descending and ascending orbits. The GWL contour lines are black solid lines, and the lineament structures are black dotted. The black arrow in (a) indicates the flow directions of groundwater.
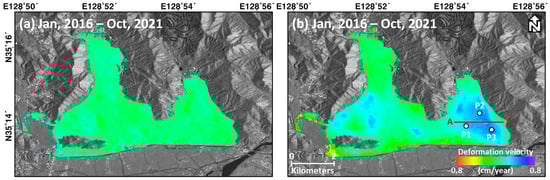
Figure 6.
Two-dimensional (2D) deformation velocity maps include (a) horizontal and (b) vertical components. The three points (P1–P3), marked as white circles, were selected to generate time-series displacement graphs. The red line A-A’ was used in this study to compare deformation velocities across different periods and SAR datasets.
To assess the reliability of the MT-InSAR results, we generated standard deviation maps of the residual phase to estimate velocity uncertainty. If significant uncertainty or phase bias is present, the time-series deformation exhibits spatially and temporally incoherent patterns, resulting in high standard deviation and low coherence values. However, the standard deviation maps derived from all SAR datasets showed values converging toward zero, including within the uplift region (Figure S1 in Supplementary Materials). This confirms the stability of the interferometric phase and supports the reliability of time-series processing. Scatter plots illustrating the relationship between coherence and standard deviation for the study area (Figure 5) were generated to further validate the MT-InSAR results (Figure S2 of the Supplementary Materials). Although the standard deviation associated with the ALOS PALSAR dataset was slightly higher than that of the other datasets, all mean standard deviation values remained below 0.35 cm, and the mean coherence values exceeded 0.85, indicating sufficient analysis reliability. In all the figures, the eastward and downward movements are displayed in red with negative values, whereas the westward and upward movements are shown in blue with positive values.
The deformation velocity map derived from ALOS PALSAR data, covering the period from 15 September 2007 to 24 December 2010, revealed no distinct deformation patterns across the study area (Figure 5a). By contrast, the deformation velocity map from COSMO-SkyMed data acquired between 9 January 2013 and 20 April 2019 indicated significant surface uplift in the eastern part of the study area. This uplift showed a maximum cumulative displacement of approximately 8.2 cm over 6 years and a maximum deformation velocity of 1.5 cm/year (Figure 5b). Figure 5c,d present deformation velocity maps from the Sentinel-1 descending and ascending tracks, covering the periods from 8 January 2016 to 14 October 2021 and from 20 January 2016 to 8 October 2021, respectively. These maps also reveal surface uplift in a similar region as observed in the COSMO-SkyMed data, with maximum deformation velocities of approximately 0.47 and 0.54 cm/year, respectively. The two decomposed velocity maps derived from Sentinel-1 observations confirmed similar deformation patterns, predominantly in the vertical direction, from January 2016 to October 2021 (Figure 6a,b). The maximum vertical velocity reached approximately 0.54 cm/year, whereas the horizontal deformation velocities were negligible, converging near zero. These results highlight the important spatial characteristics of surface deformation. The observed uplift patterns were concentrated along the deepest GWL contour line, indicating a spatial correlation between groundwater conditions and deformation signals. During groundwater recovery, the largest variations typically occur in areas where GWLs are the deepest, which can lead to a more pronounced uplift relative to surrounding regions. In this study, the uplift signals were aligned with the deepest contour line, approximately −10 m above sea level (Figure 5b), suggesting that deformation is closely related to groundwater processes. Another notable spatial feature of the uplift pattern is that it developed between the two lineament structures within the study area. This spatial correlation suggests a relationship between the surface uplift phenomena and groundwater fluctuations. These results highlight the importance of groundwater dynamics in driving surface deformation and offer insights into the interplay between subsurface hydrology and surface geodynamics. For further analysis, we focused on the surface uplift signals observed between the two major lineament structures in the eastern part of the urban area, where all subsequent analyses were conducted. Figure 7 presents the annual cumulative deformation, showing the relative cumulative changes for each satellite dataset with respect to the first acquisition. A clear and consistent uplift pattern is observed in the eastern region of the study area, indicating gradual and sustained deformation over time. Consistent with the velocity maps shown in Figure 5, negligible deformation was detected in the ALOS PALSAR results, whereas continuous uplift was observed during the COSMO-SkyMed and Sentinel-1 observation periods.
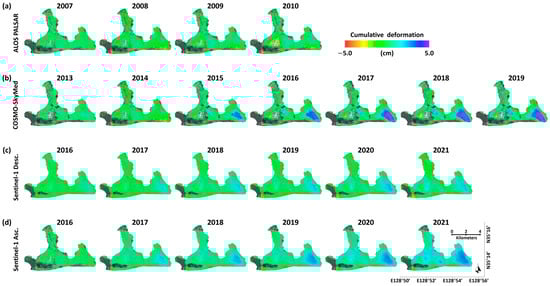
Figure 7.
Annual cumulative deformation for (a) ALOS PALSAR, (b) COSMO-SkyMed, (c) Sentinel-1 descending, and (d) ascending datasets, showing the spatiotemporal variations in deformation. The deformation maps illustrate relative changes referenced to the first acquisition for each satellite.
4.2. Correlation Between Surface Uplift and GWL Changes
To compare the time-series displacements derived from the MT-InSAR and GWL changes, the observed displacement in the LOS direction was converted into the vertical direction using the incidence angle, as described in Section 3. This conversion ensured that the displacement data were aligned with the vertical GWL changes for an accurate correlation analysis. Daily GWL data were resampled into monthly data to remove outliers and fill gaps caused by missing values. The resampled GWL time-series data were decomposed into three components—trend, seasonal, and residual—using the STL method with a 1-year seasonal cycle (Figure 8). The STL decomposition results revealed a clear long-term rising trend and distinct seasonal patterns in GWL at both monitoring stations. A positive slope was identified in the trend component, indicating a gradual increase in the GWL over time. By contrast, the seasonal component exhibited a slope close to zero, reflecting its cyclic nature and confirming that the seasonal variability was effectively separated from the long-term trend. By applying the STL method, we isolated long-term GWL changes and better assessed their relationship with surface deformation.
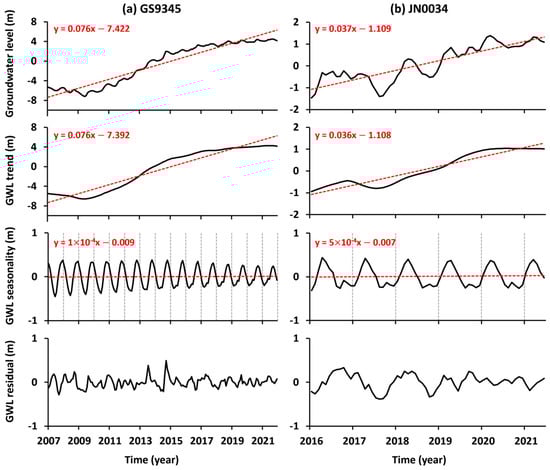
Figure 8.
Plots of decomposed groundwater level were generated using average monthly data collected from (a) GS9345 and (b) JN0034, analyzed using the Seasonal Trend decomposition using the Loess (STL) method. Each graph presents the groundwater level, trend, seasonality, and residuals from top to bottom. The black solid line represents the data for each component, and the red dashed line shows the linear model equation for each component.
Time-series displacement graphs were generated for three points (P1, P2, and P3), as shown in Figure 9. Because the InSAR-derived time-series results represented the displacement with respect to the first acquisition of each dataset, a consistent referencing step was required. The GWL data was used as an absolute reference, and for each SAR dataset, a constant offset was determined by minimizing the root mean square error (RMSE) between the displacement and GWL time series. This constant was then applied to each time series, enabling the deformation results from the different sensors to be aligned and directly compared. The time-series displacement at the three points revealed uplift patterns corresponding to the GWL fluctuations. After removing seasonality, the long-term rising trend of the GWL was reflected in the surface uplift, suggesting that groundwater recharge increased the pore pressure and induced surface deformation (Figure 9).
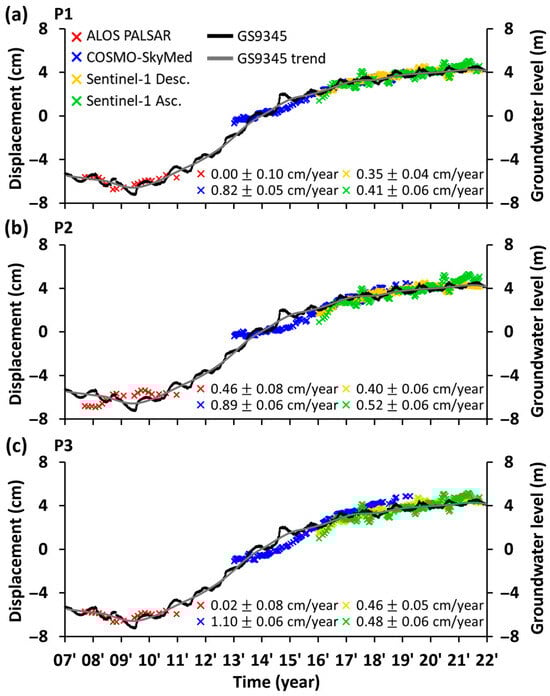
Figure 9.
Time-series displacement graphs at (a) P1, (b) P2, and (c) P3. The groundwater level (GWL) and its trend are shown as solid black and gray lines, respectively. The red, blue, yellow, and green symbols represent the calculated displacement observed using ALOS PALSAR, COSMO-SkyMed, and Sentinel-1 descending and ascending datasets, respectively.
ALOS PALSAR observations show deformation velocities of 0, 0.46, and 0.02 cm/year at points P1, P2, and P3, respectively. The total GWL changes during this period were measured as 1.16 m before removing seasonality and 0.60 m after seasonal adjustment. These results indicated that GWL fluctuations were minimal during the observation period. At points P1 and P3, the deformation velocities were nearly zero, suggesting that surface deformation in these areas was largely unaffected by groundwater changes. However, a slight surface uplift was detected at point P2, with localized regions exhibiting a small cumulative displacement of less than 1 cm. This localized uplift indicates that even during minimal GWL fluctuations, certain areas may still experience minor surface deformation owing to localized factors. Between 2013 and 2019, COSMO-SkyMed observations were accompanied by a significant groundwater rise (5.34 m), with GWL increasing from −1.72 to 3.62 m relative to sea level. This period exhibited the highest deformation velocities, with 0.82, 0.89, and 1.10 cm/year at P1, P2, and P3, respectively. These results indicate a strong correlation between rapid GWL rise and surface uplift in the eastern region. The Sentinel-1 descending and ascending results (2016–2021) displayed similar patterns, consistent with the GWL changes. At P1, deformation velocities were 0.35 and 0.41 cm/year for descending and ascending orbits, respectively. At P2, the velocities were 0.40 and 0.52 cm/year, whereas P3 exhibited 0.46 and 0.48 cm/year, respectively. During this period, GWL rose continuously until 2019, increasing by 1.63 m (from 2.03 m to 3.66 m) before stabilizing with a smaller rise of 0.43 m (from 3.66 to 4.09 m) between 2019 and 2021. Interestingly, this nonlinear pattern in GWL changes, characterized by a decreasing trend after 2019, was also reflected in the Sentinel-1 deformation results. Cumulative displacement along the descending orbit was 2.42 cm until 2019; however, it showed negligible displacement (−0.02 cm) from 2019 to 2021. The annual velocities of the GWL rise and surface deformation were calculated, revealing a notable increase in the GWL rise velocity between 2010 and 2016 (Figure 10). During this period, COSMO-SkyMed and Sentinel-1 results showed high deformation velocities. By contrast, before 2010, GWL changes did not exhibit a consistent increasing or declining trend, and the observed fluctuations were not sufficiently large to generate noticeable or anomalous surface displacements. During this period, the annual velocity estimates derived from ALOS PALSAR also revealed patterns that were uncorrelated with the GWL, with opposite signals detected at P2 in 2008. This indicates that the estimated time-series displacements do not provide clear evidence of ground movements driven by GWL changes. Moreover, the observed displacements may have been affected by phase uncertainties caused by variations in the wavelength of the signal or localized ground conditions rather than groundwater variations. After 2016, both the GWL and displacement velocities stabilized.
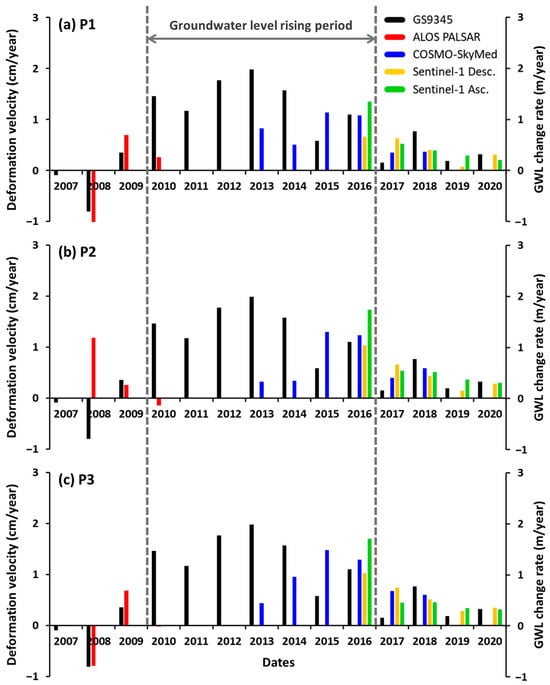
Figure 10.
Annual velocities of GWL and surface deformation were analyzed at (a) P1, (b) P2, and (c) P3.
As the groundwater fluctuations gradually decreased and stabilized, the time-series displacements also exhibited nonlinear patterns. To interpret these patterns, an exponential function model was suggested as an effective approach in a previous study [52]. Using an exponential function model, we generated scatter plots to analyze the correlation between MT-InSAR observations and GWL data. The coefficient of determination (R2) was calculated to quantify the strength of this relationship (Figure 11). To assess the uncertainty in the correlation analysis, we calculated the correlation coefficient (R) with a 95% confidence interval (CI); the lower and upper bounds of the CI are presented in parentheses (see Table S1 of the Supplementary Materials). The time-series displacement data were resampled to monthly averages and compared with the corresponding monthly GWL data, and the long-term trend was derived from the STL method to enable direct comparison. At point P1, the correlation analysis of the ALOS PALSAR data showed a relatively low R value of 0.58, with 95% CI ranging from 0.34 to 0.76. The R2 values were also lower than those of the other datasets, with 0.34 for GWL changes and 0.58 for the GWL trend (Figure 11a). Similarly, at points P2 and P3, R2 values were less than 0.4, indicating weak correlations (Figures S3 and S4 in Supplementary Materials). The relatively low R2 values of the ALOS PALSAR dataset, together with the large CI of R compared with the other datasets, indicate a weak correlation with GWL. This suggested that no significant groundwater fluctuations affected the surface during the observation period. Between 2007 and 2010, no clear rising or declining trends were observed in either the GWL or the surface displacement data, in contrast to the period after 2011 (Figure 3 and Figure 9). Therefore, it is likely that the surface may not have been substantially affected by groundwater variations during this earlier period, resulting in a weak correlation between the GWL and surface displacement. The strongest correlation was observed for the COSMO-SkyMed dataset. At P1, an R value of 0.96 was calculated, with 95% CI ranging from 0.94 to 0.98. The R2 values were 0.92 for GWL changes and 0.96 for the GWL trend, highlighting a robust relationship between surface deformation and groundwater dynamics during this period (Figure 11b). The Sentinel-1 data also demonstrated strong correlations across different orbital tracks. For the descending track, the R value was 0.89, with the 95% CI ranging from 0.83 to 0.93. For the ascending track, the R value was 0.88, with the CI ranging from 0.81 to 0.92. The corresponding R2 values were 0.79 and 0.78 for GWL changes and 0.90 and 0.83 for seasonally detrended GWL (Figure 11c,d). Similar statistical metrics were observed at points P2 and P3 across all the SAR datasets, reinforcing the robustness of these results (Figures S3 and S4).
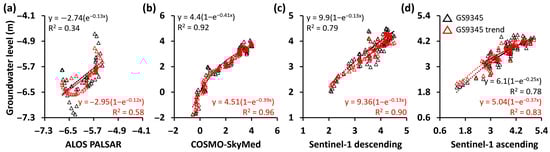
Figure 11.
Scatter plots comparing at P1 with GWL and its trend, obtained using the STL method, with displacement from (a) ALOS PALSAR, (b) COSMO-SkyMed, (c) Sentinel-1 descending, and (d) ascending tracks.
Figure 12 illustrates the variation in deformation velocities along the A-A’ profile for the four deformation velocity maps and two decomposed maps. The ALOS PALSAR observations revealed a slight uplift velocity in the central part of the profile, suggesting minimal deformation during the observation period. By contrast, the COSMO-SkyMed data showed high uplift velocities across most profile sections, which is consistent with the significant groundwater rise observed during the same period. The Sentinel-1 descending and ascending data displayed moderate uplift signals along the entire profile, with deformation velocities slightly lower than those of COSMO-SkyMed. The vertical deformation along the profile exhibited trends similar to those of the Sentinel-1 results, confirming the predominance of vertical deformation. The horizontal component remained near zero throughout the profile. Furthermore, Figure 12 confirms that the observed uplift velocities along profile A-A’ occurred between the two lineament structures, suggesting an association between these geological settings and the deformation patterns.
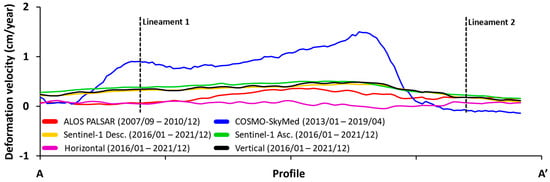
Figure 12.
Distribution of deformation velocities along line A-A’, derived from the deformation map shown in Figure 6. The four solid-colored lines correspond to the datasets described in Figure 9. The purple and black solid lines also represent deformation velocities in the horizontal and vertical directions, respectively.
5. Discussion
5.1. Time Lag Between Deformation and Groundwater
We estimated the time lag between the MT-InSAR observations and GWL changes by identifying the maximum coefficient of determination (R2) after applying a time delay to the data. As shown in Figure 11, the R2 values for the correlation between the time-series displacement and GWL trend were higher than those for the direct correlation with GWL values. Although both comparisons demonstrated a strong correlation, the time lag was calculated using the GWL and its trend to ensure a comprehensive analysis. For this analysis, we focused on the time-series displacement data obtained from COSMO-SkyMed and Sentinel-1, excluding ALOS PALSAR because of its relatively low R2 values compared with the other SAR datasets. The time resolutions of the COSMO-SkyMed and Sentinel-1 datasets (30 days) were resampled to monthly averages. Consequently, the time lag was calculated by incrementally adding time intervals of 30 days, starting from zero. The time lag calculated for the COSMO-SkyMed data to the GWL showed a significant delay ranging from 510 to 780 days. Similar delays (510–660 days) were observed compared with the GWL trend. These results suggest that the long-term rising trend of the GWL from 2013 to 2019 was predominantly reflected in the COSMO-SkyMed observations, with a time lag of approximately 2 years. However, the time lag calculated using Sentinel-1 data was much shorter, ranging from 0 to 120 days. This relatively short lag may indicate that the surface deformation observed by Sentinel-1 was more strongly affected by short-term effects, such as seasonal variations, than by long-term trends. The shorter observation period for Sentinel-1 compared to COSMO-SkyMed may also constrain its ability to accurately estimate time lags [53]. However, we suggest that the main cause of the negligible lag in Sentinel-1 was the stabilization of the GWL. Since 2016, the rising trend of the GWL has leveled off, and the physical influence of groundwater fluctuations on the surface is presumed to have weakened. During the COSMO-SkyMed period, a total uplift of 8.2 cm was observed, whereas during the Sentinel-1 period, only a 2.4 cm total displacement was detected. This reduced magnitude likely imposes a limitation on the estimation of the long-term lag effects highlighted in this study. The calculated time lags and coefficients of determination for each satellite at P1–P3 are summarized in Table S2 of the Supplementary Materials, and the results of the time-lag compensation graph are shown in Figure S5 (see Supplementary Materials for details). Although the correlation analysis showed higher R2 values after compensating for the time delay, time-lag estimation was feasible only when significant displacement patterns were present. Moreover, the estimated time lag may vary depending on hydrogeological factors, such as deposit type, aquifer characteristics, thickness, and seasonal effects [54,55]. For instance, when seasonal effects are retained in Sentinel-1 data showing minute surface displacement, the estimated time lag is reduced to 0 days. These values suggest that the residual deformation may continue even after GWL stabilization [52,56]. Furthermore, the time lag of approximately 2 years estimated in our study, which used the STL method to separate seasonality, was larger than that reported in previous studies. This suggests that long-term observation is essential in regions that have experienced displacement to prepare for potential additional damage while accounting for seasonal variability. This analysis provides insights into the temporal relationship between GWL changes and surface deformation, reflecting the observational capabilities of SAR datasets and the underlying hydrogeological processes.
5.2. Validation and Reliability of MT-InSAR Analysis
The main objective of this study was to investigate the time series of surface deformation occurring in Gimhae City, South Korea, where GWLs have been continuously increasing for over a decade. Surface uplift signals were successfully detected using MT-InSAR based on the SBAS algorithm. By comparing MT-InSAR observations with GWL data, we demonstrated that fluctuations in the GWL significantly influenced surface deformation. Although validation with terrestrial surveys was not possible owing to the absence of ground-based measurements such as GNSS and leveling, we conducted cross-validation using multi-frequency datasets. Figure 13 presents the correlation analysis between the COSMO-SkyMed and Sentinel-1 datasets during their overlapping period (2016–2019). Datasets acquired from the same orbit showed strong agreement, with an R2 value of approximately 0.9, whereas those acquired from different orbits yielded lower R2 values (0.7) owing to differences in the LOS geometry, which were addressed through 2D decomposition. Quantitative validation using the ALOS data was not possible because only a single-track dataset was available. The high reliability of the deformation signals was confirmed using standard deviation maps and scatter plots derived from statistical methods (Figures S1 and S2). These maps showed minimal residual phase noise, indicating the robustness of the MT-InSAR results. Despite employing several indirect validation approaches, uncertainties may remain, particularly those related to the choice of reference point and omission of the north–south displacement component. Therefore, future work should incorporate ground-based measurements or additional independent datasets to further improve the reliability of MT-InSAR results.
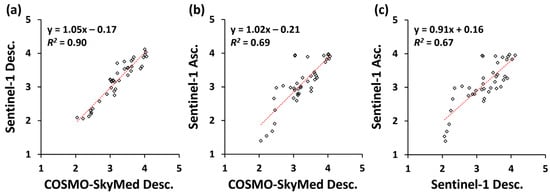
Figure 13.
Scatter plots of cross-validation between COSMO-SkyMed and Sentinel-1 at P1. Each graph shows the correlation between COSMO-SkyMed descending and (a) Sentinel-1 descending, (b) Sentinel-1 ascending, and (c) between Sentinel-1 descending and ascending.
To compare the MT-InSAR observations and the GWL data, we primarily used data from the GS9345 monitoring station, located approximately 1.5 km from the observed deformation area. However, this validation was constrained by the limited availability and quality of GWL data from other monitoring stations. Only the GS9345, which has been operating since 1995 as part of the National Groundwater Monitoring Network, provided a long-term, continuous GWL record. By contrast, several other monitoring stations, including the JN0034 station operated by local municipalities, were installed after 2013 or provided discontinuous records owing to equipment issues. The JN0034 station also exhibited unstable data after outlier removal and contained gaps in the time series, as shown in Figure 3. In addition, the data management of this supplementary station was not as consistent as that of the national stations, which limited its suitability for validation. Therefore, although the JN0034 station provided GWL data from July 2016 to the present, we excluded this station from comparison and validation. Consequently, only GS9345 was used for surface deformation correlation analysis. The JN0034 station was referenced solely to illustrate the recent rise in GWL since 2016, which supports the upward GWL in the uplifted regions (Figure 3).
The observed surface uplift was spatially concentrated in specific areas. These uplifted areas correspond to regions where the aquifer is widely distributed and supports intergranular flow (Figure 2c). The deformation patterns appeared to be influenced by both the regional GWL distribution and the presence of two prominent lineament structures (Figure 5). In locations where the GWL is the deepest, recharge may occur more readily to restore hydrostatic equilibrium, potentially resulting in a more pronounced uplift compared to the surrounding regions. Moreover, lineament structures may act as barriers or conduits that influence groundwater flow pathways and regional deformation patterns, which is consistent with previous findings [57]. These geological features are known to significantly affect groundwater flow and aquifer distribution [58,59]. Lineaments often indicate subsurface structures, such as faults, joints, and fractured zones, and their characteristics, including density, orientation, and scale, strongly influence groundwater storage. Therefore, lineament analysis has been widely applied to groundwater investigations [60,61]. The relationship between structural lineaments and surface deformation has also been demonstrated in numerous studies, where deformation patterns have been examined around identified lineaments to better understand structural control [62]. In this context, the aquifer system located between the two lineaments may have experienced vertical expansion owing to groundwater recharge, particularly in areas composed of soft ground materials, thereby contributing to the observed surface uplift. These effects are clearly reflected in the spatial characteristics of the surface deformation observed using the MT-InSAR method. Although specific hydrogeological data such as fracture orientation, borehole lithology, and hydraulic conductivity were not available for our study area, limiting a more detailed analysis of the lineaments, it is presumed that in this region, the lineaments may act as barriers, leading to differences in the aquifer properties across them. Furthermore, the absence of a 2D hydraulic conductivity map restricts precise spatial assessment of subsurface heterogeneity. Nevertheless, the spatial correlation between the observed uplift and location of the lineaments suggests a potential structural control of the subsurface hydrology, and the captured regions may be more susceptible to uplift induced by GWL variations. Further geological investigations are required to confirm these mechanisms.
To strengthen the link between GWL variations and surface uplift, several previous studies have applied hydrogeological modeling related to skeletal storage coefficients or groundwater storage in aquifer systems [63,64,65]. These parameters represent the storage capacity of the aquifer system in response to GWL variations and are closely related to the surface displacement induced by groundwater changes. However, in this study, the limited spatial distribution of groundwater stations prevented the application of such modeling. More comprehensive insights are possible with additional hydrogeological investigations of the aquifer systems. A detailed examination of aquifer properties combined with the inversion of surface deformation data could support the development of a localized hydrogeological model in future research. Such modeling would allow for a more precise characterization of subsurface changes and their interaction with surface deformation, underscoring the importance of conducting additional field surveys within the study area. Nevertheless, we demonstrated the relationship between the GWL and surface uplift using spatial hydrogeological data, including GWL contour lines, geological lineaments, and groundwater stations, and confirmed that they exhibit a strong spatiotemporal correlation. Our findings underscore the importance of integrating geospatial and geological analyses to better understand the mechanisms driving surface deformation.
5.3. Complement Infrastructure Stability and Groundwater Management Using MT-InSAR
The observed surface uplift in the study area, driven by the rising GWL, suggests that the region consists of soft ground that is highly responsive to groundwater dynamics. Such continuous fluctuations in GWL, either increasing or decreasing, may result in additional surface deformation beyond the observation period. Given the associated risk of infrastructure instability, further site-specific hydrogeological investigations, such as the installation of monitoring wells and stratigraphic profiling of aquifer systems, are warranted. As demonstrated in this study, integrating MT-InSAR observations and time-lag analysis offers a practical framework for managing groundwater resources and infrastructure in a coordinated manner. By enhancing our understanding of the hydrogeological relationships between aquifers and surface deposits, this approach supports informed decision-making for sustainable management. Considering the complexity of these interactions, long-term monitoring is necessary to develop a more comprehensive assessment by integrating leveling data with multi-frequency SAR datasets [66,67]. Prior research has highlighted the value of integrated approaches for informing adaptive governance strategies [68,69]. These strategies can help mitigate the secondary cascading effects of GWL variations, such as sand liquefaction, land compaction, surface uplift, and infrastructure damage.
6. Conclusions
In this study, we investigated the surface uplift in the urban area of Gimhae City, South Korea, using the following four SAR datasets: ALOS PALSAR, COSMO-SkyMed, and Sentinel-1 descending and ascending tracks. Long-term deformation observations were conducted by leveraging datasets covering different periods. This approach allowed us to compare the variations in GWL fluctuations and their corresponding surface displacements during each observation period.
From 2007 to 2010, when GWL changes were minimal, the deformation velocities observed in the ALOS PALSAR data were also close to zero, indicating little to no surface displacement. However, between 2013 and 2019, the period marked by a rapid rise in the GWL, COSMO-SkyMed observations captured the most significant surface uplift. This uplift corresponded to a cumulative displacement of 8.2 cm, highlighting the significant impact of rapid groundwater recharge on surface deformation. In the latter part of the observation period, from 2016 to 2021, Sentinel-1 data represented approximately 1.0 cm of nonlinear deformation patterns, reflecting the gradual stabilization and reduction in GWL rise. These results demonstrate the capability of MT-InSAR techniques in detecting subtle deformation trends over time, even under conditions of reduced groundwater variability.
Notably, the uplift phenomenon was concentrated along the deepest GWL contour line and between two prominent lineament structures in the study area. This spatial correlation suggests that geological features such as lineaments or faults might be critical in modulating surface deformation in response to GWL changes. Correlation analysis between GWL changes and time-series displacement showed a high coefficient of determination (R2), confirming that surface deformation reflects the vertical movement of aquifers caused by GWL rise. Our results demonstrated that the persistent surface uplift observed in the study area was directly affected by long-term GWL variations. By analyzing more than a decade of data, rather than focusing solely on seasonal effects, we identified distinct patterns of displacement. Furthermore, applying STL decomposition to groundwater measurement data revealed a significant time lag of approximately 2 years. This lag is longer than that reported in previous studies and may reflect the specific hydrogeological characteristics of the aquifer system. Combining MT-InSAR observations with various hydrological datasets can provide detailed spatiotemporal information on surface deformation, such as uplift. This integrated approach highlights the potential of monitoring urban groundwater dynamics and their impact on surface stability. In future research, we aim to develop groundwater-induced deformation models for specific regions by integrating field investigations with recent InSAR-derived deformation observations. Such efforts could support the development of practical frameworks for aquifer management and deformation hazard assessment, including the establishment of an integrated monitoring system based on InSAR techniques. Furthermore, as the study area continues to undergo rapid urban development, combining InSAR results with socioeconomic and field-based data could provide valuable insights for urban planning and future development strategies, emphasizing the importance of continued interdisciplinary research.
Supplementary Materials
The following supporting information can be downloaded at https://www.mdpi.com/article/10.3390/rs17233875/s1, Figure S1: Standard deviation maps of the residual phase were derived from (a) ALOS PALSAR, (b) COSMO-SkyMed, (c) Sentinel-1 descending, and (d) Sentinel-1 ascending datasets. The white triangle indicates the reference point used in the SBAS processing, whereas the black rectangle corresponds to the same areas, as depicted in Figure 5; Figure S2: Scatter plots showing the relationship between the standard deviation and coherence for the area shown in Figure 5, based on the MT-InSAR results derived from (a) ALOS PALSAR, (b) COSMO-SkyMed, (c) Sentinel-1 descending, and (d) ascending datasets; Figure S3: Scatter plots comparing P2 with GWL and its trend, obtained using the STL method, with displacement from (a) ALOS PALSAR, (b) COSMO-SkyMed, (c) Sentinel-1 descending, and (d) ascending tracks; Figure S4: Scatter plots comparing P3 with GWL and its trend, obtained using the STL method, with displacement from (a) ALOS PALSAR, (b) COSMO-SkyMed, (c) Sentinel-1 descending, and (d) ascending tracks; Figure S5: Comparison between time-series displacement and GWL graphs before and after time-lag compensation at P1–P3 for (a–c) COSMO-SkyMed and (d–f) Sentinel-1 descending; Table S1: Correlation coefficient with a 95% confidence interval (CI) between the groundwater fluctuations and time-series displacement was calculated for each satellite from P1 to P3. R is the correlation coefficient and the CI is indicated in brackets; Table S2: Time lag between the groundwater fluctuations and time-series displacement was calculated for each satellite at points P1–P3. GWL and trend represent the time lag in days, derived from comparison with groundwater levels (GWL) and their trend, respectively. R2GWL and R2trend indicate the coefficients of determination for the relationships between GWL, its trend, and the time-series displacement, incorporating the calculated time lag.
Author Contributions
Conceptualization, S.P. and S.-H.H.; methodology, S.P. and S.-H.H.; validation, S.P. and S.-H.H.; writing—original draft preparation, S.P. and S.-H.H.; writing—review and editing, S.P., S.-H.H. and F.C.; visualization, S.P.; supervision, S.-H.H. and F.C. All authors have read and agreed to the published version of the manuscript.
Funding
This research received no external funding.
Data Availability Statement
Groundwater information, including daily level measurement data, level contour maps, and flow direction, was acquired from the National Groundwater Information Management and Service Center (GIMS) (https://www.gims.go.kr/en/hydrogeologicalMaps.do, accessed on 14 November 2025). The locations of the lineament structures were provided by the Korea Institute of Geoscience and Mineral Resources (KIGAM) via the Geo Big Data Open Platform (https://data.kigam.re.kr/map, accessed on 14 November 2025) using the 2019 version of the lineament map. The time-series datasets utilized in this study can be accessed at the following repository (https://doi.org/10.5281/zenodo.14728790, accessed on 22 October 2025).
Acknowledgments
The authors would like to thank the European Space Agency (ESA) for providing Sentinel-1A/B data and the Italian Space Agency (ASI) for offering COSMO-SkyMed products under an ASI license through the framework of the COSMO-SkyMed Open Call for Science (Project ID 779). The ALOS PALSAR data were provided by the Japanese Space Exploration Agency (JAXA) under the 4th research agreement (PI No. 1237) and the 2nd Research Announcement on Earth Observations (PI No. ER2A2N057). This work was supported in part by the National Research Foundation of Korea (NRF) grant funded by the Korean Government (MSIT) under Grant NRF-2023R1A2C1003609.
Conflicts of Interest
The authors declare no conflicts of interest.
References
- Taylor, C.J.; Alley, W.M. Ground-Water-Level Monitoring and the Importance of Long-Term Water-Level Data; US Geological Survey: Denver, CO, USA, 2001; Volume 1217.
- Adams, K.H.; Reager, J.T.; Rosen, P.; Wiese, D.N.; Farr, T.G.; Rao, S.; Haines, B.J.; Argus, D.F.; Liu, Z.; Smith, R. Remote sensing of groundwater: Current capabilities and future directions. Water Resour. Res. 2022, 58, e2022WR032219. [Google Scholar] [CrossRef]
- Galloway, D.L.; Hoffmann, J. The application of satellite differential SAR interferometry-derived ground displacements in hydrogeology. Hydrogeol. J. 2007, 15, 133–154. [Google Scholar] [CrossRef]
- Galloway, D.L.; Hudnut, K.W.; Ingebritsen, S.; Phillips, S.P.; Peltzer, G.; Rogez, F.; Rosen, P. Detection of aquifer system compaction and land subsidence using interferometric synthetic aperture radar, Antelope Valley, Mojave Desert, California. Water Resour. Res. 1998, 34, 2573–2585. [Google Scholar] [CrossRef]
- Tolman, C.F.; Poland, J.F. Ground-water, salt-water infiltration, and ground-surface recession in Santa Clara Valley, Santa Clara County, California. Eos Trans. Am. Geophys. Union 1940, 21, 23–35. [Google Scholar]
- Amelung, F.; Galloway, D.L.; Bell, J.W.; Zebker, H.A.; Laczniak, R.J. Sensing the ups and downs of Las Vegas: InSAR reveals structural control of land subsidence and aquifer-system deformation. Geology 1999, 27, 483–486. [Google Scholar] [CrossRef]
- Cabral-Cano, E.; Dixon, T.H.; Miralles-Wilhelm, F.; Díaz-Molina, O.; Sánchez-Zamora, O.; Carande, R.E. Space geodetic imaging of rapid ground subsidence in Mexico City. Geol. Soc. Am. Bull. 2008, 120, 1556–1566. [Google Scholar] [CrossRef]
- Chaussard, E.; Amelung, F.; Abidin, H.; Hong, S.-H. Sinking cities in Indonesia: ALOS PALSAR detects rapid subsidence due to groundwater and gas extraction. Remote Sens. Environ. 2013, 128, 150–161. [Google Scholar] [CrossRef]
- Cigna, F.; Tapete, D. Land Subsidence and Aquifer-System Storage Loss in Central Mexico: A Quasi-Continental Investigation With Sentinel-1 InSAR. Geophys. Res. Lett. 2022, 49, e2022GL098923. [Google Scholar] [CrossRef]
- Bateson, L.; Cigna, F.; Boon, D.; Sowter, A. The application of the Intermittent SBAS (ISBAS) InSAR method to the South Wales Coalfield, UK. Int. J. Appl. Earth Obs. Geoinf. 2015, 34, 249–257. [Google Scholar] [CrossRef]
- Hoffmann, J.; Zebker, H.A.; Galloway, D.L.; Amelung, F. Seasonal subsidence and rebound in Las Vegas Valley, Nevada, observed by synthetic aperture radar interferometry. Water Resour. Res. 2001, 37, 1551–1566. [Google Scholar] [CrossRef]
- Karanam, V.; Lu, Z.; Kim, J.W. Investigation of oil well blowouts triggered by wastewater injection in the Permian Basin, USA. Geophys. Res. Lett. 2024, 51, e2024GL109435. [Google Scholar] [CrossRef]
- Lu, Z.; Danskin, W.R. InSAR analysis of natural recharge to define structure of a ground-water basin, San Bernardino, California. Geophys. Res. Lett. 2001, 28, 2661–2664. [Google Scholar] [CrossRef]
- Bhanja, S.N.; Mukherjee, A.; Rangarajan, R.; Scanlon, B.R.; Malakar, P.; Verma, S. Long-term groundwater recharge rates across India by in situ measurements. Hydrol. Earth Syst. Sci. 2019, 23, 711–722. [Google Scholar] [CrossRef]
- Ji, K.H.; Herring, T.A. Correlation between changes in groundwater levels and surface deformation from GPS measurements in the San Gabriel Valley, California. Geophys. Res. Lett. 2012, 39, L01301. [Google Scholar] [CrossRef]
- Slater, L. Near surface electrical characterization of hydraulic conductivity: From petrophysical properties to aquifer geometries—A review. Surv. Geophys. 2007, 28, 169–197. [Google Scholar] [CrossRef]
- Hanssen, R.F. Radar Interferometry: Data Interpretation and Error Analysis; Springer Science & Business Media: Berlin/Heidelberg, Germany, 2001; Volume 2. [Google Scholar]
- Lee, J. Review of remote sensing studies on groundwater resources. Korean J. Remote Sens. 2017, 33, 855–866. [Google Scholar]
- Riel, B.; Simons, M.; Ponti, D.; Agram, P.; Jolivet, R. Quantifying ground deformation in the Los Angeles and Santa Ana Coastal Basins due to groundwater withdrawal. Water Resour. Res. 2018, 54, 3557–3582. [Google Scholar] [CrossRef]
- Berardino, P.; Fornaro, G.; Lanari, R.; Sansosti, E. A new algorithm for surface deformation monitoring based on small baseline differential SAR interferograms. IEEE Trans. Geosci. Remote Sens. 2002, 40, 2375–2383. [Google Scholar] [CrossRef]
- Ferretti, A.; Prati, C.; Rocca, F. Permanent scatterers in SAR interferometry. IEEE Trans. Geosci. Remote Sens. 2001, 39, 8–20. [Google Scholar] [CrossRef]
- Kim, T.; Han, H. Analysis of surface displacement of oil sands region in Alberta, Canada using Sentinel-1 SAR time series images. Korean J. Remote Sens. 2022, 38, 139–151. [Google Scholar]
- Liu, F.; Elliott, J.; Craig, T.; Hooper, A.; Wright, T. Improving the resolving power of InSAR for earthquakes using time series: A case study in Iran. Geophys. Res. Lett. 2021, 48, e2021GL093043. [Google Scholar] [CrossRef]
- Su, G.; Xiong, C.; Zhang, G.; Wang, Y.; Shen, Q.; Chen, X.; An, H.; Qin, L. Coupled processes of groundwater dynamics and land subsidence in the context of active human intervention, a case in Tianjin, China. Sci. Total Environ. 2023, 903, 166803. [Google Scholar] [CrossRef]
- Yunjun, Z.; Amelung, F.; Aoki, Y. Imaging the hydrothermal system of Kirishima volcanic complex with L-band InSAR time series. Geophys. Res. Lett. 2021, 48, e2021GL092879. [Google Scholar] [CrossRef]
- Zhang, R.; Zhang, L.; Fang, Z.; Oguchi, T.; Merghadi, A.; Fu, Z.; Dong, A.; Dou, J. Interferometric synthetic aperture Radar (InSAR)-based absence sampling for machine-learning-based landslide susceptibility mapping: The Three Gorges Reservoir area, China. Remote Sens. 2024, 16, 2394. [Google Scholar] [CrossRef]
- Hamdi, L.; Defaflia, N.; Fehdi, C.; Merghadi, A. InSAR investigation on DRAA-douamis sinkholes in cheria northeastern of Algeria. In Proceedings of the Igarss 2020–2020 IEEE international geoscience and remote sensing symposium, Waikoloa, HI, USA, 26 September–2 October 2020; pp. 1034–1037. [Google Scholar]
- Hamdi, L.; Defaflia, N.; Merghadi, A.; Fehdi, C.; Yunus, A.P.; Dou, J.; Pham, Q.B.; Abdo, H.G.; Almohamad, H.; Al-Mutiry, M. Ground surface deformation analysis integrating InSAR and GPS Data in the karstic terrain of Cheria Basin, Algeria. Remote Sens. 2023, 15, 1486. [Google Scholar] [CrossRef]
- Nikos, S.; Ioannis, P.; Constantinos, L.; Paraskevas, T.; Anastasia, K.; Charalambos, K. Land subsidence rebound detected via multi-temporal InSAR and ground truth data in Kalochori and Sindos regions, Northern Greece. Eng. Geol. 2016, 209, 175–186. [Google Scholar] [CrossRef]
- Park, S.W.; Hong, S.H. Nonlinear modeling of subsidence from a decade of InSAR time series. Geophys. Res. Lett. 2021, 48, e2020GL090970. [Google Scholar] [CrossRef]
- Tang, W.; Zhao, X.; Motagh, M.; Bi, G.; Li, J.; Chen, M.; Chen, H.; Liao, M. Land subsidence and rebound in the Taiyuan basin, northern China, in the context of inter-basin water transfer and groundwater management. Remote Sens. Environ. 2022, 269, 112792. [Google Scholar] [CrossRef]
- Wu, S.; Liu, G.; Wang, X.; Jia, H.; Ding, Y.; Zhang, B.; Mao, W. Assessing Groundwater Level Change and Aquifer Parameters Across Los Angeles and Orange County Using InSAR Measurements and Machine Learning. IEEE J. Sel. Top. Appl. Earth Obs. Remote Sens. 2025, 18, 12559–12571. [Google Scholar] [CrossRef]
- Dou, J.; Yunus, A.P.; Merghadi, A.; Wang, X.-k.; Yamagishi, H. A comparative study of deep learning and conventional neural network for evaluating landslide susceptibility using landslide initiation zones. In Proceedings of the Workshop on World Landslide Forum, Kyoto, Japan, 2–6 November 2020; pp. 215–223. [Google Scholar]
- Yang, Y.; Dou, J.; Merghadi, A.; Liang, W.; Dong, A.; Xiong, D.; Zhang, L. Advanced Prediction of Landslide Deformation through Temporal Fusion Transformer and Multivariate Time Series Clustering of InSAR: Insights from the Badui Region, Eastern Tibet. IEEE Trans. Geosci. Remote Sens. 2024, 62, 1–19. [Google Scholar] [CrossRef]
- Yu, S.; Kim, H.-R.; Choi, E.-K.; Kim, S.-W.; Ryu, D.-W.; Kim, Y. Resilience Assessment for Aquifers close to Groundwater Wells in the Nakdong River Estuary. J. Soil Groundw. Environ. 2023, 28, 12–28. [Google Scholar]
- Becker, B.; Reichel, F.; Bachmann, D.; Schinke, R. High groundwater levels: Processes, consequences, and management. Wiley Interdiscip. Rev. Water 2022, 9, e1605. [Google Scholar] [CrossRef]
- Ko, K.; Kihm, Y.H.; Lee, H.-J. Preliminary result of lineament analysis for the potential site selection of HLW geological disposal. Econ. Environ. Geol. 2018, 51, 167–176. [Google Scholar]
- Cleveland, R.B.; Cleveland, W.S.; McRae, J.E.; Terpenning, I. STL: A seasonal-trend decomposition. J. Off. Stat. 1990, 6, 3–73. [Google Scholar]
- Werner, C.; Wegmüller, U.; Strozzi, T.; Wiesmann, A. Gamma SAR and interferometric processing software. In Proceedings of the ERS-Envisat Symposium, Gothenburg, Sweden, 16–20 October 2000; p. 1620. [Google Scholar]
- Hong, S.-H.; Wdowinski, S. Multitemporal multitrack monitoring of wetland water levels in the Florida Everglades using ALOS PALSAR data with interferometric processing. IEEE Geosci. Remote Sens. Lett. 2013, 11, 1355–1359. [Google Scholar] [CrossRef]
- Hong, S.-H.; Wdowinski, S.; Kim, S.-W. Evaluation of TerraSAR-X observations for wetland InSAR application. IEEE Trans. Geosci. Remote Sens. 2009, 48, 864–873. [Google Scholar] [CrossRef]
- Fahrland, E.; Jacob, P.; Schrader, H.; Kahabka, H. Copernicus Digital Elevation Model Product Handbook; Airbus Defence and Space—Intelligence: Potsdam, Germany, 2020. [Google Scholar]
- Goldstein, R.M.; Werner, C.L. Radar interferogram filtering for geophysical applications. Geophys. Res. Lett. 1998, 25, 4035–4038. [Google Scholar] [CrossRef]
- Costantini, M. A novel phase unwrapping method based on network programming. IEEE Trans. Geosci. Remote Sens. 1998, 36, 813–821. [Google Scholar] [CrossRef]
- Werner, C.; Wegmüller, U.; Strozzi, T.; Wiesmann, A. Processing strategies for phase unwrapping for INSAR applications. In Proceedings of the European Conference on Synthetic Aperture Radar (EUSAR 2002), Cologne, Germany, 4–6 June 2002; pp. 353–356. [Google Scholar]
- Schmidt, D.A.; Bürgmann, R. Time-dependent land uplift and subsidence in the Santa Clara valley, California, from a large interferometric synthetic aperture radar data set. J. Geophys. Res. Solid Earth 2003, 108, 2416. [Google Scholar] [CrossRef]
- Yunjun, Z.; Fattahi, H.; Amelung, F. Small baseline InSAR time series analysis: Unwrapping error correction and noise reduction. Comput. Geosci. 2019, 133, 104331. [Google Scholar] [CrossRef]
- Wright, T.J.; Parsons, B.E.; Lu, Z. Toward mapping surface deformation in three dimensions using InSAR. Geophys. Res. Lett. 2004, 31, 169–178. [Google Scholar] [CrossRef]
- Fuhrmann, T.; Garthwaite, M.C. Resolving three-dimensional surface motion with InSAR: Constraints from multi-geometry data fusion. Remote Sens. 2019, 11, 241. [Google Scholar] [CrossRef]
- Kim, S.; Han, H.; Kim, J.-W.; Jeon, Y.-B.; Lee, S.C. Analysis of Magma Activity during the Cerro Azul Volcanic Unrest in March 2017 Using Sentinel-1 DInSAR Observations. Korean J. Remote Sens. 2024, 40, 919–930. [Google Scholar] [CrossRef]
- Lee, S.; Kim, T.; Han, H.; Kim, J.-W.; Jeon, Y.-B.; Kim, J.-G.; Lee, S.C. Analysis of co-and post-seismic displacement of the 2017 Pohang earthquake in Youngilman Port and surrounding areas using Sentinel-1 time-series SAR interferometry. Korean J. Remote Sens. 2024, 40, 19–31. [Google Scholar]
- Chaussard, E.; Bürgmann, R.; Shirzaei, M.; Fielding, E.J.; Baker, B. Predictability of hydraulic head changes and characterization of aquifer-system and fault properties from InSAR-derived ground deformation. J. Geophys. Res. Solid Earth 2014, 119, 6572–6590. [Google Scholar] [CrossRef]
- Miller, M.M.; Shirzaei, M. Spatiotemporal characterization of land subsidence and uplift in Phoenix using InSAR time series and wavelet transforms. J. Geophys. Res. Solid Earth 2015, 120, 5822–5842. [Google Scholar] [CrossRef]
- Normand, J.C.; Heggy, E. InSAR assessment of surface deformations in urban coastal terrains associated with groundwater dynamics. IEEE Trans. Geosci. Remote Sens. 2015, 53, 6356–6371. [Google Scholar] [CrossRef]
- Zhang, X.; Cheng, Z.; Xu, B.; Gui, R.; Hu, J.; Yang, C.; Yang, Q.; Xiong, T. Coupling the relationship between land subsidence and groundwater level, ground fissures in Xi’an city using multi-orbit and multi-temporal InSAR. Remote Sens. 2023, 15, 3567. [Google Scholar] [CrossRef]
- Galloway, D.L.; Burbey, T.J. Regional land subsidence accompanying groundwater extraction. Hydrogeol. J. 2011, 19, 1459. [Google Scholar] [CrossRef]
- Brandt, J.T.; Sneed, M.; Danskin, W.R. Detection and measurement of land subsidence and uplift using interferometric synthetic aperture radar, San Diego, California, USA, 2016–2018. Proc. Int. Assoc. Hydrol. Sci. 2020, 382, 45–49. [Google Scholar] [CrossRef]
- Mabee, S.B.; Hardcastle, K.C.; Wise, D.U. A method of collecting and analyzing lineaments for regional-scale fractured-bedrock aquifer studies. Groundwater 1994, 32, 884–894. [Google Scholar] [CrossRef]
- Solomon, S.; Quiel, F. Groundwater study using remote sensing and geographic information systems (GIS) in the central highlands of Eritrea. Hydrogeol. J. 2006, 14, 1029–1041. [Google Scholar] [CrossRef]
- Akinluyi, F.O.; Olorunfemi, M.O.; Bayowa, O.G. Investigation of the influence of lineaments, lineament intersections and geology on groundwater yield in the basement complex terrain of Ondo State, Southwestern Nigeria. Appl. Water Sci. 2018, 8, 49. [Google Scholar] [CrossRef]
- Epuh, E.E.; Okolie, C.J.; Daramola, O.E.; Ogunlade, F.S.; Oyatayo, F.J.; Akinnusi, S.A.; Emmanuel, E.-O.I. An integrated lineament extraction from satellite imagery and gravity anomaly maps for groundwater exploration in the Gongola Basin. Remote Sens. Appl. Soc. Environ. 2020, 20, 100346. [Google Scholar] [CrossRef]
- Ahmadi, H.; Pekkan, E. Fault-based geological lineaments extraction using remote sensing and GIS—A review. Geosciences 2021, 11, 183. [Google Scholar] [CrossRef]
- Yang, Q.; Zhang, X.; Hu, J.; Gui, R.; Yang, L. Estimation of Land Deformation and Groundwater Storage Dynamics in Shijiazhuang–Baoding–Cangzhou–Hengshui Using Multi-Temporal Interferometric Synthetic Aperture Radar. Remote Sens. 2024, 16, 1724. [Google Scholar] [CrossRef]
- Zhao, D.; Chen, B.; Gong, H.; Lei, K.; Zhou, C.; Hu, J. Unraveling the Deformation and Water Storage Characteristics of Different Aquifer Groups by Integrating PS-InSAR Technology and a Spatial Correlation Model. IEEE J. Sel. Top. Appl. Earth Obs. Remote Sens. 2023, 17, 2501–2515. [Google Scholar] [CrossRef]
- Zhao, X.; Tang, W.; Hao, G.; Zhao, H.; Xiong, W. Characterizing aquifer properties in the Taiyuan Basin, Northern China, using ground deformation from Sentinel-1 InSAR time series analysis. J. Hydrol. Reg. Stud. 2025, 58, 102313. [Google Scholar] [CrossRef]
- Chen, C.-T.; Hu, J.-C.; Lu, C.-Y.; Lee, J.-C.; Chan, Y.-C. Thirty-year land elevation change from subsidence to uplift following the termination of groundwater pumping and its geological implications in the Metropolitan Taipei Basin, Northern Taiwan. Eng. Geol. 2007, 95, 30–47. [Google Scholar] [CrossRef]
- Tang, W.; Zhao, X.; Wang, J.; Motagh, M.; Xu, H.; Ru, Z.; Wang, Y. Land surface response to groundwater drawdown and recovery in Taiyuan city, Northern China, analyzed with a long-term elevation change measurements from leveling and multi-sensor InSAR. J. Hydrol. 2024, 641, 131781. [Google Scholar] [CrossRef]
- Kumar, H.; Syed, T.H.; Amelung, F.; Mirzaee, S.; Venkatesh, A.; Agrawal, R. InSAR reveals recovery of stressed aquifer systems in parts of Delhi, India: Evidence for improved groundwater management. Water Resour. Res. 2025, 61, e2024WR037704. [Google Scholar] [CrossRef]
- Parker, A.L.; Pigois, J.-P.; Filmer, M.S.; Featherstone, W.E.; Timms, N.; Penna, N.T. Land uplift linked to managed aquifer recharge in the Perth Basin, Australia. Int. J. Appl. Earth Obs. Geoinf. 2021, 105, 102637. [Google Scholar] [CrossRef]
Disclaimer/Publisher’s Note: The statements, opinions and data contained in all publications are solely those of the individual author(s) and contributor(s) and not of MDPI and/or the editor(s). MDPI and/or the editor(s) disclaim responsibility for any injury to people or property resulting from any ideas, methods, instructions or products referred to in the content. |
© 2025 by the authors. Licensee MDPI, Basel, Switzerland. This article is an open access article distributed under the terms and conditions of the Creative Commons Attribution (CC BY) license (https://creativecommons.org/licenses/by/4.0/).