Highlights
What are the main findings?
- The nonlinear influence of vegetation on backscatter and soil moisture across varying coverage levels is further complicated by the saturation effect of conventional NDVI in densely vegetated areas. This saturation limits its utility for effective vegetation correction in soil moisture retrieval.
- With extended soil moisture retrieval time series, surface roughness can no longer be treated as a constant in change detection methods.
What are the implications of the main findings?
- Extreme values of backscatter and soil moisture were calibrated across varying vegetation coverage densities. This study proposes a new vegetation index, the NDEVI, which is optimized to correct for vegetation impacts in densely vegetated regions.
- The DBSCAN algorithm divided long-time series into invariant periods to ensure temporal consistency of surface parameters while filtering out abnormal events.
Abstract
Although surface soil moisture (SSM) is particularly important in crop yield prediction, irrigation scheduling optimization, and runoff generation mechanisms, accurate monitoring of time-series SSM is still challenging for agricultural and hydrological research. This study presented an improved approach integrating Sentinel-1 C-band SAR and MODIS optical data (2019–2020) to estimate surface soil moisture. To address vegetation effects, we developed a piecewise function using fractional vegetation coverage (FVC) to correct soil moisture and backscatter extrema and established the normalized difference enhanced vegetation index (NDEVI) to characterize backscatter-vegetation relationships across various land covers. Furthermore, the Density-Based Spatial Clustering of Applications with Noise (DBSCAN) algorithm identified anomalous surface changes, enabling segmentation of long-term series into invariant periods that satisfy the change detection method assumptions. Validation in the Shandian River Basin demonstrated significant improvement over traditional methods, achieving determination coefficients (R2) of 0.844 and root mean square errors (RMSE) of 0.030 m3/m3. The method effectively captured soil moisture dynamics from precipitation and irrigation events, providing reliable monitoring in heterogeneous landscapes. This integrated approach offers a robust technical framework for multi-source remote sensing of soil moisture in semi-arid areas, enhancing capability for agricultural water resource management.
1. Introduction
Surfaces soil moisture (SSM) is a pivotal variable in the Earth system, playing a critical role in regulating land–atmosphere energy exchange [1,2,3]. In addition, soil moisture is also the cornerstone of the ecosystem, which directly affects the growth and distribution of plants, thus affecting the yield and quality of crops [4,5]. Hence, accurate and detailed knowledge of the spatial and temporal distribution of soil moisture is critical for the development of contemporary agriculture, such as climate variability [6,7], drought detection [8], flood warning [9], and crop yield prediction [10].
Over the past few decades, several soil moisture inversion models have been developed, including theoretical models such as the Integral Equation Model (IEM) [11] and Advanced Integral Equation Model (AIEM) [12], semi-empirical models such as the Dubois [13], WCM [14], and MIMICS [15] models, empirical models including various linear regression approaches [16], and numerical models like the Numerical Maxwell Model in 3D (NMM3D) [17]. However, these models exhibit the following notable limitations: theoretical and semi-empirical models demand extensive surface parameters that are often challenging to acquire, while empirical models suffer from limited transferability due to their site-specific nature, and numerical models face computational constraints that hinder large-scale implementation. These inherent limitations currently restrict the broad application of model-based inversion methods in soil moisture monitoring.
Compared with model-based approaches, soil moisture inversion utilizing time-series data offers distinct advantages by eliminating the requirement for prior surface parameter inputs such as soil roughness, rendering it particularly suitable for long-term and large-scale monitoring applications. Various effective methods have been developed in this domain, including the change detection technique (CD) [18], Alpha approximation model [19], and Multitemporal Least Square Moisture Estimator (MULESME) [20]. These approaches demonstrate notable operational simplicity while maintaining robust performance, leading to their widespread adoption in surface soil moisture retrieval studies.
The change detection method assumes that during the observation period, the influence of surface roughness and vegetation change on radar backscattering coefficient is smaller than that of soil moisture change. The change in radar backscattering coefficient is mainly caused by the change in soil moisture [21]. In recent years, researchers have conducted extensive studies on soil moisture inversion using change detection methods and have implemented various improvements to this approach [22,23]. Wagner et al. [18] pioneered the change detection method in 1999, successfully retrieving soil moisture from European Remote Sensing satellite (ERS) scatterometer data. This innovative approach eliminates the need for complex parameter inputs and auxiliary data while fully leveraging the advantages of time-series remote sensing observations. Zribi et al. [24] incorporated Normalized Difference Vegetation Index (NDVI) to correct variations in radar backscattering coefficients, thereby improving the method’s applicability to vegetation-covered surfaces, provided a new direction for subsequent research. Bhogapurapu et al. [25] improved the technique by utilizing the Dual-polarization Radar Vegetation Index (DpRVI), demonstrating superior soil moisture retrieval performance compared to NDVI-based corrections. Nativel et al. [26] combined the change detection method considering vegetation with the neural network algorithm and used the hybrid algorithm to improve the soil moisture estimation in different climate environments. Current methodological improvements focus not only on vegetation parameter integration but also on radar incidence angle normalization to further enhance change detection accuracy [27,28].
However, due to the increasing use of remote sensing data, the impact of surface vegetation and soil roughness changes on soil moisture changes cannot be ignored in long-term sequence data analysis [29,30]. Currently, most studies focus on correcting the vegetation effects of land cover. These studies have certain limitations. Due to the dynamic evolution of agricultural practice and natural erosion, the change in soil roughness also significantly affects the radar backscatter signal, but it is usually not fully processed or assumed to be time-invariant. Therefore, the accuracy of soil moisture inversion based on change detection method depends largely on the correction effect of vegetation influence. In terms of vegetation correction, NDVI is the most commonly used vegetation index to correct the impact of vegetation [31,32]. However, in high-density vegetation coverage areas, such as dense canopies during the peak growing season, NDVI has the problem of oversaturation and cannot accurately describe ground vegetation conditions, leading to residual errors in the subsequent soil moisture retrieval. Moreover, although machine learning has been widely used in direct inversion of soil moisture, there are still some deficiencies in its combination with the change detection framework [33]. Many attempts still remain on the surface, such as using only machine learning for post-processing, rather than deeply integrating it into the core assumptions of the change detection algorithm. This gap highlights the great potential of methodological innovation.
The primary objective of this study is to develop an enhanced change detection methodology for estimating time-series soil moisture. Specifically, to address the confounding interference of vegetation coverage on surface soil moisture estimation and to establish a more robust correspondence between variations in the radar backscattering coefficient and actual soil moisture dynamics, a piecewise function grounded in fractional vegetation coverage (FVC) is introduced. This function is designed to resolve the inherent mismatch problem in traditional change detection techniques, thereby augmenting the accuracy of soil moisture retrieval. Furthermore, acknowledging the limitations associated with relying on a single vegetation index (e.g., NDVI) for vegetation correction, a novel vegetation index is proposed to more comprehensively capture the influence of vegetation on radar backscattering coefficients within the study area. Concurrently, to uphold the fundamental assumption of time-invariant surface roughness that underpins change detection-based soil moisture retrieval and to mitigate spurious soil moisture variations induced by anthropogenic or natural disturbances, this study implements the Density-Based Spatial Clustering of Applications with Noise (DBSCAN) algorithm. This methodology facilitates the systematic identification of abnormal events related to dynamics in surface roughness and soil moisture across the entire time series, thus ensuring the validity of the constant-roughness prerequisite that is critical for robust soil moisture estimation. A time series characterized by stable surface roughness conditions is subsequently selected to guarantee the effectiveness and precision of the soil moisture inversion algorithm. The organization of this paper is as follows: Section 2 describes the study area and the dataset used. Section 3 describes the traditional change detection method and improved change detection method in detail. Section 4 presents the inversion results derived from different methods. Section 5 shows comparative analysis and discussion. Finally, Section 6 encapsulates the concluding remarks.
2. Materials and Methods
2.1. Study Area
The study area of the Shandian river basin selected in this study is located at the junction of Inner Mongolia Autonomous Region and Hebei Province in China, covering the southern Zhenglan Banner and Duolun of Xilin Gol League in Inner Mongolia Autonomous Region. It is the source of the Luanhe River. The terrain in the study area is relatively flat. The land use types are mainly farmland, grassland, and forest, including a small amount of bare land and buildings; the main crops in farmland include potatoes, corn and so on. The average altitude is about 1400 m. The land area is about 11,078 km2. The study area is dry and rainy in spring, with high temperatures and rain in summer, and there is an obvious permafrost period every year. The annual temperature difference and rainfall difference are large, and the rainfall is mostly concentrated from July to September, which belongs to the typical temperate continental climate (Figure 1) [34]. The land use data utilized in this study were obtained from the 2020 Remote Sensing Monitoring Dataset of Land Use Status in China, provided by the Resource and Environmental Science Data Center of the Chinese Academy of Sciences (https://www.resdc.cn). This raster dataset features a spatial resolution of 1 km.
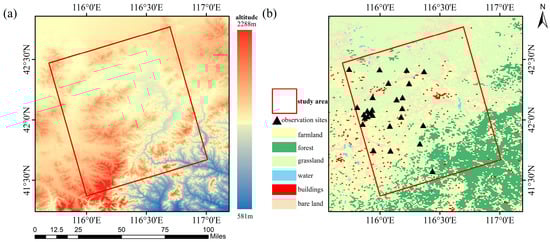
Figure 1.
(a) Elevation of the study area, (b) site distribution of the study area.
2.2. Data
2.2.1. Sentinel-1 Data
The Sentinel series of satellites was developed by the European Space Agency (ESA) for the implementation of the Copernicus program. Currently, four series of satellites (Sentinel-1/2/3/5) covering radar and optical satellites have been developed, playing an important role in land and ocean monitoring, climate change, and air quality research. Sentinel-1 is a dual-polarization radar imaging system based on the C-band, with a frequency of 5.405 GHz [35].
Considering the research area and research time selected in this study, Sentinel-1A satellite data were selected. The Sentinel-1A data are a Level-1 GRD product in interferometric wide-format (IW) mode with a spatial resolution of up to 10 m [36]. The data were provided by the Alaska Satellite Facility (ASF). According to the geographical location of the study area and the time range of soil moisture data recorded by the observation stations, the Sentinel-1A satellite image data from 2019 to 2020 were downloaded. The time series are shown in Table 1.

Table 1.
Time series of Sentinel-1 data in the study area.
The batch pre-processing of Sentinel-1A SAR data was carried out using the SNAP 11.0.0 software provided by ESA, which mainly includes the steps of orbit correction, thermal noise removal, radiometric calibration, speckle filtering, and terrain correction. Combined with the latitude and longitude information of the ground observation stations, the VV polarization backscattering coefficient and the VH polarization backscattering coefficient of the corresponding pixels are extracted in batches. Finally, the spatial resolution of remote sensing images is unified.
2.2.2. MODIS Data
The main high spatial resolution optical remote sensing satellites that provide data free of charge are Landsat-8 and Sentinel-2. However, the temporal resolution of these two satellites is low in the study area, and the image data are seriously affected by clouds, which leads to poor data completeness in the study period. Therefore, in this research, MOD13Q1 and MYD13Q1 L3-Level vegetation index products from Terra and Aqua satellites are selected to correct the influence of vegetation on radar backscattering coefficients and soil moisture. The spatial resolution of MOD13Q1 and MYD13Q1 data is 250 m, and the temporal resolution of a single dataset is 16d. The combination of the two datasets improves the temporal resolution to 8d.
Considering vegetation is influenced by soil moisture with a lag effect, and the time resolution of MODIS data is not completely consistent with that of Sentinel-1 data, the cubic spline interpolation method is used to interpolate the filtered NDVI and EVI data. The interpolated vegetation index data are consistent with the Sentinel-1 data in time. Given the spatial resolution discrepancy between Sentinel-1 and MODIS data, we performed a resampling of the Sentinel-1 data to 250 m to facilitate the subsequent spatial distribution analysis of soil moisture.
2.2.3. In Situ Data
We had chosen the “In-situ measurement data set of the soil moisture and temperature wireless sensor network within the Shandian river basin” as the study dataset [37]. This dataset is provided by the National Qinghai–Tibet Plateau Data Center (TPDC, http://data.tpdc.ac.cn/en/).
The dataset contains measured data on soil moisture and soil temperature from 34 observation sites of the “Soil moisture and temperature wireless sensor network within the Shandian river basin” (SMN-SDR), with 34 observation stations divided into three sampling scales as follows: large scale (100 km), medium scale (50 km), and small scale (10 km) [38]. The time interval for data measurement is 15 min, covering the period from 2019 to 2020.
According to the Sentine-1A satellite observation time, the soil moisture and soil temperature data in the in situ measurement data closest to the satellite observation time are extracted, and the time difference is less than 10 min. Considering the penetration of C-band synthetic aperture radar to surface soil, this study used soil moisture data at a depth of 5 cm in the dataset. Data from 26 sites in the Shandian River Basin were used for validation based on data availability.
Among the 26 monitoring sites, land use distribution comprised 16 grassland sites, 6 farmland sites, and 4 bare-soil sites. Analysis reveals substantial soil moisture variation among different grassland and bare soil sites, while cultivated land exhibits relatively homogeneous moisture conditions across sites. The selected sites comprehensively represent the key land use types characteristics of agricultural-pastoral regions. Given that the study area constitutes a typical farming-pastoral ecotone where both croplands and grasslands demonstrate extensive patchy distribution patterns, the site-level land use classifications were considered representative of the actual land use characteristics at the regional scale.
2.2.4. Soil Moisture Dataset
To obtain the soil moisture dry and wet reference value and soil moisture verification data needed for this study, the daily all-weather surface soil moisture data with 1 km resolution in China are selected to integrate the reference value of soil moisture dry and wet and the verification data of soil moisture [39]. The data are from the TPDC (http://data.tpdc.ac.cn/en/) [40].
The product is generated by downscaling the SSM based on AMSR-E and AMSR-2 at 36 km, covering all on-orbit time of the two radiometers from 2003 to 2023. This study selects the data from 2019 to 2020 in the study area of this dataset. The highest and lowest values of soil moisture in the study area in the time series were obtained respectively.
3. Methods
3.1. Improved Change Detection Method Based on Vegetation Coverage
Change detection method was first proposed by Wagner et al. [18], and soil moisture was inverted based on change detection method using ERS scatterometer data. Therefore, soil moisture can be retrieved by calculating the difference in backscattering coefficients, as shown in Equations (1) and (2).
where is the difference between the radar backscatter coefficient corresponding to observation time and the minimum value of the radar backscatter coefficient during the observation period, which is called the change in radar backscatter coefficient. and represent the minimum and maximum values of the radar backscatter coefficient during the observation period, respectively. and represent the minimum and maximum values of soil moisture during the observation period, respectively; is the soil moisture inverted by the change detection method.
Zribi et al. [24] found that vegetation coverage reduces the sensitivity of the radar backscattering coefficient to soil moisture, and the sensitivity of the radar backscattering coefficient to soil moisture decreases with an increase in the NDVI, as shown in Figure 2 [23].
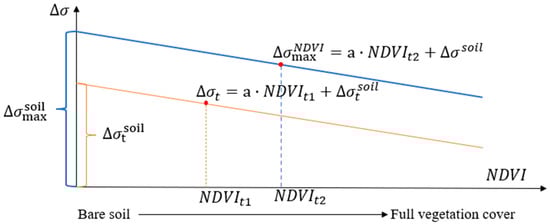
Figure 2.
Relationship between the change in radar backscattering coefficient and NDVI.
Subsequently, Zribi et al. [24] corrected the variation in the radar backscattering coefficients based on NDVI (as shown in Equations (3) and (4)), which enhanced the applicability of change detection method in vegetation-covered areas.
where is the maximum value of the change in radar backscattering coefficient fitted with NDVI, which decreases with increasing NDVI. is the function of NDVI, and represents the fitting coefficient [23].
Optical remote sensing data, being particularly responsive to vegetation characteristics, have been extensively employed to quantify canopy properties. Among various vegetation indices, the Normalized Difference Vegetation Index (NDVI) [41] has become standard metrics in numerous studies for both characterizing vegetation status and accounting for vegetation-induced modifications to soil surface backscattering signals. The statistical model based on NDVI remote sensing vegetation index uses clear parameterized expressions to associate a limited number of spectral bands with surface vegetation cover [42,43]. It is the most commonly used type of remote sensing vegetation index and currently the most popular and widely used model in optical remote sensing estimation. Fraction vegetation coverage (FVC) can be represented by NDVI [44,45], as shown in Equation (5):
Although many studies have been conducted to improve change detection method based on different vegetation indices, these studies only considered the effect of vegetation cover on the radar backscattering coefficient rather than the effect of vegetation cover on soil moisture. As vegetation coverage increases, its influence on radar backscattering coefficients manifests through multiple interconnected mechanisms. First, vegetation canopy introduces nonlinear modifications to radar backscattering characteristics, with the effect magnitude growing disproportionately with increasing coverage density. Second, enhanced vegetation coverage alters the hydrological regime through improved water retention capacity and plant transpiration processes—complex interactions that cannot be treated as mutually canceling effects [46]. Therefore, it is necessary to consider the influence of vegetation coverage on surface soil moisture when inverting soil moisture in vegetation coverage area based on change detection method [47,48].
According to the FVC, the surface conditions are divided into low vegetation coverage area (0 < FVC ≤ 0.3), medium vegetation coverage area (0.3 < FVC ≤ 0.6), and high vegetation coverage area (0.6 < FVC ≤ 1.0). This setting of FVC threshold is based on the study of Zhang et al. [49]. By analyzing the relationship between vegetation index and radar backscattering coefficient and the relationship between vegetation coverage and soil moisture, it is found that the minimum and maximum values of radar backscattering coefficient will increase with the increase in FVC, and the minimum and maximum values of soil moisture will also be affected by the increase in FVC. Therefore, when inverting the soil moisture in the vegetation coverage area based on the change detection method, it is necessary to correct the radar backscattering coefficient and soil moisture based on FVC.
Based on FVC, the minimum and maximum values of radar backscattering coefficient and soil moisture under different surface coverage conditions are corrected, and an improved change detection method is obtained. The equations are as follows:
where and represent the minimum and maximum values of radar backscattering coefficients under the surface coverage conditions corresponding to NDVI, respectively. and represent the minimum and maximum values of soil moisture under the surface coverage conditions corresponding to NDVI, respectively.
3.2. Composite Vegetation Index
The current change detection algorithms mainly rely on the statistical relationship between the change in backscattering coefficient and the spatial distribution of NDVI features for vegetation effect correction. However, vegetation correction using a single vegetation index introduces substantial uncertainty and proves inadequate for complete vegetation influence removal. While NDVI demonstrates reasonable sensitivity in low-to-medium vegetation coverage areas, its effectiveness significantly diminishes in dense vegetation conditions due to index saturation, resulting in compromised characterization of underlying vegetation dynamics [50].
Compared to NDVI, EVI incorporates both atmospheric and soil background correction factors, demonstrating greater sensitivity to green vegetation and a wider dynamic range [51]. This enhanced capability enables more accurate characterization across varying surface vegetation densities, effectively addressing NDVIs saturation limitations in dense canopies while better capturing seasonal vegetation dynamics. More recently, the kNDVI (8) has been introduced as an advanced solution to mitigate the nonlinearity and saturation issues inherent in traditional NDVI-vegetation relationships [52,53].
Considering the significant role of vegetation canopy interception in radar backscattering mechanisms, it is well established that the relationship between vegetation coverage and its influence on backscattering coefficients is fundamentally nonlinear. This complexity arises from the distinctive characteristics of existing vegetation indices: NDVI demonstrates reasonable sensitivity in sparse vegetation conditions but suffers from saturation effects in densely vegetated areas [50]; EVI maintains better sensitivity to vegetation dynamics through its soil-adjusted formulation [54]; meanwhile, kNDVI effectively captures nonlinear vegetation-backscattering relationships through kernel-based transformations [55]. To harness the complementary advantages of these indices while addressing their respective limitations, this study develops a novel composite vegetation index (NDEVI) that synergistically integrates the optimal characteristics of NDVI, EVI, and kNDVI. The calculation equations of NDEVI are presented as follows:
The core physical significance of NDEVI lies in its design as an adaptive hybrid vegetation index. Its primary objective is to achieve superior monitoring across the entire vegetation gradient—from sparse to dense—through a dynamic weighting mechanism. The physical rationale of the index is underpinned by two key components as follows: the term mathematically represents the uncertainty or information content of NDVI itself. Its physical role is to automatically identify and assign greater weight to the medium vegetation coverage range, where NDVI exhibits its highest sensitivity and discriminative power. The term functions as a conditional enhancer. Here, the NDVI value acts as a switch: it suppresses the contribution of kEVI in sparse vegetation, while enabling a smooth transition to kEVI dominance when high NDVI values indicate dense foliage. This mechanism effectively resolves the prevalent issue of spectral saturation encountered by the original NDVI in high-coverage regions. Ultimately, through this intrinsic fusion logic, NDEVI achieves a more robust and continuous retrieval capability for canopy biophysical parameters, such as Leaf Area Index (LAI).
The NDEVI developed in this study effectively combined the advantages of the three vegetation indices. This composite vegetation index can achieve accurate vegetation monitoring under all coverage conditions and can more sensitively capture the nonlinear relationship between vegetation index and surface vegetation coverage. At the same time, it overcomes the saturation limit of traditional indices in dense vegetation.
3.3. Dividing Invariant Time Series
The assumption of inversion of soil moisture by change detection method is that in a certain time series range, the surface roughness is constant, and the change in radar backscattering coefficient is only related to the change in soil moisture, and then the relative water content of soil is estimated according to the change in backscattering coefficient.
However, the study area represents a typical farming-pastoral transition zone dominated by three land cover types as follows: farmland, grassland, and forest. This specific ecosystem context introduces important challenges to the fundamental assumptions of change detection methods. Agricultural operations (e.g., plowing, harvesting) and pastoral activities (particularly grazing) frequently induce abrupt changes in surface roughness. These anthropogenic disturbances often cause corresponding sudden shifts in SAR backscatter characteristics, thereby violating the key assumption of constant surface conditions during the monitoring period. Moreover, both anthropogenic activities (e.g., irrigation) and natural events (e.g., rainfall) can trigger abrupt increases in soil moisture within the study area. Under consistent vegetation coverage conditions, such abrupt hydrological changes induce significant fluctuations in soil moisture levels and corresponding sudden shifts in radar backscattering coefficients. These anomalous signal variations violate the fundamental assumptions of change detection methods, consequently compromising the accuracy and reliability of soil moisture retrieval.
In dual-polarization SAR data, these values can be regarded as time nodes in the time series of backscattering coefficients, and the sharp change in soil roughness and soil moisture is an abnormal event that can be detected in the SAR feature space [22]. In the semi-arid Mediterranean agricultural region, Graldi et al. [28] used the DBSCAN algorithm based on , , and to exclude changes in the total backscatter signal due to dramatic changes in soil roughness and soil moisture from the dataset. While this methodology has been validated in conventional agricultural settings, its reliability and effectiveness remain unverified for farming-pastoral ecotones like our study area.
DBSCAN is a density-based clustering algorithm that can find clusters of any shape and effectively process noise (neighborhood radius ε and minimum number of points MinPts). The DBSCAN algorithm has been widely applied for outlier detection in various domains, such as identifying stop/move points in GPS trajectories [56] and detecting anomalous subsequences/outliers in aquaculture environments, demonstrating its broad application prospects [57]. In this study, the way of determining ε and MinPits selected in Graldi’s study was used. The ε parameter was determined through k-dist analysis by calculating the distance from each point to its fourth nearest neighbor in the 3D space, with the optimal value identified at the intersection of the two trend lines representing the data distribution. The MinPts parameter was set to four, corresponding to the dimensionality of our 3D dataset. For dual-polarization C-band SAR images, and can be used to detect soil roughness and soil moisture changes caused by emergencies such as agricultural or animal husbandry events after optimizing feature space selection.
Following vegetation correction using vegetation indices, this study applied the DBSCAN algorithm to identify transition points of soil roughness variation within the study area. The algorithm segments the long-term time series into multiple discrete intervals characterized by stable surface roughness conditions, based on the identified cluster structures and noise points. These partitioned time periods represent hydrological conditions unaffected by irrigation, rainfall, and other disturbance events, thereby satisfying the constant-roughness assumption essential to change detection methodology while minimizing anthropogenic impacts on the relationship between soil roughness and backscattering coefficients. Figure 3 presents the workflow of the enhanced change detection methodology developed in this study.
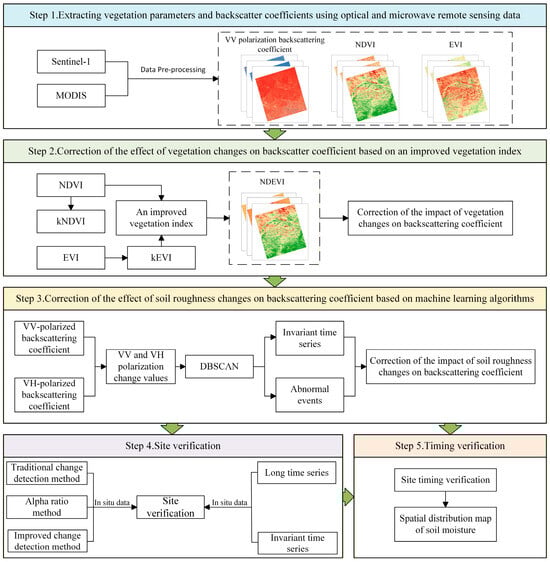
Figure 3.
Flow chart of the improved change detection method in this study.
4. Results
4.1. Analysis of the Influence of Surface Vegetation Coverage
To systematically evaluate the impact of vegetation coverage on soil moisture estimation in vegetated areas, this study utilized 58-scene Sentinel-1 VV-polarization time series data (2019–2020) acquired over the Shandian river basin. Comparative analysis was conducted using three distinct approaches: (a) the change detection method without vegetation correction developed by Wagner, (b) the unified vegetation correction approach introduced by Zribi, and (c) the proposed FVC-segmented correction method presented in this paper. Figure 4 visually demonstrated the performance differences among these three methodologies, highlighting the progressive improvements in addressing vegetation effects across varying coverage conditions.
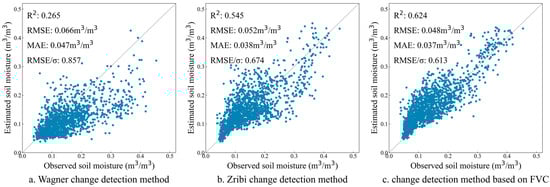
Figure 4.
The results of soil moisture content estimation based on various change detection methods.
To quantitatively evaluate the accuracy of soil moisture estimation using different change detection methods, this study calculated the coefficient of determination (R2), root mean square error (RMSE), and mean absolute error (MAE) between estimated and measured soil moisture values. In addition, we employed the RMSE/σ index to evaluate model accuracy. The results demonstrated that Wagner’s change detection method, which does not account for the influence of vegetation coverage on backscattering coefficients, significantly underestimates soil moisture content compared to field measurements. Consequently, this approach proves unsuitable for areas with high vegetation density. Zribi’s improved change detection method incorporates vegetation’s linear influence on backscattering coefficients, demonstrating measurable improvements over Wagner’s baseline approach. The modified method addresses the systematic underestimation observed in the original technique, elevating R2 to 0.545 while substantially reducing both RMSE and MAE values. However, this linear correction introduced a new systematic bias—significant overestimation of soil moisture content—particularly in densely vegetated areas. This limitation stems from the following two fundamental factors: the inherently nonlinear relationship between vegetation density and backscattering response, and NDVI’s characteristic saturation behavior under high vegetation coverage conditions, which prevents accurate characterization of vegetation-scattering dynamics in dense canopies. To address the nonlinear relationship between vegetation coverage and backscattering behavior, this study proposed an FVC-segmentation change detection approach that implements distinct vegetation correction schemes for low (0 < FVC ≤ 0.3), medium (0.3 < FVC ≤ 0.6), and high (0.6 < FVC ≤ 1.0) vegetation coverage conditions. This methodology effectively mitigated the systematic overestimation observed in Zribi’s unified correction approach, yielding substantial metric improvements: R2 increased from 0.265 to 0.624, RMSE decreased from 0.066 to 0.048 m3/m3, MAE reduced from 0.047 to 0.037 m3/m3, and RMSE/σ reduced from 0.857 to 0.613. Nevertheless, residual overestimation persists due to inherent limitations of the NDVI, particularly its saturation tendency in dense vegetation scenarios that constrains complete characterization of vegetation-scattering dynamics.
4.2. Comparison of Different Vegetation Index
Building upon the FVC-segmentation correction, this study further implemented vegetation correction using six different vegetation indices: three single indices (NDVI, kNDVI, EVI) and three composite indices (NDVI + kNDVI, NDVI + EVI, NDEVI). Taking site M9 as an example, Figure 5 demonstrates the temporal profiles of the six vegetation indices across the study area.
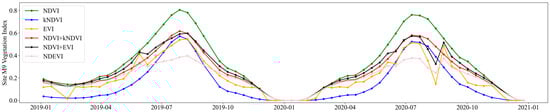
Figure 5.
The temporal dynamics of the six vegetation indices.
The performance of each vegetation index configuration was rigorously validated against synchronous in situ soil moisture measurements, enabling comprehensive comparison between single and composite vegetation indices for vegetation effect compensation. Figure 6 presented scatter plot comparisons of the soil moisture retrieval results obtained from these six vegetation correction approaches, visually demonstrating their relative effectiveness in mitigating vegetation influences.
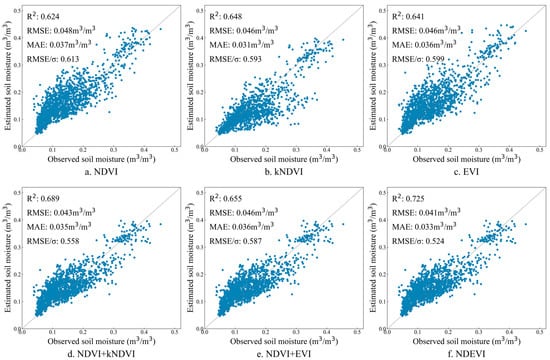
Figure 6.
Estimation of soil moisture based on vegetation index after correcting the influence of vegetation: (a) NDVI, (b) kNDVI, (c) EVI, (d) NDVI + kNDVI, (e) NDVI + EVI, (f) NDEVI.
As shown in Figure 6, the soil moisture content in the Shandian river basin primarily ranges between 5% and 45%, exhibiting significant seasonal variation throughout the year. Following vegetation correction, soil moisture retrieval using the single indices NDVI and EVI yielded comparable results, with EVI demonstrating marginally superior performance to NDVI. However, both indices exhibited a consistent tendency toward slight overestimation. In contrast, the kNDVI approach—which accounts for nonlinear relationships between vegetation indices and surface vegetation characteristics—effectively mitigated the overestimation issue observed with NDVI and EVI. Nevertheless, kNDVI introduced a new systematic bias characterized by pronounced underestimation, while achieving overall accuracy levels similar to those of NDVI and EVI. The implementation of composite vegetation indices—specifically NDVI + kNDVI, NDVI + EVI, and the proposed NDEVI—yielded measurable improvements in estimation accuracy. While the NDVI + EVI combination offered only marginal enhancement over its individual components and failed to resolve the fundamental limitations associated with either index alone, the NDVI + kNDVI configuration demonstrated more substantial progress. This improvement underscored the value of incorporating nonlinear relationships between surface vegetation and index responses for enhanced vegetation correction. However, this approach remained constrained by NDVI’s inherent limitations, particularly its saturation characteristics in dense vegetation conditions. The composite vegetation index NDEVI proposed in this study, developed to address the limitations of single indices and to better represent the nonlinear relationships between surface vegetation and spectral responses, demonstrated the most substantial improvement in estimation accuracy. Comparative analysis of all six vegetation indices reveals that NDEVI achieved superior performance metrics: when compared to traditional NDVI-based vegetation correction, the determination coefficient R2 increased from 0.624 to 0.725, RMSE decreased from 0.048 to 0.041 m3/m3, MAE decreased from 0.037 to 0.033 m3/m3, RMSE/σ decreased from 0.613 to 0.524. These quantitative results confirmed that the improved change detection model incorporating NDEVI significantly outperformed the original approach.
4.3. Analysis of Vegetation Impact Correction Under Different Vegetation Coverage
Taylor diagrams were generated for six vegetation indices across different vegetation coverage levels (Figure 7). The analysis revealed that following FVC-segmentation correction, most vegetation indices demonstrated optimal performance in medium vegetation coverage conditions, while maintaining satisfactory results in both low and high coverage scenarios. The proposed NDEVI consistently achieved strong correlation coefficients between estimated and measured soil moisture values across all vegetation density conditions. Furthermore, NDEVI exhibited the lowest root mean square error among all evaluated indices, confirming its superior accuracy in soil moisture retrieval. Under high vegetation coverage conditions (d), where retrieval challenges were most pronounced, the robustness of NDEVI become decisively evident. It is the only index capable of simultaneously maintaining high correlation (>0.8) and realistic standard deviation, while all other indices—including alternative composite indices—exhibited significant performance degradation. This consistent superiority across vegetation gradients confirms NDEVI’s unique ability to mitigate vegetation effects while preserving soil moisture distribution characteristics.
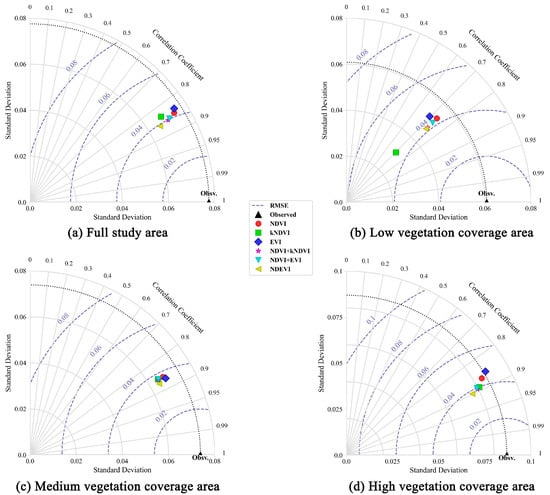
Figure 7.
Taylor diagram of removing vegetation effects based on various vegetation indices in different vegetation coverage areas: (a) full study area, (b) low vegetation coverage area, (c) medium vegetation coverage area, (d) high vegetation coverage area.
To further validate the effectiveness of the proposed NDEVI vegetation index, we conducted a stratified evaluation of vegetation correction performance across low, medium, and high vegetation coverage conditions using all six vegetation indices. As summarized in Figure 8, among the single vegetation indices, both NDVI and EVI demonstrate relatively better accuracy for soil moisture estimation in medium vegetation coverage areas, with EVI showing clearly superior performance compared to both NDVI and kNDVI in these conditions; NDVI and EVI’s performance degraded significantly in high vegetation coverage conditions due to the well-documented saturation effect in dense vegetation canopies [58,59]. While kNDVI produces underestimated soil moisture values in low and medium vegetation coverage areas, it achieved substantially improved performance in dense vegetation conditions (R2 = 0.789, RMSE/σ = 0.428), indicating particular suitability for high vegetation coverage scenarios despite its limited operational range. In comparison with the three single indices (NDVI, kNDVI, EVI), all composite vegetation indices yield superior results in sparsely vegetated areas. The integration of kNDVI and EVI successfully mitigated NDVI’s oversaturation problem. Among the composite vegetation indices evaluated, NDEVI demonstrated superior performance for soil moisture retrieval, achieving optimal results across all vegetation coverage levels—low, medium, and high—when compared to the other five vegetation indices. This comprehensive superiority stems from NDEVI’s capacity to integrate the respective advantages of different indices under varying vegetation conditions, enabling more effective vegetation correction throughout the entire coverage spectrum. The index exhibited particularly pronounced advantages in medium-to-high vegetation density areas, while still delivering measurable accuracy improvements in sparsely vegetated regions where vegetation effects are minimal. Consequently, NDEVI proved especially suitable for vegetation impact correction in environments characterized by significant spatial or temporal variations in vegetation coverage.
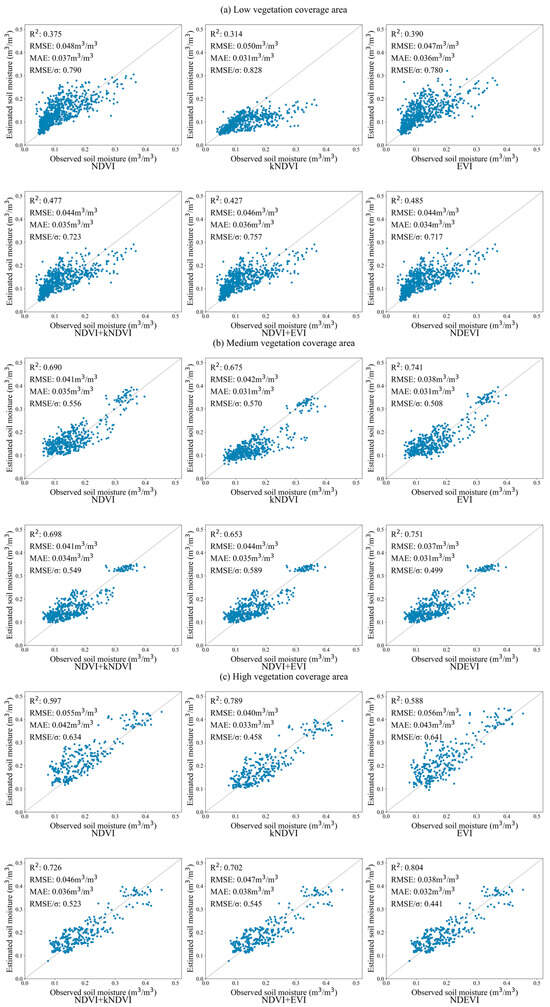
Figure 8.
Correction of vegetation effects by vegetation indexes under different vegetation coverage.
Overall, the NDEVI achieved optimal accuracy and stability in soil moisture retrieval across diverse vegetation coverage scenarios, demonstrating particular effectiveness in challenging medium-to-high vegetation density environments where conventional indices exhibit significant performance degradation. The method’s robust statistical characteristics—maintaining strong correlation while minimizing error metrics across all coverage conditions—confirmed its superior capability for reliable soil moisture monitoring in vegetated regions.
4.4. Detect Abnormal Events in the Time Series
Following vegetation correction using vegetation indices, this study applies the DBSCAN algorithm to and data to detect soil roughness transition points. This process excluded backscatter signal variations caused by abrupt soil roughness changes and it partitions the time series into segments with stable surface roughness, thereby satisfying the constant-roughness assumption essential for change detection algorithms. We conducted comprehensive testing of different parameter combinations and found that an excessively small ε value (ε = 1) resulted in over-detection of anomalies, fragmenting the time series into excessive segments and substantially increasing computational burden. Using the k-dist derived value produced normal anomaly detection and appropriate segmentation of invariant time series, ultimately enhancing the accuracy of change detection. Conversely, an overly large ε value (ε = 4) completely failed to identify anomalies, rendering the algorithm ineffective for time series segmentation. When MinPts was set too low (MinPts = 1), erroneous anomaly detection occurred with the emergence of multiple spurious clusters, while values of MinPts ≥ 4 yielded stable and consistent results without significant variation.
As shown in Figure 9, based on the DBSCAN algorithm to detect the time nodes of soil roughness changes, we monitor the abnormal events in the 58 long-term series of the study area from 2019 to 2020, and divide the long-term series into three invariant time series T1, T2, T3. Soil moisture was retrieved based on three invariant time series.
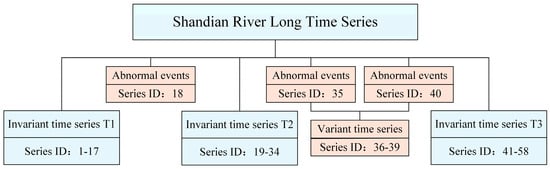
Figure 9.
Invariant timing division.
As shown in Figure 9, the algorithm successfully identified three prominent abnormal events occurring on 9 August 2019, 12 March 2020, and 11 May 2020, respectively. Of particular note was the closely spaced occurrence of the two spring 2020 abnormal events, exhibiting marked temporal discontinuity that reveals substantial instability in the underlying surface conditions during this period. From the perspective of radar remote sensing physics, these abrupt changes in backscatter coefficient are directly attributable to alterations in surface roughness and dielectric properties. Intensive spring agricultural practices such as tillage significantly modify the surface micro-scale roughness, directly disrupting the Bragg resonance conditions for radar scattering and consequently enhancing backscatter. Meanwhile, management practices including irrigation substantially increase soil moisture content, elevating the dielectric constant and thereby intensifying both volume and surface scattering mechanisms. Furthermore, characteristic summer precipitation events not only saturate the soil but may also generate surface ponding that induces specular reflection, dramatically reducing backscatter intensity, while the hydrological loading effect on vegetation canopies alters their geometric configuration to further modulate scattering characteristics. When contextualized within regional climate and land use patterns, these physical mechanisms collectively account for the observed anomalous signatures. Accordingly, we have divided the invariant time series (T1, T2, T3) unaffected by these abnormal events as stable series characterized by relatively invariant surface roughness and dielectric properties.
Soil moisture was retrieved based on three invariant time series and one variant time series; the results were shown in Figure 10. Compared with the long time series without eliminating abnormal events, the inversion of soil moisture based on three invariant time series and one variant time series achieved better results. Among them, the result of soil moisture inversion based on variant time series was the worst—R2 reached 0.735, RMSE/σ reduced to 0.486; the result of soil moisture inversion based on invariant time series T3 was the best—R2 reached 0.892, RMSE/σ reduced to 0.316. This discrepancy likely originates from the instability of surface parameters during the change time series. It can be seen that it is of great significance to divide the long time series into invariant time series. Significant variations existed in soil moisture inversion results derived from different invariant time series. To better visualize the distribution of soil moisture inversion across these time series, a grouped box plot (Figure 11) was constructed, illustrating the comparative trends and variability in soil moisture estimates.
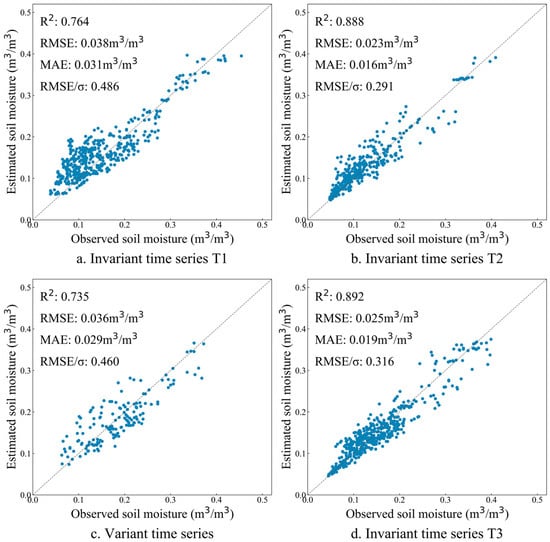
Figure 10.
Soil moisture verification based on variant time series and invariant time series inversion: (a) Invariant time series T1, (b) Invariant time series T2, (c) Variant time series, (d) Invariant time series T3.
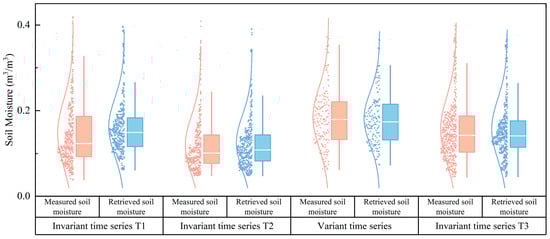
Figure 11.
Grouping boxplot of each time series.
The soil moisture inversions derived from the invariant time series T1 demonstrated significant peak displacement when compared with in situ measurements. However, this temporal misalignment phenomenon was notably absent in the inversion results obtained from invariant time series T2 and T3, which showed excellent agreement with the observed soil moisture dynamics. This discrepancy may arise because the anomaly detection between the initial images of the time series and those outside the study period was not accounted for when constructing invariant time series T1. Given that the study area is situated within the permafrost region of the Inner Mongolia Plateau, where seasonal frozen ground persists for several months annually, this persistent cryospheric condition may explain the reduced inversion accuracy observed in invariant time series T1.
In contrast, invariant time series T2 and T3 incorporated this critical consideration, leading to improved temporal alignment in soil moisture inversion. Although no evident peak displacement occurred in the change time series, the retrieved soil moisture values tended to cluster within a narrow median range, demonstrating substantial deviations from the measured extremes.
To elucidate the critical role of temporal consistency in long-time soil moisture retrieval, Figure 12 compared retrieval results obtained with and without DBSCAN-based anomaly detection and time series segmentation. Implementing the DBSCAN algorithm to maintain land surface temporal consistency yielded substantial improvements in validation metrics: R2 increased from 0.725 to 0.844, RMSE decreased from 0.041 to 0.030 m3/m3, and MAE was reduced from 0.033 to 0.023 m3/m3. These findings demonstrate that anomalous events in extended time series significantly compromise retrieval accuracy, whereas DBSCAN-driven temporal consistency preservation substantially enhances the reliability of soil moisture estimates within the study area.
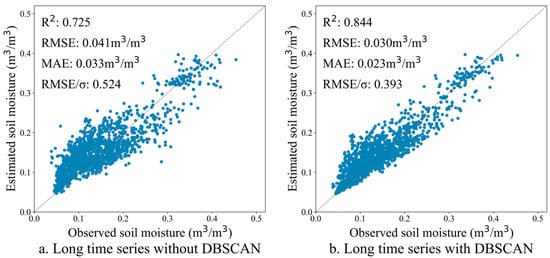
Figure 12.
The importance of temporal consistency for long-time soil moisture retrieval.
4.5. Time-Series In Situ Data Analysis
To assess the impact of anomalous events in the time series, we conducted a comprehensive analysis using in situ soil moisture measurements as ground truth. This evaluation compared the temporal patterns of observed soil moisture at five monitoring stations against the corresponding inversion estimates from January 2019 to December 2020. To ensure the reliability of temporal validation at monitoring sites, this study selected three representative sites encompassing the primary land use types within the study area: S2, S6, M9 (grassland), M3 (farmland), and L12 (bare soil). This stratified selection strategy accounts for the distinctive hydrological characteristics and surface properties associated with each land cover category, thereby enhancing the robustness and comprehensiveness of the time-series verification process.
In Figure 13, Zribi’s NDVI-based change detection approach with vegetation correction was referred to as the traditional change detection method, while the enhanced methodology proposed in this study was designated as the improved change detection method; the red circular solid line was the soil moisture measured by the site, the blue triangular dotted line was the soil moisture inverted by the traditional change detection method, and the orange square dotted line was the soil moisture inverted by the improved change detection method.
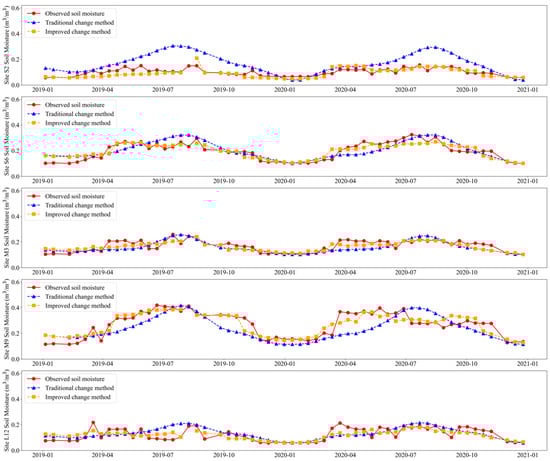
Figure 13.
Site timing verification.
Figure 13 demonstrated a significant correlation between temporal variations in site-specific soil moisture and corresponding NDVI dynamics. The traditional change detection method was easy to overestimate soil moisture, cannot accurately capture soil moisture dynamics, and was greatly affected by NDVI changes. In comparison, the improved change detection method demonstrated significantly better performance at all five validation sites (S2, S6, M9, M3, and L12). The soil moisture retrieved by our improved method showed excellent agreement with in situ measurements in terms of both magnitude and temporal variation. Experimental results confirmed that the improved change detection method proposed in this study achieves higher inversion accuracy than the traditional method. Specifically, it better correlated with site measurements and showed more reliable inversion results. These findings validated the effectiveness of our methodological improvements in enhancing the reliability of soil moisture retrieval while maintaining computational efficiency. The consistent performance across different sites suggests good applicability for regional-scale monitoring in farming-pastoral ecosystems.
Further analysis of the temporal anomaly events reveals that at most monitoring stations, the first anomalous event corresponded to an abrupt increase in soil moisture content, while the second anomalous event was characterized by subsequent fluctuations following this initial moisture surge. This consistent pattern was observed across multiple stations.
4.6. Soil Moisture Mapping
Using the improved change detection method developed in this study, we performed soil moisture inversion through the following procedure: first, we calibrated the minimum and maximum values of both radar backscattering coefficients and soil moisture for different land cover types using the FVC piecewise function. Subsequently, vegetation effects were corrected through NDEVI normalization, after applying the retrieved and spatially mapped soil moisture by incorporating fitted dry and wet reference values. Figure 14 presented the resulting soil moisture inversion for the study area.
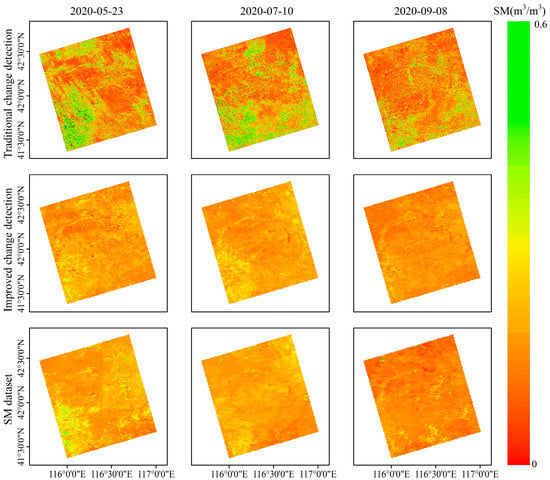
Figure 14.
Spatial distribution of soil moisture at different times in the study area.
In Figure 14, the first row showed the spatial distribution of soil moisture at different times in the study area retrieved by the traditional change detection method. The second row showed the spatial distribution of soil moisture at different times in the study area retrieved by the improved change detection method. The third row showed the spatial distribution of soil moisture at different times in the study area of soil moisture dataset. Figure 13 revealed systematic variations in soil moisture estimation accuracy across three sampling dates. The retrieval results for 10 July 2020, showed generally elevated values, while estimates for 22 July and 3 August 2020, demonstrated slightly lower readings, all maintaining strong consistency with field measurements. This temporal pattern corresponds with regional agricultural practices: primary crops (including potatoes and corn, predominantly harvested in August) required substantial irrigation in early July but reduced water demand approaching harvest. Consequently, soil moisture levels on 10 July 2020, naturally exceeded those of subsequent dates. Furthermore, heterogeneous irrigation scheduling, methods, and intensity across farmlands generated pronounced spatial variability in soil moisture distribution, particularly evident on this date.
Compared with the soil moisture dataset, the soil moisture inversion based on the traditional change detection method had a large fluctuation, and there was a problem that the inversion soil moisture is too high or too low, which cannot accurately show the spatial distribution of soil moisture in the study area. These limitations, primarily caused by uncompensated vegetation effects and surface roughness variations, significantly impair the method’s ability to accurately characterize the spatial distribution patterns of soil moisture across the study area. The observed discrepancies not only affect the absolute moisture values but also distort the temporal dynamics and spatial gradients crucial for hydrological applications and agricultural management. Such inaccuracies fundamentally limit the utility of traditional change detection for operational soil moisture monitoring and related applications requiring precise quantification of spatial variability. The improved change detection method developed in this study demonstrates significant enhancements in soil moisture monitoring accuracy. It effectively captured characteristic seasonal variations while maintaining excellent consistency with SSM dataset throughout the time series. The improved approach accurately reproduces the observed spatial distribution patterns, particularly the distinct moisture gradient across the study area—with consistently higher values in the lower left and upper right regions, and lower levels in the central zone.
5. Discussions
The change detection method, as a soil moisture retrieval technique utilizing time-series remote sensing data, derives its primary advantage from leveraging temporal signal variations to bypass the inherent difficulties associated with precise surface parameter modeling in physical inversion approaches, while maintaining operational convenience and computational efficiency. However, extended temporal domains introduce non-negligible variations in surface roughness and vegetation dynamics, which ultimately compromise the fundamental assumptions underlying the change detection framework. To uphold the core assumption underlying the change detection method, this study implements a dual-strategy approach targeting vegetation and surface roughness to resolve the critical challenge of maintaining temporal consistency in land surface parameters over extended time series.
The typical farming-pastoral ecotone in the Shandian River Basin selected for this study, characterized by highly heterogeneous vegetation cover and frequent human activities (e.g., irrigation) combined with natural events (e.g., rainfall), serves as an ideal testing ground for validating the proposed framework. The results demonstrate that our integrated strategy—comprising the FVC segmentation correction method, the NDEVI vegetation impact correction model, and the DBSCAN-based roughness anomaly detection—effectively extends the applicability of change detection techniques to such complex environments.
The innovation of this framework lies in its synergistic approach to handling interference from multiple surface factors. First, the core principle of the FVC segmentation correction method recognizes that the backscattering response to soil moisture exhibits nonlinear behavior with varying vegetation coverage. By employing segmented processing, we achieve accurate interpretation across different vegetation backgrounds, effectively mitigating systematic biases caused by vegetation heterogeneity, as opposed to using a single global model. Second, the introduction of the NDEVI vegetation impact correction model offers greater sensitivity to vegetation water content and biomass compared to the widely used NDVI. This enables our method to more precisely quantify and separate the volume scattering contribution from the vegetation layer, thereby reducing the dominant influence of vegetation phenological cycles on the signal. Finally, the DBSCAN anomaly detection plays a crucial role by intelligently identifying and excluding transient perturbations in surface roughness or soil moisture caused by events such as heavy rainfall, irrigation, and farming/harvesting activities, in an unsupervised manner. This process does not alter the roughness itself but ensures that the data foundation used for constructing the change detection sequence satisfies the fundamental assumption of “relatively consistent roughness” through data filtering.
Compared to vegetation indices derived from dual-polarization SAR data (DRVIs) [60], the fundamental advantage of NDEVI lies in its data accessibility and computational efficiency. It relies solely on widely available optical remote sensing data, thereby avoiding the inherent limitations of SAR data regarding acquisition difficulty, complex preprocessing, and high computational costs. This makes our method more suitable for large-scale, high-frequency operational monitoring applications. Furthermore, in contrast to the approach proposed by Mikołaj Piniewski et al. [61], which depends on high-precision crop classification maps, the innovation of our framework is reflected in its data-driven design philosophy. The DBSCAN-based pathway we employ is essentially an unsupervised learning method that does not rely on any specific prior knowledge—such as crop type maps—that is difficult to obtain in real time. This approach can automatically identify and process surface anomaly events, significantly enhancing the method’s adaptability and robustness in vast areas lacking detailed ground monitoring data.
This study also has certain limitations that point to promising directions for future research. First, the current formulation of the NDEVI still has room for optimization. Future work could involve systematic empirical analysis to determine a more universally optimal exponent for its integration with kEVI. Second, the parameters in the DBSCAN algorithm (such as the neighborhood radius ε and the minimum points MinPts) currently rely on empirical settings. Their adaptability and generalizability across diverse geographical environments still require validation and standardization over broader study areas. Finally, the framework’s strategy for handling vegetation and roughness is essentially one of “correction” and “exclusion,” rather than simultaneous retrieval. Therefore, a highly promising future direction would be to couple this framework with advanced physical models like AIEM, aiming to develop a novel “physical-statistical” hybrid retrieval paradigm that combines the rigor of physical mechanisms with the efficiency of temporal change detection.
6. Conclusions
This study addressed the challenge wherein traditional change detection methods were frequently compromised by variations in surface vegetation and roughness within vegetated areas. To mitigate these limitations, we introduced a composite vegetation index (NDEVI) derived from the integration of NDVI and EVI, designed to correct vegetation influences. Additionally, the DBSCAN algorithm was employed to segment long-term time series into multiple intervals characterized by stable surface conditions, thereby satisfying the fundamental assumption that backscattering coefficient variations are solely attributable to changes in surface soil moisture. The principal conclusions are as follows:
- (1)
- As vegetation density increases, the vegetation canopy contributes more significantly to the total radar backscattering coefficient. Simultaneously, higher vegetation coverage enhances both water retention capacity and transpiration rates, leading to dynamic fluctuations in the minimum and maximum values of soil moisture content due to modifications of the underlying surface conditions. Consequently, accurate soil moisture retrieval in vegetated areas using change detection methods must account for the dual influence of vegetation on both radar backscattering behavior and surface soil moisture dynamics.
- (2)
- In densely vegetated areas, the composite vegetation index NDEVI demonstrates enhanced capability for vegetation correction, achieving a coefficient of determination (R2) of 0.804 under high vegetation coverage conditions. This improved performance stems from its ability to mitigate the inherent limitations of single vegetation indices by synergistically combining their advantages, thereby reconstructing a vegetation index curve that better aligns with actual surface vegetation characteristics. The integrated approach enables more accurate characterization of vegetation dynamics across varying coverage conditions, particularly in challenging high-density environments where conventional indices typically saturate or lose sensitivity.
- (3)
- Temporal variations in surface roughness significantly impact the accuracy of soil moisture estimation, while heavy rainfall events can induce surface conditions that lead to underestimated soil moisture retrievals. Compared to conventional long-term time series analysis, the invariant time series segments identified in this study demonstrate superior retrieval performance. Specifically, during the stable period T3, the method achieves a coefficient of determination (R2) of 0.892, with a root mean square error (RMSE) of 0.025 m3/m3 and a mean absolute error (MAE) of 0.019 m3/m3. The improved change detection methodology was successfully applied to generate spatial soil moisture patterns across the study area, confirming its effectiveness and practical applicability. This approach provides valuable reference for regional-scale soil moisture monitoring in agricultural landscapes using remote sensing technology, particularly for addressing the challenges posed by dynamic surface conditions.
Author Contributions
Conceptualization, L.T.; methodology, J.Z.; software, J.Z.; validation, J.Z.; formal analysis, J.Z.; investigation, L.T.; writing—original draft preparation, J.Z.; writing—review and editing, L.T.; supervision, L.T.; funding acquisition, L.T. All authors have read and agreed to the published version of the manuscript.
Funding
This research was funded by the National Nature Science Foundation of China (grant No. 42371349), National Key Research and Development Program of China (grant No. 2023YFE0100500).
Data Availability Statement
The datasets reported in this paper can be accessed through http://data.tpdc.ac.cn/en/ (in situ soil moisture observation data and soil moisture dataset, last accessed on 17 October 2025), https://search.earthdata.nasa.gov/search (MODIS products, last accessed: 17 October 2025), https://search.asf.alaska.edu (Sentinel-1 products, last accessed: 17 October 2025).
Acknowledgments
The author is grateful to the National Tibetan Plateau Data Center for the in situ measurement data, the European Space Agency and NASA for the remote sensing data, the open-source software developers for their contributions, and the reviewers for their valuable comments and suggestions.
Conflicts of Interest
The authors declare no conflicts of interest.
References
- Brocca, L.; Filippucci, P.; Hahn, S.; Ciabatta, L.; Massari, C.; Camici, S.; Schüller, L.; Bojkov, B.; Wagner, W. SM2RAIN–ASCAT (2007–2018): Global Daily Satellite Rainfall Data from ASCAT Soil Moisture Observations. Earth Syst. Sci. Data 2019, 11, 1583–1601. [Google Scholar] [CrossRef]
- Green, J.K.; Seneviratne, S.I.; Berg, A.M.; Findell, K.L.; Hagemann, S.; Lawrence, D.M.; Gentine, P. Large Influence of Soil Moisture on Long-Term Terrestrial Carbon Uptake. Nature 2019, 565, 476–479. [Google Scholar] [CrossRef]
- Peng, J.; Albergel, C.; Balenzano, A.; Brocca, L.; Cartus, O.; Cosh, M.H.; Crow, W.T.; Dabrowska-Zielinska, K.; Dadson, S.; Davidson, M.W.J.; et al. A Roadmap for High-Resolution Satellite Soil Moisture Applications–Confronting Product Characteristics with User Requirements. Remote Sens. Environ. 2021, 252, 112162. [Google Scholar] [CrossRef]
- Vroege, W.; Bucheli, J.; Dalhaus, T.; Hirschi, M.; Finger, R. Insuring Crops from Space: The Potential of Satellite-Retrieved Soil Moisture to Reduce Farmers’ Drought Risk Exposure. Eur. Rev. Agric. Econ. 2021, 48, 266–314. [Google Scholar] [CrossRef]
- Zhang, Y.; Liang, S.; Zhu, Z.; Ma, H.; He, T. Soil Moisture Content Retrieval from Landsat 8 Data Using Ensemble Learning. ISPRS J. Photogramm. Remote Sens. 2022, 185, 32–47. [Google Scholar] [CrossRef]
- Berg, A.; Sheffield, J. Climate Change and Drought: The Soil Moisture Perspective. Curr. Clim. Chang. Rep. 2018, 4, 180–191. [Google Scholar] [CrossRef]
- Yao, L.; Leng, G.; Yu, L.; Li, H.; Tang, Q.; Python, A.; Hall, J.W.; Liao, X.; Li, J.; Qiu, J.; et al. Emergent Constraints on Global Soil Moisture Projections under Climate Change. Commun. Earth Environ. 2025, 6, 39. [Google Scholar] [CrossRef]
- Li, Z.-L.; Leng, P.; Zhou, C.; Chen, K.-S.; Zhou, F.-C.; Shang, G.-F. Soil Moisture Retrieval from Remote Sensing Measurements: Current Knowledge and Directions for the Future. Earth-Sci. Rev. 2021, 218, 103673. [Google Scholar] [CrossRef]
- Gu, X.; Cheng, N.; Guan, Y.; Kong, D. Seasonal Diversity of Global Flood Changes and Their Drivers. J. Hydrol. 2025, 662, 133976. [Google Scholar] [CrossRef]
- Zhang, X.; Li, L.; Zhang, G.; Jiu, A.; Chen, C.; Zhou, J.; Li, F.-M. Straw Burial Increased Wheat Yield by Decreasing Soil Moisture Levels in a Lower Yangtze River Field. Field Crops Res. 2025, 331, 110006. [Google Scholar] [CrossRef]
- Van Der Velde, R.; Su, Z.; Van Oevelen, P.; Wen, J.; Ma, Y.; Salama, M.S. Soil Moisture Mapping over the Central Part of the Tibetan Plateau Using a Series of ASAR WS Images. Remote Sens. Environ. 2012, 120, 175–187. [Google Scholar] [CrossRef]
- Guo, S.; Zheng, H.; Yang, Y.; Zhang, S.; Hou, H.; Zhu, Q.; Du, P. Spatial Estimates of Surface Deformation and Topsoil Moisture in Operating CO2-EOR Project: Pilot Environmental Monitoring Using SAR Technique. J. Clean. Prod. 2019, 236, 117606. [Google Scholar] [CrossRef]
- Singh, A.; Naik, M.N.; Gaurav, K. Drainage Congestion Due to Road Network on the Kosi Alluvial Fan, Himalayan Foreland. Int. J. Appl. Earth Obs. Geoinf. 2022, 112, 102892. [Google Scholar] [CrossRef]
- Li, Z.; Yuan, Q.; Yang, Q.; Li, J.; Zhao, T. Differentiable Modeling for Soil Moisture Retrieval by Unifying Deep Neural Networks and Water Cloud Model. Remote Sens. Environ. 2024, 311, 114281. [Google Scholar] [CrossRef]
- Han, M.; Zhao, Q.; Wang, X.; Wang, Y.-P.; Ciais, P.; Zhang, H.; Goll, D.S.; Zhu, L.; Zhao, Z.; Guo, Z.; et al. Modeling Biochar Effects on Soil Organic Carbon on Croplands in a Microbial Decomposition Model (MIMICS-BC_v1.0). Geosci. Model Dev. 2024, 17, 4871–4890. [Google Scholar] [CrossRef]
- Dong, Z.; Yan, Q.; Jin, S.; Li, L.; Chen, G. Refined Semi-Empirical Models for Soil Moisture Retrieval in Spaceborne GNSS-Reflectometry: Evaluation across Diverse Land Cover Types. Measurement 2025, 242, 115849. [Google Scholar] [CrossRef]
- Huang, S.; Tsang, L. Electromagnetic Scattering of Randomly Rough Soil Surfaces Based on Numerical Solutions of Maxwell Equations in Three-Dimensional Simulations Using a Hybrid UV/PBTG/SMCG Method. IEEE Trans. Geosci. Remote Sens. 2012, 50, 4025–4035. [Google Scholar] [CrossRef]
- Wagner, W.; Noll, J.; Borgeaud, M.; Rott, H. Monitoring Soil Moisture over the Canadian Prairies with the ERS Scatterometer. IEEE Trans. Geosci. Remote Sens. 1999, 37, 206–216. [Google Scholar] [CrossRef]
- Balenzano, A.; Mattia, F.; Satalino, G.; Davidson, M.W.J. Dense Temporal Series of C- and L-Band SAR Data for Soil Moisture Retrieval Over Agricultural Crops. IEEE J. Sel. Top. Appl. Earth Obs. Remote Sens. 2011, 4, 439–450. [Google Scholar] [CrossRef]
- Van Hateren, T.C.; Chini, M.; Matgen, P.; Pulvirenti, L.; Pierdicca, N.; Teuling, A.J. On the Potential of Sentinel-1 for Sub-Field Scale Soil Moisture Monitoring. Int. J. Appl. Earth Obs. Geoinf. 2023, 120, 103342. [Google Scholar] [CrossRef]
- Njoku, E.G.; Wilson, W.J.; Yueh, S.H.; Dinardo, S.J.; Li, F.K.; Jackson, T.J.; Lakshmi, V.; Bolten, J. Observations of Soil Moisture Using a Passive and Active Low-Frequency Microwave Airborne Sensor during SGP99. IEEE Trans. Geosci. Remote Sens. 2002, 40, 2659–2673. [Google Scholar] [CrossRef]
- Zhu, L.; Walker, J.P.; Ye, N.; Rüdiger, C. Roughness and Vegetation Change Detection: A Pre-Processing for Soil Moisture Retrieval from Multi-Temporal SAR Imagery. Remote Sens. Environ. 2019, 225, 93–106. [Google Scholar] [CrossRef]
- Du, S.; Duan, P.; Zhao, T.; Wang, Z.; Niu, S.; Ma, C.; Zou, D.; Yao, P.; Guo, P.; Fan, D.; et al. An Improved Change Detection Method for High-Resolution Soil Moisture Mapping in Permafrost Regions. GISci. Remote Sens. 2024, 61, 2310898. [Google Scholar] [CrossRef]
- Zribi, M.; André, C.; Decharme, B. A Method for Soil Moisture Estimation in Western Africa Based on the ERS Scatterometer. IEEE Trans. Geosci. Remote. Sens. 2008, 46, 438–448. [Google Scholar] [CrossRef]
- Bhogapurapu, N.; Dey, S.; Homayouni, S.; Bhattacharya, A.; Rao, Y.S. Field-Scale Soil Moisture Estimation Using Sentinel-1 GRD SAR Data. Adv. Space Res. 2022, 70, 3845–3858. [Google Scholar] [CrossRef]
- Nativel, S.; Ayari, E.; Rodriguez-Fernandez, N.; Baghdadi, N.; Madelon, R.; Albergel, C.; Zribi, M. Hybrid Methodology Using Sentinel-1/Sentinel-2 for Soil Moisture Estimation. Remote Sens. 2022, 14, 2434. [Google Scholar] [CrossRef]
- Zhu, L.; Si, R.; Shen, X.; Walker, J.P. An Advanced Change Detection Method for Time-Series Soil Moisture Retrieval from Sentinel-1. Remote Sens. Environ. 2022, 279, 113137. [Google Scholar] [CrossRef]
- Graldi, G.; Zardi, D.; Vitti, A. Retrieving Soil Moisture at the Field Scale from Sentinel-1 Data over a Semi-Arid Mediterranean Agricultural Area. Remote Sens. 2023, 15, 2997. [Google Scholar] [CrossRef]
- Na, L.; Na, R.; Bao, Y.; Zhang, J. Time-Lagged Correlation between Soil Moisture and Intra-Annual Dynamics of Vegetation on the Mongolian Plateau. Remote Sens. 2021, 13, 1527. [Google Scholar] [CrossRef]
- Liang, S.; Ziegler, A.D.; Li, L.Z.X.; Wu, J.; Wang, D.; Zeng, Z. Interplay of Greening and ENSO on Biosphere–Atmosphere Processes in Australia. Geosci. Lett. 2022, 9, 43. [Google Scholar] [CrossRef]
- Brunelli, B.; Mancini, F. Comparative Analysis of SAOCOM and Sentinel-1 Data for Surface Soil Moisture Retrieval Using a Change Detection Method in a Semiarid Region (Douro River’s Basin, Spain). Int. J. Appl. Earth Obs. Geoinf. 2024, 129, 103874. [Google Scholar] [CrossRef]
- Wang, Z.; Gao, Q.; Crosetto, M.; Escorihuela, M.J. High-Resolution Surface Soil Moisture Retrieval: A Hybrid Machine Learning Framework Integrating Change Detection and Downscaling for Precision Water Management. Int. J. Appl. Earth Obs. Geoinf. 2025, 142, 104702. [Google Scholar] [CrossRef]
- Jiang, M.; Shen, H.; Li, J.; Zhang, L. Generalized Spatio-Temporal-Spectral Integrated Fusion for Soil Moisture Downscaling. ISPRS J. Photogramm. Remote Sens. 2024, 218, 70–86. [Google Scholar] [CrossRef]
- Zhao, T.; Shi, J.; Lv, L.; Xu, H.; Chen, D.; Cui, Q.; Jackson, T.J.; Yan, G.; Jia, L.; Chen, L.; et al. Soil Moisture Experiment in the Luan River Supporting New Satellite Mission Opportunities. Remote Sens. Environ. 2020, 240, 111680. [Google Scholar] [CrossRef]
- Thepaut, J.-N.; Dee, D.; Engelen, R.; Pinty, B. The Copernicus Programme and Its Climate Change Service. In Proceedings of the IGARSS 2018-2018 IEEE International Geoscience and Remote Sensing Symposium, Valencia, Spain, 22–27 July 2018; pp. 1591–1593. [Google Scholar]
- Snoeij, P.; Attema, E.; Davidson, M.; Duesmann, B.; Floury, N.; Levrini, G.; Rommen, B.; Rosich, B. Sentinel-1 Radar Mission: Status and Performance. IEEE Aerosp. Electron. Syst. Mag. 2010, 25, 32–39. [Google Scholar] [CrossRef]
- Zhao, T.; Shi, J.; Entekhabi, D.; Jackson, T.J.; Hu, L.; Peng, Z.; Yao, P.; Li, S.; Kang, C.S. Retrievals of Soil Moisture and Vegetation Optical Depth Using a Multi-Channel Collaborative Algorithm. Remote Sens. Environ. 2021, 257, 112321. [Google Scholar] [CrossRef]
- Yan, G.; Zhao, T.; Mu, X.; Wen, J.; Pang, Y.; Jia, L.; Zhang, Y.; Chen, D.; Yao, C.; Cao, Z.; et al. Comprehensive remote sensing experiment of carbon cycle, water cycle and energy balance in Luan River Basin. Natl. Remote Sens. Bull. 2021, 25, 856–870. [Google Scholar] [CrossRef]
- Gu, L.; Shuai, Y.; Shao, C.; Xie, D.; Zhang, Q.; Li, Y.; Yang, J. Angle Effect on Typical Optical Remote Sensing Indices in Vegetation Monitoring. Remote Sens. 2021, 13, 1699. [Google Scholar] [CrossRef]
- Song, P.; Zhang, Y.; Guo, J.; Shi, J.; Zhao, T.; Tong, B. A 1 Km Daily Surface Soil Moisture Dataset of Enhanced Coverage under All-Weather Conditions over China in 2003–2019. Earth Syst. Sci. Data 2022, 14, 2613–2637. [Google Scholar] [CrossRef]
- Lassalle, G.; Fabre, S.; Credoz, A.; Dubucq, D.; Elger, A. Monitoring Oil Contamination in Vegetated Areas with Optical Remote Sensing: A Comprehensive Review. J. Hazard. Mater. 2020, 393, 122427. [Google Scholar] [CrossRef] [PubMed]
- Fan, X.; Liu, Y. A Global Study of NDVI Difference among Moderate-Resolution Satellite Sensors. ISPRS J. Photogramm. Remote Sens. 2016, 121, 177–191. [Google Scholar] [CrossRef]
- Li, C.; Li, H.; Li, J.; Lei, Y.; Li, C.; Manevski, K.; Shen, Y. Using NDVI Percentiles to Monitor Real-Time Crop Growth. Comput. Electron. Agric. 2019, 162, 357–363. [Google Scholar] [CrossRef]
- Song, W.; Mu, X.; Ruan, G.; Gao, Z.; Li, L.; Yan, G. Estimating Fractional Vegetation Cover and the Vegetation Index of Bare Soil and Highly Dense Vegetation with a Physically Based Method. Int. J. Appl. Earth Obs. Geoinf. 2017, 58, 168–176. [Google Scholar] [CrossRef]
- Mu, X.; Yang, Y.; Xu, H.; Guo, Y.; Lai, Y.; McVicar, T.R.; Xie, D.; Yan, G. Improvement of NDVI Mixture Model for Fractional Vegetation Cover Estimation with Consideration of Shaded Vegetation and Soil Components. Remote Sens. Environ. 2024, 314, 114409. [Google Scholar] [CrossRef]
- Li, W.; Migliavacca, M.; Forkel, M.; Denissen, J.M.C.; Reichstein, M.; Yang, H.; Duveiller, G.; Weber, U.; Orth, R. Widespread Increasing Vegetation Sensitivity to Soil Moisture. Nat. Commun. 2022, 13, 3959. [Google Scholar] [CrossRef] [PubMed]
- Millard, K.; Richardson, M. Quantifying the Relative Contributions of Vegetation and Soil Moisture Conditions to Polarimetric C-Band SAR Response in a Temperate Peatland. Remote Sens. Environ. 2018, 206, 123–138. [Google Scholar] [CrossRef]
- Zhao, T.; Shi, J.; Xu, H.; Sun, Y.; Chen, D.; Cui, Q.; Jia, L.; Huang, S.; Niu, S.; Li, X.; et al. Comprehensive remote sensing experiment of water cycle and energy balance in the Shandian river basin. Natl. Remote Sens. Bull. 2021, 25, 871–887. [Google Scholar] [CrossRef]
- Zhang, M.; Wang, J.; Li, S. Tempo-Spatial Changes and Main Anthropogenic Influence Factors of Vegetation Fractional Coverage in a Large-Scale Opencast Coal Mine Area from 1992 to 2015. J. Clean. Prod. 2019, 232, 940–952. [Google Scholar]
- Xu, Z.; Li, Y.; Li, B.; Hao, Z.; Lin, L.; Hu, X.; Zhou, X.; Yu, H.; Xiang, S.; Pascal, M.-L.-F.; et al. A Comparative Study on the Applicability and Effectiveness of NSVI and NDVI for Estimating Fractional Vegetation Cover Based on Multi-Source Remote Sensing Image. Geocarto Int. 2023, 38, 2184501. [Google Scholar] [CrossRef]
- Testa, S.; Soudani, K.; Boschetti, L.; Borgogno Mondino, E. MODIS-Derived EVI, NDVI and WDRVI Time Series to Estimate Phenological Metrics in French Deciduous Forests. Int. J. Appl. Earth Obs. Geoinf. 2018, 64, 132–144. [Google Scholar] [CrossRef]
- Peng, D.; Wu, C.; Li, C.; Zhang, X.; Liu, Z.; Ye, H.; Luo, S.; Liu, X.; Hu, Y.; Fang, B. Spring Green-up Phenology Products Derived from MODIS NDVI and EVI: Intercomparison, Interpretation and Validation Using National Phenology Network and AmeriFlux Observations. Ecol. Indic. 2017, 77, 323–336. [Google Scholar] [CrossRef]
- Camps-Valls, G.; Campos-Taberner, M.; Moreno-Martínez, Á.; Walther, S.; Duveiller, G.; Cescatti, A.; Mahecha, M.D.; Muñoz-Marí, J.; García-Haro, F.J.; Guanter, L.; et al. A Unified Vegetation Index for Quantifying the Terrestrial Biosphere. Sci. Adv. 2021, 7, eabc7447. [Google Scholar] [CrossRef]
- Grings, F.; Roitberg, E.; Barraza, V. EVI Time-Series Breakpoint Detection Using Convolutional Networks for Online Deforestation Monitoring in Chaco Forest. IEEE Trans. Geosci. Remote Sens. 2020, 58, 1303–1312. [Google Scholar] [CrossRef]
- Feng, X.; Tian, J.; Wu, J.; Wu, G.; Ren, Y.; He, C.; Bao, W.; Yu, T. Exploring the Spatio-Temporal Distribution Characteristics and the Impacts of Climate Change and Human Activities on Global Grassland Based on kNDVI. Environ. Res. 2025, 279, 121884. [Google Scholar] [CrossRef]
- Gong, L.; Sato, H.; Yamamoto, T.; Miwa, T.; Morikawa, T. Identification of Activity Stop Locations in GPS Trajectories by Density-Based Clustering Method Combined with Support Vector Machines. J. Mod. Transport. 2015, 23, 202–213. [Google Scholar] [CrossRef]
- Zhang, H.; Liu, Y.; Gui, F.; Yang, X. A Universal Aquaculture Environmental Anomaly Monitoring System. Sustainability 2023, 15, 5678. [Google Scholar] [CrossRef]
- Huang, Q.; Feng, J.; Gao, M.; Lai, S.; Han, G.; Qin, Z.; Fan, J.; Huang, Y. Precise Estimation of Sugarcane Yield at Field Scale with Allometric Variables Retrieved from UAV Phantom 4 RTK Images. Agronomy 2024, 14, 476. [Google Scholar] [CrossRef]
- Su, X.; Nian, Y.; Yue, H.; Zhu, Y.; Li, J.; Wang, W.; Sheng, Y.; Ma, Q.; Liu, J.; Wang, W.; et al. Improving Wheat Leaf Nitrogen Concentration (LNC) Estimation across Multiple Growth Stages Using Feature Combination Indices (FCIs) from UAV Multispectral Imagery. Agronomy 2024, 14, 1052. [Google Scholar] [CrossRef]
- Zhang, R.; Bao, X.; Hong, R.; He, X.; Yin, G.; Chen, J.; Ouyang, X.; Wang, Y.; Liu, G. Soil Moisture Retrieval over Croplands Using Novel Dual-Polarization SAR Vegetation Index. Agric. Water Manag. 2024, 306, 109159. [Google Scholar] [CrossRef]
- Piniewski, M.; Marcinkowski, P.; O’Keeffe, J.; Szcześniak, M.; Nieróbca, A.; Kozyra, J.; Kundzewicz, Z.W.; Okruszko, T. Model-Based Reconstruction and Projections of Soil Moisture Anomalies and Crop Losses in Poland. Theor. Appl. Climatol. 2020, 140, 691–708. [Google Scholar] [CrossRef]
Disclaimer/Publisher’s Note: The statements, opinions and data contained in all publications are solely those of the individual author(s) and contributor(s) and not of MDPI and/or the editor(s). MDPI and/or the editor(s) disclaim responsibility for any injury to people or property resulting from any ideas, methods, instructions or products referred to in the content. |
© 2025 by the authors. Licensee MDPI, Basel, Switzerland. This article is an open access article distributed under the terms and conditions of the Creative Commons Attribution (CC BY) license (https://creativecommons.org/licenses/by/4.0/).