Highlights
What are the main findings?
- A significant global shift occurred around the year 2000: The rate of vegetation greening accelerated significantly after this point, coinciding with a reversal in soil moisture trends from general drying (1982–1999) to wetting (2000–2020). Notably, this post-2000 wetting trend was most pronounced in temperate and tropical climate zones compared to cold and arid regions.
- The drivers of soil moisture are complex, and vegetation’s regulatory role is growing: The primary factors controlling soil moisture vary by season, climate zone, and soil depth. For instance, for rootzone soil moisture, vegetation (LAI) is dominant in winter and spring, while solar radiation becomes the primary driver in summer and autumn. Crucially, the overall influence of vegetation (LAI) on soil moisture has significantly strengthened over time, generally contributing to a wetting trend. Although vegetation is not the absolute dominant factor in all seasons, the growth of its influence is particularly pronounced in specific periods: for rootzone soil moisture, its influence increased the most during winter and summer, while for surface soil moisture, the increase was most significant in winter. This highlights the increasingly important regulatory role of vegetation in the global water cycle.
What are the implications of the main findings?
- Improved prediction models are needed for water resource management: The finding that vegetation’s role in regulating soil moisture is growing stronger means that traditional climate-only models may be insufficient. These results provide a scientific basis for improving global models by better incorporating the dynamic effects of vegetation greening, leading to more accurate predictions of soil moisture and better management of water resource risks under climate change.
- A deeper understanding of Earth’s ecohydrological processes: This research clarifies the complex, intertwined relationship between the climate, plants (biosphere), and water (hydrosphere). Understanding that factors like the timing of peak vegetation growth (POS) can directly influence soil moisture provides a more nuanced view of terrestrial ecosystems, which is fundamental for assessing ecological responses to global environmental changes.
Abstract
Global soil moisture has undergone significant changes in recent decades due to climate change and vegetation greening. However, the seasonal and climate zonal variations in soil moisture dynamics at different depths, driven by both climate and vegetation, remain insufficiently explored. This study provides a comprehensive analysis of the global patterns in rootzone and surface soil moisture and leaf area index (LAI) across different seasons and climate zones, utilizing satellite observations from 1982 to 2020. We investigate how climatic factors and LAI influence soil moisture variations and quantify their dominant contributions. Furthermore, by employing key vegetation phenological indicators, namely the peak of growing season (POS) and the corresponding maximum LAI (LAIMAX), we assess the feedback effects of vegetation phenology on soil moisture dynamics. The results indicate that the greening trend (as reflected by LAI increases) from 2000 to 2020 was significantly stronger than that observed during 1982–1999 across all seasons and climate zones. Both rootzone and surface soil moisture shifted from a decreasing (drying) trend (1982–1999) to an increasing (wetting) trend (2000–2020). From 1982 to 2020, the LAI induced moistening trends in both surface and rootzone soil moisture. In arid and temperate zones, precipitation drove rootzone soil moisture increases only during the summer. Among all seasons and climate zones, solar radiation induced the strongest surface soil drying in tropical summers, with a rate of −0.04 × 10⁻³ m3m−3/Wm−2. For rootzone soil moisture, LAI dominated over individual climatic factors in winter and spring globally. In contrast, solar radiation became the primary driver during summer and autumn, followed by precipitation. For surface soil moisture, precipitation exhibited the strongest control in winter, but solar radiation surpassed it as the dominant factor from spring through autumn. In the tropical autumn, the sensitivity of rootzone and surface soil moisture to POS (and LAIMAX) was highest, at 0.059 m3m−3·d−1 (0.256 m3m−3/m2m−2) and 0.052 m3m−3·d−1 (0.232 m3m−3/m2m−2), respectively. This research deepens the understanding of how climate and vegetation regulate soil moisture across different climate zones and seasons. It also provides a scientific basis for improving global soil moisture prediction models and managing water resource risks in the context of climate change.
1. Introduction
Soil moisture is a crucial component of the terrestrial–atmospheric hydrological cycle, exerting significant influences on surface temperature, precipitation patterns, and vegetation growth []. Optimal soil water content not only sustains the physiological metabolism of terrestrial plants but also enhances photosynthetic efficiency, nutrient uptake, and carbon sequestration capacity []. Through transpiration processes, terrestrial vegetation actively participates in global carbon-water cycles by releasing substantial amounts of soil water absorbed from various depths back into the atmosphere []. Global climate warming is posing a profound threat to global terrestrial ecosystems through multiple transmission mechanisms. Rising temperatures increase saturation vapor pressure, intensifying atmospheric evaporative demand to trigger or exacerbate “atmospheric drought”, particularly in vulnerable arid regions []. At the same time, shifts in extreme weather patterns induced by climate warming are leading to more frequent, intense, and prolonged flash droughts, presenting a severe challenge to tropical and temperate regions like Southern and Eastern Asia and the Amazon Basin []. In high-altitude alpine regions highly sensitive to climate change, such as the Tibetan Plateau, sustained warming drives permafrost degradation and thaw, a process that diminishes the soil’s water-holding capacity, reduces surface runoff, and ultimately triggers a series of cascading ecological problems, including wetland shrinkage and lake desiccation in the source region of the Yellow River []. Overall, the contraction of moist soil areas and the widespread decline in water content resulting from climate warming collectively constrain improvements in vegetation productivity and the carbon assimilation capacity of ecosystems [,,,]. In response to soil moisture scarcity, vegetation employs adaptive strategies to reduce dependence on soil moisture, such as regulating stomatal conductance to lower photosynthetic intensity and minimize water loss []. Soil moisture exerts a limiting effect on vegetation growth, while vegetation reciprocally modulates soil water dynamics. Through canopy interception, plants capture a portion of precipitation, which evaporates back into the atmosphere before infiltrating the soil, thereby reducing effective water recharge. Simultaneously, root systems enhance soil porosity, improve infiltration capacity, and increase surface roughness, collectively altering runoff processes []. Moreover, vegetation facilitates the accumulation of soil organic matter, improves soil structure, and enhances water retention capacity. Healthy plant cover mitigates soil erosion, conserves water resources, and ultimately bolsters ecosystem stability and productivity []. Soil moisture is further influenced by climatic factors, including precipitation, temperature, radiation, and wind speed. While precipitation directly replenishes soil water, temperature, radiation, and wind indirectly affect moisture levels by altering evapotranspiration rates [,]. This coupled vegetation-soil-climate interaction holds profound implications for global carbon sequestration potential, sustainable water resource utilization, and the delivery of ecosystem services.
Satellite observations have confirmed a significant global greening trend in terrestrial vegetation over recent decades. While this vegetation expansion enhances ecosystem services, it concurrently intensifies soil water consumption, with particularly pronounced impacts in water-scarce arid and semi-arid regions [,]. As a key indicator of vegetation greening, the LAI is a crucial parameter governing the eco-hydrological interactions between the canopy and soil []. Current research primarily examines vegetation-induced asymmetries in diurnal land surface temperature variation, vegetation sensitivity to soil moisture, and the impacts of vegetation changes on evapotranspiration and water yield [,,]. However, critical knowledge gaps remain regarding the regulatory roles of vegetation and climate on global soil moisture dynamics, particularly their differential responses across climate zones and seasonal scales. Addressing this research gap will provide deeper insights into vegetation-soil moisture interactions, offering a stronger scientific foundation for climate change adaptation and optimized land-water resource management.
The POS, a key metric in vegetation phenology, pinpoints the specific time of year when biomass accumulation reaches its maximum []. This timing represents a critical phenological transition, marking the shift from the phase of peak photosynthetic activity to subsequent senescence []. Furthermore, the timing of the POS directly influences the annual carbon sequestration capacity of an ecosystem [,]. In remote sensing studies, the date of the maximum LAI (LAIMAX)—a key indicator reflecting canopy greenness and structure—is widely employed to effectively identify the occurrence of the POS [,,]. It is important to note, however, that while the POS and the LAIMAX may overlap in time, they represent two distinct yet related ecological dimensions of vegetation response: the timing of growth and its peak magnitude. Shifts in POS, whether earlier or later, can be seen as a strategic adjustment in vegetation growth and development to adapt to climate change, whereas LAIMAX is a more direct indicator of the ecosystem’s productivity potential [,]. For instance, in the mid-to-high latitudes of the Northern Hemisphere, earlier vegetation green-up and rising temperatures promote an increase in early-season carbon uptake, which in turn advances the POS []. However, seasonal droughts may inhibit the growth potential of vegetation, leading to a lower LAIMAX []. This decoupling of timing and magnitude in vegetation response underscores the complexity of plant-environment interactions. Soil moisture dynamics across different soil layers regulate vegetation growth through complex biophysical mechanisms, thereby significantly modulating phenological timing, including POS. In high-latitude ecosystems, shallow-rooted vegetation constrained by permafrost shows particularly pronounced responses: as temperatures decline and the active layer freezes, restricted access to soil moisture and nutrients substantially impedes normal vegetation development [,]. In contrast, arid and semi-arid regions demonstrate an inverse relationship, where even marginal soil moisture increases frequently serve as the dominant growth driver, triggering advanced greening phenology []. Current research has predominantly examined the unidirectional effects of climatic drivers (e.g., temperature and precipitation) on vegetation phenology, including POS, focusing on how these factors induce phenological shifts [,,,]. However, the feedback mechanisms whereby POS timing and its associated peak biomass influence soil moisture dynamics—with vegetation phenology acting as a mediator—remain substantially understudied. Notably, emerging evidence demonstrates that earlier spring greening in the Northern Hemisphere triggers late-spring soil moisture deficits that persist through summer, consequently intensifying the frequency and magnitude of summer heatwaves []. These findings strongly suggest that advanced POS may similarly amplify soil water depletion across multiple soil layers during spring and early summer, thereby exerting prolonged impacts on moisture availability throughout summer and autumn. Nevertheless, the biophysical processes governing this critical vegetation-soil moisture feedback remain poorly quantified in current scientific understanding.
Therefore, this study aims to unravel these complex eco-hydrological interactions from 1982 to 2020. The main objectives of this research are: (1) to analyze the spatiotemporal variations in rootzone and surface soil moisture, as well as LAI, across different global climate zones and seasons using long-term satellite observations; (2) to assess the regulatory effects of LAI and climate factors on soil moisture patterns and to determine the dominant controls of soil moisture under different seasonal and climatic conditions; (3) to investigate the spatiotemporal patterns of POS and LAIMAX and their linkages with climate factors and soil moisture.
2. Materials and Methods
2.1. Study Area
The study area encompasses all continental landmasses (excluding Antarctica), characterized by diverse vegetation types (Figure 1). The land cover is dominated by grasslands (22.04%), followed by barren lands (17.80%), shrublands (11.80%), savannas (11.71%), croplands (9.13%), woody savannas (9.10%), evergreen forests (8.86%), mixed forests (4.20%), deciduous forests (2.12%), water bodies (1.93%), permanent wetlands (0.88%), and urban and built-up lands (0.43%). The study area features diverse climate types (Figure S1), including cold (32.86%), arid (27.60%), tropical (15.99%), polar (12.65%), and temperate climates (10.90%). The area of plains below 200 m accounts for approximately 23.25% of the total land area. The climatic factors in the study area exhibit significant seasonal variation. The global average precipitation for winter, spring, summer, and autumn is 25.98 mm, 34.98 mm, 61.22 mm, and 46.94 mm, respectively. Summer precipitation is the most abundant, approximately 2.4 times that of winter. The corresponding average temperatures during these seasons are −13.93 °C, −4.15 °C, 7.12 °C, and −5.27 °C. Solar radiation also exhibits significant seasonal variation, with average values of 73.42 W/m2 in winter, 203.50 W/m2 in spring, 264.37 W/m2 in summer, and 100.35 W/m2 in autumn. The intensity of solar radiation in summer is approximately 3.6 times higher than in winter. In contrast, the variation in wind speed is more moderate, with average values of 3.69 m/s, 3.98 m/s, 3.46 m/s, and 3.52 m/s for winter, spring, summer, and autumn, respectively. The diverse natural climatic conditions and complex ecosystem structure of the study area provide an ideal research setting for in-depth analysis of global soil moisture dynamics under climate change, as well as vegetation and climatic regulation on soil moisture.
Figure 1.
The spatial distribution of global land cover types. The donut chart inset in the lower left corner represents the proportion of each land cover category worldwide. WB: Water Bodies; EF: Evergreen Forests; DF: Deciduous Forests; MF: Mixed Forests; SH: Shrublands; WS: Woody Savannas; SA: Savannas; GR: Grasslands; CR: Croplands; UBL: Urban and Built-up Lands; PW: Permanent Wetlands; BL: Barren Lands.
2.2. Data Sources
2.2.1. Satellite Dataset
The LAI serves as a crucial metric in quantifying vegetation dynamics [,,]. To investigate the regulatory effect of long-term vegetation dynamics on soil moisture, this study utilized the GIMMS LAI4g dataset. The dataset, which spans the period from 1982 to 2020 with a spatial resolution of 1/12° and a 15-day temporal resolution, was generated by training a back propagation neural network (BPNN) model with 3.6 million high-quality samples and can be accessed via doi:10.5281/zenodo.7649107 []. Owing to its superior performance and widespread adoption, this dataset serves as a robust data source for analyzing long-term vegetation dynamics across multiple scales [,,,]. Global seasonal LAI datasets were generated by merging data from the Northern (NH) and Southern (SH) Hemispheres to harmonize the seasons, defined as spring (NH: March–May; SH: September–November), summer (NH: June–August; SH: December–February), autumn (NH: September–November; SH: March–May), and winter (NH: December–February; SH: June–August) []. While this approach achieves a conceptual unification of seasons, it is a simplified model primarily intended for macro-scale analysis. It is important to recognize that this integration does not imply perfect global seasonal synchrony. That is, it does not reflect the precise, biophysically synchronous events at local levels, but rather provides a useful framework for global comparisons and trend analysis.
2.2.2. Soil Moisture and Meteorological Datasets
To investigate the dynamics of soil moisture at different depths and the regulatory effects of climate and vegetation, this study utilized two datasets: rootzone soil moisture and surface soil moisture. Both datasets were obtained from the National Earth System Science Data Center (https://www.geodata.cn). The dataset, which spanned from 1982 to 2020 with a spatial resolution of 0.1°, integrated multi-source soil moisture products, including ERA5-Land, the four-layer CFSR, and MERRA-2 (5 cm and 100 cm depths) []. The rootzone and surface soil moisture data from the dataset have been successfully used to construct the standardized ecological drought index (SEDI) to investigate the spatiotemporal dynamics and evolutionary trends of ecological drought in China []. Furthermore, its surface soil moisture data have also been applied to quantify the influence of soil moisture on vegetation’s sensitivity to precipitation and temperature []. These successful applications demonstrate the value of this dataset; therefore, we selected it as the foundational data for our study and processed it as follows to meet our analytical requirements. To ensure consistent spatial resolution, the soil moisture dataset, originally at a 0.1° resolution, was resampled to 1/12°. Following the same methodology used for the LAI dataset to align seasons between hemispheres, we integrated soil moisture data from corresponding seasons in the Northern and Southern Hemispheres. Finally, global spring, summer, autumn, and winter datasets were generated for both rootzone and surface soil moisture.
Monthly meteorological data, including precipitation, temperature difference (the difference between monthly maximum and minimum temperatures), solar radiation, and wind speed, were sourced from the TerraClimate dataset (https://www.climatologylab.org/). The dataset has a native spatial resolution of 4.6 km and a temporal coverage from 1982 to 2020. To match the spatial resolution of other datasets and harmonize the seasons between the Northern and Southern Hemispheres, we first resampled the meteorological data to a 1/12° resolution. Subsequently, the data were aggregated based on the seasonal alignment between the hemispheres to construct a global seasonal meteorological dataset for spring, summer, autumn, and winter.
2.2.3. Land Cover and Climate Classification Datasets
The climate zone classification was based on the latest Köppen–Geiger climate classification system (https://www.gloh2o.org/koppen/, accessed on 1 May 2025) []. While this dataset provides classifications for historical, current, and future periods, this study selected the 1991–2020 map as it represents the climatic conditions of our study period. The classification scheme categorizes the globe into five major climate groups: Tropical, Arid, Temperate, Cold, and Polar. Due to its low vegetation cover, the Polar region was excluded from our analysis, focusing on the remaining four climate zones.
The MCD12C1 land cover dataset, derived from MODIS and based on the International Geosphere-Biosphere Programme (IGBP) classification system, was reclassified into twelve major types for the period from 2001 to 2020: water bodies, evergreen forests, deciduous forests, mixed forests, shrublands, woody savannas, savannas, grasslands, croplands, urban and built-up lands, permanent wetlands, and barren lands (see Table S1 for detailed classification information). To ensure our analysis focused on the characteristics of stable environments, we exclusively selected areas where the land cover type remained unchanged throughout the 2001–2020 period for subsequent analysis.
2.3. Methods
2.3.1. Trend Analysis Based on Linear Regression
To analyze the seasonal trends of LAI and soil moisture, a linear regression model was employed, and the statistical significance of these trends was assessed using the Mann–Kendall test []. Specifically, the trend analysis involved calculating the slope of the linear regression for each pixel over three distinct periods: 1982–2020, 1982–1999, and 2000–2020, using Equation (1). The formula for the linear regression slope is as follows:
In the formula, and represent the values of the independent and dependent variables for year i, respectively, and n is the total number of years in the study period. A slope value greater than 0 indicates an increasing trend in the dependent variable, whereas a value less than 0 indicates a decreasing trend.
2.3.2. Soil Moisture Changes Induced by LAI and Climate Factors
The sensitivity of soil moisture to LAI and climatic factors was analyzed using a multiple linear regression model, as shown in Equation (2). In this model, soil moisture served as the response variable, while LAI and climatic factors were the explanatory variables. The sensitivity coefficient was defined as the partial derivative of soil moisture with respect to each explanatory variable. This approach aims to decouple the association between soil moisture and each explanatory variable from the confounding effects of other covariates []. To eliminate non-stationarity in the time series data, all variables were detrended prior to the multiple regression analysis. Additionally, the Variance Inflation Factor (VIF) was used as a key diagnostic tool to assess the impact of multicollinearity on the robustness of the regression model (Equation (3)) [].
In Equation (2), , , , , and represent the sensitivity coefficients of soil moisture to LAI, precipitation (PPT), solar radiation (Srad), temperature difference (Tem-D), and wind speed (WS), respectively. Subsequently, the changes in soil moisture induced by LAI and climate factors (, , , , ) are calculated by multiplying the long-term trends from Equation (1) by their corresponding sensitivity coefficients []. The in Equation (3) represents the coefficient of determination obtained by regressing one predictor variable (e.g., LAI) against all others (PPT, Srad, Tem-D, WS). The higher the , the stronger the linear association with other variables, thus yielding a larger VIF []. While VIF > 5 can indicate potential multicollinearity, a threshold of VIF > 10 is commonly adopted to diagnose severe cases []. Therefore, this study employs VIF > 10 to identify severe multicollinearity.
2.3.3. Shapley Additive Explanations (SHAP)
To better understand the impacts of LAI and climatic factors on soil moisture at the pixel scale, this study employed a Random Forest (RF) model []. Given the limited sample size, we implemented a 5-fold cross-validation (CV) scheme to train and evaluate the RF model, ensuring its stability and the reliability of the results. This approach facilitates better utilization of the entire dataset and effectively mitigates the incidental bias arising from a single data partition. The hyperparameter tuning process was focused on preventing overfitting and optimizing stability. To strictly control the complexity of individual decision trees, we held several key parameters constant: max_depth was set to 3, min_samples_split to 3, and min_samples_leaf to 1. Concurrently, the number of trees (n_estimators) was designated as the core hyperparameter for optimization, with a search space of [30, 50, 70, 100, 120]. To further reduce the influence of random fluctuations, the entire 5-fold CV process was repeated 50 times for each candidate n_estimators value. The model’s performance was evaluated using dual metrics—the coefficient of determination (R2) and the Root Mean Squared Error (RMSE). The n_estimators value that yielded the highest average R2 and the lowest average RMSE was selected as optimal, ensuring both the model’s predictive accuracy and robustness.
Upon establishing the optimal model, we employed the SHAP (Shapley Additive Explanations) method for model interpretation []. SHAP is an explainable machine learning method that quantifies the contribution of each feature to a model’s prediction by calculating SHAP values; a higher SHAP value indicates greater feature importance [,,]. We applied SHAP analysis to assess the contribution of each factor to soil moisture and identified the dominant controlling factor for each pixel by selecting the feature with the highest SHAP score []. The SHAP value is calculated using the following formula:
where denotes the SHAP value for feature j, represents any possible subset of features that excludes feature j. represents the collection of all subsets that exclude feature j. denotes the total number of features (). represents the prediction output of the model when using only the feature subset . represents the change in the model’s prediction when feature j is added to the subset . To ensure the reliability of the SHAP analysis conclusions, we conducted a consistency validation. This procedure involved fixing the optimal hyperparameters while varying only the random_state and retraining the model 20 times. We then calculated the frequency with which the initially identified top contributing variable maintained its first-place rank across these 20 runs, thereby verifying the consistency and reliability of our feature importance findings. The entire computational and validation workflow was executed on the Pengcheng Cloud Brain II high-performance computing platform.
2.3.4. LAIMAX and POS Extraction Methods
Snow cover can contaminate satellite-observed signals, which severely interferes with the time-series fitting process and, in turn, significantly reduces the accuracy of phenological information extraction [,]. Given that the GIMMS LAI4g dataset has already flagged snow-contaminated pixels during its production, our methodology proceeds as follows. First, we performed gap-filling using a background value set to 5% of all snow-free observations. Subsequently, based on repeated testing and literature review, the Savitzky–Golay (SG) filter algorithm with a window size of 9 was applied to smooth the time series and filter out inherent noise []. Finally, a daily LAI time series was reconstructed using the cubic spline interpolation method (Equation (5)) [,]. LAIMAX is defined as the maximum value of the generated daily LAI time series, and POS is the day of the year on which LAIMAX occurs.
where is the fitted daily LAI time series, and are the smoothed LAI values for two neighboring points, and , , , and are the fitting coefficients.
2.3.5. Correlation Analysis
In this study, Pearson correlation and partial correlation analyses were employed to investigate the linear associations among variables. Specifically, Pearson correlation analysis was used to assess the pairwise relationships between phenological metrics (POS, LAIMAX) and soil moisture at different depths (surface and rootzone). Partial correlation analysis was then applied to determine the relationship between individual climate factors (precipitation, solar radiation, temperature difference, and wind speed) and the phenological metrics (POS, LAIMAX), while controlling for the effects of other climatic variables. The coefficients of both partial and Pearson correlation analyses range from −1 to 1. A positive value indicates a positive correlation, while a negative value signifies a negative correlation. The magnitude of the absolute value reflects the strength of the correlation. The correlation is considered statistically significant when the p-value is less than 0.05. The formulas for Pearson correlation analysis (Equation (6)) and partial correlation analysis (Equation (7)) are as follows:
In Equation (6), represents the Pearson correlation coefficient. denotes the POS(LAIMAX) for year . represents the soil moisture (rootzone and surface) for year . indicates the number of years, and and represent the corresponding variable averages over the study period. In Equation (7), refers to the correlation between soil moisture () and a single climate factor (), while controlling for other climatic variables (). denotes the correlation between variables and . represents the correlation between and , and indicates the correlation between variables and
2.3.6. Sensitivity of Rootzone and Surface Soil Moisture to POS and LAIMAX
The sensitivity of rootzone and surface soil moisture to POS and LAIMAX was quantified using the slope of a linear regression (Equation (8)) [,]. The sensitivity coefficient quantifies the magnitude of soil moisture variation (unit: m3/m3·d−1 or m3m−3/m2m−2) induced by changes in POS and LAIMAX. A negative value indicates an inverse relationship, meaning that an increase in POS and LAIMAX is associated with a decrease in rootzone and surface soil moisture, and vice versa.
where represents POS and LAIMAX, denotes the rootzone soil moisture and surface soil moisture, and is the random error.
2.3.7. Hurst Exponent
The Hurst exponent, an indicator for evaluating the persistence (or long-term memory) and consistency within long-term time series data, has found extensive application in the fields of climatology and vegetation science [,,]. The main computational procedure is as follows:
- (1)
- Divide the long time series into sub-series, and for each sub-series.
- (2)
- Define the mean sequence of the time series.
- (3)
- Calculate the accumulated deviation.
- (4)
- Define the range sequence.
- (5)
- Define the standard deviation sequence.
- (6)
- Compute the Hurst exponent.
- (7)
- The H value (the Hurst exponent) is obtained by the least squares fit formula:
The Hurst exponent (H) ranges between 0 and 1. When H < 0.5, it indicates that future trends in the time series will exhibit anti-persistence (a tendency to reverse relative to the current state), with greater anti-persistence as H decreases. Conversely, when H > 0.5, it suggests future trends will maintain persistence (continue in the same direction), with stronger consistency as H increases. A value of H = 0.5 signifies that future changes are uncorrelated with the current state (random fluctuations). To further analyze the temporal variation characteristics of vegetation phenology (POS and LAIMAX) from 1982 to 2020, this study classified the Hurst exponent into four levels: strong anti-persistence (0–0.3), weak anti-persistence (0.3–0.45), random fluctuation (0.45–0.55), and strong persistence (0.55–1.0).
3. Results
3.1. Spatiotemporal Variation in Soil Moisture and LAI
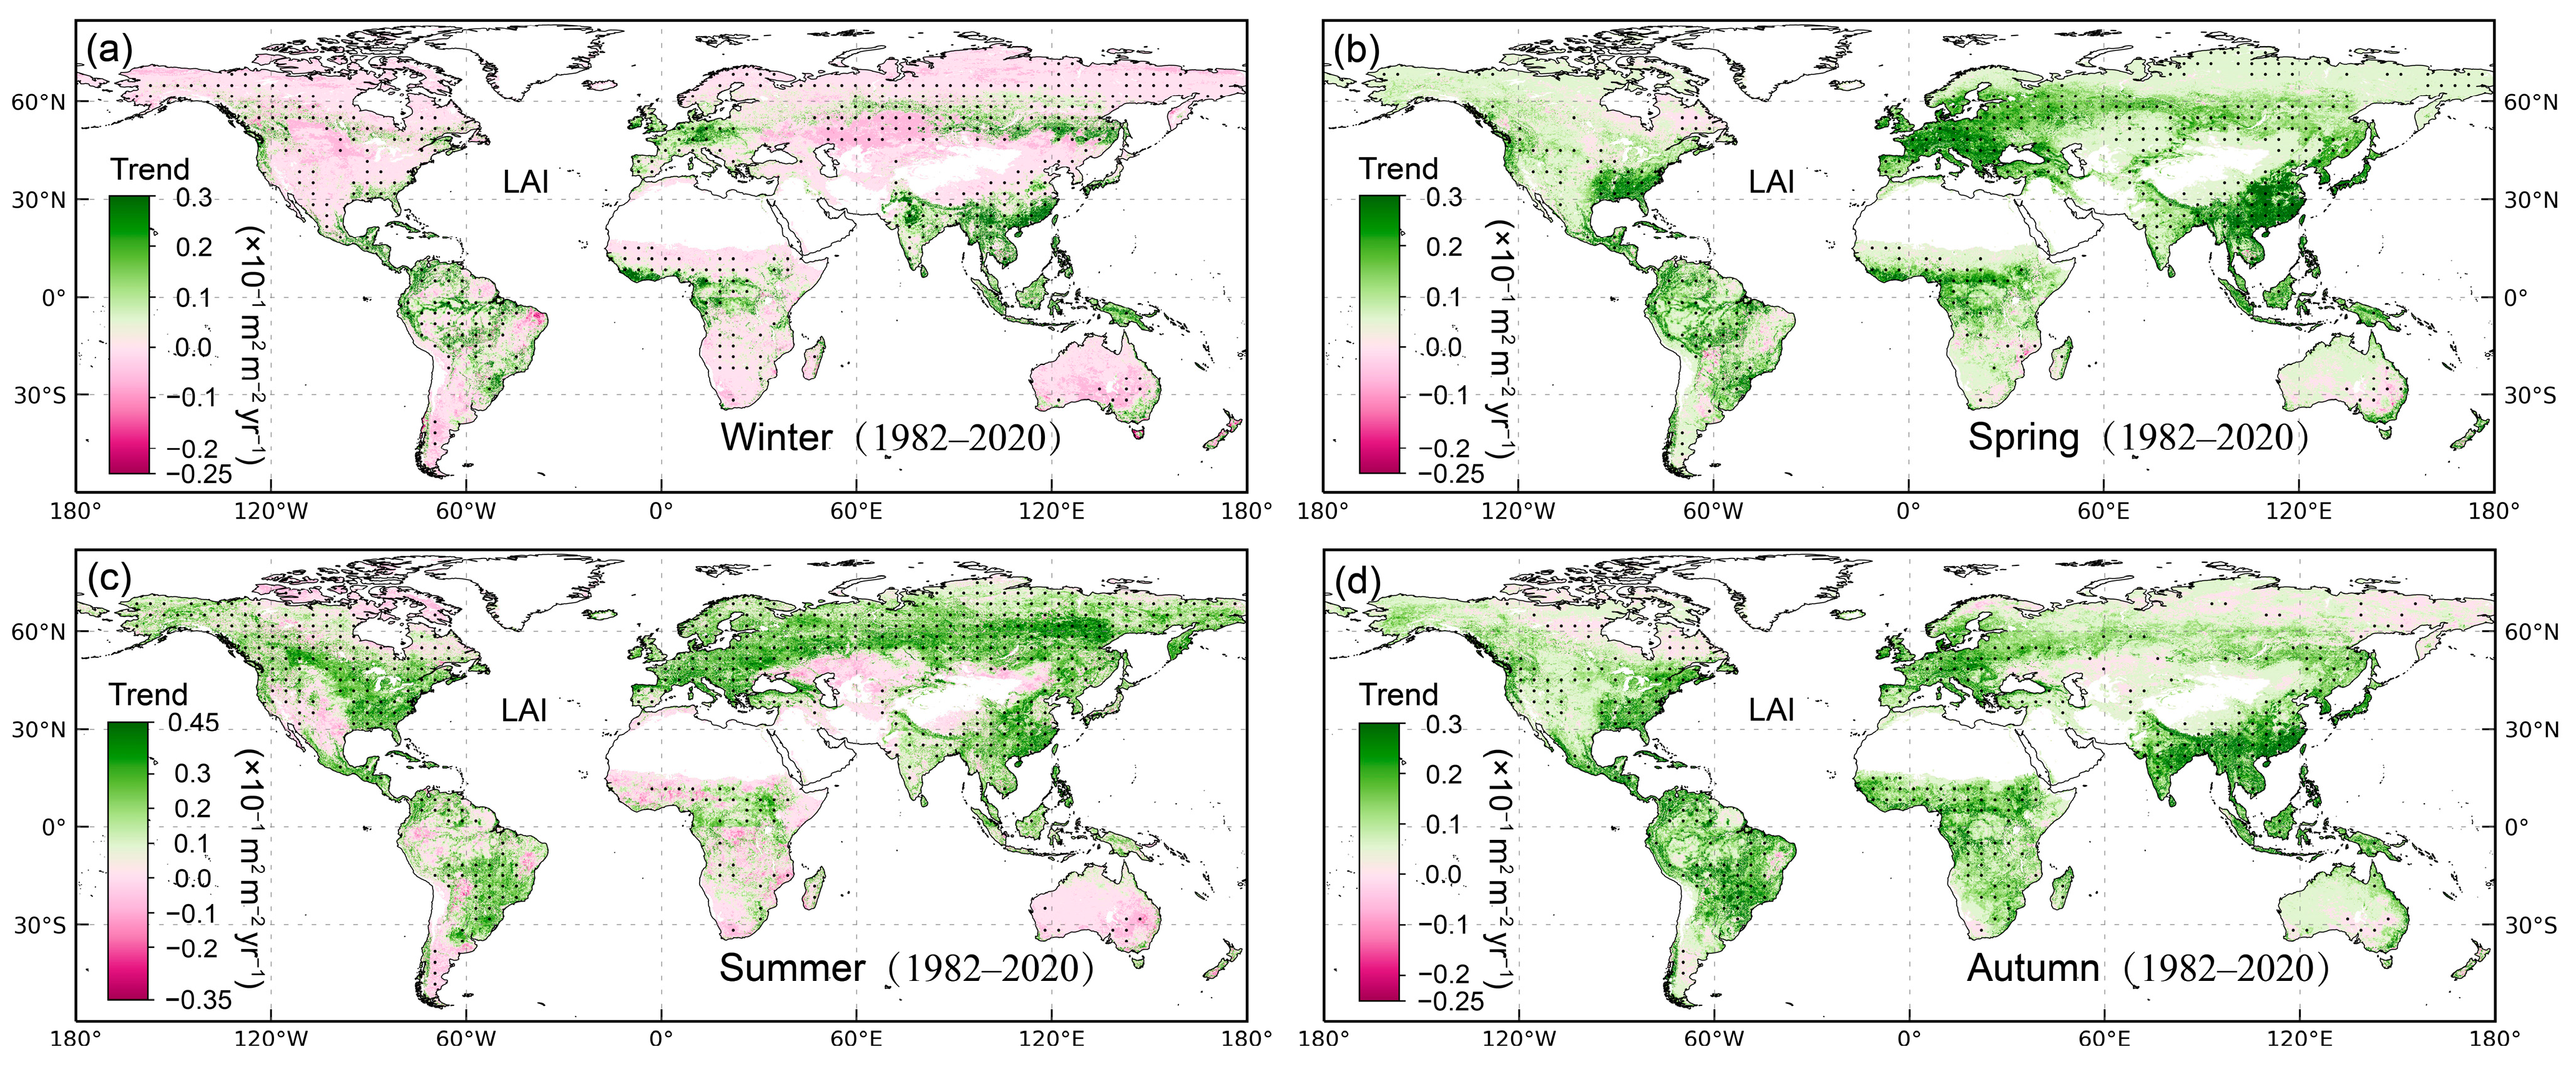
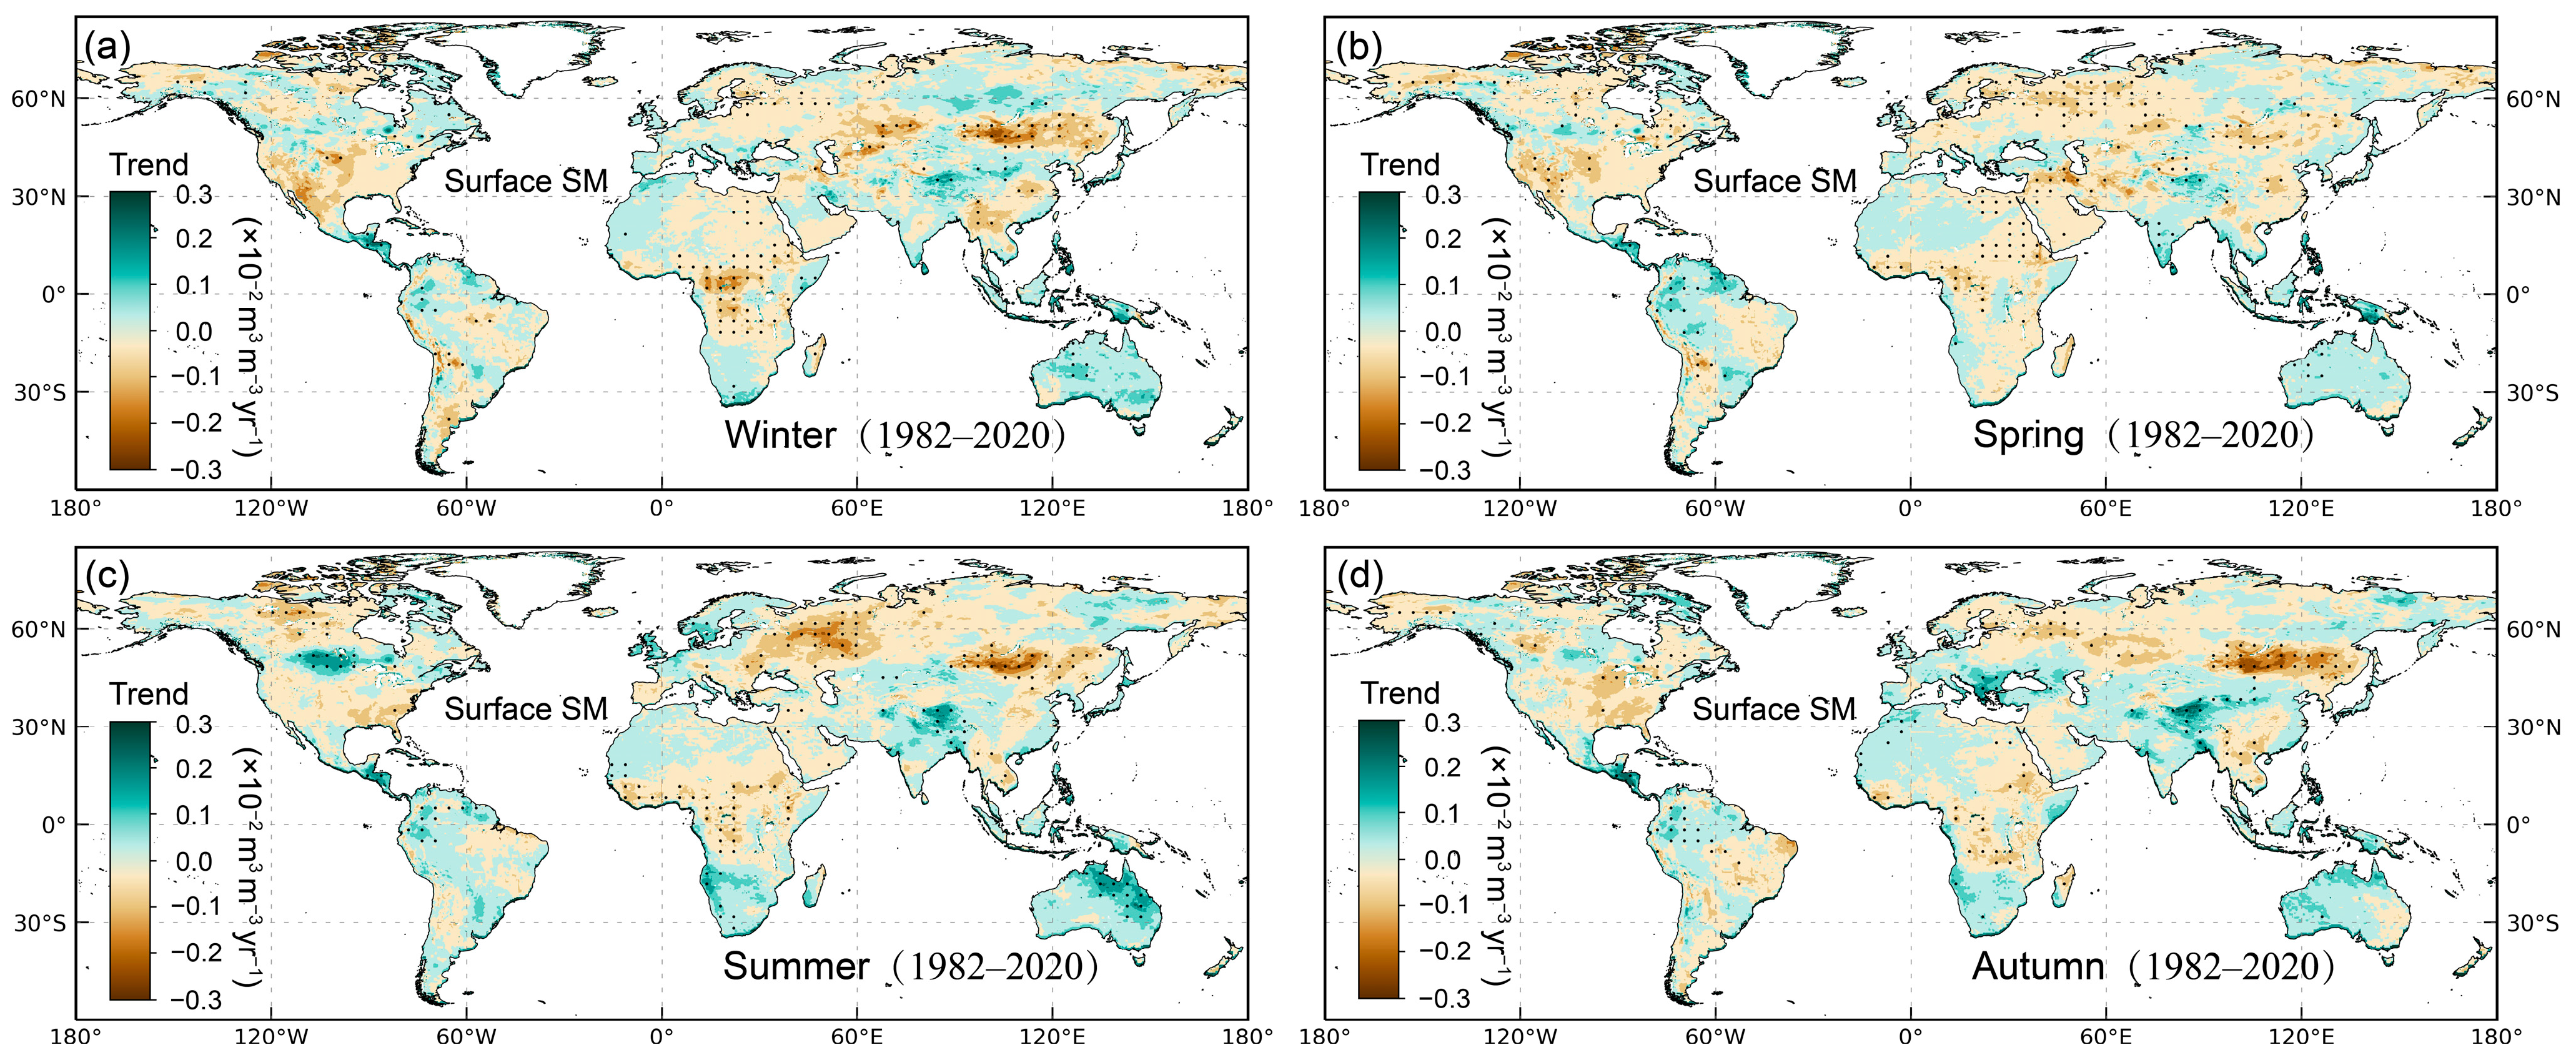
From 1982 to 2020, both LAI and soil moisture exhibited significant seasonal and regional variations. Regarding LAI (Figure 2), a notable trend of greening (increase in LAI) during winter was observed across multiple regions, with Southeast Asia showing the most pronounced increase (0.13 × 10⁻¹ m2m−2 yr−1), followed by Central Europe (0.10 × 10⁻¹ m2m−2 yr−1), India (0.09 × 10⁻¹ m2m−2 yr−1), Southeast Australia (0.083 × 10⁻¹ m2m−2 yr−1), and the tropical rainforest regions of Africa and South America (0.08 × 10⁻¹ and 0.078 × 10⁻¹ m2m−2 yr−1, respectively). A significant greening trend was also evident in China (0.06 × 10⁻¹ m2m−2 yr−1). In spring, a widespread greening trend was observed across most regions globally, with an average change rate of 0.058 × 10⁻¹ m2m−2 yr−1, while localized browning (decrease in LAI) trends were relatively weak (average −0.044 × 10⁻¹ m2m−2 yr−1). During summer, the greening trend peaked across the entire Northern Hemisphere, except in arid regions, with an average change rate of 0.10 × 10⁻¹ m2m−2 yr−1; conversely, Australia exhibited a clear browning trend (average −0.03 × 10⁻¹ m2m−2 yr−1). In autumn, a greening trend was similarly maintained across most regions globally, with an average change rate of 0.062 × 10⁻¹ m2m−2 yr−1. As shown for rootzone soil moisture (Figure 3), winter and spring featured spatially consistent global patterns of wetting and drying. The average rate of increase was 0.089 × 10⁻² m3m−3 yr−1 in winter and 0.088 × 10⁻² m3m−3 yr−1 in spring, while the average rate of decrease was −0.065 × 10⁻² and −0.063 × 10⁻² m3m−3 yr−1, respectively. Summer trends demonstrated pronounced regional variations. Eurasia was characterized by a dipole pattern, with drying in the north-central region (−0.067 × 10⁻² m3m−3 yr−1) and wetting in the south-central region (0.076 × 10⁻² m3m−3 yr−1). Meanwhile, significant wetting occurred in parts of the Southern Hemisphere, including southern Africa (0.11 × 10⁻² m3m−3 yr−1), northwestern South America (0.077 × 10⁻² m3m−3 yr−1), and southeastern South America (0.10 × 10⁻² m3m−3 yr−1). In autumn, the drying zone across north-central Eurasia shrank (−0.063 × 10⁻² m3m−3 yr−1). In contrast, surface soil moisture trends (Figure 4) were generally weaker in magnitude. Notably, large swaths of the Northern Hemisphere experienced a consistent drying trend across all seasons (rates of −0.037 × 10⁻², −0.035 × 10⁻², −0.037 × 10⁻², and −0.037 × 10⁻² for winter, spring, summer, and autumn, respectively; unit: m3m−3 yr−1). Conversely, Australia in the Southern Hemisphere displayed a persistent wetting trend throughout the four seasons (rates of 0.043 × 10⁻², 0.027 × 10⁻², 0.052 × 10⁻², and 0.043 × 10⁻² for winter, spring, summer, and autumn, respectively; unit: m3m−3 yr−1).
Figure 2.
The spatial distribution of global seasonal LAI trends from 1982 to 2020. Panels show the trends for (a) winter, (b) spring, (c) summer, and (d) autumn. Black dots indicate trend pixels that have passed the significance MK test.
Figure 3.
The spatial distribution of seasonal trends in global rootzone soil moisture from 1982 to 2020. Panels show the trends for (a) winter, (b) spring, (c) summer, and (d) autumn. Black dots indicate trend pixels that have passed the significance MK test.
Figure 4.
The spatial distribution of seasonal trends in global surface soil moisture from 1982 to 2020. Panels show the trends for (a) winter, (b) spring, (c) summer, and (d) autumn. Black dots indicate trend pixels that have passed the significance MK test.
A comparative analysis of global LAI data for two distinct periods (1982–1999 vs. 2000–2020) revealed a significantly accelerated greening trend across all seasons during 2000–2020 compared to the earlier period (Figures S2 and S3). Regarding soil moisture, changes in rootzone soil moisture exhibited distinct spatiotemporal heterogeneity. In central Eurasia, large areas that experienced soil moisture decrease across all seasons during 1982–1999 shifted to a significant increasing trend during 2000–2020. Conversely, northeastern Asia showed an opposite pattern of change (Figures S4 and S5). Furthermore, regions in Africa and South America transitioned from an earlier decrease in rootzone soil moisture to a significant increasing trend during the 2000–2020 period. Overall, the rate of rootzone soil moisture increase in the 21st century was faster than that during 1982–1999. For surface soil moisture, most regions globally showed a general decreasing trend during 1982–1999. After the year 2000, however, this decreasing trend became mainly concentrated in the high-latitude regions of the Northern Hemisphere (Figures S6 and S7).
From 1982 to 2020, the average LAI for all major vegetation types globally peaked in summer. Specifically, deciduous forests exhibited the highest LAI (4.86 m2m−2), followed by evergreen forests (4.60 m2m−2), mixed forests (4.27 m2m−2), woody savannas (3.02 m2m−2), savannas (2.31 m2m−2), croplands (1.94 m2m−2), grasslands (1.02 m2m−2), and shrublands (0.93 m2m−2) (Table S2). Furthermore, across all four seasons, both rootzone and surface soil moisture in mixed forests were generally higher than in other vegetation types. Regarding seasonal greening trends (Table S3), deciduous and mixed forests showed the most rapid LAI increase in spring, at a rate of approximately 0.69 × 10⁻² m2m−2 yr−1. In summer, the increasing trend was most pronounced in mixed forests (0.72 × 10⁻² m2m−2 yr−1), whereas grasslands exhibited the slowest trend (0.18 × 10⁻² m2m−2 yr−1). During autumn, deciduous and mixed forests continued to show strong growth rates of 0.64 × 10⁻² m2m−2 yr−1 and 0.48 × 10⁻² m2m−2 yr−1, respectively. In terms of long-term changes in soil moisture (Table S3), an increasing trend was observed across all seasons for both rootzone and surface soil moisture in evergreen forests, deciduous forests, woody savannas, savannas, and croplands. Among these, evergreen forests demonstrated the largest increase, followed by deciduous forests. In contrast, mixed forests and shrublands experienced a decreasing trend in surface soil moisture across all seasons, while their rootzone soil moisture showed a decline only in specific seasons. For grasslands, rootzone soil moisture increased across all four seasons, whereas surface soil moisture only showed an increasing trend during summer and autumn.
From 1982 to 2020, the average LAI trend across all climate zones and seasons indicated a widespread greening (Figure S8). The LAI trend was lowest in arid zones, while the average spring LAI trend in temperate zones was the highest, reaching 0.05 × 10⁻¹ m2m−2 yr−1. In tropical regions, the average LAI trends for spring and summer were lower than those for winter and autumn. During this period, both surface and rootzone soil moisture showed a decreasing average trend in cold climate zones. In contrast, these soil moisture layers generally exhibited an increasing trend across all seasons in other climate zones, including arid, temperate, and tropical regions (Figure S8). From 1982 to 1999 and from 2000 to 2020 (Figure S8), all climate zones exhibited a greening trend in LAI across all seasons, with the rate of change generally higher in the post-21st-century period (2000–2020) compared to the earlier period (1982–1999). In arid, cold, temperate, and tropical climate zones, rootzone soil moisture shifted from a decreasing trend during 1982–1999 to an increasing trend during 2000–2020. Similarly, surface soil moisture overall transitioned from a decreasing trend in 1982–1999 to an increasing trend in 2000–2020 across all climate zones. From 2000 to 2020, the increasing trends in rootzone and surface soil moisture were more pronounced in temperate and tropical climate zones than in cold and arid zones (Figures S8 and S9).
3.2. Changes in Soil Moisture Induced by LAI and Climate Factors
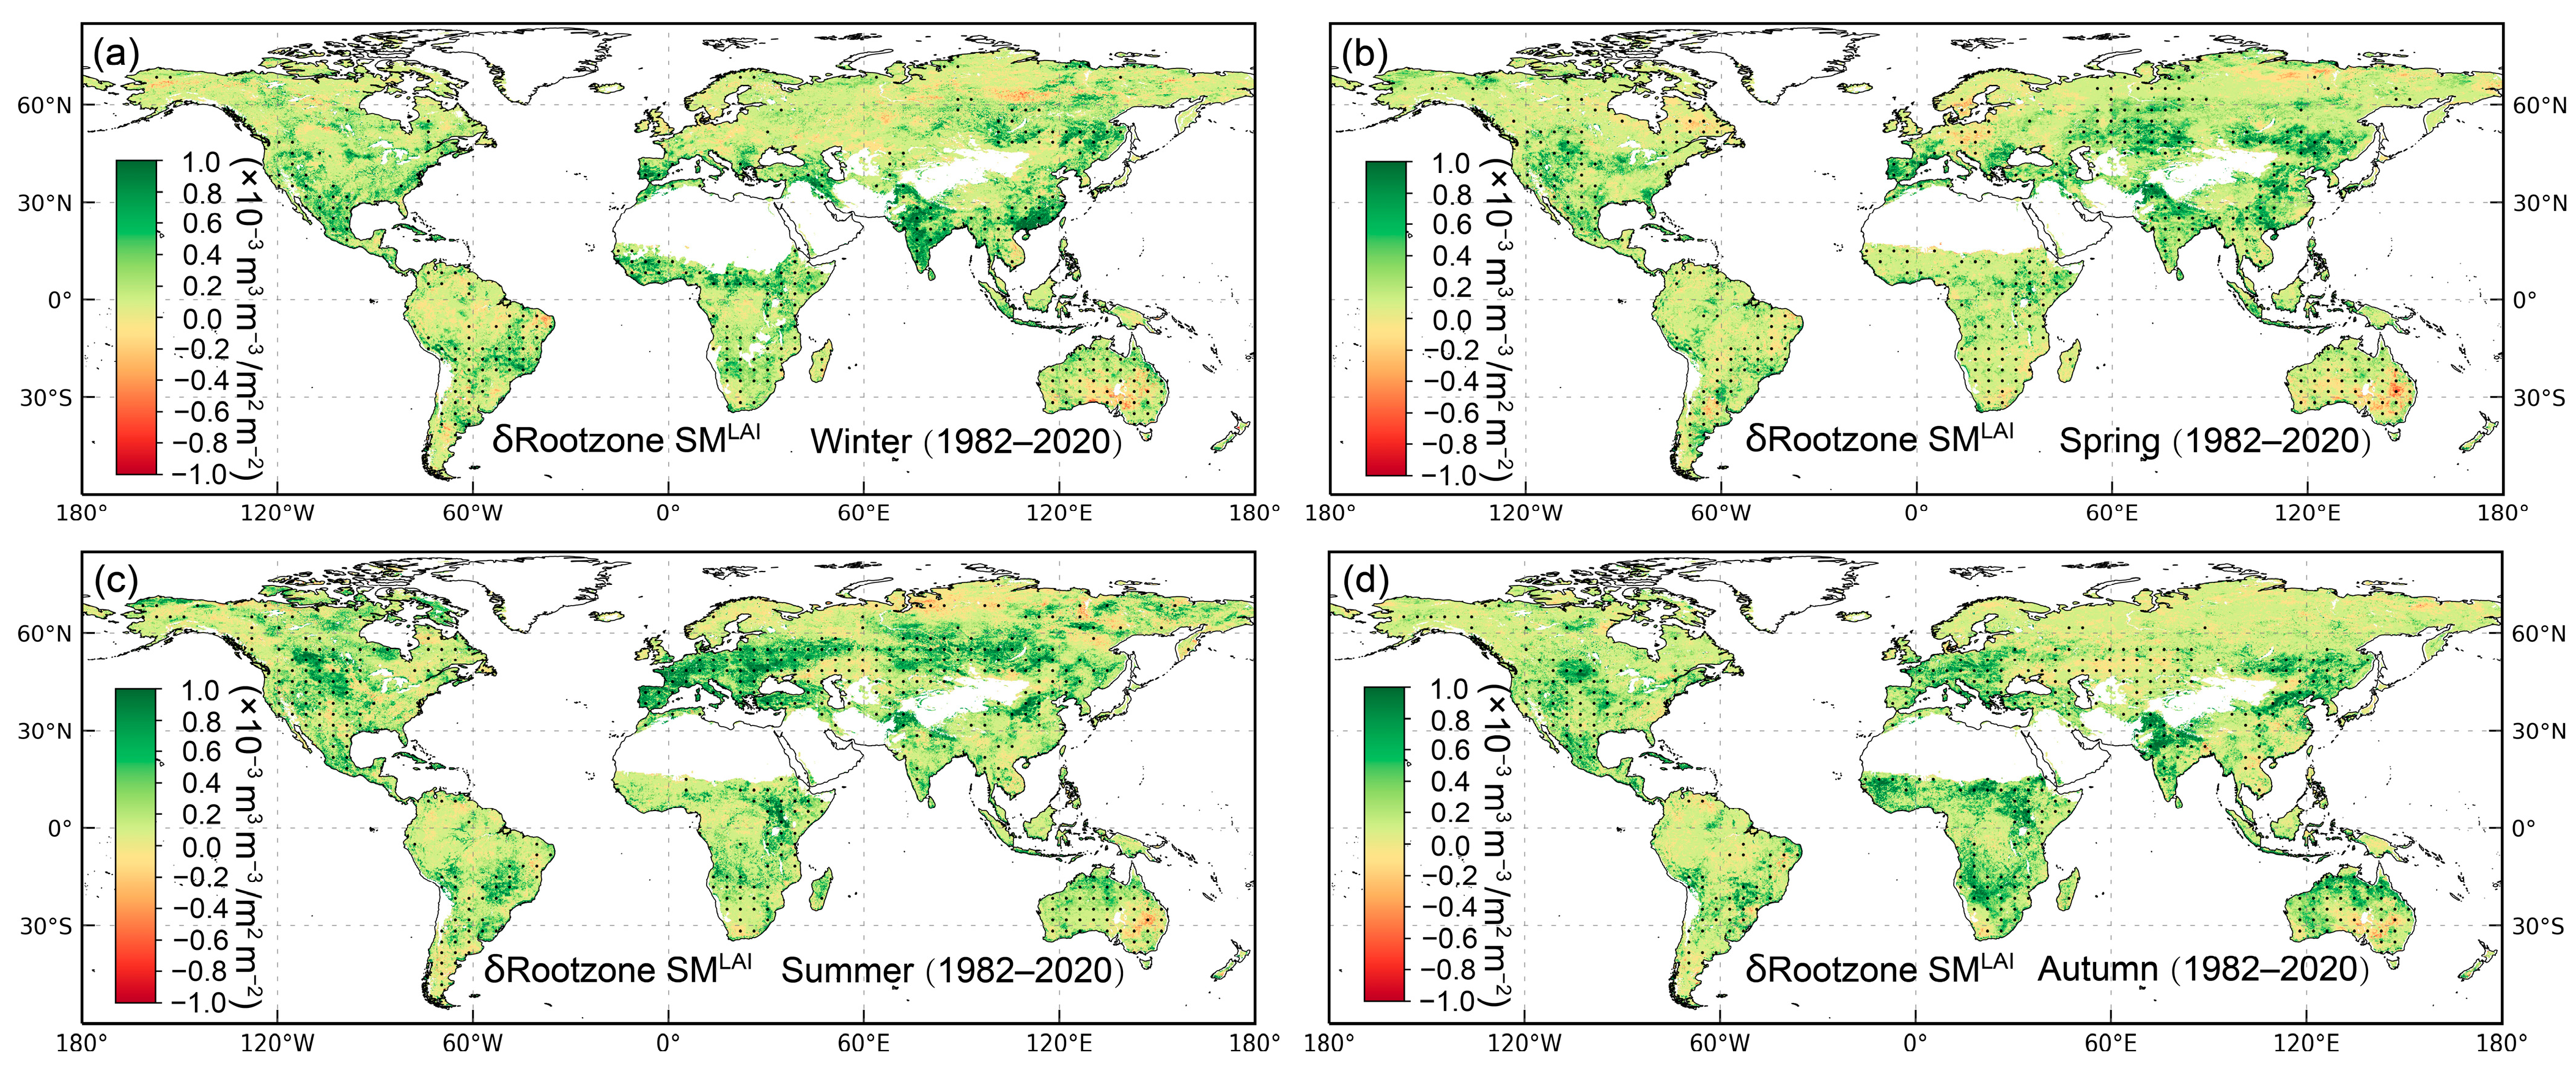
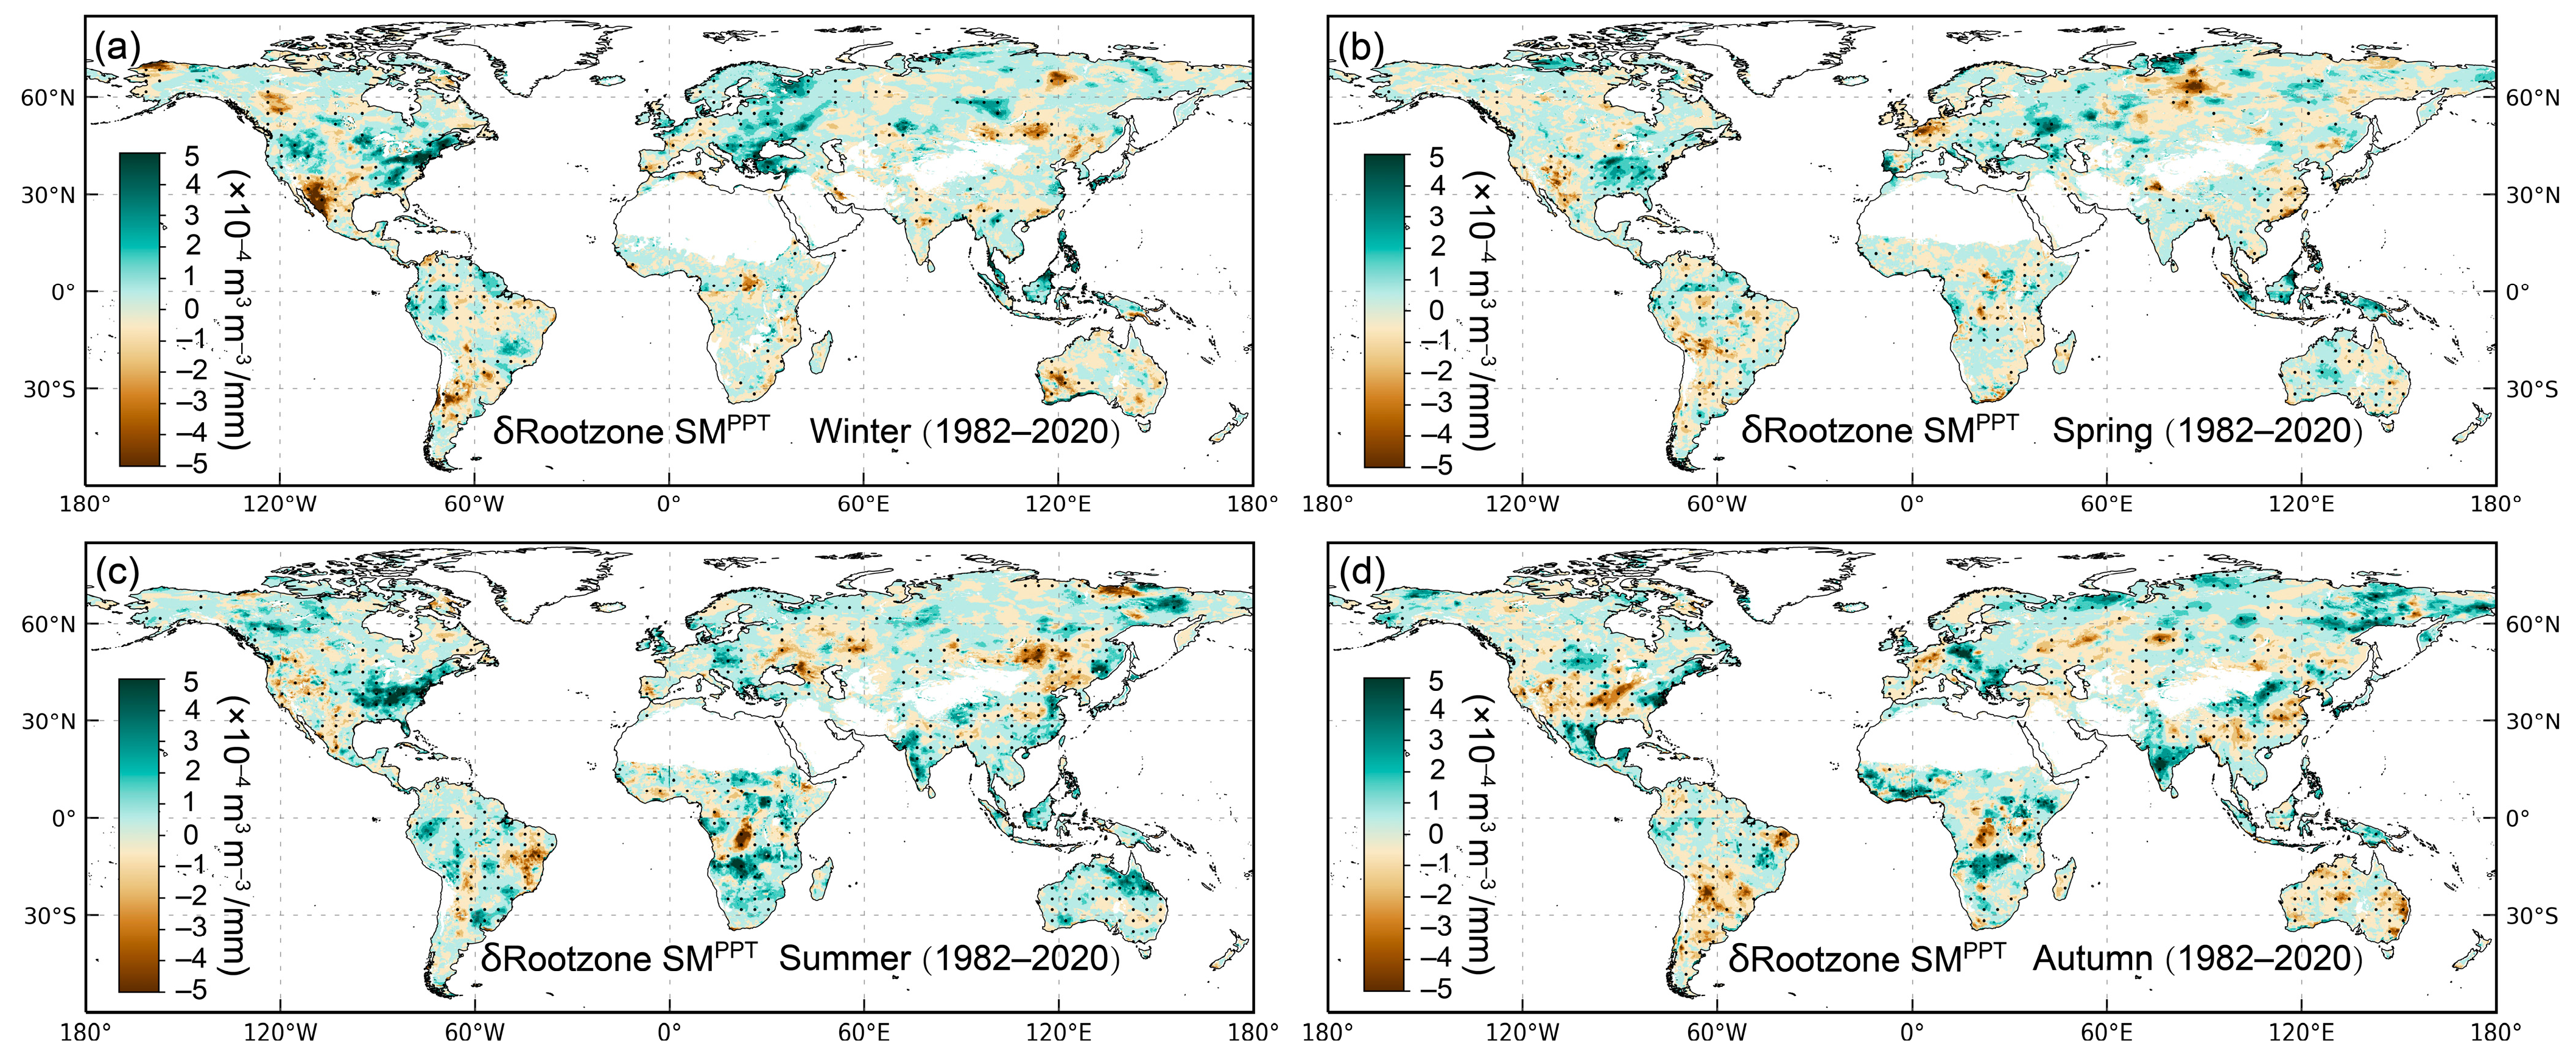
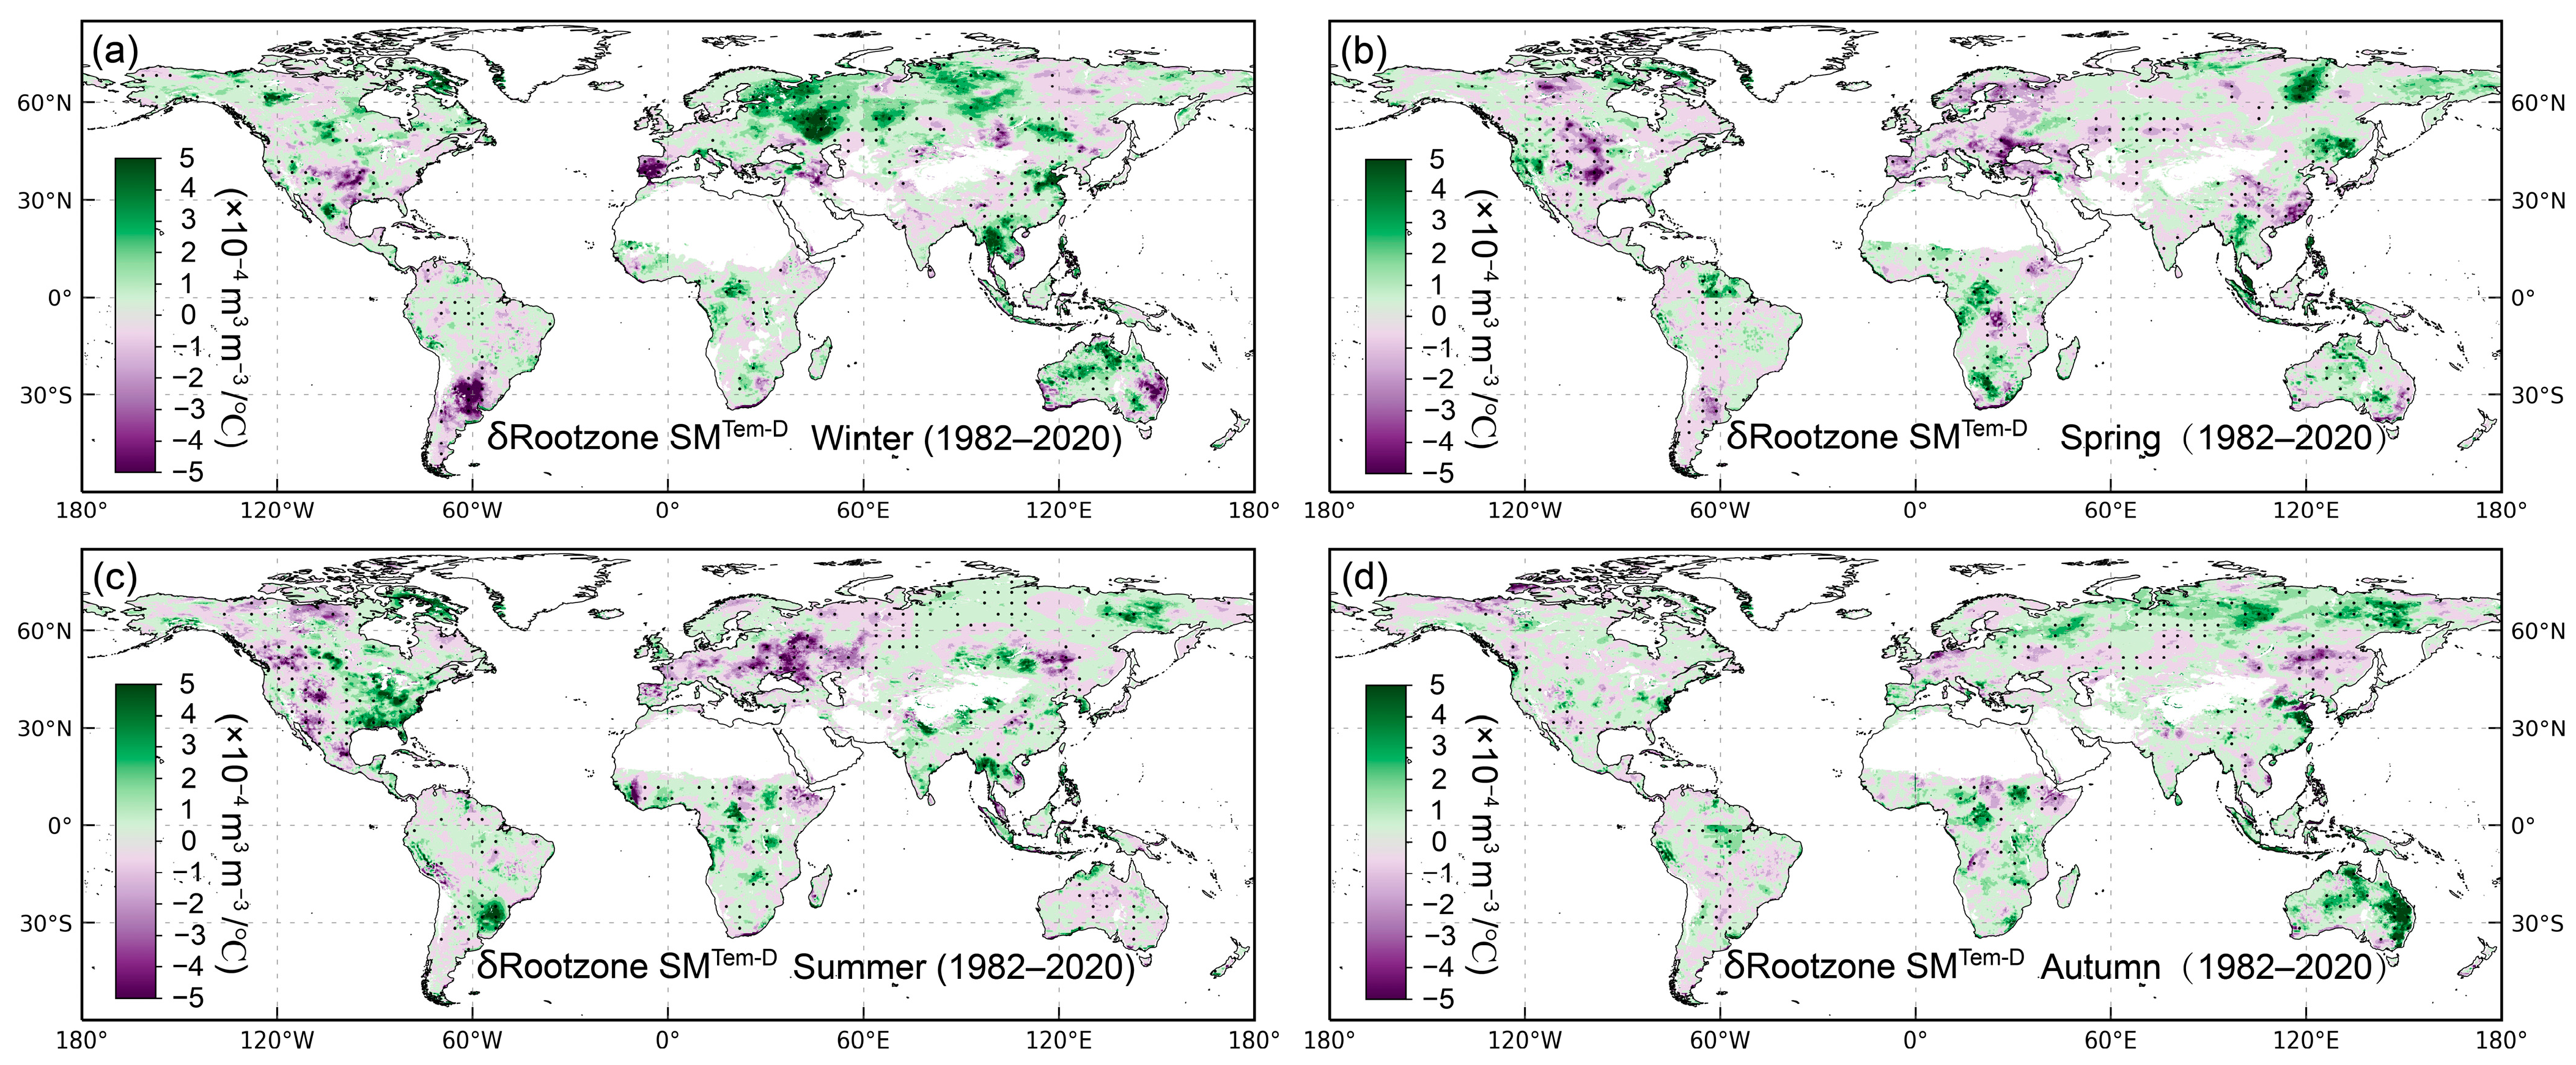
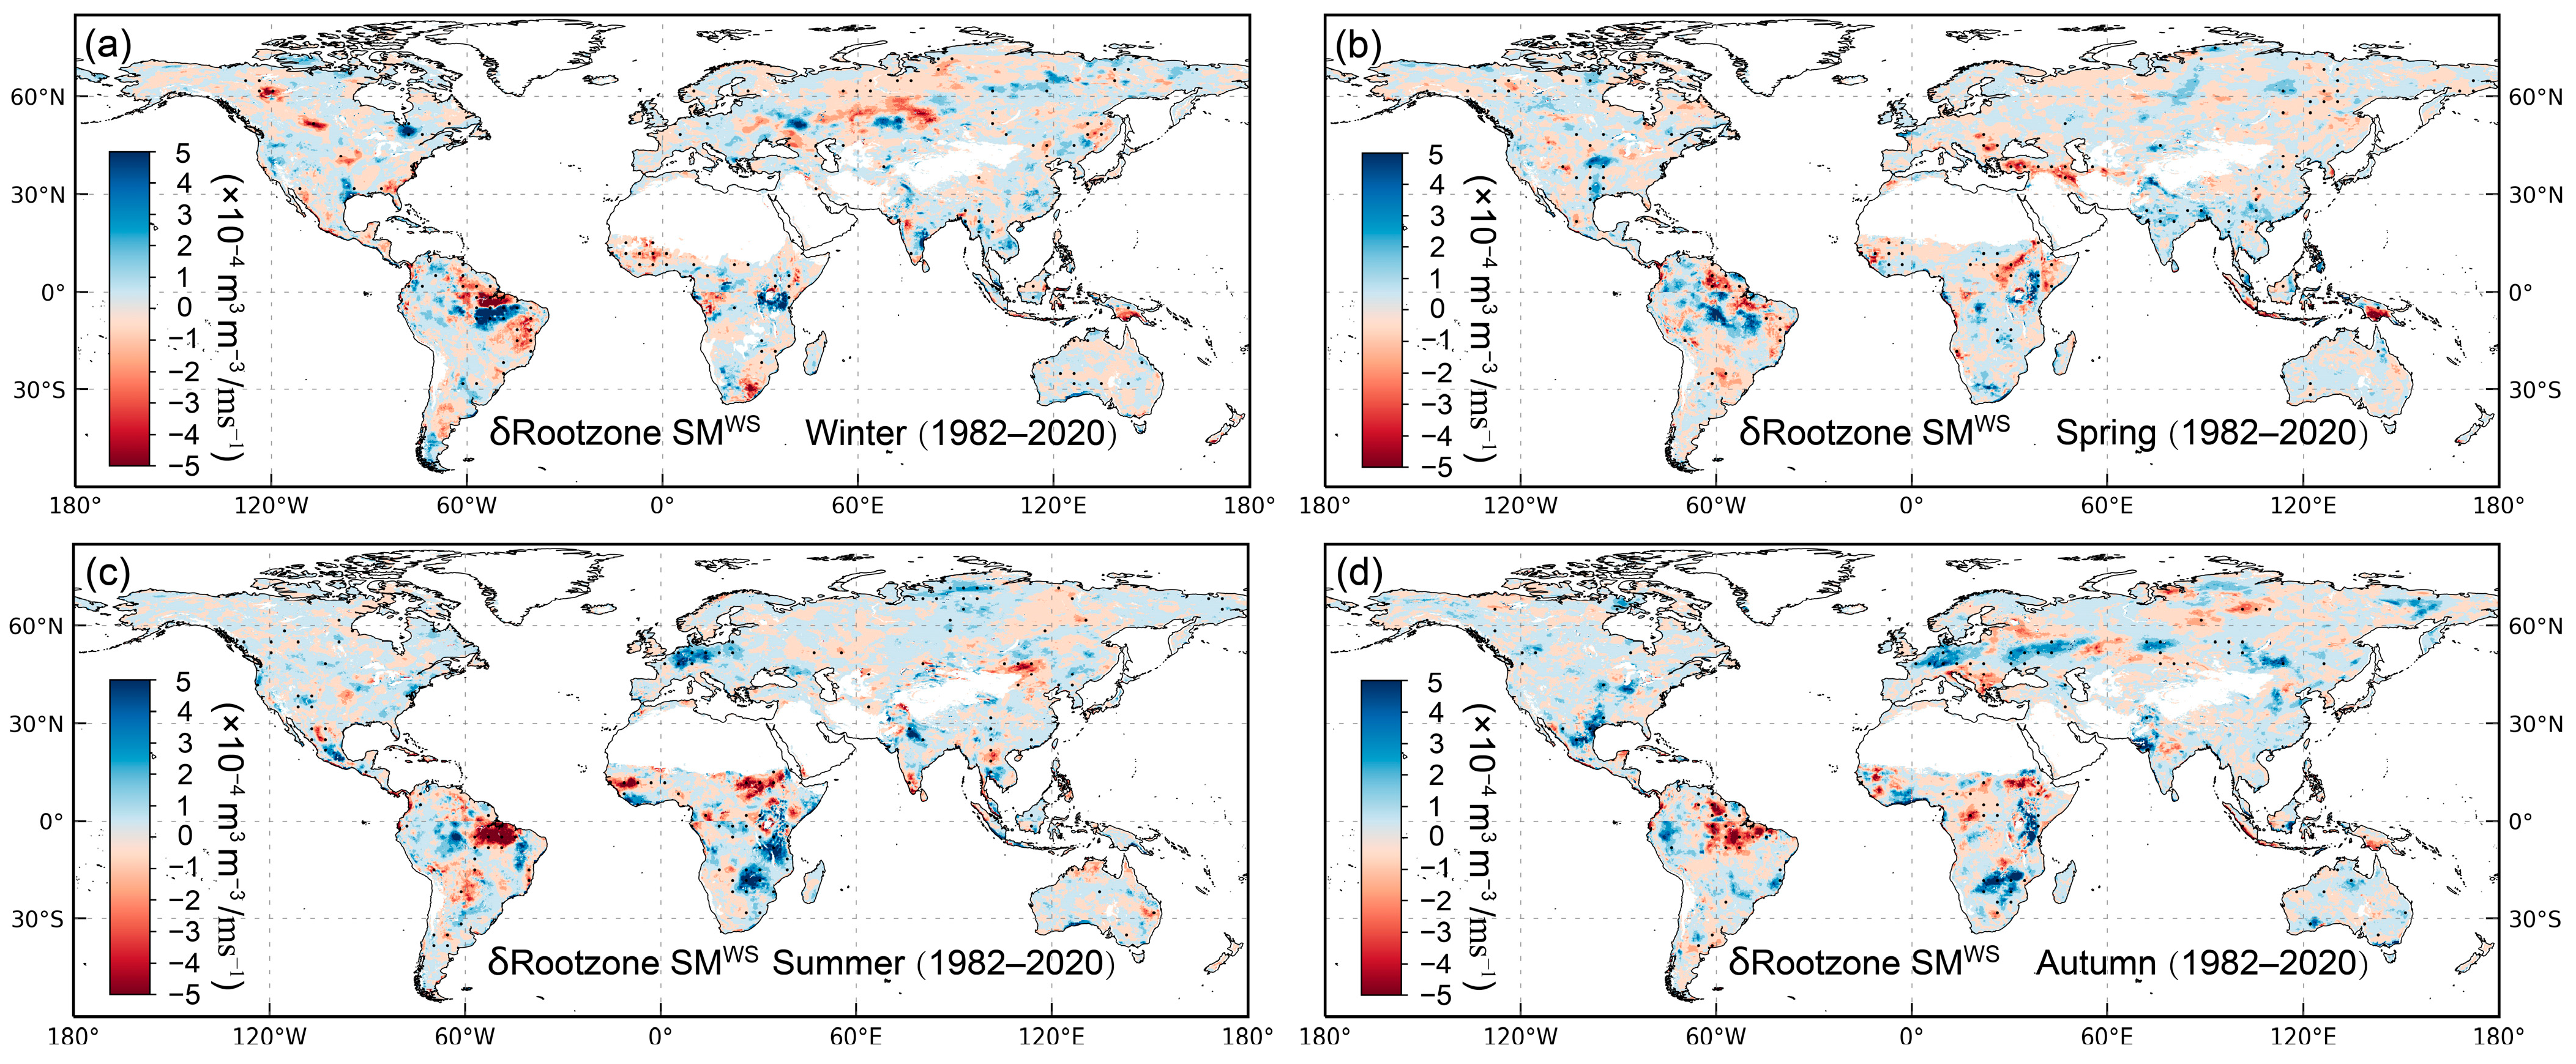
Table S4 presents the results of the Variance Inflation Factor (VIF) test for each variable across the entire study period (1982–2020) and two sub-periods (1982–1999 and 2000–2020). For all periods, the proportion of pixels with VIF < 10 for each variable is generally above 95%. This indicates that the degree of multicollinearity among the selected variables is weak. Consequently, the use of a multiple linear regression model to analyze the sensitivity of soil moisture to LAI and climatic factors is both robust and appropriate. In the spatial distribution of rootzone and surface soil moisture changes induced by LAI (Figure 5 and Figure S10), LAI caused a more pronounced increasing trend in rootzone soil moisture than in surface soil moisture in China and India during winter, as well as in central Eurasia during summer. Precipitation exerted concentrated effects on both rootzone and surface soil moisture at regional scales, driving either increases or decreases (Figure 6 and Figure S11). Summer solar radiation primarily reduced rootzone soil moisture in Eurasia and central Africa, while enhancing it in India, northern North America, Australia, southern Africa, and central-northern South America (Figure 7). In autumn, solar radiation induced a significant increasing trend in rootzone soil moisture but a decreasing trend in surface soil moisture in India (Figure S12). Winter temperature differences led to a marked increase in rootzone soil moisture accompanied by decreased surface soil moisture in north-central Eurasia (Figure 8 and Figure S13). During summer, temperature differences caused reduced rootzone soil moisture in central Europe while moderating the declining trend of surface soil moisture in the same region. Furthermore, summer wind speed created stratified soil moisture patterns in northeastern South America, characterized by a significant decreasing trend in rootzone soil moisture but an increasing trend in surface soil moisture (Figure 9 and Figure S14).
Figure 5.
The spatial distribution of rootzone soil moisture changes induced by LAI from 1982 to 2020. The panels show the results for (a) winter, (b) spring, (c) summer, and (d) autumn. Black dots indicate pixels that passed the significance test (p < 0.05).
Figure 6.
The spatial distribution of rootzone soil moisture changes induced by precipitation from 1982 to 2020. The panels show the results for (a) winter, (b) spring, (c) summer, and (d) autumn. Black dots indicate pixels that passed the significance test (p < 0.05).
Figure 7.
The spatial distribution of rootzone soil moisture changes induced by solar radiation from 1982 to 2020. The panels show the results for (a) winter, (b) spring, (c) summer, and (d) autumn. Black dots indicate pixels that passed the significance test (p < 0.05).
Figure 8.
The spatial distribution of rootzone soil moisture changes induced by temperature differences from 1982 to 2020. The panels show the results for (a) winter, (b) spring, (c) summer, and (d) autumn. Black dots indicate pixels that passed the significance test (p < 0.05).
Figure 9.
The spatial distribution of rootzone soil moisture changes induced by wind speed from 1982 to 2020. The panels show the results for (a) winter, (b) spring, (c) summer, and (d) autumn. Black dots indicate pixels that passed the significance test (p < 0.05).
The comparative analysis of two periods (1982–1999 vs. 2000–2020) found that in southeastern China during winter, the increasing trend in LAI-induced rootzone soil moisture was more pronounced during 2000–2020 than in the 1982–1999 period (Figures S15 and S20). For the Northern Hemisphere winter, precipitation-driven soil moisture increases exhibited a notable northward shift in spatial distribution during 2000–2020 compared to the earlier period (Figures S16 and S21). In spring across Eurasia, regions showing precipitation-induced moistening during 1982–1999 transitioned to drying trends by 2000–2020, with particularly severe rootzone moisture declines in some areas. Similarly, summer solar radiation-induced moistening areas in Eurasia during 1982–1999 were replaced by widespread drying trends in the 2000–2020 period (Figures S17 and S22). Summer temperature difference-induced moistening trends observed across most mid-to-high latitude Northern Hemisphere regions during 1982–1999 reversed to drying trends by 2000–2020 (Figures S18 and S23), with analogous transitions occurring in autumn across central-southern Europe. Wind speed-induced rootzone moisture patterns displayed fragmented distributions of both high-moisture and high-dryness areas across both periods, with relatively few extensive regions showing coherent moistening or drying trends (Figures S19 and S24).
Based on a comparative analysis of 1982–1999 and 2000–2020, LAI-driven surface moisture variations showed relatively minor differences between these two periods, with only limited areas exhibiting either strong moistening or drying trends (Figures S25 and S30). In contrast, precipitation-induced surface moisture changes were more pronounced, displaying distinct clustered spatial patterns (Figures S26 and S31). During spring in mid-to-high latitude regions of the Northern Hemisphere, solar radiation shifted from inducing moistening trends during 1982–1999 to causing drying trends in 2000–2020 (Figures S27 and S32). Temperature differences generated more dramatic surface moisture variations in summer and autumn than in winter and spring during 1982–1999, while their impacts weakened during 2000–2020 (Figures S28 and S33). Furthermore, autumn wind speed effects during 1982–1999 produced extreme localized moistening or drying trends in certain regions, but these influences diminished in the 2000–2020 period (Figures S29 and S34).
Across all climate zones, LAI consistently enhanced rootzone soil moisture in all seasons, with the strongest moistening trend (0.13 × 10⁻³ m3m−3/m2m−2) occurring in temperate winters and the weakest (0.02 × 10⁻³ m3m−3/m2m−2) in cold climate winters (Figure S35). Precipitation showed seasonal and zonal variability—it increased rootzone soil moisture only during summer in arid and temperate zones but exerted year-round positive effects in cold climates. Solar radiation universally reduced rootzone soil moisture across all climate zones and seasons. Temperature differences caused maximum drying in temperate springs (−0.06 × 10⁻³ m3m−3/°C) but strongest moistening in cold climate winters (0.04 × 10⁻³ m3m−3/°C). Wind speed induced more pronounced drying in tropical regions than elsewhere (Figure S36). For surface soil moisture, LAI consistently promoted moistening globally. Precipitation generated peak moistening in temperate summers (0.013 × 10⁻³ m3m−3/mm), while solar radiation caused maximum drying in tropical summers (−0.04 × 10⁻³ m3m−3/Wm−2). Temperature differences led to the strongest surface moistening in arid zone springs (0.024 × 10⁻³ m3m−3/°C), with wind speed showing the greatest impacts in tropical regions compared to other climate zones.
3.3. Spatiotemporal Variations in POS and LAIMAX in the Northern Hemisphere
Figure 10 shows the spatial distribution of POS in the Northern Hemisphere from 1982 to 2020. Areas with an earlier POS are mainly concentrated in arid regions and along the Mediterranean coast, while in cold climate zones, the POS is concentrated between 175 and 210 days. In the Northern Hemisphere, areas with LAIMAX in the range of 0–2 m2/m2 account for 45.55% and are mainly distributed in arid regions and near the Arctic Circle (Figure S37). During the period 1982–2020, the POS for major vegetation types in the Northern Hemisphere exhibited an advancing trend. Among forest types, the average POS for evergreen, deciduous, and mixed forests was 201.32 d, 202.46 d, and 201.78 d, with advancement rates of 0.037 d yr−1, 0.13 d yr−1, and 0.025 d yr−1, respectively. For savannas and grasslands, the average POS for woody savannas, savannas, and grasslands was 204.93 d, 207.45 d, and 201.34 d, advancing at rates of 0.011 d yr−1, 0.022 d yr−1, and 0.036 d yr−1, respectively. Furthermore, the average POS for shrublands and croplands was 206.48 d and 201.62 d, with corresponding advancement rates of 0.05 d yr−1 and 0.03 d yr−1 (Figure S38).
Figure 10.
The spatial distribution of the average POS in the Northern Hemisphere from 1982 to 2020. The histogram in the bottom-left corner represents the frequency distribution of the corresponding dates.
Among all climate zones and time periods, the tropical region showed the largest POS advancement trend from 1982 to 1999, advancing at an average of 0.33 d yr−1 (Figure S39). In contrast, arid regions during the same period (1982–1999) had the largest POS delay trend, with an annual extension of 0.11 d. For LAIMAX, the increasing trend from 2000 to 2020 in all climate zones was more than twice that of the 1982–1999 period (Arid: 2.30 times, Cold: 2.89 times, Temperate: 2.56 times, Tropical: 4.50 times). The growth trend of LAIMAX was strongest in the temperate climate zone, with an annual growth rate of 0.14 × 10⁻¹m2/m2 from 2000 to 2020. In the Northern Hemisphere, from 1982 to 2020, 56.7% of the area exhibited an advancing trend in the POS at an average rate of 0.27 days yr−1, while 46.3% showed a delaying trend at a rate of 0.29 days yr−1. Concurrently, for the LAIMAX, 72.3% of the area demonstrated an increasing trend with a mean rate of 0.012 m2m−2 yr−1, whereas the remaining 27.7% experienced a decreasing trend at a rate of 0.010 m2m−2 yr−1 (Figures S40 and S41).
Figure 11 shows the spatial distribution of the Hurst exponent for POS for different time spans. In both the 1982–1999 and 2000–2020 periods, more than 50% of the area in the Northern Hemisphere had a future POS trend opposite to the trend observed during the study period. For the entire period from 1982 to 2020, this proportion of areas with a reversing trend reached 82.57%, while only 1.31% of the area showed a trend consistent with the past. For LAIMAX, the area with a reversing future trend was 57.96% for the 1982–2020 period (Figure S42). Additionally, across all climate zones and time periods, the Hurst exponent for LAIMAX was closer to 0.5 compared to that of POS (Figure S43).
Figure 11.
The spatial patterns of the Hurst exponent for POS in the Northern Hemisphere for the periods (a) 1982–1999, (b) 2000–2020, and (c) 1982–2020. The color of the squares indicates the nature of the trend: strong anti-persistent (dark red, A; 0–0.3), weak anti-persistent (light red, B; 0.3–0.45), random fluctuations (white, C; 0.45–0.55), or strong persistent (light blue, D; 0.55–1.0).
3.4. Correlation of POS and LAIMAX with Climate Factors
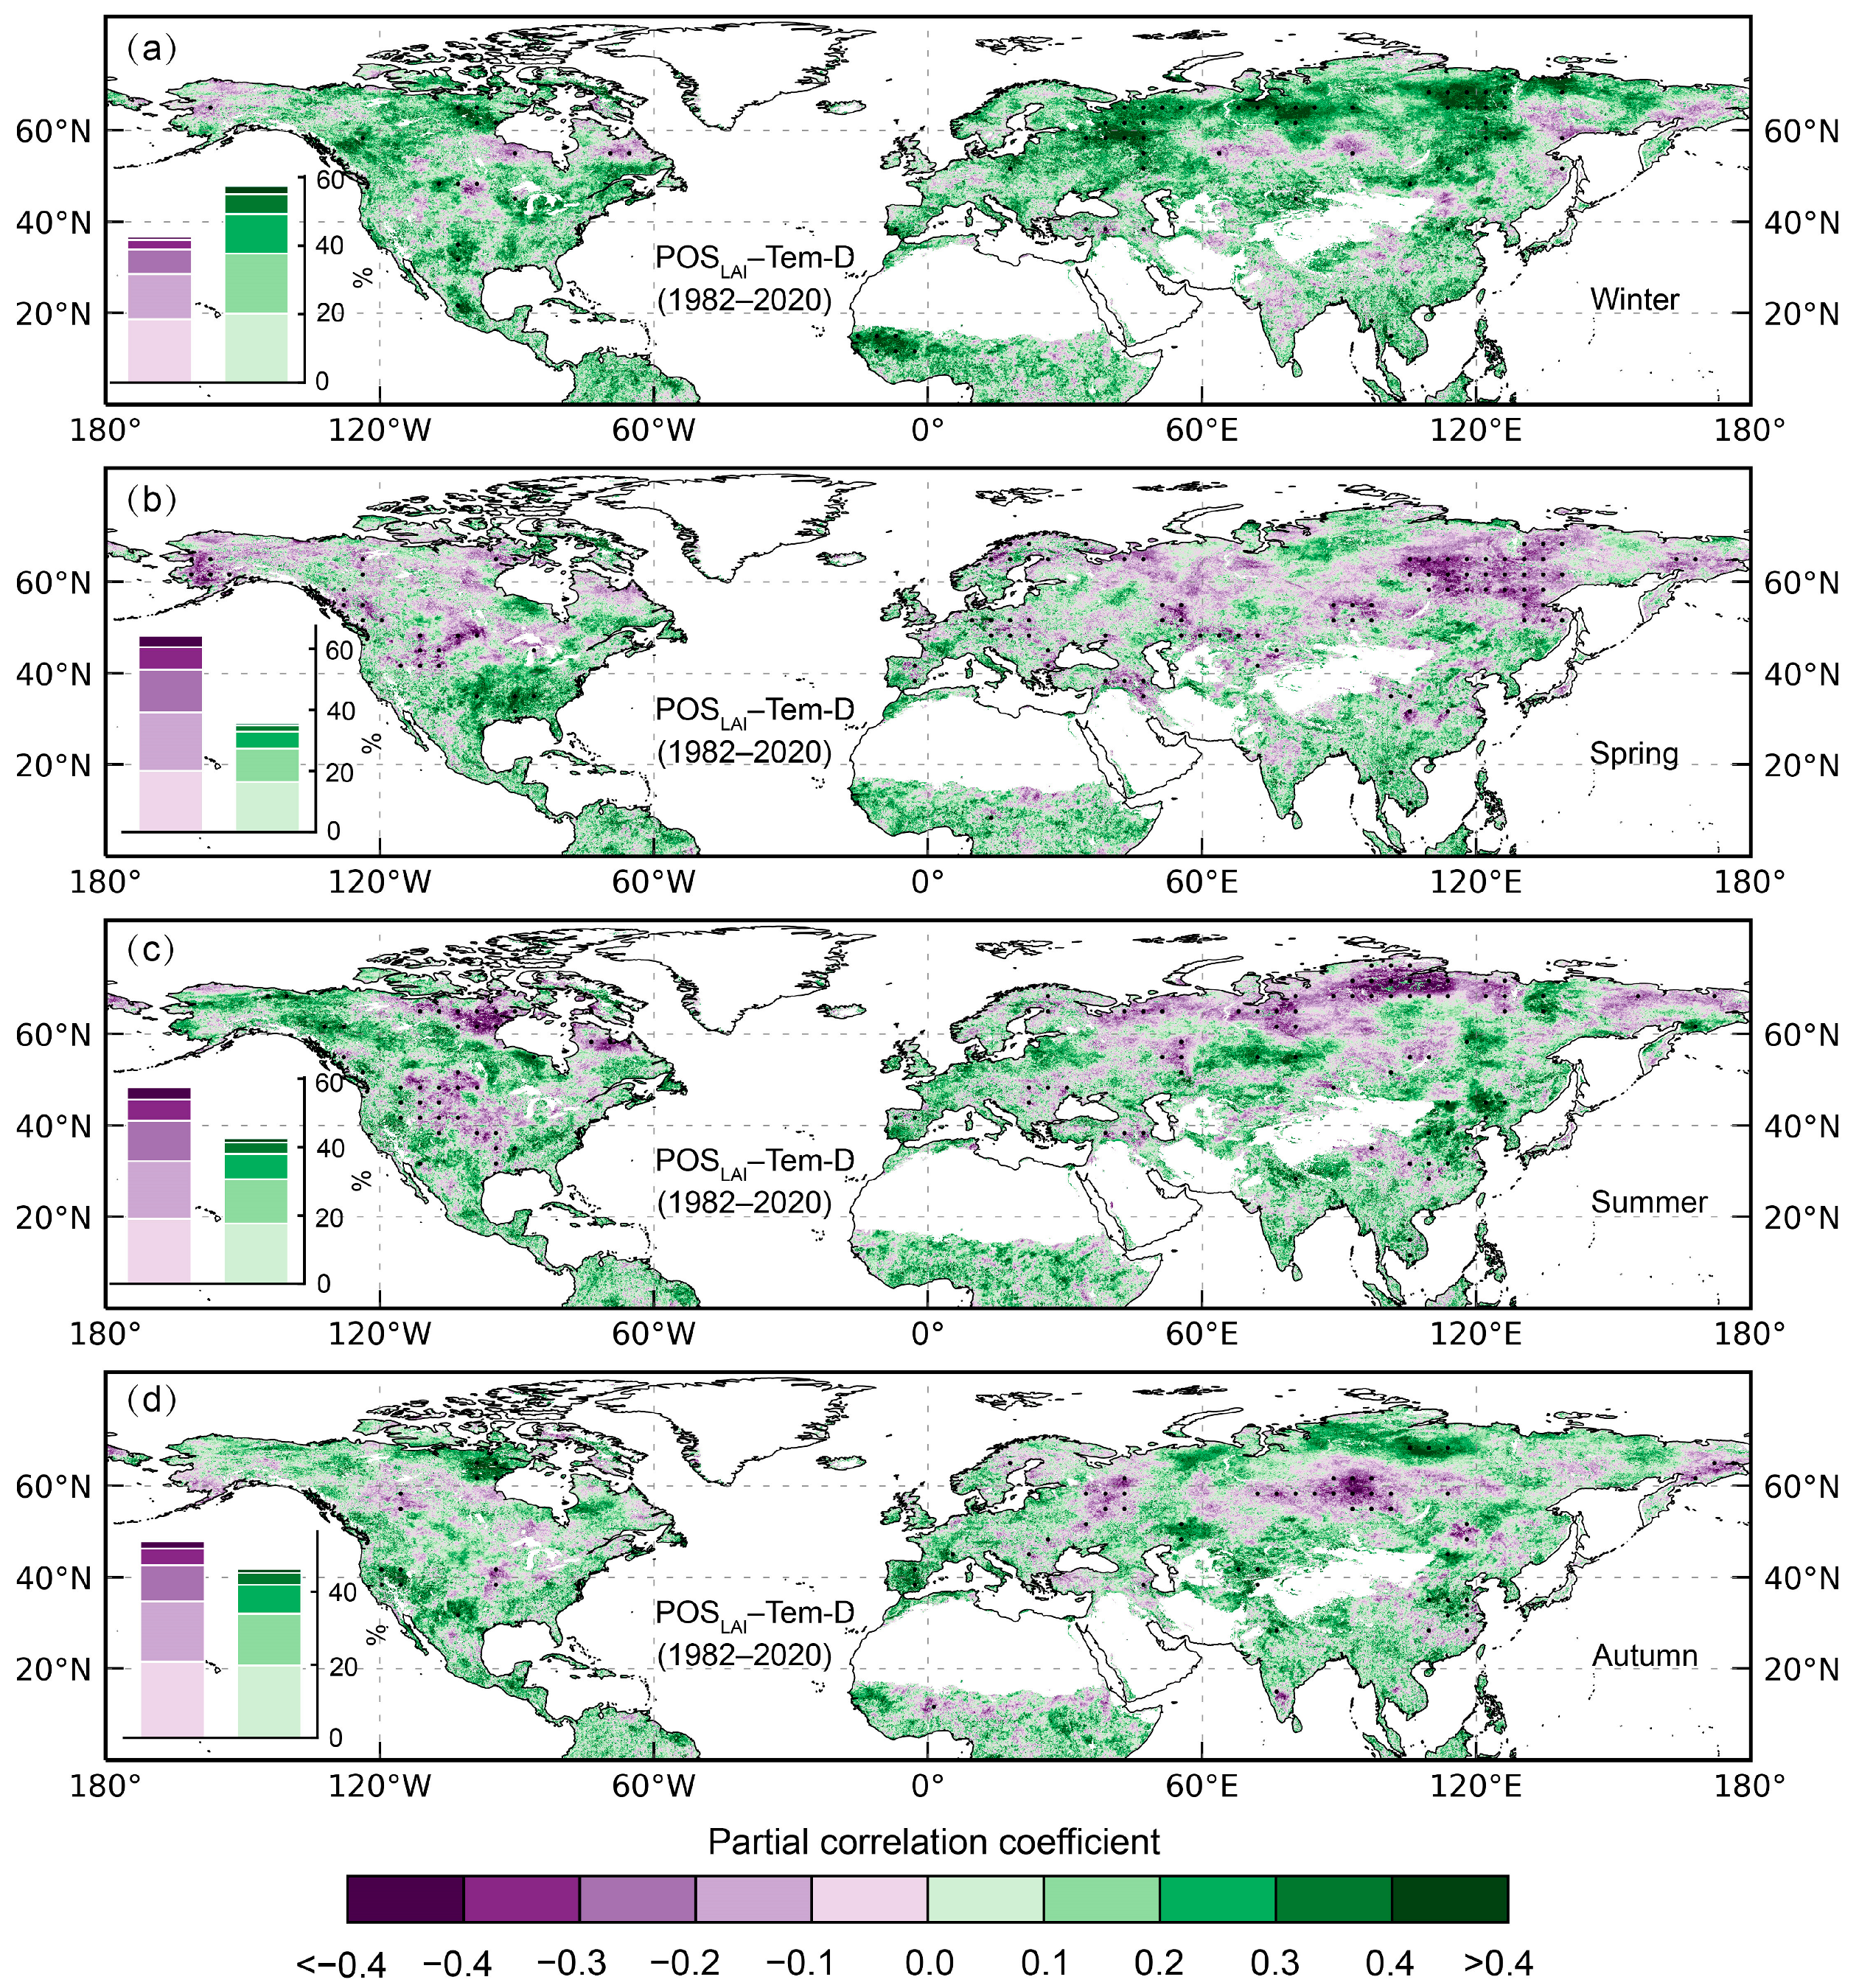
In the spatial distribution of partial correlation coefficients between climatic factors and POS across seasons in the Northern Hemisphere from 1982 to 2020 (Figures S44–S46 and Figure 12), the differences in the proportions of positive and negative correlation regions between POS and precipitation, solar radiation, and wind speed were generally within 10%, exhibiting relatively homogeneous spatial heterogeneity. Notably, an asymmetric mechanism was observed between POS and seasonal temperature differences: the disparity in the proportions of positive and negative correlation regions reached as high as 28.56% in spring, and 14.80% and 14.86% in winter and summer, respectively. In the spatial distribution of partial correlation coefficients between climatic factors and LAIMAX in the Northern Hemisphere from 1982 to 2020 (Figures S55–S58), LAIMAX showed a higher proportion of positive correlations with precipitation than negative correlations across all seasons—winter (59.57% vs. 40.43%), spring (62.48% vs. 37.52%), summer (61.77% vs. 38.23%), and autumn (58.62% vs. 41.38%). The proportion of positive correlation regions between summer solar radiation and LAIMAX reached 63.24%, higher than in other seasons, possibly due to seasonal variations in light-use efficiency. At the regional scale, seasonal solar radiation and LAIMAX in South Asia exhibited negative correlations of varying magnitudes. In the Northern Hemisphere, except for spring, where the difference in the proportions of positive (58.62%) and negative (41.38%) correlations between temperature differences and LAIMAX was relatively large, the proportions of positive and negative correlation regions in other seasons were nearly balanced. LAIMAX displayed a predominantly negative correlation with wind speed in winter (54.20% vs. 45.80%), spring (52.82% vs. 47.18%), summer (60.22% vs. 39.78%), and autumn (57.35% vs. 42.65%), which may reflect the inhibitory effect of wind-induced mechanical abrasion on LAIMAX.
Figure 12.
The spatial distribution of the partial correlation coefficients between POS and seasonal temperature difference in the Northern Hemisphere from 1982 to 2020. Panels (a), (b), (c), and (d) show the results for winter, spring, summer, and autumn, respectively. The histogram in the bottom-left corner of each panel shows the frequency distribution of the corresponding partial correlation coefficients. Black dots indicate pixels where the correlation is statistically significant (p < 0.05).
A comparative analysis of climatic factors in relation to POS and LAIMAX across seasons in the Northern Hemisphere was conducted, comparing the periods 1982–1999 and 2000–2020 (Figures S47–S54 and S59–S66). Compared to 1982–1999, the spatial extent of the negative correlation between POS and the temperature difference in spring, summer, and autumn expanded significantly across the high latitudes of the Northern Hemisphere during 2000–2020. Over Eurasia, the negative correlation between summer wind speed and LAIMAX displayed a more fragmented spatial distribution in the 2000–2020 period than in 1982–1999. Furthermore, during 2000–2020, LAIMAX showed a significantly stronger positive correlation with summer solar radiation in mid-to-high latitude regions of Eurasia, with the correlation strength being more pronounced than in the earlier period (1982–1999).
4. Discussion
4.1. Assessing Soil Moisture Changes and Dominant Contributing Factors
Surface and rootzone soil moisture display distinct seasonal dynamics, a result of their fundamentally different hydro-regulatory mechanisms in the soil profile. The surface soil layer is tightly coupled with the atmosphere []. Its shallow nature facilitates rapid water and energy exchanges, making its moisture content primarily controlled by precipitation and evaporation []. Consequently, surface moisture responds swiftly to rainfall but is also susceptible to rapid depletion from intense evaporation. In contrast, the rootzone soil moisture dynamics are more complex and buffered. As the main region of root activity, its water balance is governed by two dominant processes: root water uptake to support plant growth and transpiration [], and water fluxes involving infiltration from the surface or percolation to deeper layers. This mechanistic disparity leads to a dynamic relationship characterized by alternating periods of coupling and decoupling. While the layers are strongly coupled during prolonged wet periods [], they often decouple during droughts [] or after light precipitation events, leading to divergent moisture responses. For instance, this decoupling is observed in northeastern South America during its summer. In this region, high temperatures, low relative humidity, and dense vegetation drive strong transpiration, as wind disrupts the leaf boundary layer and increases the vapor pressure deficit. This process causes continuous water extraction from the root zone, resulting in a decreasing moisture trend. Concurrently, prevailing summer winds transport Atlantic moisture inland, which can increase near-surface humidity and the probability of light precipitation events []. However, this precipitation is often insufficient in magnitude to effectively infiltrate and recharge the root zone.
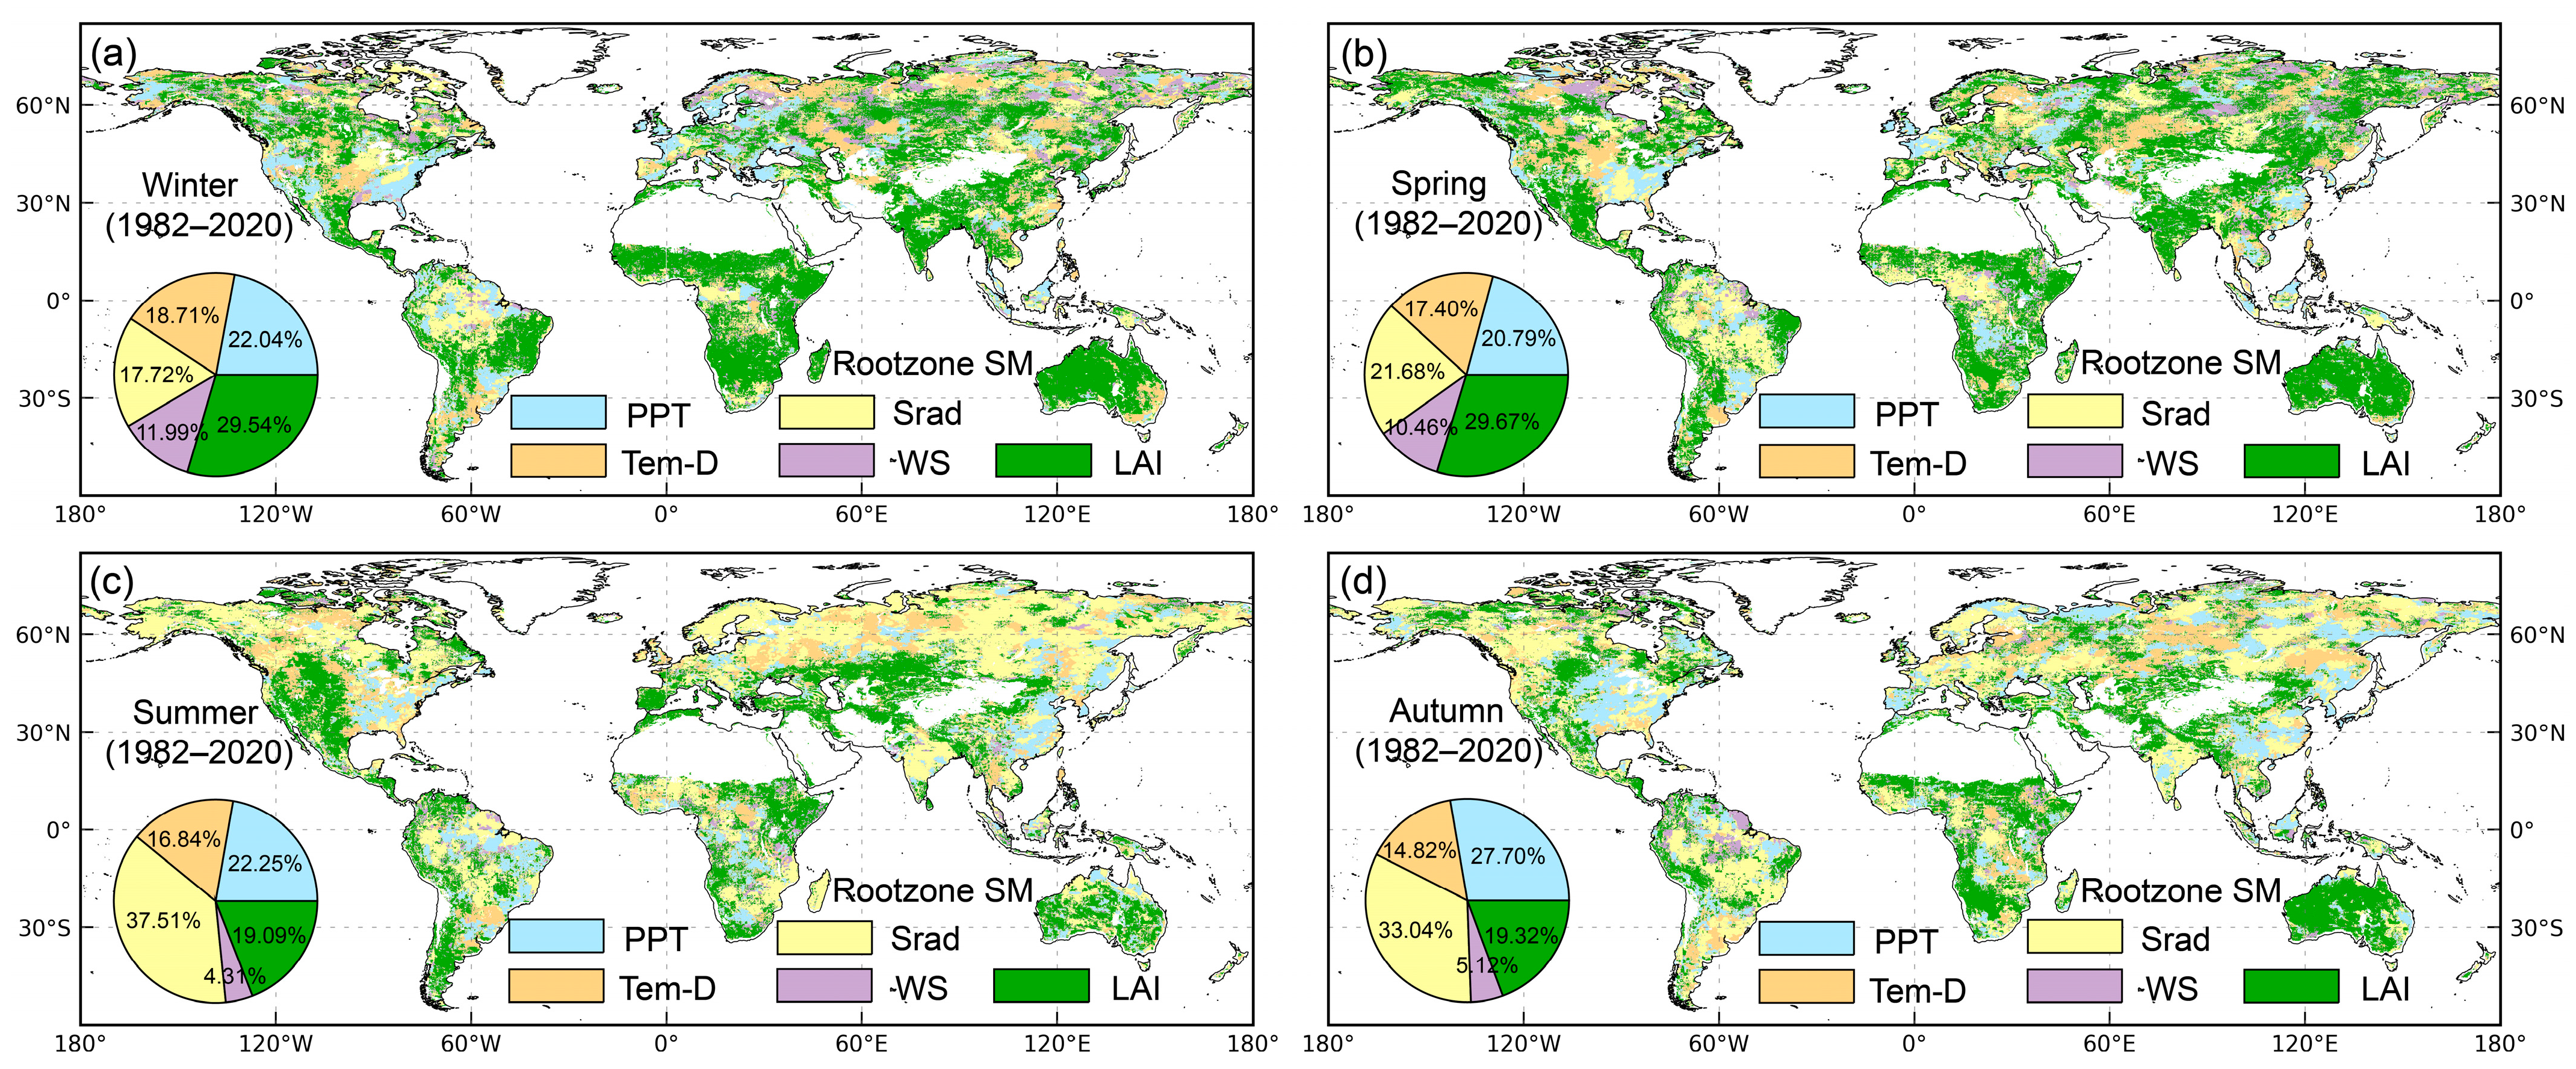
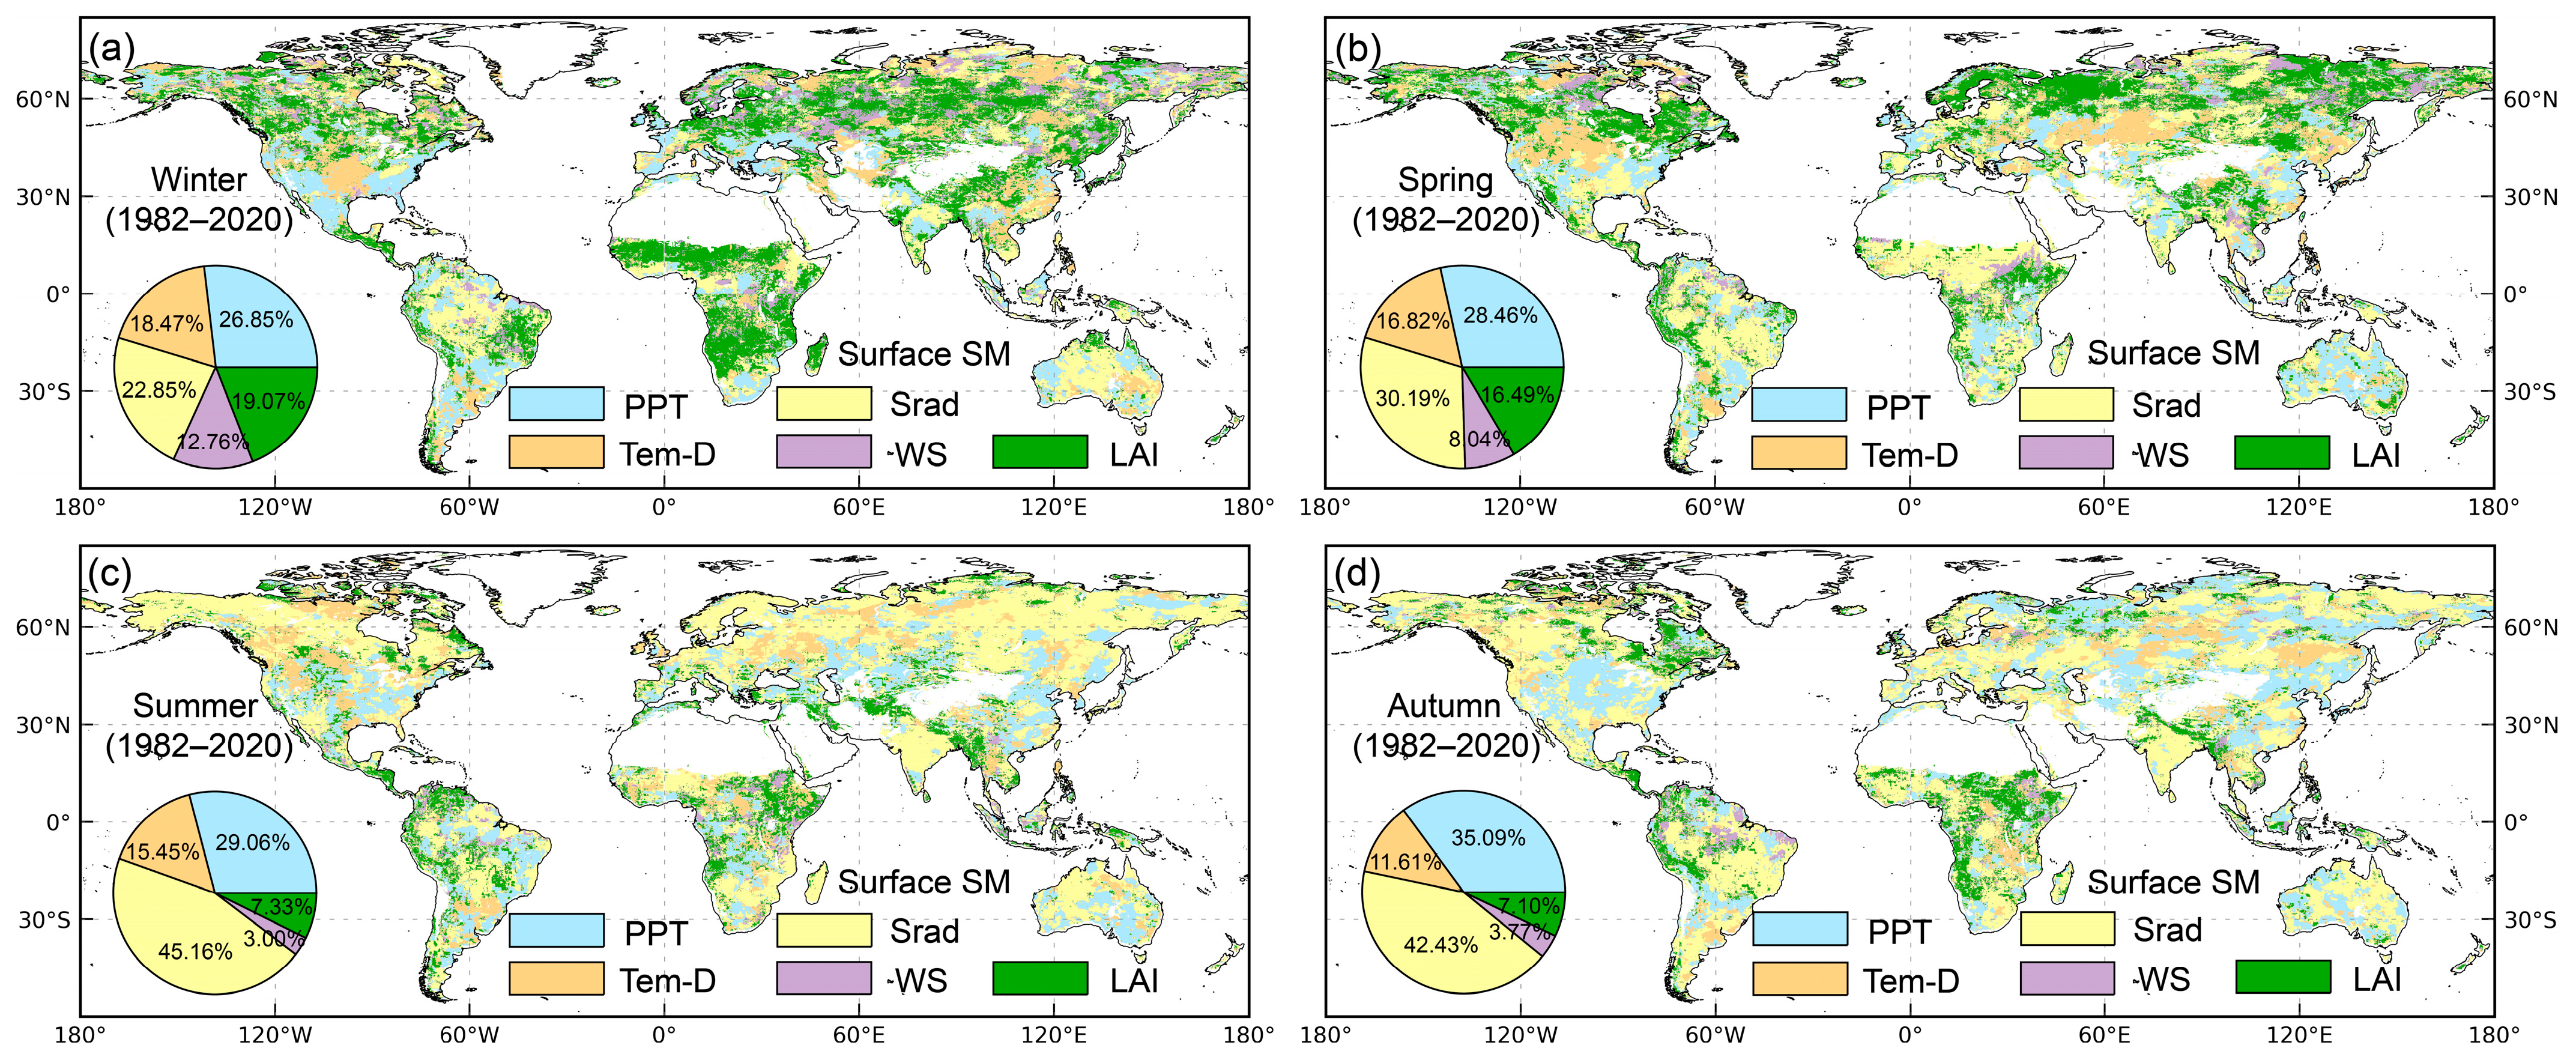
The dominant drivers regulating rootzone and surface soil moisture across seasonal scales from 1982 to 2020 were systematically assessed (Figure 13 and Figure 14), with a comparative analysis conducted for two distinct periods: 1982–1999 and 2000–2020 (Figures S67–S70). To ensure the validity of these findings, we assessed the stability of the factor rankings. Through 20 repeated validation runs (with optimal parameters fixed and only the random seed varied), the top-ranked contributing factor to soil moisture, as identified by the Random Forest-SHAP method, consistently demonstrated high stability in its ranking. Specifically, for each season, the most critical factor appeared in the first position in over 85% of the runs (Table S5). This result indicates that despite the stochasticity arising from different random initializations, the dominant role of the core influencing factors is not disturbed by chance, thereby confirming the reliability and robustness of our contribution analysis conclusions. Following this validation, vegetation control, quantified by LAI, supersedes climatic factors (precipitation, solar radiation, temperature difference, and wind speed) in dominating rootzone soil moisture variations during winter and spring. This pattern is particularly pronounced in tropical savannas during winter dry seasons, where LAI-mediated moisture regulation becomes predominant as precipitation-driven water recharge (via rainfall and surface runoff) approaches negligible levels. The rootzone’s enhanced water retention capacity–attributable to greater depth and structural stability–renders it less vulnerable to short-term climatic variability compared to surface soil []. These properties establish rootzone soil moisture as the pivotal hydrological reservoir for vegetation, serving essential functions in drought resilience and physiological maintenance during water-limited periods [,,]. Notably, vegetation exerts stronger nonlinear regulation on rootzone soil moisture than solar radiation’s indirect effects through surface heating []. During spring, as temperatures rise, vegetation greening occurs across most global regions, with rapid plant growth remaining the primary factor controlling rootzone soil moisture in deeper soil layers. In summer, solar radiation dominates rootzone soil moisture variation due to maximum radiation intensity and prolonged sunshine duration, followed by precipitation as the secondary factor. Although solar radiation weakens in autumn, residual heat accumulated in soils during summer maintains relatively high temperatures [], making solar radiation still the predominant influence on rootzone soil moisture. Wind speed plays a more dominant role in winter and spring than in summer and autumn, particularly across high-latitude Northern Hemisphere regions where Arctic cold air brings both snowfall and subfreezing temperatures that immobilize soil moisture through ground freezing.
Figure 13.
The spatial distribution of the dominant contributors to seasonal variations in rootzone soil moisture across the globe. Panels (a), (b), (c), and (d) show the results for winter, spring, summer, and autumn, respectively. PPT, Srad, Tem-D, and WS denote precipitation, solar radiation, temperature difference, and wind speed, respectively. The pie charts illustrate the percentage of the total area dominated by each driving factor.
Figure 14.
The spatial distribution of the dominant contributors to seasonal variations in surface soil moisture across the globe. Panels (a), (b), (c), and (d) show the results for winter, spring, summer, and autumn, respectively. PPT, Srad, Tem-D, and WS denote precipitation, solar radiation, temperature difference, and wind speed, respectively. The pie charts illustrate the percentage of the total area dominated by each driving factor.
The dominant control of seasonal temperature differences on rootzone soil moisture dynamics remained remarkably stable, consistently accounting for 14–19% of the total contribution. A further comparison between the two periods (1982–1999 vs. 2000–2020) reveals a widespread increasing trend in the dominant contribution of LAI to rootzone soil moisture. Specifically, compared to the 1982–1999 period, the dominance of LAI in 2000–2020 increased by 10.47%, 6.65%, 10.37%, and 6.77% during winter, spring, summer, and autumn, respectively. This change can likely be attributed to the accelerated rate of vegetation greening since the 21st century [,], which has in turn enhanced the regulatory role of LAI on rootzone soil moisture.
Globally, precipitation is the most dominant seasonal driver of surface soil moisture in winter, followed by solar radiation, as the season’s weaker solar radiation, lower temperatures, and reduced evaporation allow most of it to infiltrate the surface layer and become the key regulator. From spring to autumn (particularly in summer and autumn), solar radiation surpasses precipitation as the dominant influence by more directly heating the topsoil and enhancing evaporation []. LAI maintains a consistent 16–20% dominance in controlling surface soil moisture during winter and spring, but declines to less than half this level in summer and autumn. Wind speed reaches its peak influence in winter, accounting for 12.76% of soil moisture regulation. Between 1982 and 1999 and 2000–2020, LAI’s dominant control over surface soil moisture increased across all seasons, with winter exhibiting the most significant gain—an 9.10 percentage point increase relative to the 1982–1999 baseline.
4.2. The Relationships of POS and LAIMAX with Soil Moisture and Climatic Factors
In the Northern Hemisphere, the spring diurnal temperature range exhibits a high proportion of negative correlation with the POS for vegetation growth (Figure 12). On the one hand, a larger temperature range, accompanied by high daytime temperatures and strong radiation, significantly promotes the accumulation of effective accumulated temperature, enabling vegetation to reach the required thermal threshold for growth more quickly []. On the other hand, against the backdrop of global warming, cool nighttime temperatures effectively suppress plant respiratory consumption, thereby optimizing the carbon balance. This “warm day, cool night” climate pattern allocates more photosynthetic products to the rapid accumulation of biomass, thus powerfully advancing the POS []. Furthermore, high spring temperatures not only accelerate snowmelt but also promote the thawing of the permafrost active layer in high-latitude regions []. This process simultaneously releases valuable early-season water and nutrients for vegetation green-up, collectively contributing to the significant advancement of the growth peak.
The sensitivity and correlation of seasonal soil moisture to POS and LAIMAX from 1982 to 2020 were investigated. From 1982 to 2020, the sensitivity of rootzone and surface soil moisture to POS was mainly concentrated in the range of −0.1 to 0.1 m3/m3·d−1 (Figure 15 and Figure S72). Northern Central Siberia showed consistently negative rootzone soil moisture sensitivity to POS throughout all seasons, with peak negative sensitivity coverage in summer. The high-latitude environment, characterized by light/temperature limitations and consequent condensed growing seasons, drives vegetation to intensively deplete soil moisture during brief summer growth periods [,,]. The sensitivity of rootzone and surface soil moisture to LAIMAX was mainly concentrated in the range of −0.3 to 0.3 m3m−3/m2m−2 (Figures S71 and S73). A further comparison between two periods (1982–1999 vs. 2000–2020) reveals distinct patterns in soil moisture sensitivity. Across all seasons in the Northern Hemisphere, the spatial extent of positive sensitivity to POS in both rootzone and surface soil moisture significantly exceeded negative sensitivity during 2000–2020 (Figures S74, S76, S78 and S80). In contrast to the sensitivity to POS, the sensitivity to LAIMAX showed a dominance of positive over negative responses in both periods, and this dominance was more pronounced after 2000 (Figures S75, S77, S79 and S81).
Figure 15.
The spatial distribution of the sensitivity of rootzone soil moisture to POS in the Northern Hemisphere from 1982 to 2020. Panels (a), (b), (c), and (d) show the results for winter, spring, summer, and autumn, respectively. The histogram in the lower-left corner of each panel represents the frequency distribution of the corresponding sensitivity coefficient. Black dots indicate pixels that passed the significance test (p < 0.05).
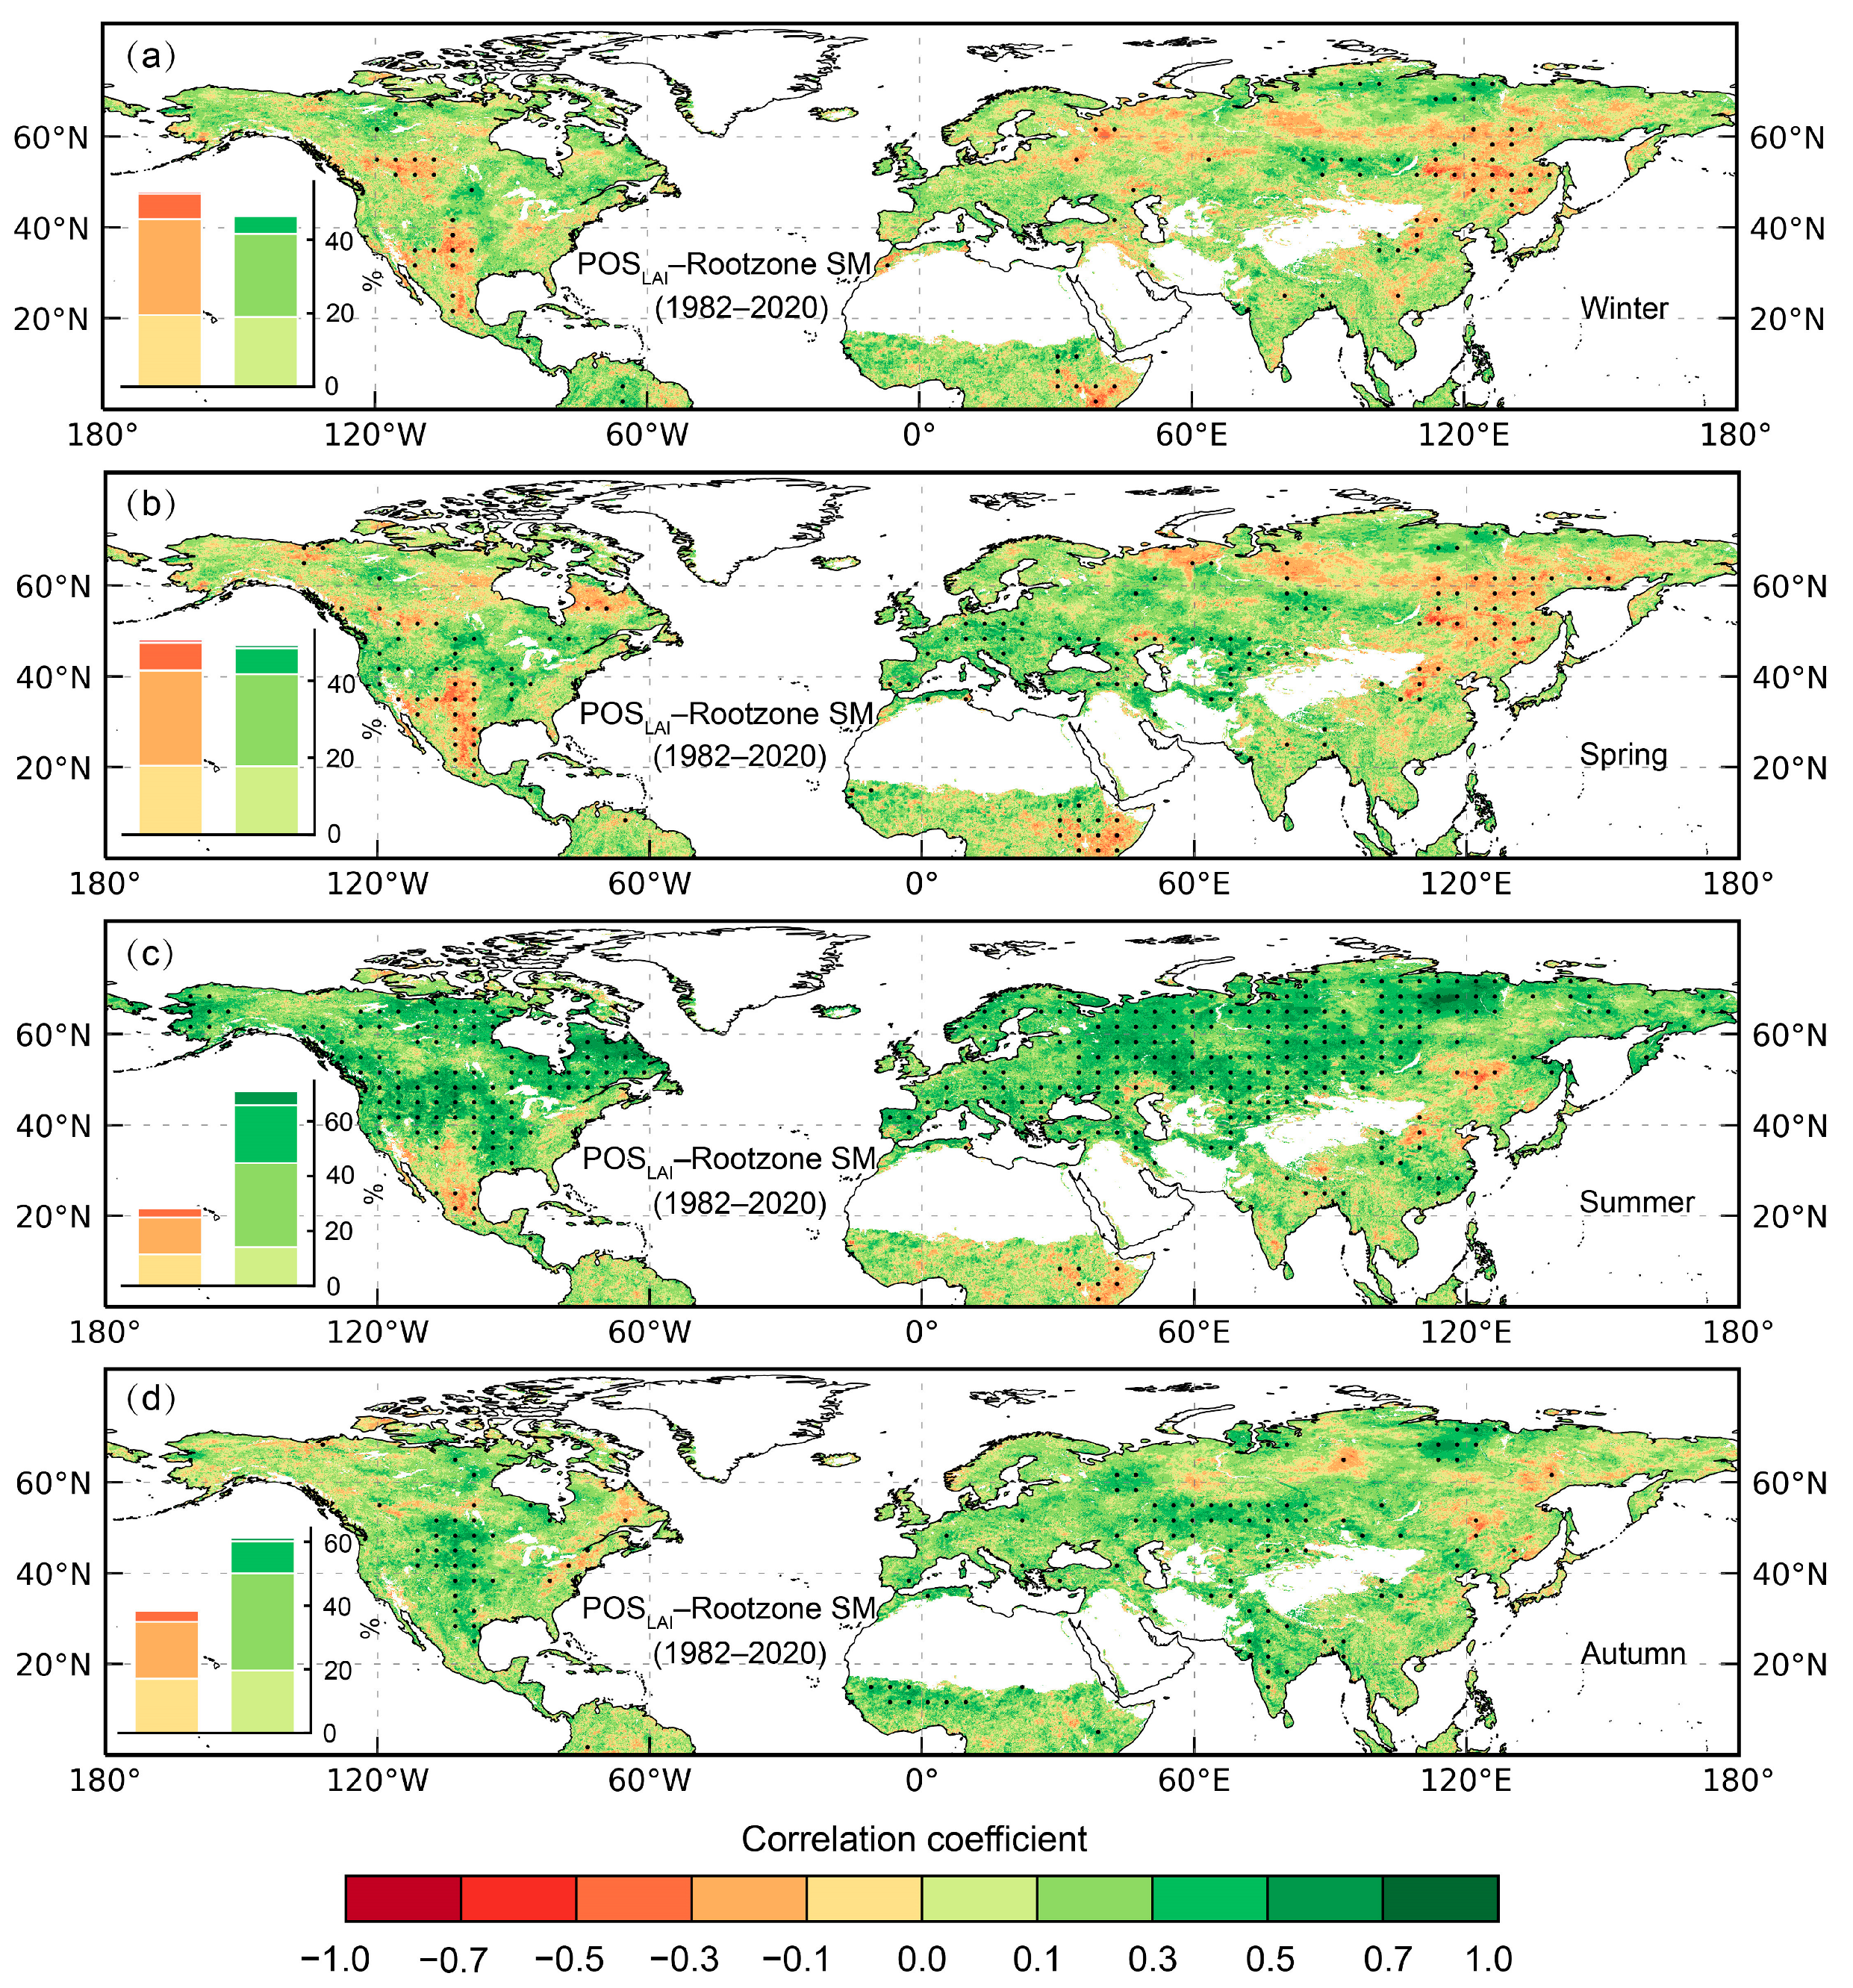
In the Northern Hemisphere, the analysis of correlations between POS and soil moisture (1982–2020) reveals spatially consistent patterns for both rootzone and surface layers (Figure 16 and Figure S91). Seasonal variations indicate that rootzone soil moisture displayed slightly higher proportions of negative than positive correlations with POS in winter and spring, while summer and autumn showed substantially dominant positive correlations. For surface soil moisture, winter exhibited nearly balanced positive/negative correlation proportions, whereas spring through autumn demonstrated markedly higher prevalence of positive correlations. During 1982–2020, LAIMAX exhibited extensive significant negative correlations with summer and autumn rootzone and surface soil moisture across high-latitude regions, particularly in Eurasia, while mid-latitude areas showed predominantly positive correlations (Figures S90 and S92). This spatial pattern confirms that in high latitudes, vegetation’s peak growth period coincides with substantial water demand and strong transpiration, where summer/autumn precipitation proves insufficient to compensate for combined vegetation and soil moisture losses. In contrast, mid-latitude regions demonstrate synchronized vegetation growth and soil moisture dynamics due to abundant warm-season precipitation. For winter and spring conditions, positive correlations between rootzone soil moisture and LAIMAX dominated across most Northern Hemisphere regions, whereas summer and autumn displayed approximately balanced proportions of positive and negative correlation areas.
Figure 16.
The spatial distribution of the correlation between rootzone soil moisture and POS in the Northern Hemisphere from 1982 to 2020. Panels (a), (b), (c), and (d) show the results for winter, spring, summer, and autumn, respectively. The histogram in the lower-left corner of each panel represents the frequency distribution of the corresponding correlation coefficient. Black dots indicate pixels that passed the significance test (p < 0.05).
The spatiotemporal dynamics of soil moisture are profoundly reshaped by phenological shifts, which regulate vegetation transpiration and canopy interception of precipitation. Studies indicate that from 1982 to 2020, an earlier POS accelerated soil moisture depletion in tropical and temperate regions, exhibiting positive sensitivity coefficients that peaked during the tropical autumn (0.059 m3m−3 d−1 and 0.052 m3m−3 d−1 for rootzone and surface soil moisture, respectively) (Figures S82–S85). In contrast, during certain seasons in arid and cold climate regions, an earlier POS contributed to increased soil moisture, manifesting as negative sensitivity, with the minimum value occurring in the cold climate summer (−0.0297 m3m−3 d−1 and −0.0293 m3m−3 d−1 for rootzone and surface, respectively). Concurrently, an increase in the LAIMAX demonstrated a more ubiquitous positive effect. Except for summer in cold climate zones, LAIMAX was significantly and positively correlated with soil moisture across all climatic zones, with the sensitivity reaching its maximum in the tropical autumn (0.256 (m3/m3)/(m2/m2) and 0.232 (m3/m3)/(m2/m2) for rootzone and surface, respectively). Coupled with the global trend of vegetation greening (i.e., increasing LAIMAX), this reveals a critical mechanism: although a denser canopy enhances transpirational water loss, its “water conservation effect”—achieved by suppressing surface evaporation and improving soil infiltration—often dominates, thereby facilitating a large-scale increase in soil moisture across most regions globally.
Amidst the ongoing trend of global greening, elevated atmospheric CO2 concentration is the dominant driver at a global scale []. The CO2 fertilization effect stimulates vegetation growth through two core mechanisms: first, by directly enhancing photosynthetic efficiency, as CO2 is a key raw material for photosynthesis []; and second, by improving vegetation water-use efficiency (WUE) through the regulation of stomatal conductance, which allows for less water consumption per unit of carbon fixed []. In addition, other anthropogenic activities play a vital role. For instance, increased nitrogen deposition provides additional nutrients to many nitrogen-limited ecosystems, thereby promoting vegetation growth []. More direct are the impacts of changes in land use and management practices. Studies have shown that the greening trends in China and India are especially prominent globally, largely attributable to China’s large-scale afforestation programs and the intensive agricultural practices in both countries (e.g., multi-cropping, irrigation, and fertilization) [], which directly increase vegetation cover and productivity. The dominant limiting factors for vegetation growth vary by region. In the high-latitude regions of the Northern Hemisphere, temperature is the primary limiting factor [,]. Consequently, climate warming, which leads to an extended growing season and increased thermal resources, is the principal driver of greening in this area. In global arid and semi-arid regions, water is the absolute limiting factor []. Here, the extent of greening is co-determined by the enhanced WUE from the CO2 fertilization effect and shifts in precipitation patterns []. In contrast, within intensively managed agricultural ecosystems, the influence of direct human interventions (such as irrigation and fertilization) often surpasses the background effects of climate change and elevated CO2 []. Crucially, the same factors responsible for vegetation greening can also explain the variations in its resource use efficiency. It is probable that the combined influence of the CO2 fertilization effect, climate warming, and nitrogen deposition has boosted the capacity of vegetation across mid-to-high Eurasian latitudes to utilize solar radiation, achieved through an increased light saturation point and the alleviation of environmental stress [,]. On a macroscopic scale, this improvement in physiological efficiency transcends the limitation of light saturation, which has led to the pronounced strengthening of the positive correlation between LAIMAX and solar radiation observed since the year 2000.
However, the anti-persistence revealed by the Hurst exponent (H < 0.5) indicates a potential for future trend reversals, posing a formidable challenge to our previous findings and potentially triggering a “double blow” to soil moisture regulation. On one hand, should the LAIMAX-driven “global greening” stagnate or reverse, the ubiquitous soil “water conservation effect” observed across most regions would be severely weakened, likely exacerbating the risk of large-scale soil drought. On the other hand, future fluctuations in the POS would disrupt current regional hydrological patterns, introducing new and more unpredictable water stress, irrespective of whether regions currently benefit or suffer from an earlier POS.
This serves as a critical warning that a simple linear extrapolation of vegetation trends observed over the past few decades is highly unreliable, posing a fundamental challenge to both hydrological forecasting and ecosystem management. In the field of hydrological forecasting, long-term models that rely on historical greening trends for parameterization are prone to significant biases. Such models will systematically overestimate future evapotranspiration and underestimate available water resources by overestimating LAI, thereby misleading regional water resource planning. Notably, some studies have already recognized this, suggesting that the impact of future vegetation greening on evapotranspiration may diminish []. Furthermore, a potential reversal in the POS trend would alter the seasonal rhythm of peak vegetation water demand, further reducing the accuracy of seasonal drought predictions. From an ecosystem management perspective, this uncertainty is equally critical. First, it challenges climate change mitigation strategies by questioning the stability of the terrestrial carbon sink. A potential reversal in the LAI trend implies that the carbon sink, currently enhanced by “global greening,” is not permanently stable, introducing new uncertainties for achieving carbon neutrality targets. Therefore, the findings of this study call for a departure from the static mindset of trend extrapolation and a move towards more resilient and adaptive management frameworks capable of addressing the high uncertainty inherent in vegetation dynamics.
4.3. Uncertainties and Limitations
The three reanalysis soil moisture datasets employed in this study—ERA5-Land, CFSR, and MERRA-2—exhibit good agreement with In Situ observations in many Regions [,,]. However, their reliability faces significant challenges in densely vegetated areas, such as tropical rainforests, a limitation common to various remote sensing technologies. Although optical remote sensing provides high-resolution surface information, its signals cannot penetrate the vegetation canopy and are susceptible to interference from clouds and rain, often resulting in data gaps []. In contrast, microwave remote sensing has become the mainstream approach for all-weather soil moisture monitoring, owing to its ability to penetrate clouds and, to some extent, vegetation. Nevertheless, even the more penetrative L-band signal experiences severe attenuation under dense vegetation cover. For instance, in regions like the Amazon rainforest, the scarcity of ground observations makes it challenging to accurately calibrate key parameters within radiative transfer models (e.g., vegetation water content and optical depth), thereby limiting the effectiveness of corrections for vegetation interference []. Furthermore, commonly used L-band and C-band microwaves can only sense the top ~5 cm of the soil, rendering them incapable of measuring deeper rootzone soil moisture [].
Estimating rootzone soil moisture, whether through indirect retrievals from surface information or direct simulations by land surface models, is subject to significant uncertainties. The land surface models within the reanalysis datasets used in this study are constrained by the accuracy of their parameterization schemes and meteorological forcing data. This can lead to common systematic biases across multiple products, particularly in structurally complex forest ecosystems. Moreover, the ensemble averaging method employed by the dataset, while intended to integrate multi-source information, may mask these inter-product systematic biases and is susceptible to the influence of individual outlier products []. Additionally, the process of downscaling coarse-resolution reanalysis data to a uniform high resolution can introduce further smoothing errors, failing to fully reproduce true local-scale spatial heterogeneity []. Despite these prevalent limitations, we contend that the multi-source fusion soil moisture product selected for this study—owing to its global coverage, long-term time series (1982–2020), spatial continuity, and inclusion of both surface and rootzone layers—remains one of the most reliable and comprehensive data sources currently available for investigating large-scale vegetation-hydrology interactions, providing invaluable support for such scientific inquiries. Looking forward, P-band microwave remote sensing, with its superior penetration capability (up to 40 cm or deeper), presents a promising new avenue for directly sensing rootzone soil moisture while effectively mitigating interference from the vegetation canopy []. Future research should focus on integrating such novel remote sensing data with advanced algorithms and models, alongside standardized global In Situ observation networks, to produce higher-quality global soil moisture datasets.
5. Conclusions
In this study, the LAI dataset, meteorological dataset, and surface and rootzone soil moisture datasets were utilized to investigate the regulatory effects of vegetation and meteorological factors on rootzone and surface soil moisture across different seasons and climate zones. Additionally, the POS and LAIMAX were employed as indirect metrics to explore the feedback effects of vegetation phenology on soil moisture. The study found that since the beginning of the 21st century, global LAI has exhibited a significant and accelerated greening trend across all seasons. From 1982 to 2020, the temperate climate zone showed the strongest spring LAI trend among all climate zones, with a rate of 0.05 × 10⁻¹ m2m−2·yr−1. During the period from 2000 to 2020, the rate of increase in rootzone soil moisture was faster than that observed from 1982 to 1999. For surface soil moisture, a general decreasing trend prevailed across most global regions from 1982 to 1999, while during 2000–2020, the decline became more concentrated in high-latitude regions of the Northern Hemisphere. From 2000 to 2020, the increasing trends in rootzone soil moisture and surface soil moisture were more pronounced in temperate and tropical climate zones compared to cold and arid zones. The change in soil moisture induced by LAI exhibited a wetting trend in the rootzone across all seasons from 1982 to 2020. The average wetting trend was highest in the temperate winter (0.13 × 10⁻³ m3m−3/m2m−2) and lowest in the cold climate winter (0.02 × 10⁻³ m3m−3/m2m−2). In cold climates, the precipitation-induced trend in rootzone soil moisture was positive throughout all seasons from 1982 to 2020. In contrast, solar radiation generally drove a drying trend across all climate zones and seasons. The temperature difference exerted its strongest drying effect in the temperate spring (−0.06 × 10⁻³ m3m−3/°C) and its strongest wetting effect in the cold climate winter (0.04 × 10⁻³ m3m−3/°C). Regarding surface soil moisture from 1982 to 2020, precipitation induced the strongest wetting trend in the temperate summer, at a rate of 0.013 × 10⁻³ m3m−3/mm. The wetting trend driven by temperature difference was most significant in the arid spring, reaching 0.024 × 10⁻³ m3m−3/°C. Comparing the 1982–1999 and 2000–2020 periods, the dominant influence of LAI on global soil moisture has significantly strengthened. For rootzone soil moisture, this effect increased most notably in winter (+10.47%) and summer (+10.37%). For surface soil moisture, the increase was most prominent in winter, at 9.10 percentage points. From 1982 to 2020, the average sensitivity coefficients of both rootzone and surface soil moisture to POS were positive in temperate and tropical zones. The lowest sensitivity of rootzone and surface soil moisture to POS occurred in the cold-climate summer, with values of −0.0297 m3m−3·d−1 and −0.0293 m3m−3·d−1, respectively. Regarding LAIMAX, with the exception of summer in cold climates, the sensitivity coefficients for both soil layers were positive across all seasons in all climate zones. This study also investigated the spatiotemporal patterns of POS and LAIMAX across the Northern Hemisphere, along with their responses to meteorological factors. The research provides a fundamental theoretical framework for predicting the spatiotemporal dynamics of soil moisture under global climate change and vegetation greening scenarios. It also deepens our understanding of global terrestrial ecohydrological processes.
Supplementary Materials
The following supporting information can be downloaded at: https://www.mdpi.com/article/10.3390/rs17223714/s1.
Author Contributions
Conceptualization, H.Y. (Hanmin Yin), X.L. and Q.L.; methodology, H.Y. (Hanmin Yin), X.L. and Q.L.; software, H.Y. (Hanmin Yin), Q.L., W.Y., Y.L., J.W. and J.Y.; resources, J.B. and Q.L.; data curation, H.Y. (Hanmin Yin); writing—original draft preparation, H.Y. (Hanmin Yin); writing—review and editing, H.Y. (Hanmin Yin) and Q.L.; supervision, X.L. and H.Y. (Huping Ye); project administration, Q.L.; funding acquisition, Q.L. and J.B. All authors have read and agreed to the published version of the manuscript.
Funding
This research was funded by the Major Key Project of PCL and the National Natural Science Foundation of China [Grant No. 41871226].
Data Availability Statement
The rootzone and surface soil moisture datasets used in this study are publicly available from the National Earth System Science Data Center at https://www.geodata.cn/main/face_scientist (accessed on 1 May 2025). The LAI dataset is available in the Zenodo repository at https://doi.org/10.5281/zenodo.7649107 (accessed on 1 May 2025).
Acknowledgments
We gratefully acknowledge the following data sources that were essential to this study: the rootzone and surface soil moisture datasets from the National Earth System Science Data Center, the monthly maximum/minimum temperature, precipitation, solar radiation, and wind speed data from TerraClimate, the GIMMS LAI4g product, and the updated Köppen–Geiger climate classification maps. Special thanks are extended to NASA’s Land Processes Distributed Active Archive Center (LPDAAC) for providing the MCD12C1 product. These high-quality datasets formed the foundation of our research, and we sincerely appreciate the support from these organizations.
Conflicts of Interest
The authors declare no conflicts of interest.
References
- Meng, F.; Luo, M.; Sa, C.; Wang, M.; Bao, Y. Quantitative assessment of the effects of climate, vegetation, soil and groundwater on soil moisture spatiotemporal variability in the Mongolian Plateau. Sci. Total Environ. 2022, 809, 152198. [Google Scholar] [CrossRef]
- Tian, J.; Zhang, B.; He, C.; Han, Z.; Bogena, H.R.; Huisman, J.A. Dynamic response patterns of profile soil moisture wetting events under different land covers in the Mountainous area of the Heihe River Watershed, Northwest China. Agric. For. Meteorol. 2019, 271, 225–239. [Google Scholar] [CrossRef]
- Li, W.; Duveiller, G.; Wieneke, S.; Forkel, M.; Gentine, P.; Reichstein, M.; Niu, S.; Migliavacca, M.; Orth, R. Regulation of the global carbon and water cycles through vegetation structural and physiological dynamics. Environ. Res. Lett. 2024, 19, 073008. [Google Scholar] [CrossRef]
- Fang, Z.; Zhang, W.; Brandt, M.; Abdi, A.M.; Fensholt, R. Globally Increasing Atmospheric Aridity Over the 21st Century. Earth’s Future 2022, 10, e2022EF003019. [Google Scholar] [CrossRef]
- Zeng, Z.; Wu, W.; Peñuelas, J.; Li, Y.; Jiao, W.; Li, Z.; Ren, X.; Wang, K.; Ge, Q. Increased risk of flash droughts with raised concurrent hot and dry extremes under global warming. npj Clim. Atmos. Sci. 2023, 6, 134. [Google Scholar] [CrossRef]
- Jin, X.; Jin, H.; Luo, D.; Sheng, Y.; Wu, Q.; Wu, J.; Wang, W.; Huang, S.; Li, X.; Liang, S.; et al. Impacts of Permafrost Degradation on Hydrology and Vegetation in the Source Area of the Yellow River on Northeastern Qinghai-Tibet Plateau, Southwest China. Front. Earth Sci. 2022, 10, 845824. [Google Scholar] [CrossRef]
- Jiao, W.; Wang, L.; Smith, W.K.; Chang, Q.; Wang, H.; D’Odorico, P. Observed increasing water constraint on vegetation growth over the last three decades. Nat. Commun. 2021, 12, 3777. [Google Scholar] [CrossRef]
- Berg, A.; Sheffield, J.; Milly, P.C.D. Divergent surface and total soil moisture projections under global warming. Geophys. Res. Lett. 2017, 44, 236–244. [Google Scholar] [CrossRef]
- Zhang, Y.; Parazoo, N.C.; Williams, A.P.; Zhou, S.; Gentine, P. Large and projected strengthening moisture limitation on end-of-season photosynthesis. Proc. Natl. Acad. Sci. USA 2020, 117, 9216–9222. [Google Scholar] [CrossRef] [PubMed]
- Yuan, W.; Zheng, Y.; Piao, S.; Ciais, P.; Lombardozzi, D.; Wang, Y.; Ryu, Y.; Chen, G.; Dong, W.; Hu, Z.; et al. Increased atmospheric vapor pressure deficit reduces global vegetation growth. Sci. Adv. 2019, 5, eaax1396. [Google Scholar] [CrossRef]
- Konings, A.G.; Williams, A.P.; Gentine, P. Sensitivity of grassland productivity to aridity controlled by stomatal and xylem regulation. Nat. Geosci. 2017, 10, 284–288. [Google Scholar] [CrossRef]
- Bai, P.; Liu, X.; Zhang, Y.; Liu, C. Assessing the Impacts of Vegetation Greenness Change on Evapotranspiration and Water Yield in China. Water Resour. Res. 2020, 56, e2019WR027019. [Google Scholar] [CrossRef]
- Igwe, P.; Ezeukwu, J.; Edoka, N.; Ejie, O.; Ifi, G. A review of vegetation cover as a natural factor to soil erosion. Int. J. Rural Dev. Environ. Health Res. 2017, 1, 21–28. [Google Scholar]
- Davarzani, H.; Smits, K.; Tolene, R.M.; Illangasekare, T. Study of the effect of wind speed on evaporation from soil through integrated modeling of the atmospheric boundary layer and shallow subsurface. Water Resour. Res. 2014, 50, 661–680. [Google Scholar] [CrossRef] [PubMed]
- Wang, Y.; Yang, J.; Chen, Y.; Wang, A.; De Maeyer, P. The Spatiotemporal Response of Soil Moisture to Precipitation and Temperature Changes in an Arid Region, China. Remote Sens. 2018, 10, 468. [Google Scholar] [CrossRef]
- Zhang, W.; Wei, F.; Horion, S.; Fensholt, R.; Forkel, M.; Brandt, M. Global quantification of the bidirectional dependency between soil moisture and vegetation productivity. Agric. For. Meteorol. 2022, 313, 108735. [Google Scholar] [CrossRef]
- Jiao, Z.; Shen, Z. School choice with priority-based affirmative action: A responsive solution. J. Math. Econ. 2021, 92, 1–9. [Google Scholar] [CrossRef]
- Xu, Z.-X.; Li, L.; Zhao, J. A distributed eco-hydrological model and its application. Water Sci. Eng. 2017, 10, 257–264. [Google Scholar] [CrossRef]
- Yu, L.; Liu, Y.; Li, X.; Yan, F.; Lyne, V.; Liu, T. Vegetation-induced asymmetric diurnal land surface temperatures changes across global climate zones. Sci. Total Environ. 2023, 896, 165255. [Google Scholar] [CrossRef]
- Sun, S.; Liu, Y.; Chen, H.; Ju, W.; Xu, C.-Y.; Liu, Y.; Zhou, B.; Zhou, Y.; Zhou, Y.; Yu, M. Causes for the increases in both evapotranspiration and water yield over vegetated mainland China during the last two decades. Agric. For. Meteorol. 2022, 324, 109118. [Google Scholar] [CrossRef]
- Li, W.; Migliavacca, M.; Forkel, M.; Denissen, J.M.C.; Reichstein, M.; Yang, H.; Duveiller, G.; Weber, U.; Orth, R. Widespread increasing vegetation sensitivity to soil moisture. Nat. Commun. 2022, 13, 3959. [Google Scholar] [CrossRef]
- Gonsamo, A.; Chen, J.M.; Ooi, Y.W. Peak season plant activity shift towards spring is reflected by increasing carbon uptake by extratropical ecosystems. Glob. Change Biol. 2018, 24, 2117–2128. [Google Scholar] [CrossRef]
- Liu, Z.; Fu, Y.H.; Chen, D.; Crowther, T.W.; Ding, R.; Hao, F.; Vitasse, Y.; Zhang, X.; Zhou, S.; Zohner, C.M. Increased early-season productivity drives earlier peak of vegetation photosynthesis across the Northern Hemisphere. Commun. Earth Environ. 2025, 6, 157. [Google Scholar] [CrossRef]
- Xia, J.; Niu, S.; Ciais, P.; Janssens, I.A.; Chen, J.; Ammann, C.; Arain, A.; Blanken, P.D.; Cescatti, A.; Bonal, D.; et al. Joint control of terrestrial gross primary productivity by plant phenology and physiology. Proc. Natl. Acad. Sci. USA 2015, 112, 2788–2793. [Google Scholar] [CrossRef]
- Huang, Z.; Zhou, L.; Chi, Y. Spring phenology rather than climate dominates the trends in peak of growing season in the Northern Hemisphere. Glob. Change Biol. 2023, 29, 4543–4555. [Google Scholar] [CrossRef] [PubMed]
- Yin, H.; Ma, X.; Liao, X.; Ye, H.; Yu, W.; Li, Y.; Wei, J.; Yuan, J.; Liu, Q. Linking Vegetation Phenology to Net Ecosystem Productivity: Climate Change Impacts in the Northern Hemisphere Using Satellite Data. Remote Sens. 2024, 16, 4101. [Google Scholar] [CrossRef]
- Luo, Y.; Zhang, Z.; Chen, Y.; Li, Z.; Tao, F. ChinaCropPhen1km: A high-resolution crop phenological dataset for three staple crops in China during 2000–2015 based on leaf area index (LAI) products. Earth Syst. Sci. Data 2020, 12, 197–214. [Google Scholar] [CrossRef]
- Zhang, L.; Lei, H.; Shen, H.; Cong, Z.; Yang, D.; Liu, T. Evaluating the Representation of Vegetation Phenology in the Community Land Model 4.5 in a Temperate Grassland. J. Geophys. Res. Biogeosci. 2019, 124, 187–210. [Google Scholar] [CrossRef]
- Xu, X.; Du, H.; Fan, W.; Hu, J.; Mao, F.; Dong, H. Long-term trend in vegetation gross primary production, phenology and their relationships inferred from the FLUXNET data. J. Environ. Manag. 2019, 246, 605–616. [Google Scholar] [CrossRef]
- Park, T.; Chen, C.; Macias-Fauria, M.; Tømmervik, H.; Choi, S.; Winkler, A.; Bhatt, U.S.; Walker, D.A.; Piao, S.; Brovkin, V.; et al. Changes in timing of seasonal peak photosynthetic activity in northern ecosystems. Glob. Change Biol. 2019, 25, 2382–2395. [Google Scholar] [CrossRef]
- Xu, C.; McDowell, N.G.; Fisher, R.A.; Wei, L.; Sevanto, S.; Christoffersen, B.O.; Weng, E.; Middleton, R.S. Increasing impacts of extreme droughts on vegetation productivity under climate change. Nat. Clim. Change 2019, 9, 948–953. [Google Scholar] [CrossRef]
- Bonfils, C.J.W.; Phillips, T.J.; Lawrence, D.M.; Cameron-Smith, P.; Riley, W.J.; Subin, Z.M. On the influence of shrub height and expansion on northern high latitude climate. Environ. Res. Lett. 2012, 7, 015503. [Google Scholar] [CrossRef]
- Li, G.; Wu, C.; Chen, Y.; Huang, C.; Zhao, Y.; Wang, Y.; Ma, M.; Ding, Z.; Yu, P.; Tang, X. Increasing temperature regulates the advance of peak photosynthesis timing in the boreal ecosystem. Sci. Total Environ. 2023, 882, 163587. [Google Scholar] [CrossRef] [PubMed]
- Luo, M.; Meng, F.; Sa, C.; Duan, Y.; Bao, Y.; Liu, T.; De Maeyer, P. Response of vegetation phenology to soil moisture dynamics in the Mongolian Plateau. CATENA 2021, 206, 105505. [Google Scholar] [CrossRef]
- Wang, X.; Wu, C. Estimating the peak of growing season (POS) of China’s terrestrial ecosystems. Agric. For. Meteorol. 2019, 278, 107639. [Google Scholar] [CrossRef]
- Liu, Y.; Wu, C.; Wang, X.; Jassal, R.S.; Gonsamo, A. Impacts of global change on peak vegetation growth and its timing in terrestrial ecosystems of the continental US. Glob. Planet. Change 2021, 207, 103657. [Google Scholar] [CrossRef]
- Gao, X.; Zhao, D. Impacts of climate change on vegetation phenology over the Great Lakes Region of Central Asia from 1982 to 2014. Sci. Total Environ. 2022, 845, 157227. [Google Scholar] [CrossRef]
- Li, P.; Peng, C.; Wang, M.; Luo, Y.; Li, M.; Zhang, K.; Zhang, D.; Zhu, Q. Dynamics of vegetation autumn phenology and its response to multiple environmental factors from 1982 to 2012 on Qinghai-Tibetan Plateau in China. Sci. Total Environ. 2018, 637–638, 855–864. [Google Scholar] [CrossRef]
- Lian, X.; Piao, S.; Li, L.Z.X.; Li, Y.; Huntingford, C.; Ciais, P.; Cescatti, A.; Janssens, I.A.; Peñuelas, J.; Buermann, W.; et al. Summer soil drying exacerbated by earlier spring greening of northern vegetation. Sci. Adv. 2020, 6, eaax0255. [Google Scholar] [CrossRef] [PubMed]
- Piao, S.; Yin, G.; Tan, J.; Cheng, L.; Huang, M.; Li, Y.; Liu, R.; Mao, J.; Myneni, R.B.; Peng, S.; et al. Detection and attribution of vegetation greening trend in China over the last 30 years. Glob. Change Biol. 2015, 21, 1601–1609. [Google Scholar] [CrossRef]
- Hu, Y.; Zhou, J.; Deng, J.; Li, Y.; Yang, C.; Li, D. River Bars and Vegetation Dynamics in Response to Upstream Damming: A Case Study of the Middle Yangtze River. Remote Sens. 2023, 15, 2324. [Google Scholar] [CrossRef]
- Xu, T.; Yan, K.; He, Y.; Gao, S.; Yang, K.; Wang, J.; Liu, J.; Liu, Z. Spatio-Temporal Variability Analysis of Vegetation Dynamics in China from 2000 to 2022 Based on Leaf Area Index: A Multi-Temporal Image Classification Perspective. Remote Sens. 2023, 15, 2975. [Google Scholar] [CrossRef]
- Cao, S.; Li, M.; Zhu, Z.; Wang, Z.; Zha, J.; Zhao, W.; Duanmu, Z.; Chen, J.; Zheng, Y.; Chen, Y.; et al. Spatiotemporally consistent global dataset of the GIMMS leaf area index (GIMMS LAI4g) from 1982 to 2020. Earth Syst. Sci. Data 2023, 15, 4877–4899. [Google Scholar] [CrossRef]
- Chen, Y.; Zhu, Z.; Zhao, W.; Li, M.; Cao, S.; Zheng, Y.; Tian, F.; Myneni, R.B. The direct and indirect effects of the environmental factors on global terrestrial gross primary productivity over the past four decades. Environ. Res. Lett. 2024, 19, 014052. [Google Scholar] [CrossRef]
- Han, X.; Chen, Y.; Fang, G.; Li, Z.; Li, Y.; Di, Y. Spatiotemporal Variations and Driving Factors of Water Availability in the Arid and Semiarid Regions of Northern China. Remote Sens. 2024, 16, 4318. [Google Scholar] [CrossRef]
- Liao, J.; Xu, Y.; Pi, J.; Li, Y.; Ke, C.; Zhan, W.; Chen, J. Widespread Sensitivity of Vegetation to the Transition From Normal Droughts to Flash Droughts. Geophys. Res. Lett. 2025, 52, e2024GL114321. [Google Scholar] [CrossRef]
- Tang, J.; Niu, B.; Fu, G.; Peng, J.; Hu, Z.; Zhang, X. Shifted trend in drought sensitivity of vegetation productivity from 1982 to 2020. Agric. For. Meteorol. 2025, 362, 110388. [Google Scholar] [CrossRef]
- Li, J.; Bevacqua, E.; Chen, C.; Wang, Z.; Chen, X.; Myneni, R.B.; Wu, X.; Xu, C.-Y.; Zhang, Z.; Zscheischler, J. Regional asymmetry in the response of global vegetation growth to springtime compound climate events. Commun. Earth Environ. 2022, 3, 123. [Google Scholar] [CrossRef]
- Liu, Y.; Yang, Y.; Song, J. Variations in Global Soil Moisture During the Past Decades: Climate or Human Causes? Water Resour. Res. 2023, 59, e2023WR034915. [Google Scholar] [CrossRef]
- Zhu, Y.; Jiang, S.; Ren, L.; Guo, J.; Zhong, F.; Du, S.; Cui, H.; He, M.; Duan, Z. Three-dimensional ecological drought identification and evaluation method considering eco-physiological status of terrestrial ecosystems. Sci. Total Environ. 2024, 951, 175423. [Google Scholar] [CrossRef]
- Bai, X.; Zhang, Z.; Gu, D. Driving mechanism of natural vegetation response to climate change in China from 2001 to 2022. Environ. Res. 2025, 276, 121529. [Google Scholar] [CrossRef]
- Beck, H.E.; Zimmermann, N.E.; McVicar, T.R.; Vergopolan, N.; Berg, A.; Wood, E.F. Present and future Köppen-Geiger climate classification maps at 1-km resolution. Sci. Data 2018, 5, 180214. [Google Scholar] [CrossRef]
- Forzieri, G.; Alkama, R.; Miralles, D.G.; Cescatti, A. Satellites reveal contrasting responses of regional climate to the widespread greening of Earth. Science 2017, 356, 1180–1184. [Google Scholar] [CrossRef] [PubMed]
- Abeysiriwardana, H.D.; Gomes, P.I.A. Integrating vegetation indices and geo-environmental factors in GIS-based landslide-susceptibility mapping: Using logistic regression. J. Mt. Sci. 2022, 19, 477–492. [Google Scholar] [CrossRef]
- Midi, H.; Sarkar, S.K.; Rana, S. Collinearity diagnostics of binary logistic regression model. J. Interdiscip. Math. 2010, 13, 253–267. [Google Scholar] [CrossRef]
- James, G.; Witten, D.; Hastie, T.; Tibshirani, R. An Introduction to Statistical Learning; Springer Texts in Statistics; Springer: New York, NY, USA, 2013; Volume 103, pp. 971–978. [Google Scholar]
- Breiman, L. Random Forests. Mach. Learn. 2001, 45, 5–32. [Google Scholar] [CrossRef]
- Lundberg, S.M.; Lee, S.-I. A unified approach to interpreting model predictions. Adv. Neural Inf. Process. Syst. 2017, 30, 4768–4777. [Google Scholar]
- Jabeur, S.B.; Mefteh-Wali, S.; Viviani, J.-L. Forecasting gold price with the XGBoost algorithm and SHAP interaction values. Ann. Oper. Res. 2024, 334, 679–699. [Google Scholar] [CrossRef]
- Zhang, W.; Fan, Z.; Jin, C.; Jiao, Y.; Di, K.; Feng, M.; Lu, Y.; Zhao, K.; Zhao, H.; Hao, S.; et al. Reversal of the sensitivity of vegetation productivity to precipitation in global terrestrial biomes over the recent decade. Agric. For. Meteorol. 2025, 370, 110598. [Google Scholar] [CrossRef]
- Bai, T.; Wang, X.-S.; Han, P.-F. Controls of groundwater-dependent vegetation coverage in the yellow river basin, China: Insights from interpretable machine learning. J. Hydrol. 2024, 631, 130747. [Google Scholar] [CrossRef]
- Chen, H.; Liu, J.; He, W.; Xu, P.; Nguyen, N.T.; Lv, Y.; Huang, C. Shifted vegetation resilience from loss to gain driven by changes in water availability and solar radiation over the last two decades in Southwest China. Agric. For. Meteorol. 2025, 368, 110543. [Google Scholar] [CrossRef]
- Yin, H.; Liu, Q.; Liao, X.; Ye, H.; Li, Y.; Ma, X. Refined Analysis of Vegetation Phenology Changes and Driving Forces in High Latitude Altitude Regions of the Northern Hemisphere: Insights from High Temporal Resolution MODIS Products. Remote Sens. 2024, 16, 1744. [Google Scholar] [CrossRef]
- Chen, A.; Meng, F.; Mao, J.; Ricciuto, D.; Knapp, A.K. Photosynthesis phenology, as defined by solar-induced chlorophyll fluorescence, is overestimated by vegetation indices in the extratropical Northern Hemisphere. Agric. For. Meteorol. 2022, 323, 109027. [Google Scholar] [CrossRef]
- Jiang, L.; Bao, A.; Guo, H.; Ndayisaba, F. Vegetation dynamics and responses to climate change and human activities in Central Asia. Sci. Total Environ. 2017, 599, 967–980. [Google Scholar] [CrossRef] [PubMed]
- Bashir, B.; Cao, C.; Naeem, S.; Zamani Joharestani, M.; Bo, X.; Afzal, H.; Jamal, K.; Mumtaz, F. Spatio-Temporal Vegetation Dynamic and Persistence under Climatic and Anthropogenic Factors. Remote Sens. 2020, 12, 2612. [Google Scholar] [CrossRef]
- Chang, J.; Liu, Q.; Wang, S.; Huang, C. Vegetation Dynamics and Their Influencing Factors in China from 1998 to 2019. Remote Sens. 2022, 14, 3390. [Google Scholar] [CrossRef]
- Hirschi, M.; Mueller, B.; Dorigo, W.; Seneviratne, S.I. Using remotely sensed soil moisture for land–atmosphere coupling diagnostics: The role of surface vs. root-zone soil moisture variability. Remote Sens. Environ. 2014, 154, 246–252. [Google Scholar] [CrossRef]
- Akbar, R.; Short Gianotti, D.; McColl, K.A.; Haghighi, E.; Salvucci, G.D.; Entekhabi, D. Hydrological Storage Length Scales Represented by Remote Sensing Estimates of Soil Moisture and Precipitation. Water Resour. Res. 2018, 54, 1476–1492. [Google Scholar] [CrossRef]
- Li, M.; Sun, H.; Zhao, R. A Review of Root Zone Soil Moisture Estimation Methods Based on Remote Sensing. Remote Sens. 2023, 15, 5361. [Google Scholar] [CrossRef]
- Feldman, A.F.; Short Gianotti, D.J.; Dong, J.; Akbar, R.; Crow, W.T.; McColl, K.A.; Konings, A.G.; Nippert, J.B.; Tumber-Dávila, S.J.; Holbrook, N.M.; et al. Remotely Sensed Soil Moisture Can Capture Dynamics Relevant to Plant Water Uptake. Water Resour. Res. 2023, 59, e2022WR033814. [Google Scholar] [CrossRef]
- Wei, L.; Qiu, Z.; Zhou, G.; Zuecco, G.; Liu, Y.; Wen, Y. Soil water hydraulic redistribution in a subtropical monsoon evergreen forest. Sci. Total Environ. 2022, 835, 155437. [Google Scholar] [CrossRef] [PubMed]
- Moscati, M.D.L.; Gan, M.A. Rainfall variability in the rainy season of semiarid zone of Northeast Brazil (NEB) and its relation to wind regime. Int. J. Climatol. 2007, 27, 493–512. [Google Scholar] [CrossRef]
- Li, B.-B.; Li, P.-P.; Zhang, W.-T.; Ji, J.-Y.; Liu, G.-B.; Xu, M.-X. Deep soil moisture limits the sustainable vegetation restoration in arid and semi-arid Loess Plateau. Geoderma 2021, 399, 115122. [Google Scholar] [CrossRef]
- Ansley, R.J.; Boutton, T.W.; Jacoby, P.W. Root Biomass and Distribution Patterns in a Semi-Arid Mesquite Savanna: Responses to Long-Term Rainfall Manipulation. Rangel. Ecol. Manag. 2014, 67, 206–218. [Google Scholar] [CrossRef]
- Su, B.; Shangguan, Z. Decline in soil moisture due to vegetation restoration on the Loess Plateau of China. Land Degrad. Dev. 2019, 30, 290–299. [Google Scholar] [CrossRef]
- Wang, Y.; Shao, M.a.; Liu, Z. Large-scale spatial variability of dried soil layers and related factors across the entire Loess Plateau of China. Geoderma 2010, 159, 99–108. [Google Scholar] [CrossRef]
- Ruichen, M.; Jinxi, S.; Bin, T.; Wenjin, X.; Feihe, K.; Haotian, S.; Yuxin, L. Vegetation variation regulates soil moisture sensitivity to climate change on the Loess Plateau. J. Hydrol. 2023, 617, 128763. [Google Scholar] [CrossRef]
- Gao, S.; Chen, Y.; Li, K.; He, B.; Hou, P.; Guo, Z. Frequent heatwaves limit the indirect growth effect of urban vegetation in China. Sustain. Cities Soc. 2023, 96, 104662. [Google Scholar] [CrossRef]
- Cortés, J.; Mahecha, M.D.; Reichstein, M.; Myneni, R.B.; Chen, C.; Brenning, A. Where Are Global Vegetation Greening and Browning Trends Significant? Geophys. Res. Lett. 2021, 48, e2020GL091496. [Google Scholar] [CrossRef]
- Zhu, Z.; Piao, S.; Myneni, R.B.; Huang, M.; Zeng, Z.; Canadell, J.G.; Ciais, P.; Sitch, S.; Friedlingstein, P.; Arneth, A.; et al. Greening of the Earth and its drivers. Nat. Clim. Change 2016, 6, 791–795. [Google Scholar] [CrossRef]
- Khamidov, M.; Ishchanov, J.; Hamidov, A.; Shermatov, E.; Gafurov, Z. Impact of Soil Surface Temperature on Changes in the Groundwater Level. Water 2023, 15, 3865. [Google Scholar] [CrossRef]
- Piao, S.; Tan, J.; Chen, A.; Fu, Y.H.; Ciais, P.; Liu, Q.; Janssens, I.A.; Vicca, S.; Zeng, Z.; Jeong, S.-J.; et al. Leaf onset in the northern hemisphere triggered by daytime temperature. Nat. Commun. 2015, 6, 6911. [Google Scholar] [CrossRef] [PubMed]
- Peng, S.; Piao, S.; Ciais, P.; Myneni, R.B.; Chen, A.; Chevallier, F.; Dolman, A.J.; Janssens, I.A.; Peñuelas, J.; Zhang, G.; et al. Asymmetric effects of daytime and night-time warming on Northern Hemisphere vegetation. Nature 2013, 501, 88–92. [Google Scholar] [CrossRef]
- Smith, S.L.; O’Neill, H.B.; Isaksen, K.; Noetzli, J.; Romanovsky, V.E. The changing thermal state of permafrost. Nat. Rev. Earth Environ. 2022, 3, 10–23. [Google Scholar] [CrossRef]
- Rina, W.; Bao, G.; Hai, Q.; Chen, J.; Guo, E.; Li, F.; Bao, Y.; Miao, L.; Huang, X. Parallel acceleration of vegetation growth rate and senescence rate across the Northern Hemisphere from 1982 to 2015. Glob. Ecol. Conserv. 2023, 46, e02622. [Google Scholar] [CrossRef]
- Flynn, D.F.B.; Wolkovich, E.M. Temperature and photoperiod drive spring phenology across all species in a temperate forest community. New Phytol. 2018, 219, 1353–1362. [Google Scholar] [CrossRef]
- Vitasse, Y.; Signarbieux, C.; Fu, Y.H. Global warming leads to more uniform spring phenology across elevations. Proc. Natl. Acad. Sci. USA 2018, 115, 1004–1008. [Google Scholar] [CrossRef]
- Piao, S.; Wang, X.; Park, T.; Chen, C.; Lian, X.; He, Y.; Bjerke, J.W.; Chen, A.; Ciais, P.; Tømmervik, H.; et al. Characteristics, drivers and feedbacks of global greening. Nat. Rev. Earth Environ. 2020, 1, 14–27. [Google Scholar] [CrossRef]
- Farquhar, G.D.; Sharkey, T.D. Stomatal conductance and photosynthesis. Annu. Rev. Plant Physiol. 1982, 33, 317–345. [Google Scholar] [CrossRef]
- Keenan, T.F.; Hollinger, D.Y.; Bohrer, G.; Dragoni, D.; Munger, J.W.; Schmid, H.P.; Richardson, A.D. Increase in forest water-use efficiency as atmospheric carbon dioxide concentrations rise. Nature 2013, 499, 324–327. [Google Scholar] [CrossRef] [PubMed]
- Greaver, T.L.; Clark, C.M.; Compton, J.E.; Vallano, D.; Talhelm, A.F.; Weaver, C.P.; Band, L.E.; Baron, J.S.; Davidson, E.A.; Tague, C.L.; et al. Key ecological responses to nitrogen are altered by climate change. Nat. Clim. Change 2016, 6, 836–843. [Google Scholar] [CrossRef]
- Chen, C.; Park, T.; Wang, X.; Piao, S.; Xu, B.; Chaturvedi, R.K.; Fuchs, R.; Brovkin, V.; Ciais, P.; Fensholt, R.; et al. China and India lead in greening of the world through land-use management. Nat. Sustain. 2019, 2, 122–129. [Google Scholar] [CrossRef]
- Piao, S.; Friedlingstein, P.; Ciais, P.; Viovy, N.; Demarty, J. Growing season extension and its impact on terrestrial carbon cycle in the Northern Hemisphere over the past 2 decades. Glob. Biogeochem. Cycles 2007, 21. [Google Scholar] [CrossRef]
- Donohue, R.J.; Roderick, M.L.; McVicar, T.R.; Farquhar, G.D. Impact of CO2 fertilization on maximum foliage cover across the globe’s warm, arid environments. Geophys. Res. Lett. 2013, 40, 3031–3035. [Google Scholar] [CrossRef]
- Ainsworth, E.A.; Long, S.P. What have we learned from 15 years of free-air CO2 enrichment (FACE)? A meta-analytic review of the responses of photosynthesis, canopy properties and plant production to rising CO2. New Phytol. 2005, 165, 351–372. [Google Scholar] [CrossRef]
- Hussain, S.; Ulhassan, Z.; Brestic, M.; Zivcak, M.; Weijun, Z.; Allakhverdiev, S.I.; Yang, X.; Safdar, M.E.; Yang, W.; Liu, W. Photosynthesis research under climate change. Photosynth. Res. 2021, 150, 5–19. [Google Scholar] [CrossRef]
- Yang, Y.; Roderick, M.L.; Guo, H.; Miralles, D.G.; Zhang, L.; Fatichi, S.; Luo, X.; Zhang, Y.; McVicar, T.R.; Tu, Z.; et al. Evapotranspiration on a greening Earth. Nat. Rev. Earth Environ. 2023, 4, 626–641. [Google Scholar] [CrossRef]
- Beck, H.E.; Pan, M.; Miralles, D.G.; Reichle, R.H.; Dorigo, W.A.; Hahn, S.; Sheffield, J.; Karthikeyan, L.; Balsamo, G.; Parinussa, R.M.; et al. Evaluation of 18 satellite- and model-based soil moisture products using in situ measurements from 826 sensors. Hydrol. Earth Syst. Sci. 2021, 25, 17–40. [Google Scholar] [CrossRef]
- Reichle, R.H.; Draper, C.S.; Liu, Q.; Girotto, M.; Mahanama, S.P.P.; Koster, R.D.; De Lannoy, G.J.M. Assessment of MERRA-2 Land Surface Hydrology Estimates. J. Clim. 2017, 30, 2937–2960. [Google Scholar] [CrossRef]
- Li, M.; Wu, P.; Ma, Z. A comprehensive evaluation of soil moisture and soil temperature from third-generation atmospheric and land reanalysis data sets. Int. J. Climatol. 2020, 40, 5744–5766. [Google Scholar] [CrossRef]
- Zhang, D.; Zhou, G. Estimation of Soil Moisture from Optical and Thermal Remote Sensing: A Review. Sensors 2016, 16, 1308. [Google Scholar] [CrossRef] [PubMed]
- Cho, K.; Negrón-Juárez, R.; Colliander, A.; Cosio, E.G.; Salinas, N.; de Araujo, A.; Chambers, J.Q.; Wang, J. Calibration of the SMAP Soil Moisture Retrieval Algorithm to Reduce Bias Over the Amazon Rainforest. IEEE J. Sel. Top. Appl. Earth Obs. Remote Sens. 2024, 17, 8724–8736. [Google Scholar] [CrossRef]
Disclaimer/Publisher’s Note: The statements, opinions and data contained in all publications are solely those of the individual author(s) and contributor(s) and not of MDPI and/or the editor(s). MDPI and/or the editor(s) disclaim responsibility for any injury to people or property resulting from any ideas, methods, instructions or products referred to in the content. |
© 2025 by the authors. Licensee MDPI, Basel, Switzerland. This article is an open access article distributed under the terms and conditions of the Creative Commons Attribution (CC BY) license (https://creativecommons.org/licenses/by/4.0/).