Highlights
What are the main findings?
- High-quality potential afforestation lands (≈2.33 × 10⁵ km2) are mainly concentrated along the Hu Line, with 45.94% located in the upper and middle reaches of the Yangtze River shelterbelt program.
- By 2070, under the revised annual afforestation target (0.47 × 10⁵ km2/year), the Taihang Mountain shelterbelt program achieves the largest gains, with soil conservation increasing by 47.56% and carbon sequestration by 10.15%.
What is the implication of the main finding?
- The pronounced regional differences indicate that future afforestation planning should adopt region-specific and optimized strategies rather than a uniform approach.
- The study aims to enhance ecosystem service functions in shelterbelt program zones through afforestation amendments and to promote sustainable land management.
Abstract
Afforestation is a critical nature-based strategy for enhancing ecological resilience and supporting cleaner land-use systems. This study presents a spatially explicit modeling framework to evaluate the long-term impacts of potential afforestation amendments on two key ecosystem services—soil conservation and carbon sequestration—across China’s major shelterbelt program areas under the SSP245 scenario (2020–2070). Using a zonal approach, we integrated Random Forest models, Bayesian belief networks, and Geodetector analysis to identify region-specific afforestation suitability and quantify ecological service gains across eight national shelterbelt program zones. The results reveal pronounced spatial heterogeneity in ecosystem service improvements. (1) High-quality potential afforestation lands, totaling approximately 2.33 × 10⁵ km2, are primarily concentrated near the Hu Line (a geographical boundary that divides China into two distinct climatic regions), with the shelterbelt program for upper and middle reaches of Yangtze River accounting for 45.94%. (2) Based on the amended annual afforestation target of 0.47 × 10⁵ km2, the adjusted land use projections indicate a significant increase in forest cover. By 2070, the afforestation program for Taihang Mountain exhibits the most significant improvements, with a 47.56% increase in soil conservation and a 10.15% increase in carbon sequestration. (3) Optimization areas differ across zones, with the Taihang mountain area (99.2%) and Pearl river area (70.1%) achieving the highest improvements in soil and carbon services, respectively. These findings provide robust scientific support for data-driven, region-specific afforestation planning under future land-use change scenarios.
1. Introduction
The world is currently facing overlapping environmental crises, including climate change, land degradation, and biodiversity loss. These pressures undermine ecosystem integrity and threaten resource use efficiency [1]. In the context of promoting green transition and high-quality development, there is an urgent need for systematic strategies that integrate ecological restoration with low-carbon and ecologically sensitive development. Afforestation in suitable areas has emerged as a key nature-based solution. It promotes ecosystem recovery and supports the growth of the green economy. Well-planned afforestation efforts can rehabilitate degraded land and restore ecological functions, thereby providing strong support for ecological security and sustainable land management [2,3,4].
Globally, many countries have adopted large-scale afforestation as a key strategy for achieving carbon neutrality and ecological restoration. For example, the European Union has promoted transboundary ecological networks through the Green Infrastructure Strategy and the Nature Restoration Law [5]. Africa’s Great Green Wall initiative focuses on combating desertification and improving livelihoods [6]. In the United States and the United Kingdom, afforestation programs emphasize the integration of ecological restoration with community-based governance [7]. Compared with these practices, China’s afforestation strategy has distinctive features. Its shelterbelt projects involve long-term planning, wide regional coverage, and diverse objectives, emphasizing ecological security and ecosystem services [8,9]. While notable progress has been made, there remains a pressing need to systematically compare and draw on international experience to improve spatial allocation efficiency, quantify ecosystem service gains, and shift from a scale-oriented to a function-oriented approach to afforestation.
Achieving both ecological and productive benefits from afforestation requires more than large-scale tree planting. It demands a forward-looking and scientifically grounded framework for coordinated, long-term land-use planning. At its core, this framework should integrate regional suitability, climate variability, and land use change into a spatial assessment system capable of projecting future afforestation suitability and quantifying the ecological impacts of land use transitions. On the implementation level, spatial allocation of afforestation areas should prioritize the provision of key ecosystem services—such as carbon sequestration and soil and water conservation—to enhance synergies between ecosystem optimization and sustainable production [10]. Afforestation planning should also align with international policy frameworks, such as the guidelines proposed by the Ministerial Conference on the Protection of Forests in Europe (MCPFE), which emphasize development through the maximization of ecosystem service functions [11,12]. This alignment highlights China’s potential contribution to global afforestation governance and climate objectives.
Earlier studies on afforestation potential were primarily based on statistical or localized suitability analyses [13], such as regression analysis and the analytic hierarchy process (AHP), offering foundational insights for land restoration. With technological advances, spatial modeling tools such as MaxEnt and CLUE-S, combined with ecological productivity models (e.g., the Miami model), have been applied to assess afforestation potential at broader scales using high-resolution land-use data. Xu et al. used the Miami model to simulate the climatic conditions of potential afforestation areas [14], while He et al. employed the MaxEnt model to predict species distribution [15]. The study by Bastin et al. [16] assessed global forest restoration potential but overlooked regional policy differences, socioeconomic constraints, and ecological feedbacks, limiting fine-scale applicability. Given the significant geographical differences in afforestation outcomes driven by climate, topography, and socioeconomic conditions, generalized models with uniform parameterization often neglect key regional drivers, thereby compromising prediction accuracy and ecological planning effectiveness. For example, Zhang et al. projected the dynamic distribution of potential afforestation areas across the country but did not analyze influencing factors at the regional level [11,17].
The field of ecosystem service assessment has evolved from the qualitative framework of the Millennium Ecosystem Assessment (MEA) to more quantitative spatial modeling approaches leveraging remote sensing and land-use datasets [18]. Models such as InVEST and ARIES are now widely applied to evaluate the effects of land-use change, supporting natural capital accounting and sustainable production planning [19]. With the emergence of spatial big data and machine learning techniques, recent studies have begun to explore trade-offs and synergies among ecosystem services under future development scenarios [20]. Accurately capturing the spatiotemporal dynamics of ecosystem service responses to afforestation-driven land-use change has, thus, become a critical research frontier [21]. A meta-analysis of 128 afforestation projects across EU member states showed substantial improvements in ecosystem service provision following land-use transitions. Most current research remains limited to static scenarios or aggregated regional scales, lacking the capacity to assess dynamic ecological impacts or identify spatial heterogeneity in service gains [22]. This limits the ability of policymakers to optimize ecosystem services in alignment with clean production strategies.
To address these gaps, this study focuses on China’s eight major shelterbelt regions and develops a spatially explicit assessment framework integrating multi-source data and multiple models. The framework identifies high-quality potential afforestation areas under future scenarios and evaluates long-term ecological impacts on soil conservation and carbon sequestration. It also optimizes the spatial allocation of ecosystem services across natural regions. Methodologically, the study combines Random Forest to build a potential afforestation index with a coupled Bayesian Network–Geographical Detector approach to determine optimal ecosystem configurations. The study aims to: (1) To incorporate spatiotemporal dynamics to assess the heterogeneous impacts of driving factors across China’s shelterbelt project regions, and produce a national-scale spatial distribution map of high-quality afforestation land. (2) To adjust land use data under potential afforestation scenarios and quantify ecological benefits using soil retention and carbon sequestration as key indicators; (3) To identify the optimal spatial allocation of the two ecosystem services between 2030 and 2070, and propose a zoning strategy of “optimized areas—areas to be optimized,” providing a scientific basis and technical support for future afforestation management and ecological policymaking.
2. Materials and Methods
2.1. Overview of the Study Area
The study area covers the entirety of mainland China, spanning approximately 5500 km from north to south and 5200 km from east to west, with a total land area of about 9.6 million km2. Ecological systems across the country are highly diverse, including forests, grasslands, deserts, and wetlands. Climatic conditions range from humid subtropical zones in the southeast to arid and semi-arid regions in the northwest, accompanied by a wide variety of vegetation types such as temperate forests, alpine meadows, and desert shrublands [23]. The terrain is also complex, with plains dominating the east and highlands and mountains prevailing in the west. Mainland China has a permanent population of approximately 1.4 billion, with a highly uneven distribution—dense in the east and sparse in the west [24]. This study delineates shelterbelt program zones at the national scale and integrates regional variations in biophysical and socioeconomic conditions to assess afforestation potential and support ecological restoration and sustainable land use (Figure 1).
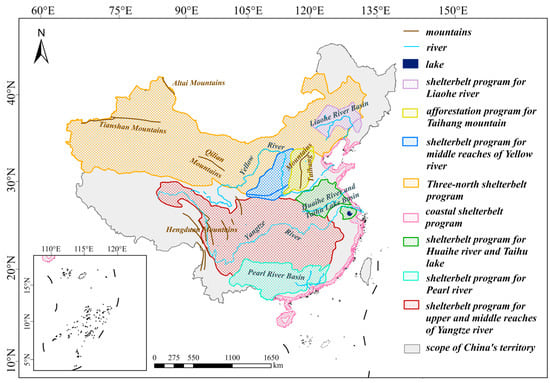
Figure 1.
Overview of the study area.
2.2. Data Sources
This study utilizes both geospatial and statistical datasets. Land use projections were derived from the SSP245 scenario, spanning the period from 2030 to 2070 with a temporal resolution of 20 years. Land classification follows the IGBP system, and the spatial projection uses the WGS_1984_Lambert_Conformal_Conic coordinate system with a resolution of 1 km. The 2020 LULC (Land Use/Land Cover) data are sourced from publicly released global land cover remote sensing classification products with a spatial resolution of 30 m, specifically including two LULC datasets: GlobeLand30 and GLC_FCS30 [25,26]. Historical temperature and precipitation data were used to calculate climate production potential. Precipitation data under the SSP245 scenario were obtained from the National Tibetan Plateau Data Center. The datasets were downscaled using the delta method, which combines coarse-resolution outputs from CMIP6 models (Coupled Model Intercomparison Project Phase 6 models) (>100 km) and high-resolution climate data from WorldClim. Future precipitation data is utilized in the subsequent analysis of the two ecosystem services. Ecological zoning, shelterbelt program delineations, and administrative boundaries were provided by the National Earth System Science Data Center.
The land source constraint data in this study primarily originate from two sources. The first set is derived from SRTM 30 m resolution DEM (Digital Elevation Model) data, combined with two LULC products—GlobeLand30 and GLC_FCS30—to extract grasslands located below the timberline and croplands with slopes exceeding 25°. The second set comprises the treeline data presented in Table 1, which imposes restrictive conditions on the spatial distribution of potential afforestation areas by defining the upper altitudinal limits of forest expansion [14,27]. The land source constraints were employed to delimit the prediction of suitable afforestation areas in this study. DEM data were obtained from the Shuttle Radar Topography Mission (SRTM, 30 m resolution), and slope and aspect were calculated using ArcGIS 10.8. Vegetation resilience data were compiled from annual MODIS MOD13A3 NDVI products from 2000 to 2020, focusing on countries along the Belt and Road Initiative (Table 1). The data preprocessing procedure is shown in Figure A1.

Table 1.
Datasets and data sources.
2.3. Methodological Framework
The technical framework of this study consists of three key components: (1) prediction of the spatial and temporal distribution of high-quality potential afforestation lands across different shelterbelt program zones; (2) assessment of two critical ecosystem services—soil conservation and carbon sequestration—based on revised land use datasets before and after potential afforestation amendments; (3) spatial optimization of ecosystem service patterns under future afforestation scenarios. The specific process is as follows: First, the Random Forest algorithm, a machine learning approach, is employed to assess the relative weights of influencing factors in each shelterbelt program zone. These weighted factors are subsequently integrated to generate a map of high-quality potential afforestation lands. Second, the total potential afforestation plan for the period 2020–2070 was evenly and randomly distributed across both time (in ten-year intervals) and space, in order to amend future land use data. Third, the InVEST model is applied to quantify ecosystem services related to soil conservation and carbon sequestration from 2030 to 2070. A Bayesian belief network is then applied to identify optimal combinations of driving factors that enhance ecosystem service provision and to refine the spatial allocation of afforestation zones (Figure 2).
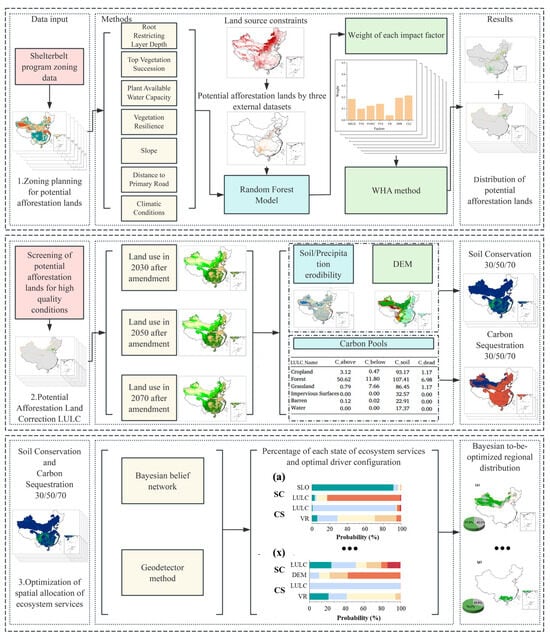
Figure 2.
Methodological framework.
2.4. Prediction of Future High-Quality Potential Afforestation Lands
2.4.1. Classification of Influencing Factors
The seven major factors influencing afforestation potential adopted in this study were derived from existing research, and their importance was subsequently evaluated. These factors are root restricting layer depth, top vegetation succession stage, plant available water capacity, vegetation resilience, slope, distance to primary roads, and climatic conditions. Root restricting layer depth refers to the maximum depth to which soil can support root penetration, indicating the physical capacity of the soil to sustain vegetation. Following the classification by Yan et al. (2020) [28], this study categorizes root restricting depth (in mm) into five levels, with a higher level denoting more favorable soil conditions for afforestation. Top vegetation succession reflects the long-term trajectory and ecological quality of natural vegetation recovery. Based on Zhang et al. [27], the potential climax vegetation types for each zone are classified, and successional trajectories are modeled. Areas undergoing succession toward forest ecosystems are ranked at the highest quality level, whereas those trending toward desertification are assigned the lowest [29,30,31]. Plant available water capacity (PAWC) is a critical condition for vegetation growth [32]. It is estimated using the Harmonized World Soil Database (FAO & IIASA) and derived using the empirical model of Zhou et al. [33]:
where , , and indicate the proportion of soil particles, and is the organic carbon content. is also classified into five levels, with higher levels indicating greater water availability for vegetation. Vegetation resilience refers to the capacity of vegetation to recover from external disturbances. Based on MODIS data, the resilience is assessed through sensitivity and adaptability analyses and classified into five levels [34,35,36]. Climatic conditions are categorized using ecological zoning datasets [17,37], and include humid zones (level 5), semi-humid zones (level 2), arid zones (level 1), semi-arid shady slopes (level 4), and sunny slopes (level 3). In the river valleys of the Hengduan Mountains in the southwest, strong foehn winds decrease the suitability for afforestation by two levels. Areas exhibiting a significant increase in climate production potential of vegetation will have their climatic conditions grade increased by one level, whereas areas showing a significant decrease will have their grade reduced by one level, with a lower bound of 1 and an upper limit of level 5.
This study employs the Miami model to assess the climate production potential of vegetation and applies the Mann–Kendall nonparametric statistical method to analyze the long-term trends in vegetation climate production potential across China from 1991 to 2020 (Figure 3). The Miami model determines the climate production potential by taking the minimum value between the temperature-based production potential and the precipitation-based production potential, providing a practical tool for evaluating the impact of climate on vegetation productivity [38]. The equations are as follows:
where ) and ) are functions of mean annual temperature and annual precipitation, respectively; is the mean annual temperature (°C), and is the annual precipitation (mm). The constant 3000 is a statistically derived parameter representing the maximum annual dry matter production of natural vegetation per unit land area.
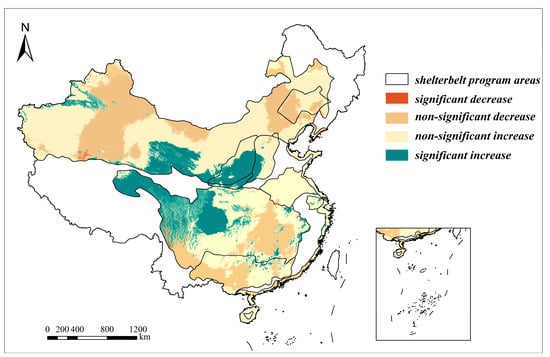
Figure 3.
Historical changes in climate production potential of vegetation across afforestation program regions.
The Mann–Kendall nonparametric statistical method is used in this study to analyze the changes in climate production potential of vegetation and to assess whether these changes are statistically significant [39,40].
For other influencing factors, this study adopts the classification scheme of Xu et al. [37]. Slope is derived from DEM data, and farmland with slopes exceeding 25 degrees is identified and categorized into five levels, where higher slopes indicate lower suitability for afforestation. Distance to primary roads is classified such that zones within 0–1 km are assigned the highest suitability level (level 5), while zones beyond 10 km are considered inaccessible (Figure 4).

Figure 4.
Spatial distribution of seven impact factors. (a) Root restricting layer depth; (b) Top vegetation succession; (c) Plant available water capacity; (d) Vegetation resilience; (e) Slope; (f) Distance to primary road; (g) Climatic conditions.
2.4.2. Estimation of Regional Factor Weights and Afforestation Distribution
This study covers eight major shelterbelt program zones, spanning from north to south and west to east. The relative weights of influencing factors in each shelterbelt program zone vary due to regional differences in environmental conditions.
In the process of determining the weights of various influencing factors, we first preprocessed three external datasets [14,37,41] using land source constraint data. Subsequently, 10% of the total sample points were randomly selected and designated as the dependent variable. Then, the values of seven influencing factors were extracted at the corresponding points to serve as independent variables. A Random Forest model was employed to train and evaluate the relationship between these variables, thereby identifying the relative weights of each factor influencing afforestation potential [17,27]. The Random Forest model was implemented in Python 3.11 to identify the relative weights of influencing factors. After hyperparameter tuning, we constructed 1000 decision trees with a fixed random seed to ensure reproducibility. The Gini impurity was used as the splitting criterion (criterion = “gini”), tree depth was unrestricted (max_depth = None), a minimum of two samples was required to split an internal node (min_samples_split = 2), and at least one sample was required at each leaf node (min_samples_leaf = 1). Based on tuning results, the maximum number of features considered at each split was set to 3 (max_features = 3). The accuracy of relative weight identification for each shelterbelt program zone is presented in Table A1.
After obtaining the weights of the influencing factors, the Weight Hierarchy Approach (WHA) was used to aggregate the different weights across regions, calculating the Potential Afforestation Suitability Index for each shelterbelt program area. This resulted in a high-resolution and high-quality spatial distribution of afforestation suitability, providing a scientific basis for subsequent land-use amendment and planning. Weight Hierarchy Approach (WHA) is an integrated weighting method commonly used to unify and synthesize the weights of multiple influencing factors across different regions and spatial scales for the construction of composite indices or decision-support models. Based on the weights of individual factors, WHA aggregates them according to a predefined hierarchical structure to derive higher-level composite indicators.
where indicates the afforestation quality index; indicates the quality grade of the ; indicates the characteristic weight of the .
2.4.3. Confidence Level Analysis of Potential Afforestation Lands
To enhance the reliability of potential afforestation land identification, this study conducts a multi-source confidence assessment by integrating previous modeling results. Three external datasets are used for comparative validation: (1) a Random Forest–based global model of natural tree cover potential derived from protected areas and adapted for China [14]; (2) the potential afforestation land dataset released by the World Resources Institute [41]; and (3) a national-scale simulation based on an improved Dynamic Global Vegetation Model calibrated for China’s ecological conditions [37]. The results of this study are spatially overlaid with the three reference datasets. Areas that match three datasets are classified as high-confidence potential afforestation lands; those matching any two sources are labeled as medium-confidence areas; and those overlapping with only one are deemed low-confidence areas. Spatial units unique to this study are excluded from subsequent analyses. This classification approach provides a quantitative basis for evaluating the certainty of potential afforestation lands across different shelterbelt program zones and facilitates more robust and risk-informed spatial planning.
2.5. LULC Amend Based on High-Quality Potential Afforestation Lands
After the confidence screening in the previous section, the remaining high-quality potential afforestation lands were selected as target afforestation lands for planning, following the approach proposed by Cai et al. [42] and Xu et al. [37]. The obtained potential afforestation distribution was then randomly allocated across different spatial and temporal units in ten-year intervals from 2020 to 2070, based on an annual afforestation target of 0.47 × 10⁵ km2. The finalized sampled data were subsequently used to amend future land use data for the years 2030, 2050, and 2070.
2.6. Optimization of Ecosystem Service Land Patterns After Afforestation Amendments
2.6.1. Estimation of Soil Conservation and Carbon Sequestration
To quantify ecosystem service outcomes under future afforestation scenarios, this study uses the InVEST model to assess soil conservation and carbon sequestration from 2030 to 2070. For soil conservation, precipitation erodibility is estimated based on the empirical formula proposed by Zhang et al. (2003) [43]:
where (MJ·mm·hm−2·h−1) is the rainfall erosivity for year a, and is the annual precipitation (mm).
Soil erodibility factors are determined based on multiple variables such as soil texture, profile characteristics, organic carbon content, and permeability. The soil erodibility factor is initially calculated in imperial units and then converted to SI units (t·hm2·h·(hm2·MJ·mm)−1), following the RUSLE manual from the USDA [44]. The calculation formula is:
where = ()·(), is the organic carbon content (%), is the soil structure code (from 1 to 4), and is the permeability class code (from 1 to 6).
Carbon sequestration is estimated based on revised carbon pool data calibrated by Zhang et al. [45]. and integrated with the corrected land use data. The final outputs are expressed in t/ha and reflect aboveground biomass, belowground biomass, soil organic carbon, and dead organic matter.
Geographically weighted regression (GWR) was used to analyze spatial heterogeneity in the relationship between two ecosystem services, implemented with the “mgwr” package in Python. A positive local coefficient (β) indicates synergy, whereas a negative β indicates a trade-off; statistical significance is assessed at (|t| > 1.96) (two-sided, 5% level).
2.6.2. Investigation of Optimal Ecosystem Configuration
To identify the optimal configurations of ecosystem services, this study employs the Geodetector model to assess spatial heterogeneity and quantify the explanatory power of key driving factors. In each shelterbelt program zone, 10% of spatial units are randomly sampled. Soil conservation and carbon sequestration serve as dependent variables, while eleven biophysical and environmental variables are considered as independent variables. These include slope, distance to primary roads, plant available water capacity, DEM, top vegetation succession stage, vegetation resilience, climatic suitability, soil erodibility, precipitation, land use type, and root restricting layer depth [46].
Geodetector is a statistical method designed to detect spatial heterogeneity and identify the dominant driving factors of geographic phenomena [47]. In this study, the factor detector module is used to quantify the extent to which each factor contributes to the spatial variability in ecosystem services. In the formula, the statistic ranges from 0 to 1, with higher values indicating stronger explanatory power. Since the Geodetector requires categorical inputs, continuous variables are discretized before analysis. The factor with the highest value in each shelterbelt program zone is identified as the optimal driving factor. The value of the ecosystem service corresponding to the optimal category of that factor is treated as the optimal configuration.
2.6.3. Computation of Optimal Ecosystem Configuration Using Bayesian Analysis
Ecosystem optimization refers to the process of adjusting ecological spatial structures, configuring key ecological elements, and optimizing resource allocation to maximize ecosystem service functions, enhance structural stability, and improve overall system efficiency [48]. To optimize the spatial planning of soil conservation and carbon sequestration, this study employs a Bayesian Belief Network (BBN) to model the probabilistic relationships among driving factors and ecosystem service outcomes. In each shelterbelt program zone, spatial units are classified into three categories based on their service performance under potential afforestation amendments: (1) optimized areas, where the ecosystem service value has reached the maximum threshold; (2) pending optimization areas, which possess optimal factor configurations but whose service levels remain below the highest threshold; and (3) non-optimized areas, which are classified as non-optimized and excluded from priority consideration [49,50,51]. Pending optimization areas are regarded as priority zones for future enhancement of ecosystem services, as they exhibit favorable biophysical conditions but have not yet achieved their full ecological service potential. In the BBN framework, each variable (node) is associated with a set of discrete states and is connected by directed edges that represent conditional dependencies. To facilitate representation, all factors are categorized into five discrete states as shown in Table A2.
3. Results and Analysis
3.1. Evaluation of Key Factors Influencing Afforestation Potential in Program Zones
Using the Random Forest model, seven key factors influencing afforestation potential were analyzed across eight major shelterbelt program zones in China. The relative importance of these factors varied significantly by region. In general, zones with more concentrated distributions of high-potential afforestation lands exhibited higher importance scores for specific variables. Among all factors, root restricting layer depth consistently demonstrated substantial influence across multiple zones. Notably, in the Three-north shelterbelt program, climatic conditions emerged as the most important driver, with a relative weight of 0.21. Similarly, climatic conditions were the dominant factor in the shelterbelt program for middle reaches of Yellow River and the afforestation program for Taihang Mountain, with weights of 0.27 and 0.25, respectively. For the shelterbelt program for the Liaohe River and the shelterbelt program for the Huaihe River and Taihu Lake, the primary influencing factor is the root restricting layer depth, with relative weights of 0.40 and 0.50, respectively, substantially higher than those of other factors. In contrast, within the ecologically favorable shelterbelt program for the upper and middle reaches of the Yangtze River, the relative weights of the influencing factors are more evenly distributed, with no single factor exhibiting pronounced dominance. The relative weights for the remaining zones are presented in Figure 5. It is important to emphasize that these values represent relative—not absolute—weights. The findings underscore the spatial heterogeneity of driving forces and highlight the need for region-specific strategies in predicting and planning potential afforestation efforts.
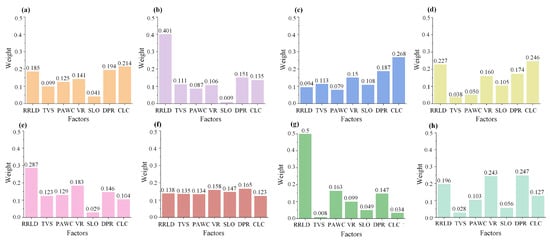
Figure 5.
Weighted values of influencing factors for potential afforestation in shelterbelt program areas. (a) Three-north shelterbelt program; (b) shelterbelt program for Liaohe River; (c) shelterbelt program for middle reaches of Yellow river; (d) afforestation program for Taihang Mountain; (e) coastal shelterbelt program; (f) shelterbelt program for upper and middle reaches of Yangtze river; (g) shelterbelt program for Huaihe River and Taihu Lake; (h) shelterbelt program for Pearl river.
3.2. Potential Afforestation Lands at Different Confidence Levels
The spatial distribution of potential afforestation lands at varying confidence levels was derived in accordance with the aforementioned methodology. The spatial distribution of potential afforestation lands with varying confidence levels varies across the eight shelterbelt program zones (Figure 6). In general, areas located closer to the eastern side of the Hu Line exhibit higher suitability for high-quality afforestation. The Hu Huanyong Line, proposed by Chinese geographer Hu Huanyong in 1935, is a diagonal line stretching from Heihe in Heilongjiang to Tengchong in Yunnan, highlighting China’s stark population distribution disparity—with dense populations to the southeast and sparse populations to the northwest [52]. High-confidence potential afforestation lands are primarily concentrated in the Shelterbelt program for the upper and middle reaches of the Yangtze River, with a total area of approximately 1.69 × 10⁵ km2. Medium-confidence areas are mainly distributed within the shelterbelt program for the Liaohe River and the shelterbelt program for the middle reaches of the Yellow River, covering around 0.07 × 10⁵ km2. Low-confidence areas are predominantly found in the afforestation program for Taihang Mountain and the Three-north shelterbelt program, amounting to approximately 0.57 × 10⁵ km2.
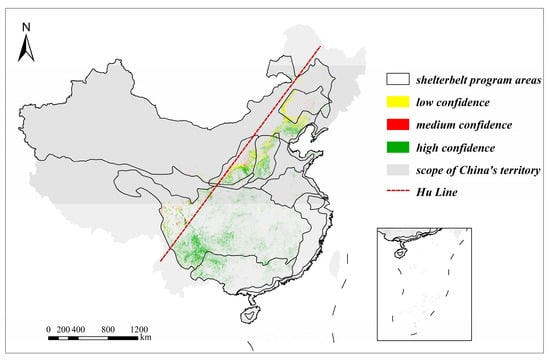
Figure 6.
Three types of confidence levels for potential afforestation lands.
High-quality potential afforestation lands identified in this study are primarily distributed along the Hu Line, forming a distinct belt-shaped spatial pattern (Figure 7a). The total area of these lands is approximately 2.33 × 10⁵ km2. Among the various shelterbelt program zones, the Shelterbelt Program for the upper and middle reaches of the Yangtze River has the largest planned afforestation area, primarily concentrated in Sichuan and Yunnan provinces. This zone alone accounts for 45.94% of the total high-quality potential area, amounting to 1.07 × 10⁵ km2. In contrast, the Shelterbelt Program for the Huaihe River and Taihu Lake encompasses the smallest afforestation area, covering only about 0.01 × 10⁵ km2, which represents just 0.55% of the total. These areas are mainly located in the flat terrains of northern Jiangsu and southern Shandong provinces.
A comprehensive comparative analysis was performed with the results reported in the previous literature (Figure 7b–d and Table A3). The overall distribution pattern aligns closely with earlier findings, with most potential afforestation lands clustered around the Hu Line. However, the total area identified in this study is smaller, as it focuses exclusively on high-quality potential afforestation lands. Planned potential afforestation lands were randomly allocated across the period from 2020 to 2070, with the afforestation distribution pattern for each decade illustrated in Figure A2.

Figure 7.
Comparison of potential afforestation land results with previous studies: (a) this study, (b) Xu et al. [37], (c) Xu [14], and (d) Zhang et al. [27].
3.3. Analysis of Land Use Changes Before and After Potential Afforestation Amendments (2030–2070)
Figure 8 illustrates land use changes between 2030 and 2070, comparing scenarios before and after potential afforestation amendments in three representative zones. These zones are situated near the Hu Line, where land cover transitions are most pronounced. Zone (a) lies at the intersection of the Three-north shelterbelt program, the afforestation program for Taihang mountain, and the shelterbelt program for the middle reaches of the Yellow River. Zone (b) spans the boundaries of the Three-north shelterbelt program, the shelterbelt program for the middle reaches of the Yellow River, and the shelterbelt program for the upper and middle reaches of the Yangtze River. Zone (c) connects the Shelterbelt program for the upper and middle reaches of the Yangtze River with the shelterbelt program for the Pearl River. From zone (a) to zone (c), DEM gradually increases, and climatic conditions shift from semi-arid to humid.
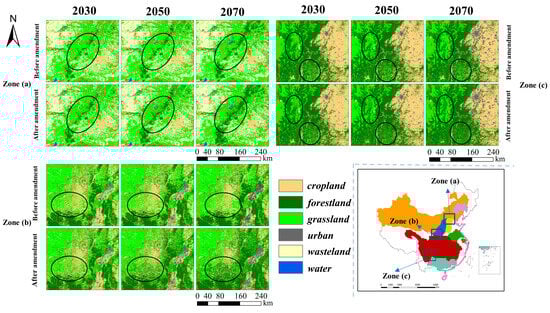
Figure 8.
Comparison of land use in 2030–2070 before and after potential afforestation amendments. Zone (a), Zone (b), and Zone (c) show the before-and-after observation area for potential afforestation amendments to land use data.
Between 2030 and 2070, notable differences in land use are observed before and after the afforestation amendments. In zone (a), the pre-amendment land use was characterized by fragmented forest patches and significant urban expansion. Following the amendments, forest connectivity improved markedly, transitioning from a patchy to a more continuous banded spatial structure, while both cropland and urban land decreased in extent. In zone (b), the initial land use scenario exhibited intensified urban and agricultural expansion, with scattered grasslands and signs of forest degradation. After the amendments, forests expanded into areas formerly occupied by grasslands and marginal farmlands, thereby reversing degradation trends and reducing anthropogenic pressure. In zone (c), grasslands dominated the landscape prior to the amendments, and forest cover showed a declining trend. Post-amendment, large portions of grassland were converted into forest, resulting in more extensive and contiguous forest patches, which reduced landscape fragmentation and enhanced ecological stability. The nationwide comparison of land use before and after afforestation amendments is shown in Figure A3.
3.4. Ecosystem Service Optimization Across Shelterbelt Program Zones
Based on the revised land use data, this study evaluates the impacts of potential afforestation amendments on two key ecosystem services: soil conservation and carbon sequestration. Over time, both services exhibit notable improvements across most shelterbelt program zones.
For soil conservation, the most significant increases are concentrated in the afforestation program for Taihang mountain and in the Loess Plateau and its surrounding areas (e.g., Shaanxi, Gansu, and Ningxia). By 2070, the area classified as high-value for soil conservation had increased by 47.56%, compared to the total area before the potential afforestation amendments. In coastal and low-DEM zones, the proportion of land with high to highest soil conservation value also expanded. In contrast, areas showing slower improvements—such as the Huaihe–Taihu basin (0.28%) and the Liaohe River zone (0.01%)—tend to correspond with densely populated or heavily urbanized regions. Overall, the most rapid improvements in soil conservation are observed near the Hu Line, which marks a pronounced transition in population density and land use intensity across China (Table 2). The difference between the ba and aa values across all regions and years is statistically significant (t = −2.21, p = 0.0374), indicating that although the individual differences are small, the adjusted values are generally slightly higher overall, with consistent direction and low variability.
Table 2.
Comparison of soil conservation before and after potential afforestation amendments *.
For carbon sequestration, the spatial growth patterns generally align with those observed for soil conservation, with the most rapid gains occurring along the Hu Line. The most notable improvement is observed in the afforestation program for Taihang Mountain, which exhibits a 10.15% increase. In contrast, the Shelterbelt Program for Huaihe River and Taihu Lake shows the smallest improvement, with only a 0.05% increase. This region is characterized by high population density and a high degree of urbanization, resulting in limited space available for afforestation. A substantial portion of the land is occupied by built-up areas or intensive agricultural use, which constrains the potential expansion of forested land. As afforestation planning progresses, carbon storage levels shift from medium and low values to higher levels, particularly in Central and Southern China, where forest cover increases substantially. Over time, high-value zones for carbon sequestration expand steadily, evolving from isolated patches into continuous belts. The lower and middle reaches of the Yangtze River form a distinct carbon storage corridor, while previously low-value regions gradually transition into high to highest-value clusters (Table 3). The difference between the ba and aa values across all regions and years is statistically significant (t = −4.13, p = 0.00041), indicating that although the individual differences are small, the adjusted values are generally slightly higher overall, with consistent direction and low variability.
Table 3.
Comparison of carbon sequestration before and after potential afforestation amendments *.
For 2030–2070, the trade-offs and synergies between the two ecosystem services are shown in Figure A4. In some regions, the minimal increases in ecosystem service enhancement rates are primarily due to high levels of urbanization and a large share of built-up land constraining space available for afforestation, while farmland protection and ecological redlines raise the threshold for land conversion. At the same time, edaphic and topographic conditions (e.g., shallow soils, hardpans, high groundwater or salinization, and erosion-prone slopes) limit plant establishment and growth. In addition, high baseline levels or landscape fragmentation reduce marginal gains. Consequently, this region relies more on small-scale, embedded interventions—such as urban green spaces and farmland shelterbelt/agroforestry networks—so large, contiguous improvements are unlikely in the near term; the observed low increases reflect structural constraints rather than failure of the measures.
3.5. Analysis of Optimal Ecosystem Service Configurations Across Afforestation Zones
The results of the Geodetector analysis reveal that the contribution of individual driving factors to the spatial heterogeneity of ecosystem service supply varies across shelterbelt program zones and over time. For soil conservation, the dominant influencing factors shift within each zone throughout the 2030–2070 period. In the Three-north shelterbelt program, the primary drivers transition from slope and land use type in 2030, to slope and precipitation in 2050, and eventually to slope and root restricting layer depth by 2070. In the Shelterbelt program for the Liaohe river, the dominant drivers remain stable, with root restricting layer depth and precipitation identified as key factors. The optimal configuration (RRLD = 2) results in a 1.6% increase in service supply, whereas (PRE = 2) leads to a 12.2% decrease. In the Shelterbelt program for the middle reaches of the Yellow River, the dominant factors change from root restricting depth and precipitation in 2030, to root restricting layer depth and DEM in 2050, and finally to root restricting layer depth and top vegetation succession stage by 2070. Similar spatiotemporal dynamics are observed across other shelterbelt program zones (Figure 9). Across most zones, the q value associated with forest land in the LULC classification steadily increases from 2030 to 2070, indicating that land use type, particularly afforested land, plays an increasingly important role in soil conservation and carbon sequestration delivery.
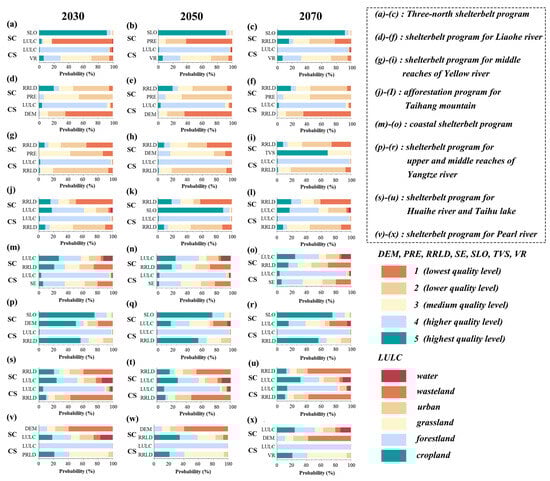
Figure 9.
Optimal allocation of ecosystem services and their probability distribution for each shelterbelt program area (2030–2070).
For carbon sequestration, the optimal configurations remain temporally stable in certain afforestation zones. For example, in the Three-north shelterbelt program, the dominant factors consistently include LULC (LULC = forestland) and vegetation resilience (VR = 3). Their associated Bayesian posterior probabilities increase by 2.2% and decrease by 1.6%, respectively. In the shelterbelt program for the Liaohe River, the optimal configuration comprises forest land and low DEM (DEM = 1), with corresponding increases of 2.4% and 0.3%. Results for the other zones are similarly presented in Figure 9. Within these planning efforts, the dominant ecological driving factors and their optimal threshold values vary across both spatial and temporal dimensions. Identifying these patterns is essential for maximizing the ecological benefits of potential afforestation amendments.
3.6. Spatial Optimization of Ecosystem Services in Shelterbelt Program Zones
For soil conservation, the proportion of optimized areas varies considerably among the shelterbelt program zones. The Shelterbelt program for the middle reaches of the Yellow River and the shelterbelt program for the Huaihe River and Taihu Lake exhibit the lowest shares of optimized areas, at 1.1% and 0.1%, respectively. In contrast, the afforestation program for Taihang Mountain shows the highest optimization ratio, reaching 99.2%. Spatially, the optimized areas are largely consistent with the planned afforestation zones identified in this study. Additionally, regions characterized by relatively intact ecological conditions—such as the eastern portion of the Three-north shelterbelt program, the northern section of the shelterbelt program for upper and middle reaches of Yangtze River, and the southeastern part of the shelterbelt program for the Pearl River—are also classified as optimized zones for soil conservation (Figure 10).
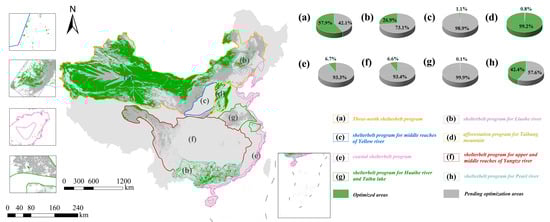
Figure 10.
Combined optimized and pending optimization areas for soil conservation in each shelterbelt program zone, along with their respective proportions.
For carbon sequestration, the highest proportions of optimized areas are found in the southeastern part of the shelterbelt program for Pearl River, the shelterbelt program for upper and middle reaches of Yangtze River, and the afforestation program for Taihang mountain, with values of 70.1%, 69.4%, and 52.1%, respectively. In contrast, the Three-north shelterbelt program and the shelterbelt program for Huaihe river and Taihu lake exhibit the highest proportions of pending optimization areas, accounting for 83.6% and 95.1%, respectively. Spatially, optimized areas for carbon sequestration tend to cluster in warmer, lower-DEM regions with limited human disturbance—areas that also generally exhibit favorable conditions for vegetation growth (Figure 11).

Figure 11.
Combined optimized and pending optimization areas for carbon sequestration in each shelterbelt program zone, along with their respective proportions.
Across soil conservation and carbon sequestration, pending optimization areas are designated as priority zones for future enhancement, as they combine favorable ecological conditions with unrealized service potential. These areas, often located adjacent to existing optimized zones, represent critical targets for the next phase of afforestation and ecological restoration planning. From the perspective of landscape ecology, these pending optimization areas can be regarded as potential “source” zones within source–sink dynamics, capable of spreading and transferring ecological benefits to surrounding areas through ecological processes. Therefore, prioritizing interventions in these areas not only enhances their own service functions but also strengthens the overall ecosystem service capacity of the surrounding landscape through spatial spillover effects.
4. Discussion
4.1. Regional Differences in Key Factors Influencing Afforestation Potential
The regional identification and strategic planning of potential afforestation lands are crucial for achieving high-quality ecological restoration and sustainable production. Given China’s vast territory and diverse natural and socio-economic conditions, a uniform standard cannot address regional ecological vulnerabilities or productivity challenges [53]. Spatial heterogeneity in natural conditions strongly affects the suitability and sustainability of afforestation. In arid and semi-arid northern regions (e.g., the Three-North Shelterbelt Program), afforestation is highly sensitive to climate and subsurface constraints [54]. In contrast, in humid southern regions, monoculture plantations pose ecological risks, highlighting the need for diversified and resilient strategies.
Previous empirical studies have revealed similar challenges. For instance, in the hilly lands of the Huang-Huai-Hai region, Sun et al. [55] found that water availability and terrain conditions significantly constrained the feasibility of stable afforestation. Using Linyi City as a case study, Ren et al. [56] simulated cropland-to-forest conversion policies and emphasized the need for integrated modeling to assess overlapping benefits and conflicts among ecosystem services. Many large-scale afforestation projects still neglect regional heterogeneity, creating trade-offs between ecosystem services. Bayer et al. [57], employing dynamic vegetation and land-use optimization models, identified substantial spatial trade-offs between global food production, carbon storage, and freshwater availability, suggesting that achieving multi-objective synergies requires regionally differentiated land-use strategies. Furthermore, a recent study published in Nature Communications reviewed 89 global reforestation opportunity maps and found that, after accounting for conservation areas, social conflicts, and ecosystem service goals, the realistically available area for reforestation was only 6 to 195 million hectares—far lower than earlier estimates [58]. These findings highlight the necessity of incorporating high-resolution data and multi-objective constraints into global-scale reforestation planning.
Earlier site selection studies often ignored regional driving mechanisms and relied on generalized spatial frameworks, leading to suboptimal or ecologically risky land-use decisions [59]. To address these limitations, this study adopts a regionally disaggregated modeling approach by constructing separate Random Forest models for each shelterbelt zone. This enables the identification of zone-specific dominant drivers and the calculation of localized factor weights [60]. By applying adaptive classification thresholds based on regional characteristics, the study avoids the “one-size-fits-all” paradigm, thereby supporting the rational allocation of ecological resources and minimizing intervention risks—key principles for cleaner landscape restoration and sustainable land-use management.
This zonal modeling framework aligns with international principles of landscape-scale forest restoration (e.g., World Resources Institute) and supports spatial decisions consistent with green development strategies. It also reflects policy orientations embedded in national strategies, such as the National Ecological Civilization Pilot Zone Plan and the New Round of Conversion of Cropland to Forest and Grassland (2020–2035), both of which emphasize region-specific approaches grounded in ecological fragility, environmental carrying capacity, and socio-economic context. In connection with the Hu Line, the findings highlight that potential afforestation lands are predominantly concentrated east of the line, where favorable hydrothermal conditions and land carrying capacity prevail. Such regionally prioritized afforestation areas offer direct application value for spatial targeting, implementation sequencing, and ecological performance assessment in large-scale ecological restoration programs [61].
4.2. Mechanisms Through Which Afforestation Amendments Influence Ecosystem Services
Afforestation not only alters land cover patterns but also enhances key ecosystem services, contributing to more sustainable land-use systems. Under the SSP245 scenario (2030–2070), this study systematically evaluates the contributions of potential afforestation to soil conservation and carbon sequestration. Soil conservation benefits are primarily driven by increased vegetation cover, improved surface roughness, and optimized soil structure, though these effects vary across regions [62]. For example, in the Three-North Shelterbelt Program zone, mixed stands of drought-resistant trees and shrubs help control wind erosion and combat desertification, whereas in the Yangtze River Basin, evergreen broad-leaved forests improve slope stability and water retention.
Afforestation also strengthens carbon sequestration through biomass accumulation, increases in soil organic carbon, and microclimate regulation, underscoring its role as a nature-based climate solution essential for achieving carbon neutrality and optimizing ecological functions.
To illustrate, this study evaluates the shelterbelt program for middle reaches of Yellow River, where the impact of afforestation amendments is particularly pronounced. The land use changes before and after afforestation amendments in the shelterbelt program for the middle reaches of the Yellow River are shown in Table 4. By 2070, the forested area increased by 0.22 × 10⁵ km2 compared to the baseline, and the proportion of total land classified as forest rose from 24.17% to 33.84%, indicating a substantial effect of afforestation planning. Although the dominant drivers of soil conservation and carbon sequestration remained stable in this zone, the strength of their influence shifted. Specifically, the q value of top vegetation succession increased by 0.001 for soil conservation and by 0.03 for carbon sequestration, while the influence of root restricting layer depth declined slightly. Following potential afforestation amendments, the supply of ecosystem services becomes less constrained by static soil properties and more responsive to vegetation dynamics. In other words, afforestation reduces reliance on pre-existing biophysical limitations and shifts service delivery mechanisms toward biologically driven processes such as succession and community resilience [63].
Table 4.
Comparison of LULC data after potential afforestation planning (km2).
4.3. Regional Afforestation Policy Analysis Considering Afforestation Impacts and Ecosystem Service Optimization
By 2070, high-to-highest value areas increased by 0.66% for soil conservation and 6.80% for carbon sequestration. Vegetation resilience and succession stages shifted toward higher-value zones, indicating improved ecosystem stability and recovery capacity. Degraded slopes and barren lands showed positive feedbacks, but environmental constraints such as erosion risk and shallow root zones still limit optimization. Pending optimization areas for soil conservation are concentrated in the south, while those for carbon sequestration are in the central region, making them priority targets for differentiated restoration strategies—deep-rooted native species in the south and fast-growing, high-efficiency carbon sink species in the center.
Afforestation policy in the middle reaches of the Yellow River should therefore focus on these areas, integrating soil stability and carbon storage objectives and aligning with basin-wide ecological protection policies [64]. The high-potential carbon sink zones identified here are consistent with the Implementation Plan for Consolidating and Enhancing National Ecosystem Carbon Sink Capacity (2023), which aims to increase terrestrial ecosystem sinks by ~100 Mt CO2-eq annually through optimizing tree species, improving forest quality, and enhancing grassland and wetland functions. An ecosystem service–based performance assessment system is also recommended, supporting the UN Sustainable Development Goal 15.3 on Land Degradation Neutrality by 2030 and the “Three Zones and Four Belts” spatial framework outlined in the Master Plan for Major Projects of National Key Ecosystem Protection and Restoration (2021–2035) [65]. Restoration in the Yellow River middle reaches should particularly strengthen slope stability and rehabilitate degraded land.
Although the regional shelterbelt program has achieved progress, challenges remain in spatial heterogeneity, resource allocation, and ecological trade-offs [66]. Thus, policy should shift from a “uniform” to a “regionally differentiated” approach, with clear functional objectives, enforceable restoration standards, and alignment with basin-wide strategies [67]. Incentive mechanisms should also be diversified: carbon accounting and market-based trading can compensate high carbon sink areas, while integrated monitoring–assessment–feedback systems using remote sensing, field surveys, and modeling should link performance to fiscal transfers and carbon credit allocation [68,69,70]. Finally, establishing an ecological benefit-sharing mechanism would ensure equitable distribution between beneficiaries and land managers, promoting a transition from “project-driven” to “institution-driven” governance and enhancing the long-term stability of afforestation policy in the Yellow River Basin.
For afforestation, the southern subregion should prioritize soil conservation: select deep-rooted native tree species mixed with soil-binding shrubs and grasses [15,16,17]. On slopes > 15°, contour strip planting with shrub–grass buffer belts is recommended, maintaining canopy closure between 0.6 and 0.7 and retaining litter. Bioengineering measures and small-scale structures, such as contour trenches and check dams, should also be applied [66]. In the central subregion, the priority is carbon sequestration: employ fast-growing conifer–broadleaf mixtures or a dual structure of short-rotation carbon forests paired with long-rotation conservation stands, optimizing stand density and rotation length to balance early rapid carbon gains with later structural stability [58]; in areas with shallow rooting depth, preferentially select drought-tolerant, stress-resistant species and apply deep planting or soil amelioration. Across subregions, establish multilayer riparian buffer zones ≥ 30–50 m wide to enhance establishment success and survival.
4.4. Limitations and Future Prospects
Despite methodological advancements and expanded application scope, this study still has several limitations. The current use of the InVEST model is based on static carbon density values across different land cover types and does not capture the dynamic carbon accumulation resulting from post-afforestation tree growth. This may lead to an underestimation of long-term carbon sequestration potential. Future research could incorporate dynamic vegetation models, empirical biomass measurements, or tree species suitability to improve assessment accuracy. Tree line data were included to constrain potential afforestation areas. However, the results show that tree lines are primarily distributed along the Tibetan Plateau and parts of Xinjiang, which is consistent with the findings of Xu et al. [14]. In contrast, the afforestation areas identified in this study are mainly located in eastern China, far from the tree line regions. Moreover, the selected climate scenario, SSP245, represents a relatively moderate pathway, which is unlikely to cause substantial shifts in tree line position. Therefore, tree line data have minimal impact on the distribution of afforestation areas in our study.
In terms of ecological trade-offs, due to the difficulty in quantifying and obtaining relevant data, this study does not fully account for potential risks such as water resource consumption, biodiversity loss, and species invasions [71,72]. Future work could couple afforestation scenarios with hydrological or biological models for integrated analysis. Moreover, in the Geodetector analysis, the method of variable discretization significantly influences q-values and spatial explanatory power. This study employed the Natural Breaks method, which maximizes inter-class variance and minimizes intra-class variance, thereby better reflecting the natural spatial clustering of variables and improving model stability and interpretability. Nevertheless, q-values may vary under different classification schemes; future studies should perform sensitivity tests or compare multiple discretization methods to validate robustness [73].
In addition, this study does not fully address the trade-offs between potential afforestation and competing land uses such as agriculture, grazing, or urban expansion. As the focus is on identifying high-quality afforestation areas and evaluating their ecosystem services, policy implementation is left to local authorities. Thus, land use competition was not quantitatively analyzed [74]. This study projects potential afforestation areas through 2070 based on the SSP245 scenario. Inevitably, there are uncertainties associated with long-term projections, particularly regarding future climate change, policy shifts, and socio-economic developments. Due to data limitations and uncertain policy trajectories, systematic sensitivity analyses were not conducted.
This study selected the SSP245 scenario as it represents a relatively realistic and moderate pathway of socioeconomic development and emissions, aligning well with current policy targets and offering strong data compatibility. Moreover, under future climate change scenarios, extreme events—such as heatwaves, droughts, and floods—are expected to become more frequent and severe. However, this moderate climate pathway does not simulate the effects of extreme events—such as heatwaves, droughts, or floods—on afforestation survival or ecosystem service performance. Incorporating high-emission scenarios such as SSP585 in future research would facilitate more comprehensive and robust assessments. Additionally, the introduction of resilience-based indicators would be valuable for evaluating the long-term stability of potential afforestation lands under dynamic and uncertain environmental conditions [75].
5. Conclusions
This study systematically identifies and evaluates potential afforestation lands across eight major shelterbelt program zones in China. By incorporating spatiotemporal and regional differentiation, it revises future land use projections and optimizes the spatial configuration of two key ecosystem services—soil conservation and carbon sequestration—over the period from 2030 to 2070. The main conclusions are as follows:
(1) The influence of afforestation drivers varies significantly across regions. High-quality potential afforestation lands are primarily concentrated near the Hu Line, with a total area of approximately 2.33 × 10⁵ km2. The shelterbelt program for upper and middle reaches of Yangtze River accounts for the largest proportion (45.94%).
(2) Based on an annual afforestation target of 0.47 × 10⁵ km2, revised land use projections indicate significant increases in forest cover. By 2070, the afforestation program for Taihang Mountain shows the most substantial service improvements, with increases of 47.56% in soil conservation and 10.15% in carbon sequestration.
(3) Optimal configurations of ecosystem services vary by both zone and by time. For soil conservation, the Taihang Mountains reach the highest optimization ratio (99.2%), while for carbon sequestration, the Pearl River shelterbelt program performs best (70.1%). Identifying both optimized and pending optimization areas enables more effective prioritization for targeted ecological enhancement.
This study identifies high-quality afforestation areas and service optimization pathways, providing a scientific basis for region-specific restoration strategies. The results support major ecological policies and contribute to carbon neutrality and land degradation control goals.
Author Contributions
Methodology, L.Z. and Z.Z.; Validation, L.Z., X.Z. (Xinyuan Zhang) and Z.Z.; Investigation, X.Z. (Xiaoyuan Zhang) and H.H.; Writing—original draft, L.Z. and X.Z. (Xinyuan Zhang); Writing—review and editing, X.Z. (Xiaoyuan Zhang) and Z.W.; Supervision, Z.W.; Project administration, Z.W.; Funding acquisition, Z.W. All authors have read and agreed to the published version of the manuscript.
Funding
This study was supported by the National Natural Science Foundation of China (Grant No. 42201518, No. 42401357), the Fundamental Research Funds for the Central Universities (2025XJ10), Young Elite Scientists Sponsorship Program by BAST (No. BYESS2023005), and the Key Program of National Natural Science Foundation of China (No. 42330507).
Data Availability Statement
Data are contained within the article. The data presented in this study can be requested from the authors.
Conflicts of Interest
The authors declare no conflicts of interest.
Appendix A
Figure A1 illustrates the data preprocessing workflow. All datasets were projected to the WGS_1984_Lambert_Conformal_Conic coordinate system and resampled to a spatial resolution of 1 km. The preprocessing was conducted using ArcGIS 10.8.

Figure A1.
Data preprocessing workflow.
Figure A2 shows the spatial distribution of high-quality afforestation lands selected for afforestation planning during each decade from 2020 to 2070 in this study. It illustrates how the identified potential afforestation lands were evenly allocated across different spatial and temporal units, beginning in 2020 and ending in 2070. For better visualization, the study employed the “Raster to Point” tool in ArcGIS 10.8 to convert raster data into vector points. The potential afforestation lands are primarily distributed east of the Hu Line, with the Shelterbelt program for upper and middle reaches of Yangtze River containing the largest proportion of afforestation areas.

Figure A2.
Afforestation distribution planned for the period from 2020 to 2070.
Figure A3 presents a comparison of land use and land cover (LULC) before and after potential afforestation amendments. It illustrates the impact of afforestation amendments on various land use types from 2030 to 2070. The results show an increase in forest area and a decrease in cropland area, primarily in regions east of the Hu Line.

Figure A3.
LULC data used in this study before and after amendments. (a–c) LULC data for 2030, 2050, and 2070 before amendments. (d–f) LULC data for 2030, 2050, and 2070 after amendments.
Figure A4 shows the trade-offs and synergies between carbon supply and soil conservation services after accounting for potential afforestation. From 2030 to 2070, trade-off areas expand in the regions of the Shelterbelt Program for the Liaohe River and the Three-North Shelterbelt Program, whereas they contract in the region of the Shelterbelt Program for the Upper and Middle Reaches of the Yangtze River.

Figure A4.
Trade-offs and synergies between the two ecosystem services (after amendments) and their spatial distribution. Panels (a–c) show the geographic patterns for 2030, 2050, and 2070, respectively.
Table A1 presents the prediction accuracies of the seven weighting factors calculated for each afforestation program zone using the Random Forest model. The code uses Random Forest Classifier, which comes from the ensemble module in the scikit-learn (sklearn) library. The definition of accuracy is the ratio of the number of correctly predicted weights to the total number of samples in the test set. Among the regions, the shelterbelt program for Pearl river achieved the highest accuracy at 0.967, while the shelterbelt program for middle reaches of Yellow river had the lowest accuracy at 0.567. The overall average accuracy was 0.727.
Table A1.
The accuracy of identifying the relative weights of the seven influencing factors for each shelterbelt program zone using the Random Forest model.
Table A1.
The accuracy of identifying the relative weights of the seven influencing factors for each shelterbelt program zone using the Random Forest model.
| Name | Accuracy |
|---|---|
| Three-north shelterbelt program | 0.588 |
| Shelterbelt program for Liaohe River | 0.726 |
| Shelterbelt program for middle reaches of Yellow River | 0.567 |
| Afforestation program for Taihang mountain | 0.582 |
| Coastal shelterbelt program | 0.704 |
| Shelterbelt program for upper and middle reaches of Yangtze River | 0.779 |
| Shelterbelt program for Huaihe River and Taihu Lake | 0.900 |
| Shelterbelt program for Pearl River | 0.967 |
Table A2 shows that all factors are categorized into five discrete states to facilitate representation. While the units for some variables were previously defined, DEM is expressed in meters (m) and PRE in millimeters (mm) for the remaining variables.
Table A2.
Bayesian classification.
Table A2.
Bayesian classification.
| Variable | Statuses | Variable Scope |
|---|---|---|
| Soil conservation 30/50/70 (SC) | Lowest | <0 |
| Low | 0~100 | |
| Medium | 100~300 | |
| High | 300~1200 | |
| Highest | >1200 | |
| Carbon sequestration 30/50/70 (CS) | Lowest | <3000 |
| Low | 3000~5000 | |
| Medium | 5000~9700 | |
| High | 9700~12,000 | |
| Highest | >12,000 | |
| Root restricting layer depth (RRLD) | Lowest | >200 |
| Low | 130~200 | |
| Medium | 70~130 | |
| High | 70~30 | |
| Highest | <30 | |
| Slope (SLO) | Lowest | >45° |
| Low | 35°~45° | |
| Medium | 30°~35° | |
| High | 25°~30° | |
| Highest | 0°~25° | |
| Digital elevation model (DEM) | Lowest | <500 |
| Low | 500~1000 | |
| Medium | 1000~1500 | |
| High | 1500~3500 | |
| Highest | >3500 | |
| Precipitation 30/50/70 (PRE) | Lowest | <250 |
| Low | 250~450 | |
| Medium | 450~900 | |
| High | 900~1400 | |
| Highest | >1400 | |
| Climatic conditions (CLC) | Lowest | Based on the classification scheme (Section 2.4.1) |
| Low | ||
| Medium | ||
| High | ||
| Highest | ||
| Distance to primary road (DPR) | Lowest | >10 |
| Low | 5~10 | |
| Medium | 2~5 | |
| High | 1~2 | |
| Highest | 0~1 | |
| Soil erodibility (SE) | Lowest | <0.0095 |
| Low | 0.0095~0.0120 | |
| Medium | 0.0120~0.0135 | |
| High | 0.0135~0.0155 | |
| Highest | >0.0360 | |
| Top vegetation succession (TVS) | Lowest | Based on the classification scheme (Section 2.4.1) |
| Low | ||
| Medium | ||
| High | ||
| Highest | ||
| Vegetation resilience (VR) | Lowest | Based on the classification scheme (Section 2.4.1) |
| Low | ||
| Medium | ||
| High | ||
| Highest | ||
| Plant available water capacity (PAWC) | Lowest | 0.12~0.25 |
| Low | 0.25~0.45 | |
| Medium | 0.45~0.60 | |
| High | 0.60~0.80 | |
| Highest | 0.80~1.00 | |
| LULC 30/50/70 (LULC) | Cropland | - |
| Forestland | - | |
| Grassland | - | |
| Urban | - | |
| Wasteland | - | |
| Water | - |
Note: “-” indicates no actual value.
Table A3 presents a comparison between the results of this study and those of other scholars. The afforestation area in this study is smaller because it focuses on high-quality afforestation lands.
Table A3.
Comparison of potential afforestation land area with previous studies (km2).
Table A3.
Comparison of potential afforestation land area with previous studies (km2).
| Studies | Xu et al. (2024) [37] | Xu (2023) [14] | Zhang et al. (2024) [17] | This Study |
|---|---|---|---|---|
| Area | 3.28 × 10⁵ | 4.60 × 10⁵ | 4.64 × 10⁵ | 2.33 × 10⁵ |
References
- Doelman, J.C.; Stehfest, E.; van Vuuren, D.P.; Tabeau, A.; Hof, A.F.; Braakhekke, M.C.; Gernaat, D.; van den Berg, M.; van Zeist, W.J.; Daioglou, V.; et al. Afforestation for climate change mitigation: Potentials, risks and trade-offs. Glob. Change Biol. 2020, 26, 1576–1591. [Google Scholar] [CrossRef]
- Kong, X.; Zhang, X.; Xu, C.; Hauer, R.J. Review on Urban Forests and Trees as Nature-Based Solutions over 5 Years. Forests 2021, 12, 1453. [Google Scholar] [CrossRef]
- Guo, M.; Cong, X.; Zheng, H.; Zhang, M.-J.; Wang, L.-J.; Gong, J.-W.; Ma, S. Integrating the ordered weighted averaging method to establish an ecological security pattern for the Jianghuai ecological economic zone in China: Synergistic intraregional development. Ecol. Indic. 2022, 135, 108543. [Google Scholar] [CrossRef]
- Mirzabaev, A.; Wuepper, D. Economics of Ecosystem Restoration. Annu. Rev. Resour. Econ. 2023, 15, 329–350. [Google Scholar] [CrossRef]
- Orth, J. The Shelterbelt Project: Cooperative Conservation in 1930s America. Agric. Hist. 2007, 81, 333–357. [Google Scholar] [CrossRef]
- Davis, D.K.; Robbins, P. Ecologies of the colonial present: Pathological forestry from the taux de boisement to civilized plantations. Environ. Plan. E Nat. Space 2018, 1, 447–469. [Google Scholar] [CrossRef]
- Turner, M.D.; Davis, D.K.; Yeh, E.T.; Hiernaux, P.; Loizeaux, E.R.; Fornof, E.M.; Rice, A.M.; Suiter, A.K. Great Green Walls: Hype, Myth, and Science. Annu. Rev. Environ. Resour. 2023, 48, 263–287. [Google Scholar] [CrossRef]
- Stein, S. Coping with the ‘World’s Biggest Dust Bowl’. Towards a History of China’s Forest Shelterbelts, 1950s-Present. Glob. Environ. 2015, 8, 320–348. [Google Scholar] [CrossRef]
- Benjaminsen, T.A.; Hiernaux, P. From Desiccation to Global Climate Change: A History of the Desertification Narrative in the West African Sahel, 1900–2018. Glob. Environ. 2019, 12, 206–236. [Google Scholar] [CrossRef]
- Bagstad, K.J.; Johnson, G.W.; Voigt, B.; Villa, F. Spatial dynamics of ecosystem service flows: A comprehensive approach to quantifying actual services. Ecosyst. Serv. 2013, 4, 117–125. [Google Scholar] [CrossRef]
- Zhang, X.; Xu, D.; Wang, Z. Optimizing spatial layout of afforestation to realize the maximum benefit of water resources in arid regions: A case study of Alxa, China. J. Clean. Prod. 2021, 320, 128827. [Google Scholar] [CrossRef]
- Ministerial Conference on the Protection of Forests in Europe. Pan-European Guidelines for Afforestation and Reforestation with a Special Focus on the Provisions of the UNFCCC; MCPFE: Malahide, Ireland, 2008. [Google Scholar]
- Dushku, A.; Brown, S. Spatial modeling of baselines for LULUCF carbon projects: The GEOMOD modeling approach. In Proceedings of the 2003 International Conference on Topical Forests and Climate Change, Manila, Philippines, 21–22 October 2003. [Google Scholar]
- Xu, J. Estimation of the spatial distribution of potential forestation land and its climatic potential productivity in China. Acta Geogr. Sin. 2023, 78, 677–693. [Google Scholar] [CrossRef]
- He, Y.; Ma, J.; Chen, G. Potential geographical distribution and its multi-factor analysis of Pinus massoniana in China based on the maxent model. Ecol. Indic. 2023, 154, 110790. [Google Scholar] [CrossRef]
- Bastin, J.F.; Finegold, Y.; Garcia, C.; Mollicone, D.; Rezende, M.; Routh, D.; Zohner, C.M.; Crowther, T.W. The global tree restoration potential. Science 2019, 365, 76–79. [Google Scholar] [CrossRef]
- Zhang, Z.; Wang, Z.; Zhang, X.; Yang, S. Estimation of Spatial–Temporal Dynamic Evolution of Potential Afforestation Land and Its Carbon Sequestration Capacity in China. Remote Sens. 2024, 16, 3098. [Google Scholar] [CrossRef]
- Assesment, M.E. Ecosystems and human well-being: Synthesis. Phys. Teach. 2005, 34, 534. [Google Scholar]
- Gupta, S.K.; Kanga, S.; Meraj, G.; Singh, S.K.; Singh, S.; Sajan, B.; Kumar, P.; Rana, R.S.; Kumar, S.; Mishra, V.N. Optimizing land use for climate mitigation using nature based solution (NBS) strategy: A study on afforestation potential and carbon sequestration in Rajasthan, India. Discov. Geosci. 2024, 2, 36. [Google Scholar] [CrossRef]
- Zhang, J.; Wang, M.; Liu, K.; Chen, S.; Zhao, Z. Social-ecological system sustainability in China from the perspective of supply-demand balance for ecosystem services. J. Clean. Prod. 2025, 497, 145039. [Google Scholar] [CrossRef]
- Pérez-Silos, I.; Álvarez-Martínez, J.M.; Barquín, J. Large-scale afforestation for ecosystem service provisioning: Learning from the past to improve the future. Landsc. Ecol. 2021, 36, 3329–3343. [Google Scholar] [CrossRef]
- Li, R.; Li, R.; Zheng, H.; Yang, Y.; Ouyang, Z. Quantifying Ecosystem Service Trade-Offs to Inform Spatial Identification of Forest Restoration. Forests 2020, 11, 563. [Google Scholar] [CrossRef]
- Chuai, X.; Xia, M.; Xiang, A.; Miao, L.; Zhao, R.; Zuo, T. Vegetation coverage and carbon sequestration changes in China’s forest projects area. Glob. Ecol. Conserv. 2022, 38, e02257. [Google Scholar] [CrossRef]
- Gai, Y.; Sun, L.; Fu, S.; Zhu, C.; Zhu, C.; Li, R.; Liu, Z.; Wang, B.; Wang, C.; Yang, N.; et al. Impact of greening trends on biogenic volatile organic compound emissions in China from 1985 to 2022: Contributions of afforestation projects. Sci. Total Environ. 2024, 929, 172551. [Google Scholar] [CrossRef]
- Zhang, X.; Liu, L.; Chen, X.; Gao, Y.; Xie, S.; Mi, J. GLC_FCS30: Global land-cover product with fine classification system at 30 m using time-series Landsat imagery. Earth Syst. Sci. Data 2021, 13, 2753–2776. [Google Scholar] [CrossRef]
- Hou, H. Global IGBP LULC projection dataset under eight SSPs-RCPs. Figshare 2022, 10, m9. [Google Scholar] [CrossRef]
- Zhang, Z.; Wang, Z.; Zhang, X.; Liang, B.; Wang, J. Comprehensive assessment of potential forestation land in China considering factors of vegetation resilience and top vegetation succession. Ecol. Indic. 2024, 166, 112476. [Google Scholar] [CrossRef]
- Yan, F.; Shangguan, W.; Zhang, J.; Hu, B. Depth-to-bedrock map of China at a spatial resolution of 100 meters. Sci. Data 2020, 7, 2. [Google Scholar] [CrossRef] [PubMed]
- Wu, Z. Chinese Forests; Chinese Forestry Press: Beijing, China, 2001. [Google Scholar]
- Editorial Committee for Vegetation of China. Vegetation of China; Science Press: Beijing, China, 1980. [Google Scholar]
- Editorial Committee of Vegetation Map of China, Chinese Academy of Sciences. Vegetation Map of the People’s Republic of China (1:1000000); Geology Press: Beijing, China, 2007; Volume 1222, 1228p. [Google Scholar] [CrossRef]
- Huber, S.; Fensholt, R.; Rasmussen, K. Water availability as the driver of vegetation dynamics in the African Sahel from 1982 to 2007. Glob. Planet. Change 2011, 76, 186–195. [Google Scholar] [CrossRef]
- Zhou, W.; Liu, G.; Pan, J.; Feng, X. Distribution of available soil water capacity in China. J. Geogr. Sci. 2005, 15, 3–12. [Google Scholar] [CrossRef]
- Ciemer, C.; Boers, N.; Hirota, M.; Kurths, J.; Müller-Hansen, F.; Oliveira, R. Higher resilience to climatic disturbances in tropical vegetation exposed to more variable rainfall. Nat. Geosci. 2019, 12, 174–179. [Google Scholar] [CrossRef]
- Forzieri, G.; Dakos, V.; McDowell, N.G.; Ramdane, A.; Cescatti, A. Emerging signals of declining forest resilience under climate change. Nature 2022, 608, 534–539. [Google Scholar] [CrossRef]
- Scheffer, M.; Hirota, M.; Holmgren, M.; Van Nes, E.H.; Chapin, F.S., 3rd. Thresholds for boreal biome transitions. Proc. Natl. Acad. Sci. USA 2012, 109, 21384–21389. [Google Scholar] [CrossRef] [PubMed]
- Xu, H.; Yue, C.; Zhang, Y.; Liu, D.; Piao, S. Forestation at the right time with the right species can generate persistent carbon benefits in China. Proc. Natl. Acad. Sci. USA 2023, 120, e2304988120. [Google Scholar] [CrossRef]
- Zhou, G.; Zheng, Y.; Luo, T.; Chen, S. NPP model of natural vegetation and its application in China. Sci. Silvae Sin. 1998, 34. [Google Scholar]
- Shadmani, M.; Marofi, S.; Roknian, M. Trend Analysis in Reference Evapotranspiration Using Mann-Kendall and Spearman’s Rho Tests in Arid Regions of Iran. Water Resour. Manag. 2012, 26, 211–224. [Google Scholar] [CrossRef]
- Zhang, L.; Sun, P.; Huettmann, F.; Liu, S. Where should China practice forestry in a warming world? Glob. Change Biol. 2022, 28, 2461–2475. [Google Scholar] [CrossRef]
- World Resources Institute. Atlas of Forest and Landscape Restoration Opportunities; World Resources Institute: Washington, DC, USA, 2021.
- Cai, W.; He, N.; Li, M.; Xu, L.; Wang, L.; Zhu, J.; Zeng, N.; Yan, P.; Si, G.; Zhang, X.; et al. Carbon sequestration of Chinese forests from 2010 to 2060: Spatiotemporal dynamics and its regulatory strategies. Sci. Bull. 2022, 67, 836–843. [Google Scholar] [CrossRef]
- Zhang, W.B.; Fu, J.S. Rainfall erosivity estimation under different rainfall amount. Resour. Sci. 2003, 25, 35–41. [Google Scholar]
- Renard, K.G. Predicting Soil Erosion by Water: A Guide to Conservation Planning with the Revised Universal Soil Loss Equation (RUSLE); US Department of Agriculture, Agricultural Research Service: Ames, IA, USA, 1997.
- Zhang, J.; Liu, Z.; Guan, Z.; Wang, L.; Zhang, J.; Han, Z. Balancing future urban development and carbon sequestration: A multi-scenario InVEST model analysis of China’s urban clusters. J. Environ. Manag. 2025, 380, 125003. [Google Scholar] [CrossRef] [PubMed]
- Guo, Y.; Wu, Z.; Zheng, Z.; Li, X. An optimal multivariate-stratification geographical detector model for revealing the impact of multi-factor combinations on the dependent variable. GIScience Remote Sens. 2024, 61, 2422941. [Google Scholar] [CrossRef]
- Wang, J.; Li, X.; Christakos, G.; Liao, Y.; Zhang, T.; Gu, X.; Zheng, X.-Y. Geographical Detectors-Based Health Risk Assessment and its Application in the Neural Tube Defects Study of the Heshun Region, China. Int. J. Geogr. Inf. Sci. 2010, 24, 107–127. [Google Scholar] [CrossRef]
- Wu, J.; Fan, X.; Li, K.; Wu, Y. Assessment of ecosystem service flow and optimization of spatial pattern of supply and demand matching in Pearl River Delta, China. Ecol. Indic. 2023, 153, 110452. [Google Scholar] [CrossRef]
- Gonzalez-Redin, J.; Luque, S.; Poggio, L.; Smith, R.; Gimona, A. Spatial Bayesian belief networks as a planning decision tool for mapping ecosystem services trade-offs on forested landscapes. Environ. Res. 2016, 144, 15–26. [Google Scholar] [CrossRef] [PubMed]
- Li, M.; Liu, S.; Wang, F.; Liu, H.; Liu, Y.; Wang, Q. Cost-benefit analysis of ecological restoration based on land use scenario simulation and ecosystem service on the Qinghai-Tibet Plateau. Glob. Ecol. Conserv. 2022, 34, e02006. [Google Scholar] [CrossRef]
- Peng, L.; Chen, T.; Deng, W.; Liu, Y. Exploring ecosystem services trade-offs using the Bayesian belief network model for ecological restoration decision-making: A case study in Guizhou Province, China. Ecol. Indic. 2022, 135, 108569. [Google Scholar] [CrossRef]
- Hu, H. The Distribution of Population in China. Acta Geogr. Sin. 1935, 2, 33–74. [Google Scholar]
- Chen, J.-N.; Zhu, Z.-C.; Cao, S.; Zhao, P.-J.; Liu, P.; Li, D.-J.; Wang, W.-M.; Chen, Y. Scientific land greening under climate change: Theory, modeling, and challenges. Adv. Clim. Change Res. 2024, 15, 894–913. [Google Scholar] [CrossRef]
- Liu, Y.; Yuan, X.; Li, J.; Qian, K.; Yan, W.; Yang, X.; Ma, X. Trade-offs and synergistic relationships of ecosystem services under land use change in Xinjiang from 1990 to 2020: A Bayesian network analysis. Sci. Total Environ. 2023, 858, 160015. [Google Scholar] [CrossRef]
- Sun, J.; Li, G.; Zhang, Y.; Qin, W.; Wang, M. Identification of priority areas for afforestation in the Loess Plateau region of China. Ecol. Indic. 2022, 140, 108998. [Google Scholar] [CrossRef]
- Ren, Y.; Zhang, L.; Wei, X.; Song, Y.; Wu, S.; Wang, H.; Chen, X.; Qiao, Y.; Liang, T. Evaluating and simulating the impact of afforestation policy on land use and ecosystem services trade-offs in Linyi, China. Ecol. Indic. 2024, 160, 111898. [Google Scholar] [CrossRef]
- Bayer, A.D.; Lautenbach, S.; Arneth, A. Benefits and trade-offs of optimizing global land use for food, water, and carbon. Proc. Natl. Acad. Sci. USA 2023, 120, e2220371120. [Google Scholar] [CrossRef]
- Fesenmyer, K.A.; Poor, E.E.; Terasaki Hart, D.E.; Veldman, J.W.; Fleischman, F.; Choksi, P.; Archibald, S.; Armani, M.; Fagan, M.E.; Fricke, E.C.; et al. Addressing critiques refines global estimates of reforestation potential for climate change mitigation. Nat. Commun. 2025, 16, 4572. [Google Scholar] [CrossRef]
- Deng, Y.; Cai, W.; Hou, M.; Zhang, X.; Xu, S.; Yao, N.; Guo, Y.; Li, H.; Yao, S. How Eco-Efficiency Is the Forestry Ecological Restoration Program? The Case of the Sloping Land Conversion Program in the Loess Plateau, China. Land 2022, 11, 712. [Google Scholar] [CrossRef]
- Cui, W.; Liu, J.; Jia, J.; Wang, P. Terrestrial ecological restoration in China: Identifying advances and gaps. Environ. Sci. Eur. 2021, 33, 123. [Google Scholar] [CrossRef]
- Ming, D.; Wang, L.; Dai, L.; Zhang, Q.; Liang, T. Evaluation of water environment quality in a typical wetland on the Qinghai-Tibet Plateau using positive matrix factorization and self-organizing map. J. Clean. Prod. 2024, 479, 144069. [Google Scholar] [CrossRef]
- Nytch, C.J.; Rojas-Sandoval, J.; Erazo Oliveras, A.; Santiago García, R.J.; Meléndez-Ackerman, E.J. Effects of historical land use and recovery pathways on composition, structure, ecological function, and ecosystem services in a Caribbean secondary forest. For. Ecol. Manag. 2023, 546, 121311. [Google Scholar] [CrossRef]
- Shen, J.; Zhao, M.; Tan, Z.; Zhu, L.; Guo, Y.; Li, Y.; Wu, C. Ecosystem service trade-offs and synergies relationships and their driving factor analysis based on the Bayesian belief Network: A case study of the Yellow River Basin. Ecol. Indic. 2024, 163, 112070. [Google Scholar] [CrossRef]
- National Development and Reform Commission. Implementation Plan for Consolidating and Enhancing National Ecosystem Carbon Sink Capacity (2023); National Development and Reform Commission: Beijing, China, 2023.
- National Development and Reform Commission; Ministry of Natural Resources. Master Plan for Major Projects of National Key Ecosystem Protection and Restoration (2021–2035); National Development and Reform Commission: Beijing, China, 2020.
- Ning, K.; Chen, J.; Li, Z.; Liu, C.; Nie, X.; Liu, Y.; Wang, L.; Hu, X. Land use change induced by the implementation of ecological restoration Programs increases future terrestrial ecosystem carbon sequestration in red soil hilly region of China. Ecol. Indic. 2021, 133, 108409. [Google Scholar] [CrossRef]
- Huang, W.; Wang, P.; He, L.; Liu, B. Improvement of water yield and net primary productivity ecosystem services in the Loess Plateau of China since the “Grain for Green” project. Ecol. Indic. 2023, 154, 110707. [Google Scholar] [CrossRef]
- Zhang, M.; Liu, S.; Luo, X.; Keenan, T.F.; Fu, L.; Xiao, C.; Zhang, Y.; Gong, P. Incorporating site suitability and carbon sequestration of tree species into China’s climate-adaptive forestation. Sci. Bull. 2025, 70, 1834–1845. [Google Scholar] [CrossRef] [PubMed]
- Luo, D.; Zhou, Z.; Zhang, L.; Chen, Q.; Huang, D.; Feng, Q.; Wu, T.; Wu, L. Evolution and driver analysis of forest carbon stocks in karst mountainous areas of southwest China in the context of rocky desertification management. Catena 2024, 246, 108335. [Google Scholar] [CrossRef]
- Li, K.; Hou, Y.; Andersen, P.S.; Xin, R.; Rong, Y.; Skov-Petersen, H. Identifying the potential areas of afforestation projects using cost-benefit analysis based on ecosystem services and farmland suitability: A case study of the Grain for Green Project in Jinan, China. Sci. Total Environ. 2021, 787, 147542. [Google Scholar] [CrossRef]
- Cao, Z.; Wang, S.; Luo, P.; Xie, D.; Zhu, W. Watershed Ecohydrological Processes in a Changing Environment: Opportunities and Challenges. Water 2022, 14, 1502. [Google Scholar] [CrossRef]
- He, N.; Wen, D.; Zhu, J.; Tang, X.; Xu, L.; Zhang, L.; Hu, H.; Huang, M.; Yu, G. Vegetation carbon sequestration in Chinese forests from 2010 to 2050. Glob. Change Biol. 2017, 23, 1575–1584. [Google Scholar] [CrossRef]
- Li, M.; Abuduwaili, J.; Liu, W.; Feng, S.; Saparov, G.; Ma, L. Application of geographical detector and geographically weighted regression for assessing landscape ecological risk in the Irtysh River Basin, Central Asia. Ecol. Indic. 2024, 158, 111540. [Google Scholar] [CrossRef]
- Wu, C.; Liu, X.; Pei, F.; Liu, K.; Cai, Y.; Xu, X.; Zhuang, H.; Cai, Y.; Li, B. Non-negligible large impact of potential forestation on livestock production in China. Geogr. Sustain. 2025, 6, 100270. [Google Scholar] [CrossRef]
- Sousa-Silva, R.; Verbist, B.; Lomba, Â.; Valent, P.; Suškevičs, M.; Picard, O.; Hoogstra-Klein, M.A.; Cosofret, V.-C.; Bouriaud, L.; Ponette, Q.; et al. Adapting forest management to climate change in Europe: Linking perceptions to adaptive responses. For. Policy Econ. 2018, 90, 22–30. [Google Scholar] [CrossRef]
Disclaimer/Publisher’s Note: The statements, opinions and data contained in all publications are solely those of the individual author(s) and contributor(s) and not of MDPI and/or the editor(s). MDPI and/or the editor(s) disclaim responsibility for any injury to people or property resulting from any ideas, methods, instructions or products referred to in the content. |
© 2025 by the authors. Licensee MDPI, Basel, Switzerland. This article is an open access article distributed under the terms and conditions of the Creative Commons Attribution (CC BY) license (https://creativecommons.org/licenses/by/4.0/).