You are currently viewing a new version of our website. To view the old version click .
Remote Sensing
  • Article
  • Open Access

13 October 2025

Evaluation of Post-Fire Treatments (Erosion Barriers) on Vegetation Recovery Using RPAS and Sentinel-2 Time-Series Imagery

,
,
and
1
Department of Geography and Spatial Management-Environmental Sciences Institute (IUCA), University of Zaragoza, 50009 Zaragoza, Spain
2
Department of Ancient Sciences-Institute of Heritage and Humanities (IPH), ARAID–University of Zaragoza, 50009 Zaragoza, Spain
*
Author to whom correspondence should be addressed.
Remote Sens.2025, 17(20), 3422;https://doi.org/10.3390/rs17203422 
(registering DOI)
This article belongs to the Special Issue Remote Sensing for Risk Assessment, Monitoring and Recovery of Fires

Abstract

Highlights

What are the main findings?
  • RPAS and Sentinel-2 enable multi-scale assessment of erosion barriers (EB).
  • NDVI higher upstream of erosion barriers; vegetation height lower in treated sites.
What is the implication of the main finding?
  • Remote sensing offers operational tools for post-fire restoration monitoring.
  • Long-term monitoring is key to evaluating EB effectiveness and land management.

Abstract

Post-fire soil and vegetation changes can intensify erosion and sediment yield by altering the factors controlling the runoff–infiltration balance. Erosion barriers (EBs) are widely used in hydrological and forest restoration to mitigate erosion, reduce sediment transport, and promote vegetation recovery. However, precise spatial assessments of their effectiveness remain scarce, requiring validation through operational methodologies. This study evaluates the impact of EB on post-fire vegetation recovery at two temporal and spatial scales: (1) Remotely Piloted Aircraft System (RPAS) imagery, acquired at high spatial resolution but limited to a single acquisition date coinciding with the field flight. These data were captured using a MicaSense RedEdge-MX multispectral camera and an RGB optical sensor (SODA), from which NDVI and vegetation height were derived through aerial photogrammetry and digital surface models (DSMs). (2) Sentinel-2 satellite imagery, offering coarser spatial resolution but enabling multi-temporal analysis, through NDVI time series spanning four consecutive years. The study was conducted in the area of the Luna Fire (northern Spain), which burned in July 2015. A paired sampling design compared upstream and downstream areas of burned wood stacks and control sites using NDVI values and vegetation height. Results showed slightly higher NDVI values (0.45) upstream of the EB (p < 0.05), while vegetation height was, on average, ~8 cm lower than in control sites (p > 0.05). Sentinel-2 analysis revealed significant differences in NDVI distributions between treatments (p < 0.05), although mean values were similar (~0.32), both showing positive trends over four years. This study offers indirect insight into the functioning and effectiveness of EB in post-fire recovery. The findings highlight the need for continued monitoring of treated areas to better understand environmental responses over time and to inform more effective land management strategies.

1. Introduction

In forest ecosystems of the Mediterranean basin, which show a high degree of transformation and degradation due to anthropogenic factors, wildfires can cause significant environmental alterations [], such as the removal of the vegetation cover, physicochemical changes on soil, or an increase in runoff and soil erosion [,]. This is particularly true in recent decades, when important changes in fire regime parameters (increase in the recurrence, severity, and length of forest fires) [,] are taking place. Despite the mechanisms of vegetation resistance to fire and the intense profusion of natural strategies of sprouting–seeding of most Mediterranean species [], the post-fire soil and vegetation changes may intensify soil erosion processes and sediment yield [] by modifying the evapo-transpiration conditions and the parameters controlling the runoff–infiltration balance [,].
In the context of urgent management of burned areas, the national/regional forestry government in many Mediterranean countries has applied management practices to stabilize and prevent degradation processes such as soil erosion and flooding [], aiming to increase soil stabilization and minimize seed removal, overland flow, and post-fire erosion risk [], thereby enhancing ecosystem recovery. One of the most common practices applied immediately after a fire is the installation of hillslope erosion barriers (EB hereinafter) [,]. This technique has been used extensively in Europe and consists of the construction of fences following a procedure of stacking fire-burned trees []. EBs are placed following the contour lines, taking into account the topographic conditions to reduce the erosive energy of the runoff by interposing flow paths [,]. There is abundant scientific literature analyzing the effectiveness of EB in relation to hydrogeomorphological dynamics (runoff measurements, sediment yield) [,,,,,], although the results collected are non-conclusive [,]. For instance, research in reforested areas of northwestern Spain affected by wildfires shows that, despite the intended purpose of barriers to mitigate hydrological impacts and prevent soil degradation following fire events, they do not significantly reduce post-fire erosion or contribute positively to vegetation regeneration []. However, Albert-Belda et al. [] showed that the use of Easy Barriers—an improved EB design made from cellulose fibers—helped to reduce peak runoff discharge, delay the onset of surface flow, and increase soil moisture. This is due, among other reasons, to interactions with other factors that may condition the effectiveness of this technique. In addition, the lifespan of erosion barriers can vary greatly over time [] depending on sediment capture, rainfall conditions, soil water-holding capacity, and the quality of the constructions (horizontal dip, sealing of the stacks to the ground surface, etc.) []. On the other hand, the implementation cost of these structures can be high compared to other alternatives. In this regard, Girona-García et al. [] report that erosion barriers have a relatively low cost–effectiveness ratio (USD 1386 per Mg of sediment prevented), due to their limited efficiency under intense rainfall events and the costs associated with their construction.
The effectiveness of the erosion barrier (EB) can also be assessed through its impact on vegetation recovery, considering the spatial pattern (upstream and downstream of the fences) resulting from its perpendicular arrangement relative to the line of maximum slope. These improved microenvironmental conditions are expected to stimulate vegetation germination and growth [], which in turn lead to increases in photosynthetic activity and vegetation cover. Such changes are detectable through remote sensing, as they are reflected in vegetation indices such as the Normalized Difference Vegetation Index (NDVI). Therefore, the analysis of NDVI values in upstream versus downstream areas offers a functional and spatially explicit means of assessing the ecological impact of EBs, and supports the use of remote sensing as an effective monitoring tool in post-fire recovery contexts.
Understanding the spatio-temporal patterns of post-fire regeneration linked to EB is essential to evaluating their long-term effectiveness and to guiding post-disturbance management. However, despite the potential of operational remote sensing tools to monitor vegetation regrowth at various spatial and temporal scales, this topic remains underexplored [].
Compared to labor-intensive field operations, remote sensing techniques are a time- and cost-effective method to monitor regrowth processes []. Spectral trajectories, often used as a proxy for vegetation recovery, are commonly employed to analyze the spatio-temporal dynamics of vegetation cover following wildfires, using various spectral indices, temporal frameworks, and remote sensing sensors []. On a moderate spatial scale, satellite image collections from multispectral sensors such as the MultiSpectral Instrument (MSI) aboard Sentinel-2 provide particularly useful information for monitoring the recovery process due to (1) their spectral resolution (bands in the visible (VIS), near-infrared (NIR), and mid-wave infrared (SWIR)), and (2) their ability to revisit the same spot periodically (from 3 to 5 days). This is supported by the large body of scientific literature on burned areas [,]. However, there are hardly any references to burned areas where forest hydrological practices have been applied to minimize erosion problems and improve vegetation recovery [,].
For the observation of fine-scale spatial patterns, the spatial resolution of RPAS (Remotely Piloted Aircraft System) imagery can facilitate the retrieval of information on areas where treatments have been applied, allowing the observation of patterns that may go undetected in the MSI imagery. The use of spectral cameras and imagery with photogrammetry helps to derive spectral indices and extract digital surface models (DSMs), which allows for a precise knowledge of vegetation patterns [,] in relation to photosynthetic activity and physiognomic characteristics. These systems can provide very valid information to understand the consequences of treatments at a fine spatial scale, since they may vary at a scale of decimeters [,]. In this sense, Unmanned Aerial Vehicle (UAV) images has been used in different studies for mapping vegetation characteristics [,,], but only to a limited extent for monitoring regrowth at sites where post-fire treatments have been applied. Along the same lines, López-Vicente [,] evaluated the efficiency of two types of soil erosion barriers to reduce soil connectivity in a wildfire on a steep slope using drone-derived images.
At this stage, the objectives of this study may be delineated across two different spatial scales: (1) the analysis of the different NDVI (Normalized Difference Vegetation Index) values over time (2016–2019) associated with the implementation of erosion barriers in comparison with Non-Intervention zones, where no accumulation of burned woody debris has been arranged in the form of barriers (hereinafter referred to as NI); and (2) an assessment of the effects that the EBs have on their areas of influence (both upstream and downstream of the accumulations) using NDVI data and vegetation height values. This approach is based on a double working hypothesis: (1) there are differences in the magnitude and temporal dynamics of NDVI levels depending on the type of treatment applied; and (2) the EBs promote vegetation regeneration in their areas of influence, particularly upstream of the accumulations, in terms of growth and height, by facilitating the capture of sediment and seeds due to the disruption of runoff flows.
For the second objective, we use high spatial resolution images captured from aerial flights on a specific date, while for the first one, we opt for a temporal series of Sentinel 2A/B images to account for both inter- and intra-annual variations. In addition, we interpret the variations in conjunction with the thermal and rainfall conditions during the analyzed period (2016–2019). The study area corresponds to the northeastern sector of the Luna Fire (NE Spain), which occurred in July 2015.

2. Materials and Methods

2.1. Study Area

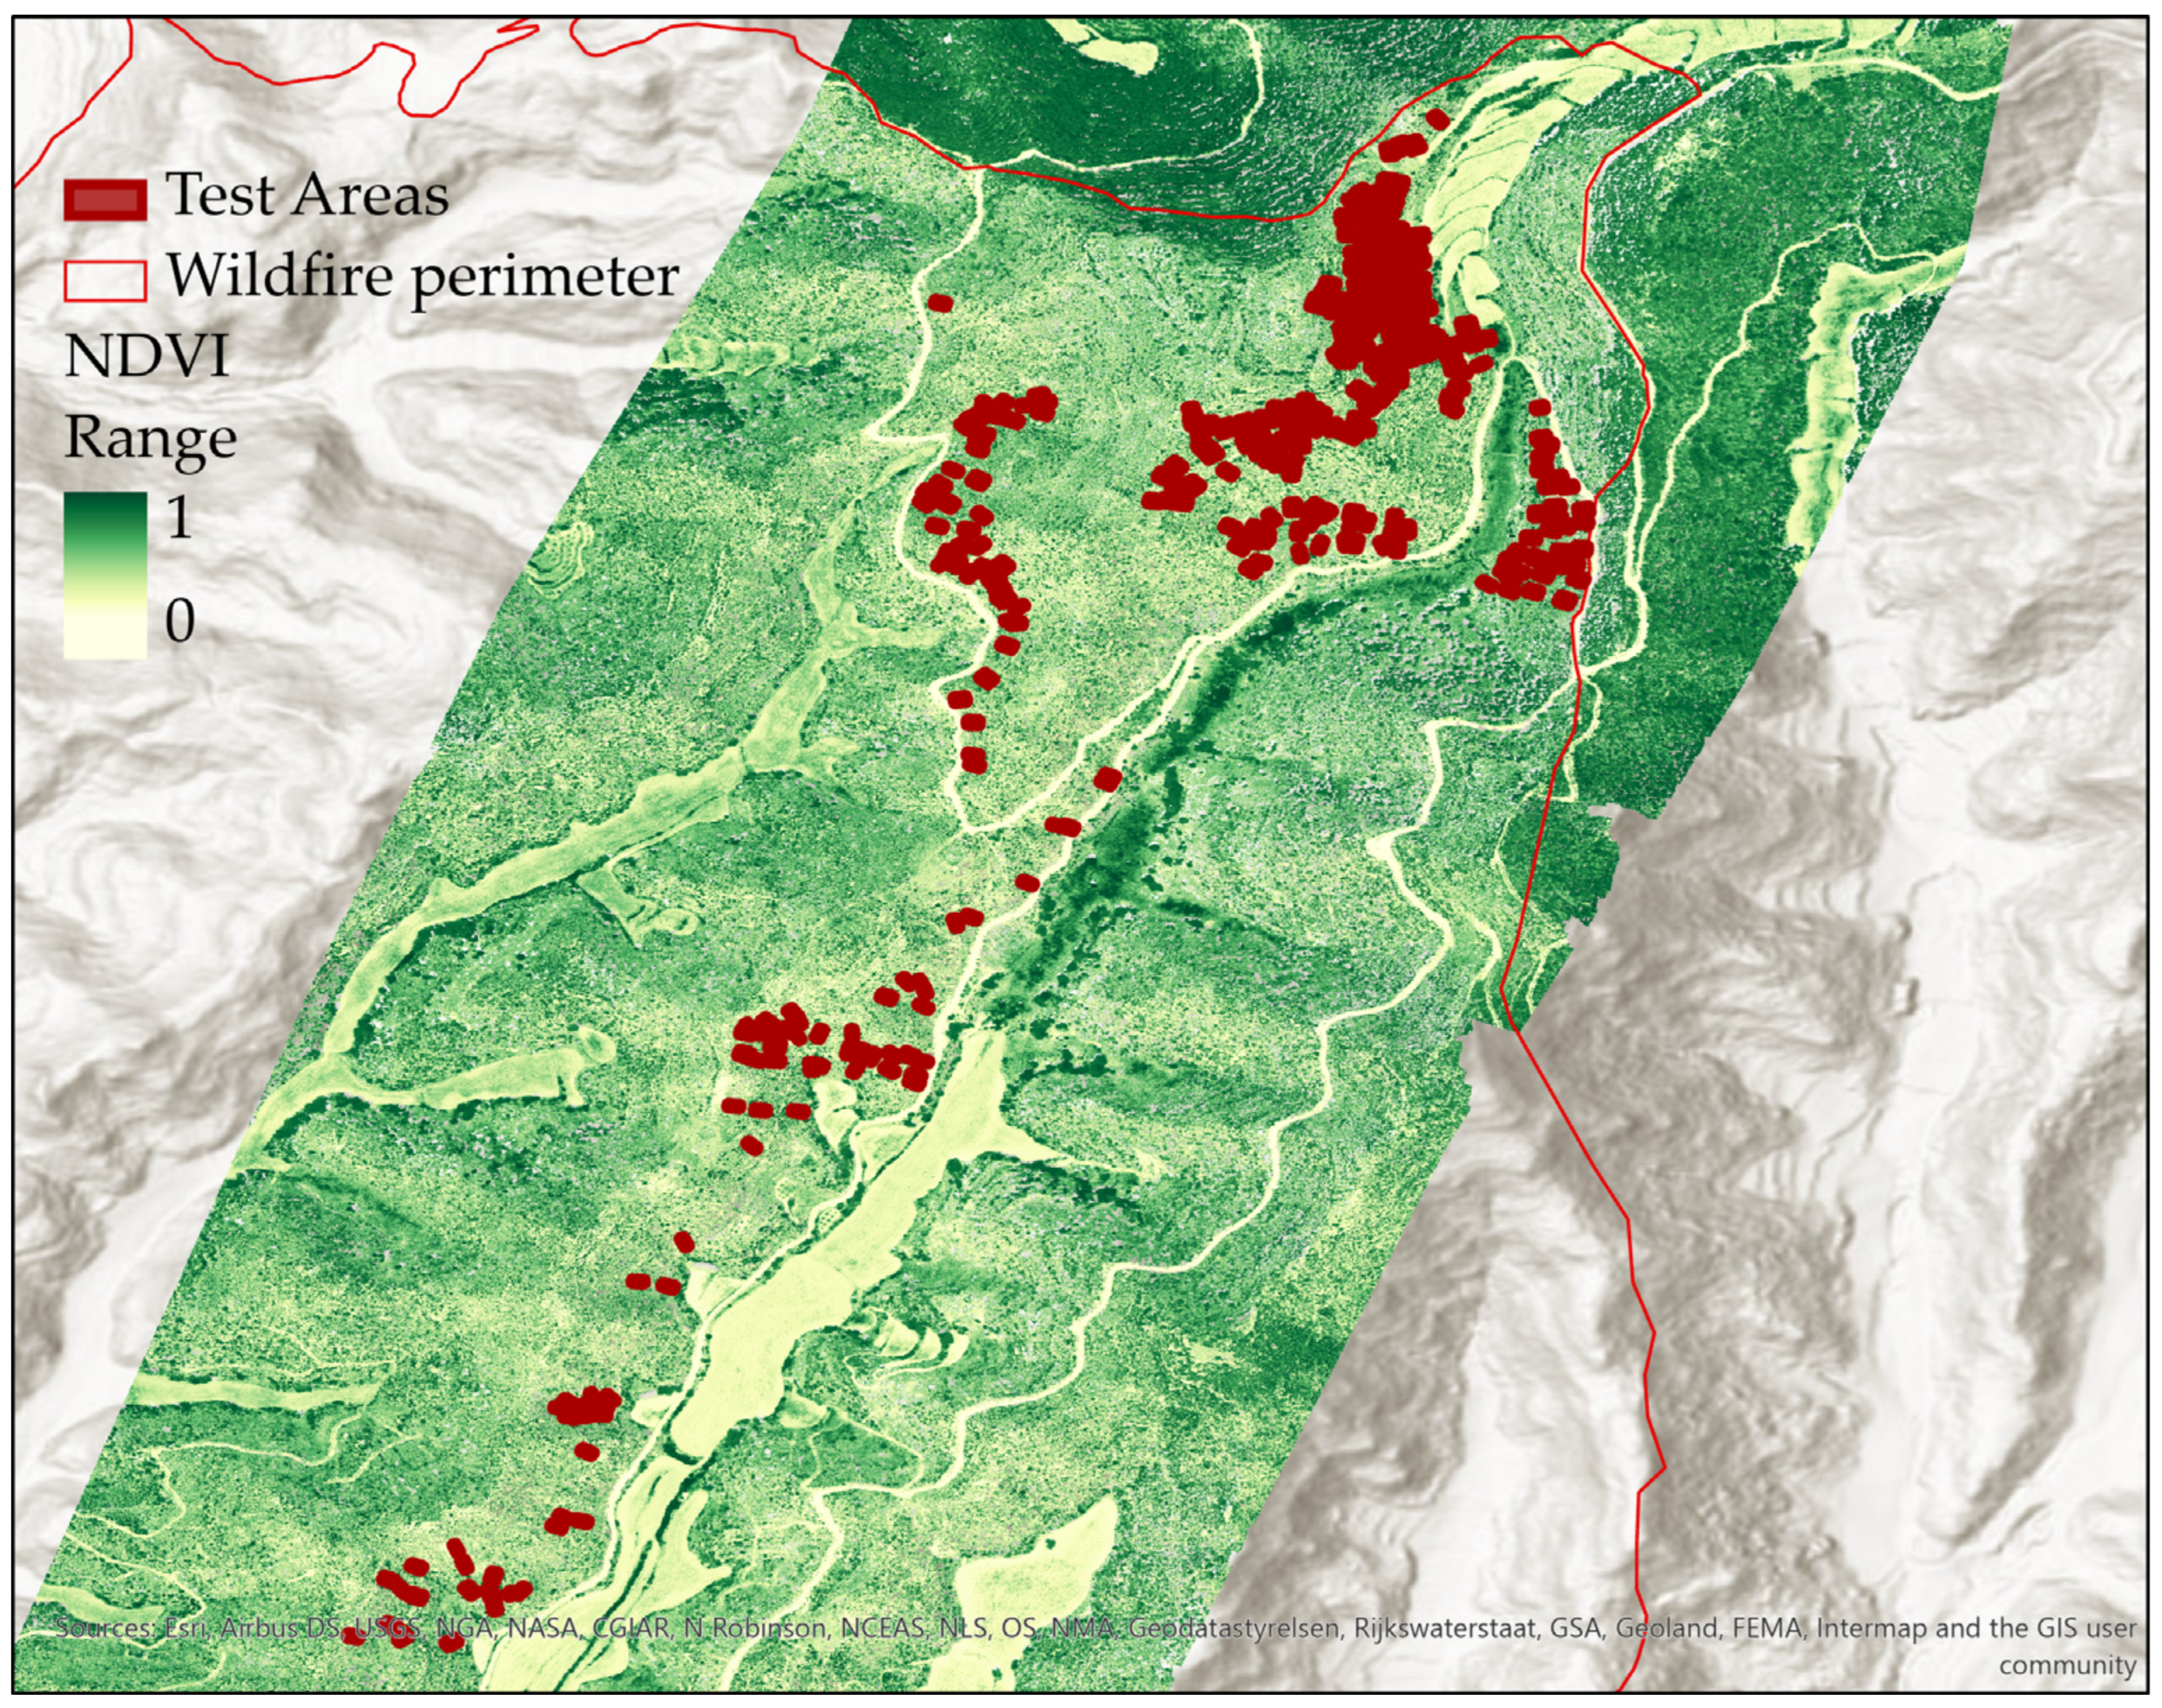
The Luna Fire occurred in northern Spain between 4 and 7 July 2015 and burned approximately 13,889 ha (Figure 1). Of this total, 4240 ha comprised tree-covered forest, mainly dominated by Pinus halepensis Mill. and Quercus ilex L., most of which were located in the eastern sector of the burned area. According to the methodology of Key and Benson (2006), most of this sector exhibited High to Moderate-high levels of fire severity [,]. Between October 2015 and May 2016, various post-fire management treatments were implemented.
Figure 1. Location of the study area in the Luna Wildfire and RPAS platforms footprint.
According to the technical report on emergency actions in the area affected by the Luna Forest Fire [], the budget required to undertake preventive measures amounted to 1,024,114.22 €, of which 184,882.80 € corresponded to the implementation of the EB. Specifically, the EB focused on areas of steep topography with a high risk of erosion and were implemented in a total of 101 ha. All interventions were conducted on public utility lands.
The EB sites analyzed in this study are located between 650 and 750 m above sea level. This area is characterized by a Mediterranean climate, with an average annual temperature of 12 °C and an average annual precipitation of approximately 600 mm. The pre-fire vegetation was mainly made up of evergreen sclerophyllous shrublands (Quercus coccifera L., Genista scorpius L., Rosmarinus officinalis L.), along with sclerophyllous pastures dominated by Brachypodium retusum (Pers.) Beauv., and scattered trees (Pinus halepensis and Quercus ilex).

2.2. Materials

2.2.1. Satellite Data

Within the framework of the Copernicus Program of the European Space Agency (ESA), Sentinel-2A/B satellites provide high-resolution spatial and temporal data from 2015. The Sentinel-2 satellites are equipped with a Multi-Spectral Instrument (MSI) sensor, whose spectral bands range from the visible to the shortwave infrared, with four bands at a spatial resolution of 10 m (B2: 490 nm, B3: 560 nm, B4: 665 nm, B8: 842 nm) and six bands at a spatial resolution of 20 m (B5: 705 nm, B6: 740 nm, B7: 783 nm, B8a: 865 nm, B11: 1610 nm, B12: 2190 nm).
Sentinel-2A/B Level-2A surface reflectance data (2016–2019) were processed in Google Earth Engine, applying a cloud and cirrus masking filter based on the QA60 band to retain only valid pixels. The Level-2A product provides surface reflectance after atmospheric correction using Sen2COR, an algorithm developed by the European Space Agency (ESA). In addition to correcting for atmospheric effects, Sen2COR generates auxiliary information such as aerosol optical depth (AOD), water vapor, and a Scene Classification Layer (SCL), which is commonly used to mask clouds, cirrus, and shadows. For this study, 169 orthophotos (UTM/WGS84) from the Level-2A product, spatially coincident with the Luna Fire, were used. The selection ensured that every month was represented in each year, except for January, November, and December, which were excluded due to the significant effects of topographic shadows.
The analysis of the effects of EB was conducted by comparing NDVI values over this period with those of Non-Intervention areas. NDVI is a NIR-based spectral index widely used to monitor vegetation regrowth due to its sensitivity to seasonal and biophysical variations. Although NDVI tends to saturate in densely forested areas, it remains a reliable proxy for assessing vegetation recovery []. NDVI was derived from the red and near-infrared bands, and annual minimum, maximum, and mean values were calculated from all available cloud-free images.
Due to the phenological seasonality of the plant communities that colonize burned areas (e.g., pastures and Mediterranean aromatic shrubs) and its varying spectral response throughout inter-annual growth, vegetation growth trajectories are characterized using seasonal patterns known as Land Surface Phenology (LSP). LSP represents vegetation dynamics that can be interpreted by spectral remote sensing imagery, including key phenological events such as the start of the greening season, the peak of the growing season, or the end of the season [].

2.2.2. RPAS Imagery

Two fixed-wing RPAS platforms (eBee X and eBee Plus) from a SenseFly [] were used to characterize the effects of the EB on vegetation development at high spatial resolution. The eBee X drone was used with a multispectral sensor (Micasense RedEdge-MX, senseFly, Cheseaux-sur-Lausanne, Switzerland), while the second drone, eBee Plus, was equipped with an RGB optical sensor (SODA) to perform photogrammetric processing. The first is a multispectral camera that registers information in five spectral regions including blue (B), green (G), red (R), Red Edge (RE), and the near-infrared (NIR) with an average spatial resolution of 8.2 cm/pixel at an altitude of 120 m [] (Table 1 and Table 2). The second, SODA, provides RGB images that allow for the generation of high-precision orthomosaics and digital models of the surface (DSM) with an average spatial resolution of 5 cm/pixel at an altitude of 120 m.
Table 1. Characteristics of RPAS platforms.
Table 2. Characteristics of the sensors.
An autonomous flight mission was configured using eMotion software, while also incorporating GNSS RTK (Global Navigation Satellite System-Real Time Kinematic) and PPK (Post-Processing Kinematic) technology to obtain georeferenced images with centimetric accuracy. The images were taken on 6 August 2019 (four years after the fire). On the first flight with the SODA sensor, a visible RGB image was taken at 11:00. The second one, with the multispectral camera (MicaSense RedEdge-MX) started at 12:00 and the last one finished at 16:30. For flight georeferencing, an RTK connection was established via the ARAGEA network (Continuously Operating Reference Stations, CORS) of the Gobierno de Aragón (Instituto Geográfico de Aragón, IGEAR), using a Virtual Reference Station (VRS) antenna. Due to the lack of data coverage in the study area, it was necessary to combine RTK and PPK methods by post-processing with RINEX data from the Zaragoza and Ejea reference stations of the ARAGEA network.
The orthomosaics and DSM generation were executed using Pix4D Mapper software in three consecutive phases: (1) orientation of the images depending on the position and angle registered by the different sensors onboard the RPAS, such as the IMU (Inertial Measurement Unit). These use a series of accelerometers and gyroscopes to register the different movements of the platform such as warps, pitches and turns or the signal itself received by the GNSS sensor; (2) obtaining a model of the point cloud in LAS format. (3) obtaining products: orthomosaics of the images, digital models of the surface and land, and a calculation of the NDVI spectral index []. Taking into account the high absorption rate of green leaves in the visible region and the levels of reflection in the near-infrared region, non-radiometrically calibrated MicaSense RedEdge-MX bands were used to achieve a vegetation index (NDVI). UAV-based NDVI was computed using the red (668 nm) and near-infrared (840 nm) bands.
The height of the vegetation canopy was obtained using the photogrammetric image by subtracting the Digital Terrain Model (DTM) from the Digital Surface Model (DSM) of the vegetation canopy [], resulting in a normalized DSM (nDSM) []. The methodology based on multi-view photogrammetry (Structure from Motion, SfM) has been extensively evaluated, with numerous studies confirming its reliability for estimating vegetation cover, canopy height, and NDVI at high spatial resolution [,,,,,,,]. However, the objective here was not the absolute estimation of NDVI or vegetation height, but their relative comparison between areas located upstream and downstream of the erosion barriers (EB), as well as between treated (EB) and control (NI) plots.

2.2.3. Climatic Anomalies

The monthly thermo-pluviometric anomaly analyses used in this study were obtained from products developed by the Departamento de Desarrollo Rural y Sostenibilidad of the Gobierno de Aragón (Department for Rural Development and Sustainability of the Government of Aragon) (DGA), specifically by the Secretaría General Técnica. These data were collected by the meteorological station in Castejón de Valdejasa, located near the study area, and belong to the Meteorological Network of the Spanish Ministry of Agriculture, Food and the Environment.
Two key indicators were examined: (1) rainfall anomaly (RA, Equation (1)), defined as the difference between the monthly accumulated precipitation and the mean precipitation of a historical climate series, divided by the mean precipitation and expressed as a percentage; and (2) temperature anomaly (TA, Equation (2)), calculated as the difference between the average temperature of a given month and the mean temperature of the historical series for that month.
R A = m o n t h l y   a c c u m u l a t e d   r a i n f a l l m o n t h l y   m e a n   r a i n f a l l m e a n   r a i n f a l l × 100
T A = m o n t h l y   t e m p e r a t u r e m o n t h l y   m e a n   t e m p e r a t u r e

2.3. Sampling Designs

Figure 2 provides an overview of the methodology used in this work to evaluate the consequences of the EB on vegetation recovery.
Figure 2. Diagram outlining the main methodological stages and the two types of sampling.

2.3.1. Analysis of the Differences Between Treatments (Multitemporal Sentinel Data)

The analysis of the differences between the vegetation recovery related to the EB and NI was carried out using stratified sampling. The stratification was undertaken by combining the type of treatment (EB and NI) and the topographic exposure (E, S, W and Facing all Winds-FW), since the topographic exposure represents one of the variables that exert the most control over the revegetation processes [] in the sub-Mediterranean environments in which the burnt area is registered. North-facing orientations were excluded due to the lack of homogeneous distribution across treatments and the occurrence of occlusion phenomena, particularly during winter. A total of four 40 m-long quadrangular plots were designated for each treatment (Non-Intervention and erosion barriers) (Figure 3). Considering that the analysis spans a four-year period, the database compiled from 168 Sentinel images comprises 1344 records (672 per treatment and 167 per topographic exposure type). Pixels affected by cloud cover or shadow were excluded from the analysis.
Figure 3. Distribution of the 40 m-long quadrangular plots, distinguishing between Non-Intervention areas (NI) (rectangles in black) and areas with erosion barriers (EB) (rectangles in blue). The pink rectangle indicates the area enlarged on the right.

2.3.2. Analysis of the Differences Between the EB Areas of Influence (RPAS Imagery)

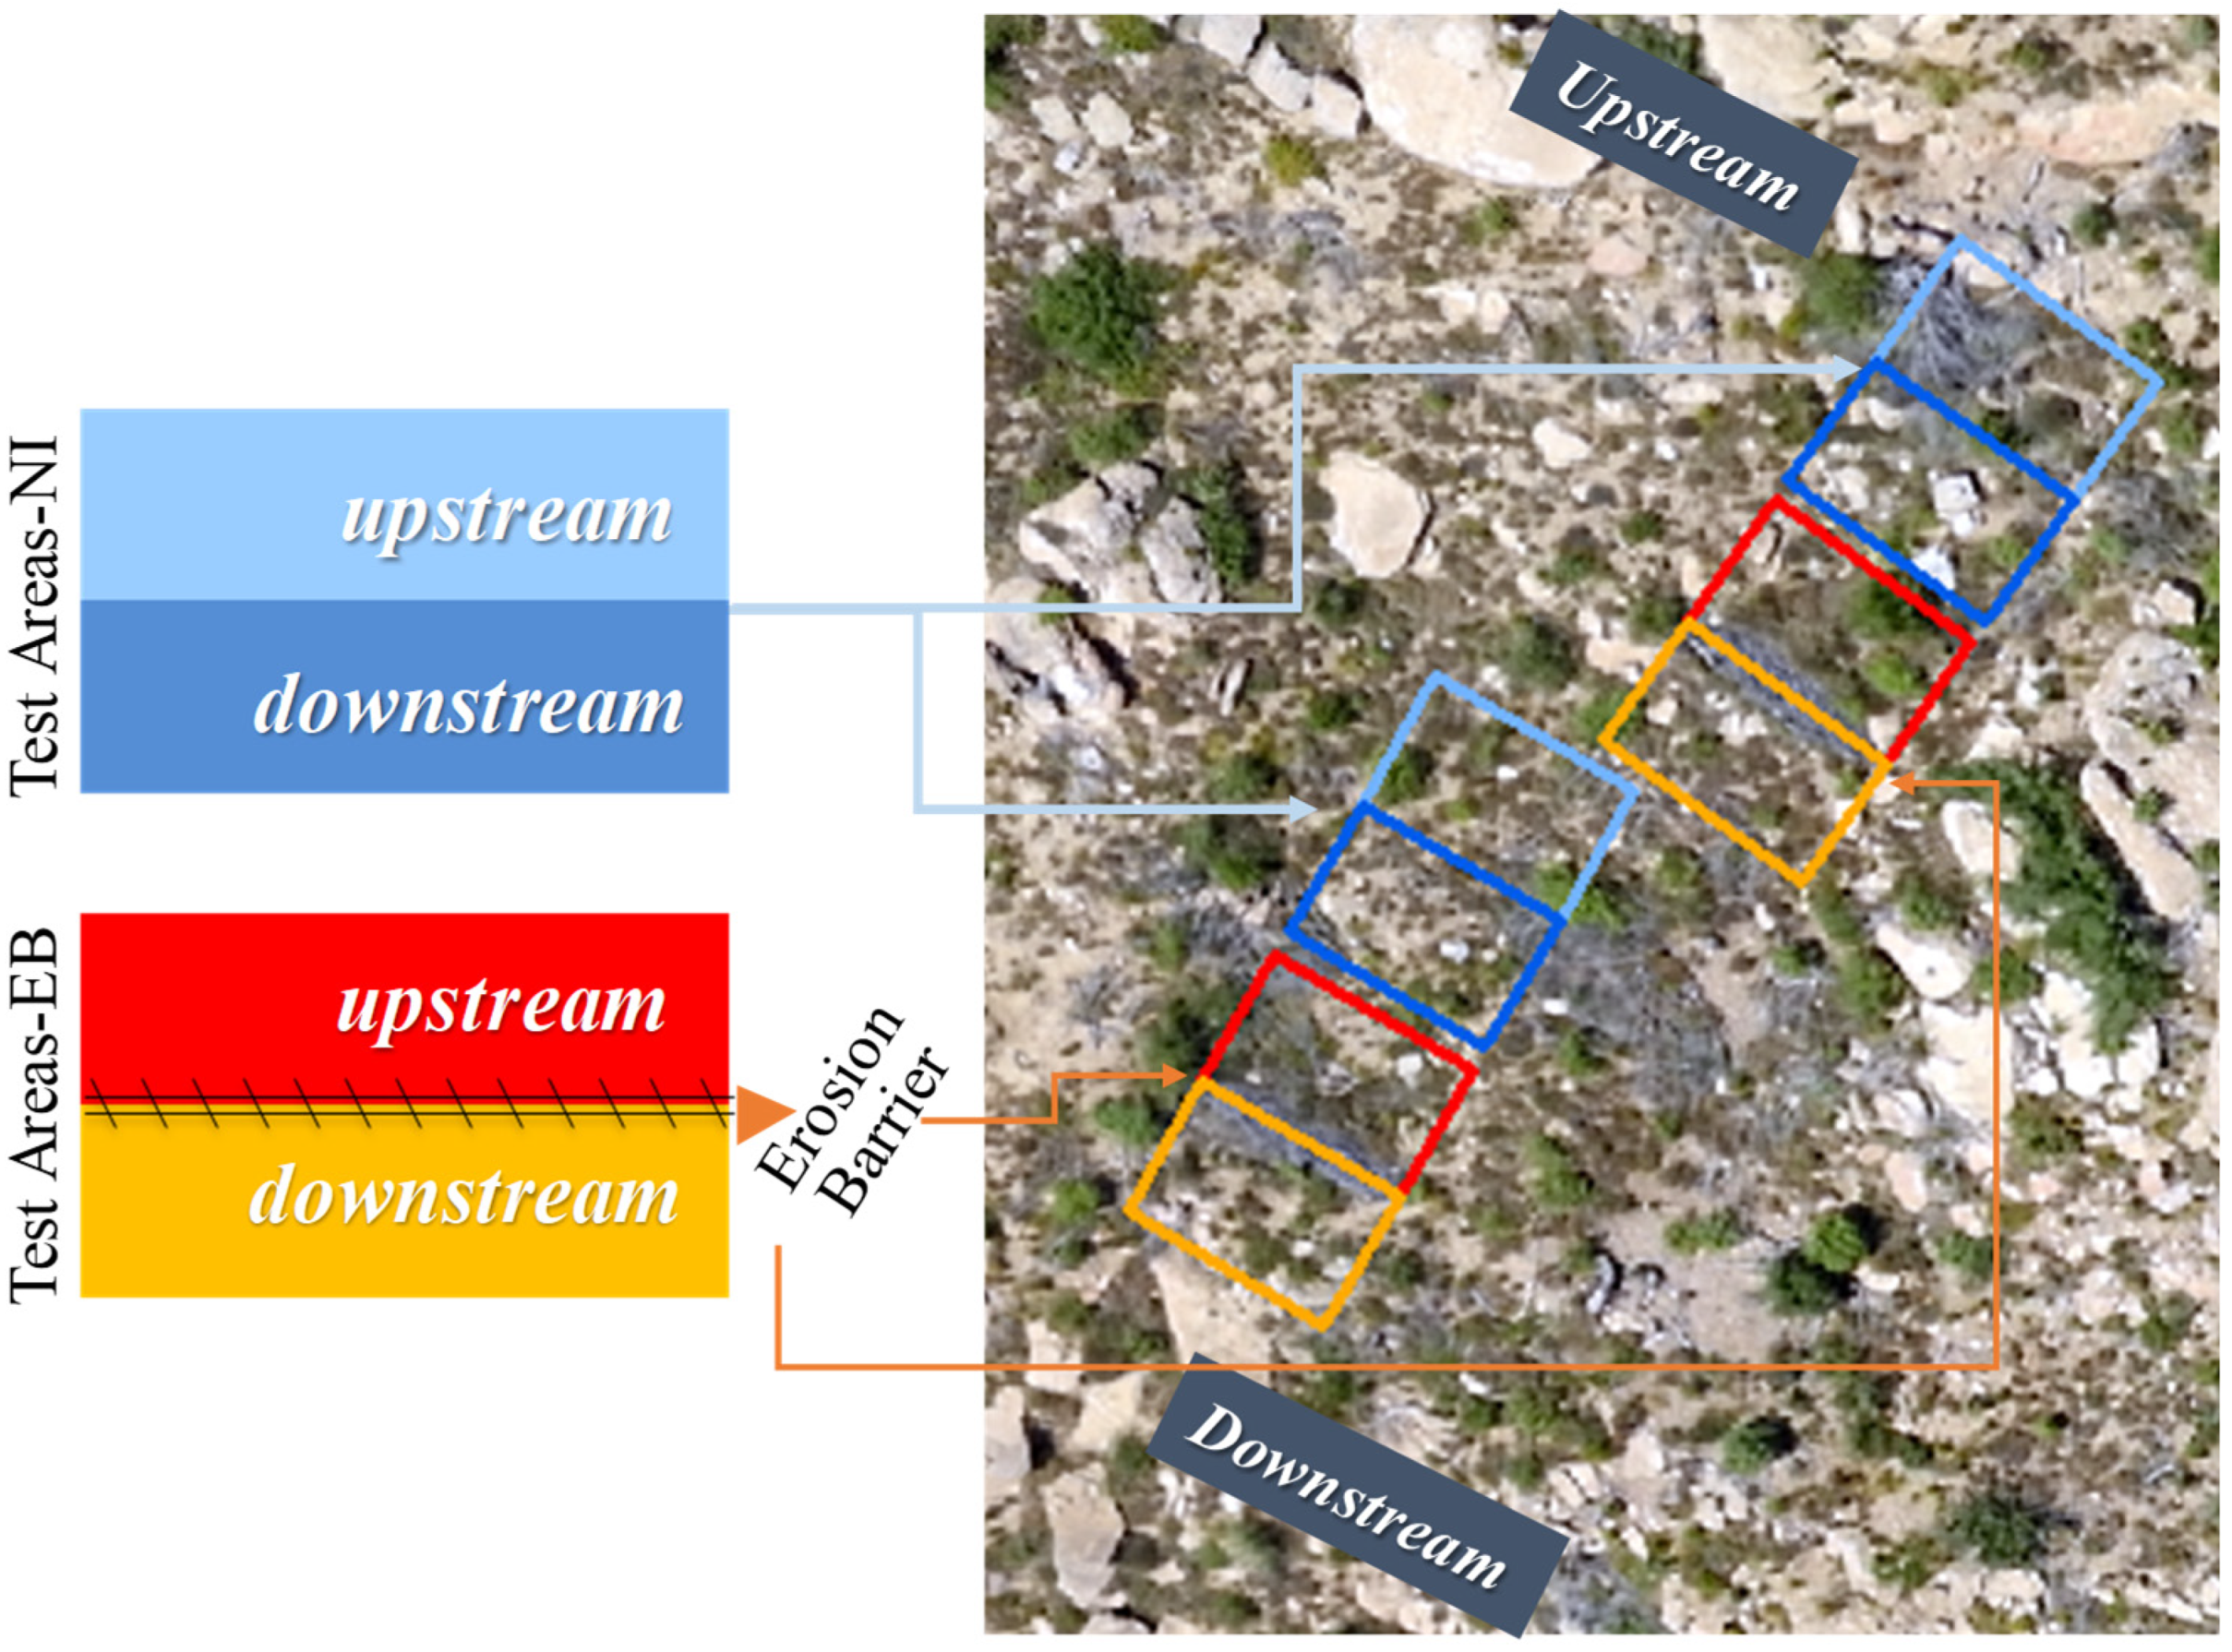
The experimental design for analyzing the effect of erosion barriers installation on vegetation recovery is based on a randomized sample of paired observations (upstream and downstream of the accumulation lines of stacked burnt wood) (Figure 4). Data were collected in three phases:
Figure 4. Top: Distribution of test areas. Bottom: Experimental design for the analysis of the effects of EB (erosion barriers) on vegetation height and NDVI values using RPAS imagery.
  • Digitization of EB segments. The positions of the erosion barriers are digitized using high-resolution RGB imagery and the DTM. Given variability in the length of the wood stacks, each digitized segment measured between 4 and 6 m.
  • Digitization of plots within EB influence areas. Influence areas are defined as the zones directly upstream and downstream of each EB segment. Using each segment as a reference, rectangular plots measuring 3 × 6 m were delineated along the direction of maximum slope. This resulted in paired plots per EB segment—one located above (upstream) and one below (downstream) the barrier. Each pair of plots constitutes an EB test area (hereafter, Test Area-EB).
  • Digitization of control plots (Test Areas-NI). Control plots were established in nearby areas with similar slope and ecological conditions, but without EBs. For each EB segment, a corresponding control segment was identified in an adjacent, untreated slope section, typically located upslope and within close proximity. The same spatial configuration (3 × 6 m) and orientation (following the maximum gradient) were used to ensure comparability. This pairing strategy aimed to isolate the effect of EB presence as the primary differentiating factor between treatments.
In total, 404 test areas were identified across both EB and Non-Intervention (NI) zones, resulting in 808 individual plots segment—one located above (upstream) and one below (downstream) the barrier.

2.4. Statistical Analysis

Based on the information derived from the Sentinel-2 imagery, three key aspects were analyzed: (1) differences in NDVI magnitude; (2) trends in NDVI values over the four-year period; and (3) seasonal phenology. For each scenario (treatment and year), various centrality and dispersion parameters were extracted to characterize the spatiotemporal dynamics. Statistical analysis of differences between the two treatments was conducted using ANOVA and the Bonferroni test (95% confidence level).
The non-parametric Mann–Kendall test (MK, statistical Z) and the Theil–Sen slope were applied to evaluate the significance of spectral trends [,]. Both methods were performed using a function package: http://cran.r-project.org/package=wq (accessed on 16 November 2023) and the macros MAKESENS []. The annual vegetation phenology cycle, derived from NDVI over a 9-month period (excluding November, December, and January), was analyzed considering key phenological phases of vegetation dynamics on an annual scale: (1) Greenup, the start of the greening season (Start of Season, SOS), which marks the onset of photosynthetic activity; (2) Maturity, the peak of the growing season, defined as the date when the plant’s green leaf area reaches its maximum; (3) Senescence, the end of the season (End of Season, EOS), which indicates the point at which photosynthetic activity and green leaf area begin to rapidly decline.
On the other hand, based on the information obtained from the RPAS imagery (height and NDVI), analyses were conducted to assess whether there were differences between the influence areas (plots) located upstream and downstream of stack accumulations, namely Test Areas-EB and Test Areas-NI. These differences were calculated individually for each test area (or observation) as Diff = downstream − upstream, both for EB-treated and untreated (NI) plots.
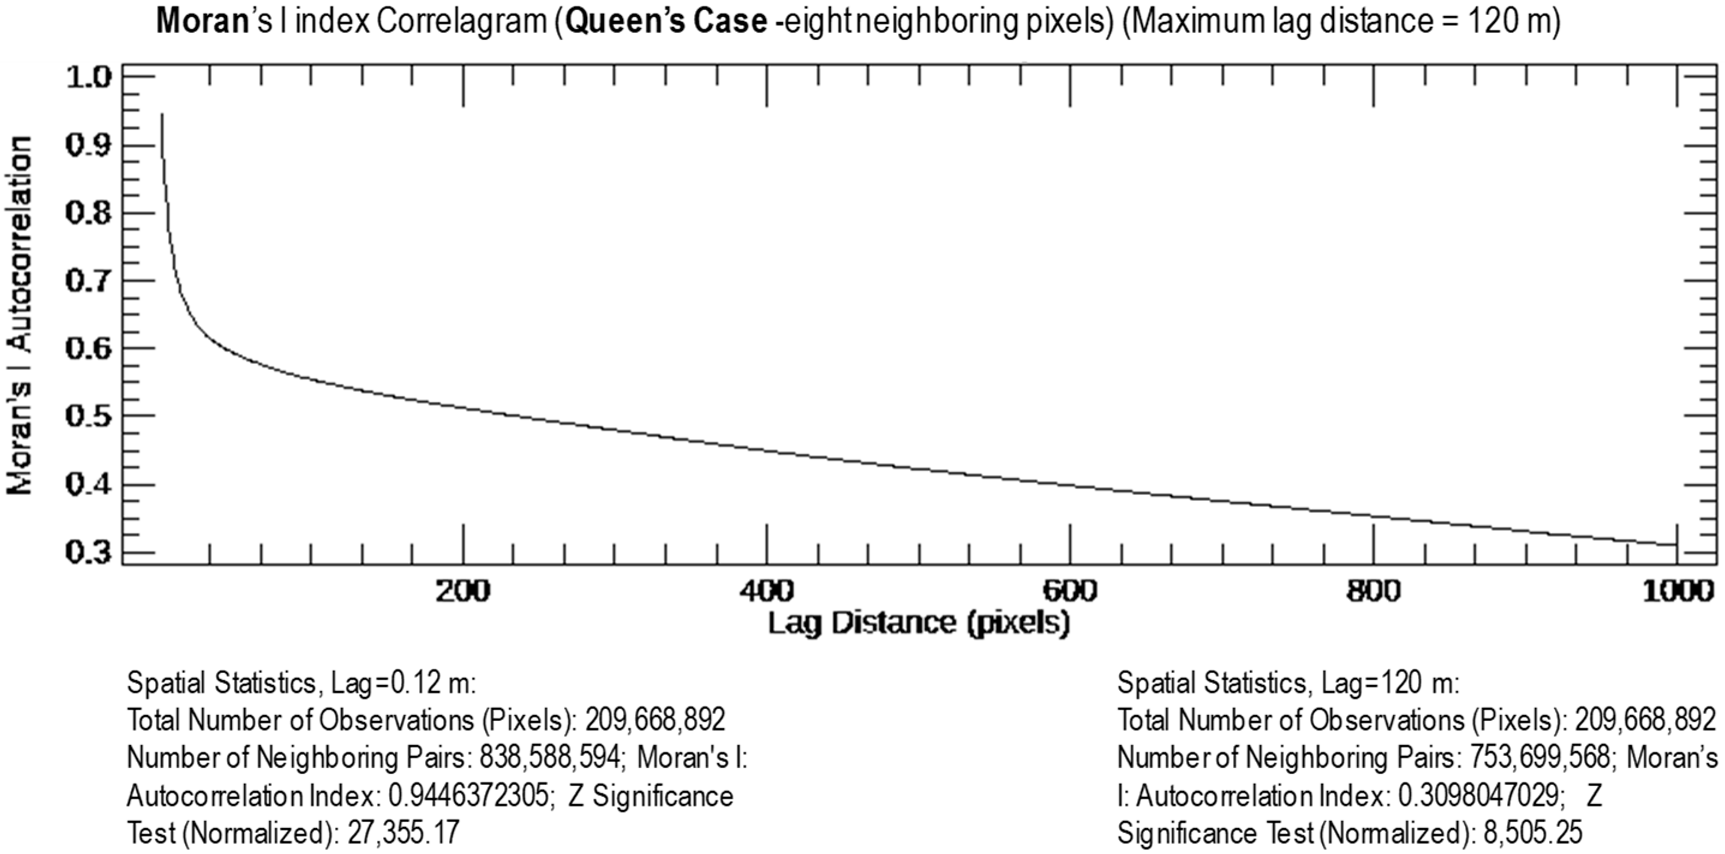
Prior to statistical modeling, we assessed the degree of spatial autocorrelation in the NDVI dataset using Moran’s I index, calculated over all sampled pixels with a lag distance of 120 metros. The results indicated a high and statistically significant autocorrelation (Moran’s I index = 0.3098; p < 0.001) (Appendix A), consistent with the spatially continuous nature of the variables and the resolution of the imagery. Subsequently, two complementary statistical approaches were employed to determine the effect of EB:
Linear Mixed Models (LMM): Models were fitted for each variable using the lmer() function from the lmerTest package. The Treatment factor was included as a fixed effect to assess systematic differences between EB and NI, while the relative position within each test area was included as a random intercept to account for spatial dependence between observation pairs. Degrees of freedom were approximated using the Satterthwaite method.
Permutation Tests: Non-parametric permutation tests (oneway_test () from the coin package) were applied to assess the significance of differences in Diff between treatments, without assuming normality of the data. A total of 10,000 resamplings were generated to estimate empirical p-values.
Additionally, the Pearson’s correlation coefficients (r)- were used to assess the degree of agreement between variables measured in the test areas. All analyses were performed using R version 4.4.0 or higher.

3. Results

3.1. Analysis of NDVI Values over Time (2016–2019)

The temporal distribution of the NDVI values during the study period (2016–2019) is presented, highlighting the main trends and phenological characteristics associated with the regenerated vegetation at the EB and NI sites. Descriptive statistics for the NDVI values, derived from multitemporal Sentinel-2 imagery, are provided in Table 3.
Table 3. Descriptive statistics of the distribution of NDVI values by treatment and year; EB (Erosion Barriers); NI (Non-Intervention).
Despite the years that have passed since the EB installation, the highest average values are consistently observed at the NI site (~0.33), although the values at the EB sites (~0.31) are comparable. Variability is also similar between both sites, with a coefficient of variation of approximately 14.5%.
Overall, the average NDVI values across all years and treatments indicate moderate to low vegetation cover, particularly in 2016, when the EB installations were completed just six months post-fire. However, significant differences between sites were detected for the entire period and for each year individually, with the exception of 2016 (Table 4).
Table 4. Analysis of the NDVI differences between the categories (EB and NI) with a confidence interval of 95%.
Over the 4-year period, both sites exhibited significant positive trends in NDVI values (Kendall’s tau = 0.635 for NI and 0.676 for EB; p < 0.0001). Nevertheless, the Sen’s slope values (0.005 in both cases) indicate that the rate of increase was relatively low (Table 5).
Table 5. Trend analysis of NDVI values by treatment (2016–2019) using Kendall’s tau and Sen’s slope; EB (Erosion Barriers); NI (Non-Intervention).
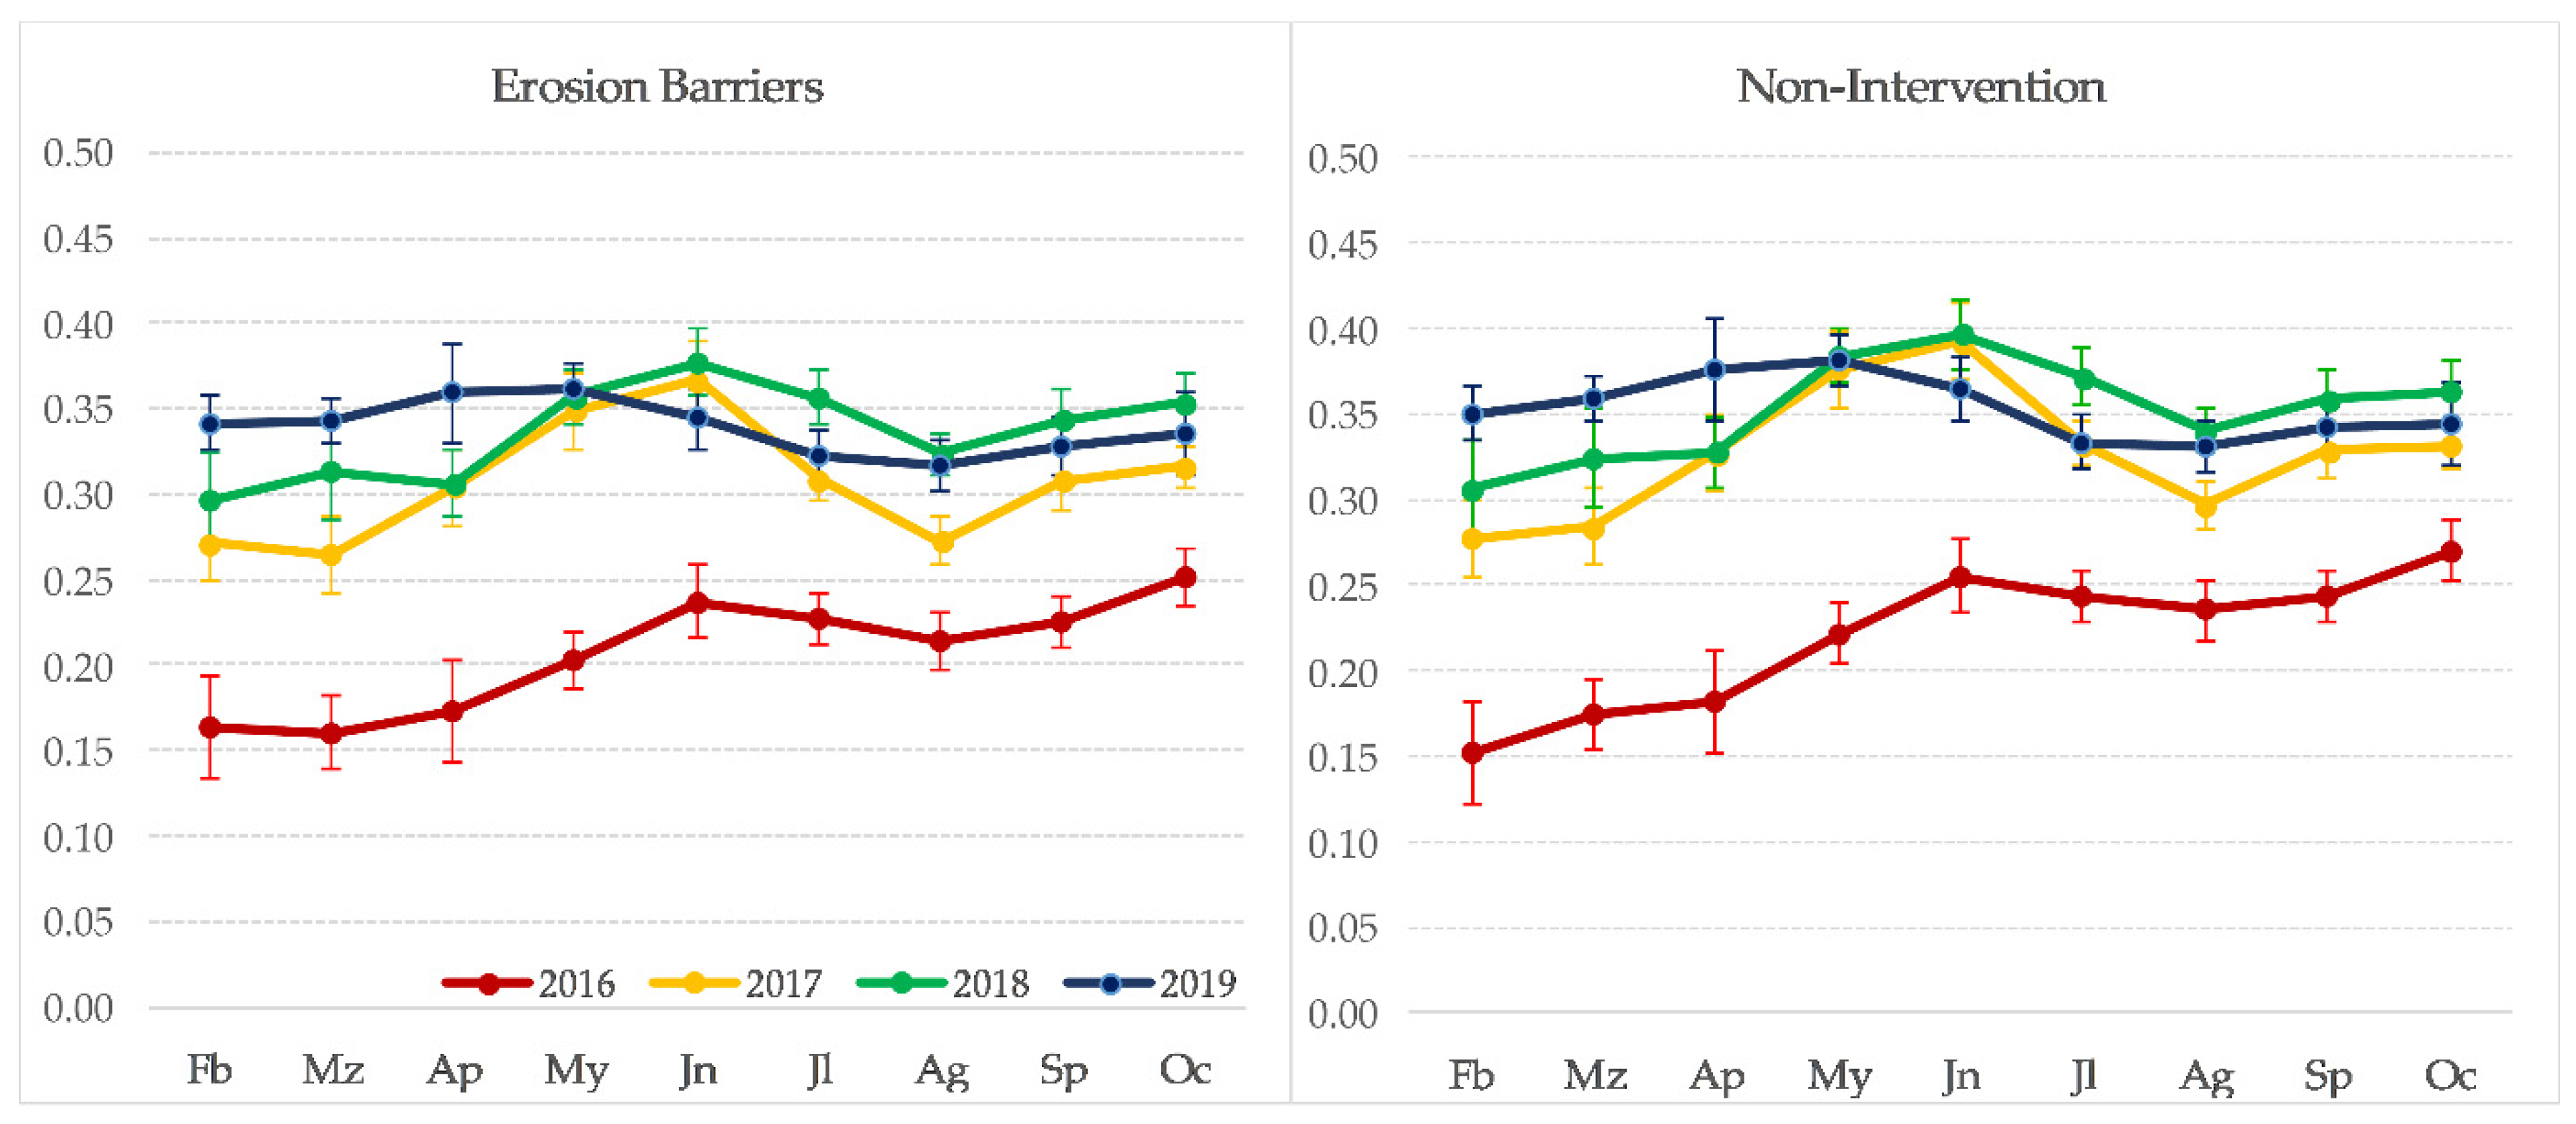
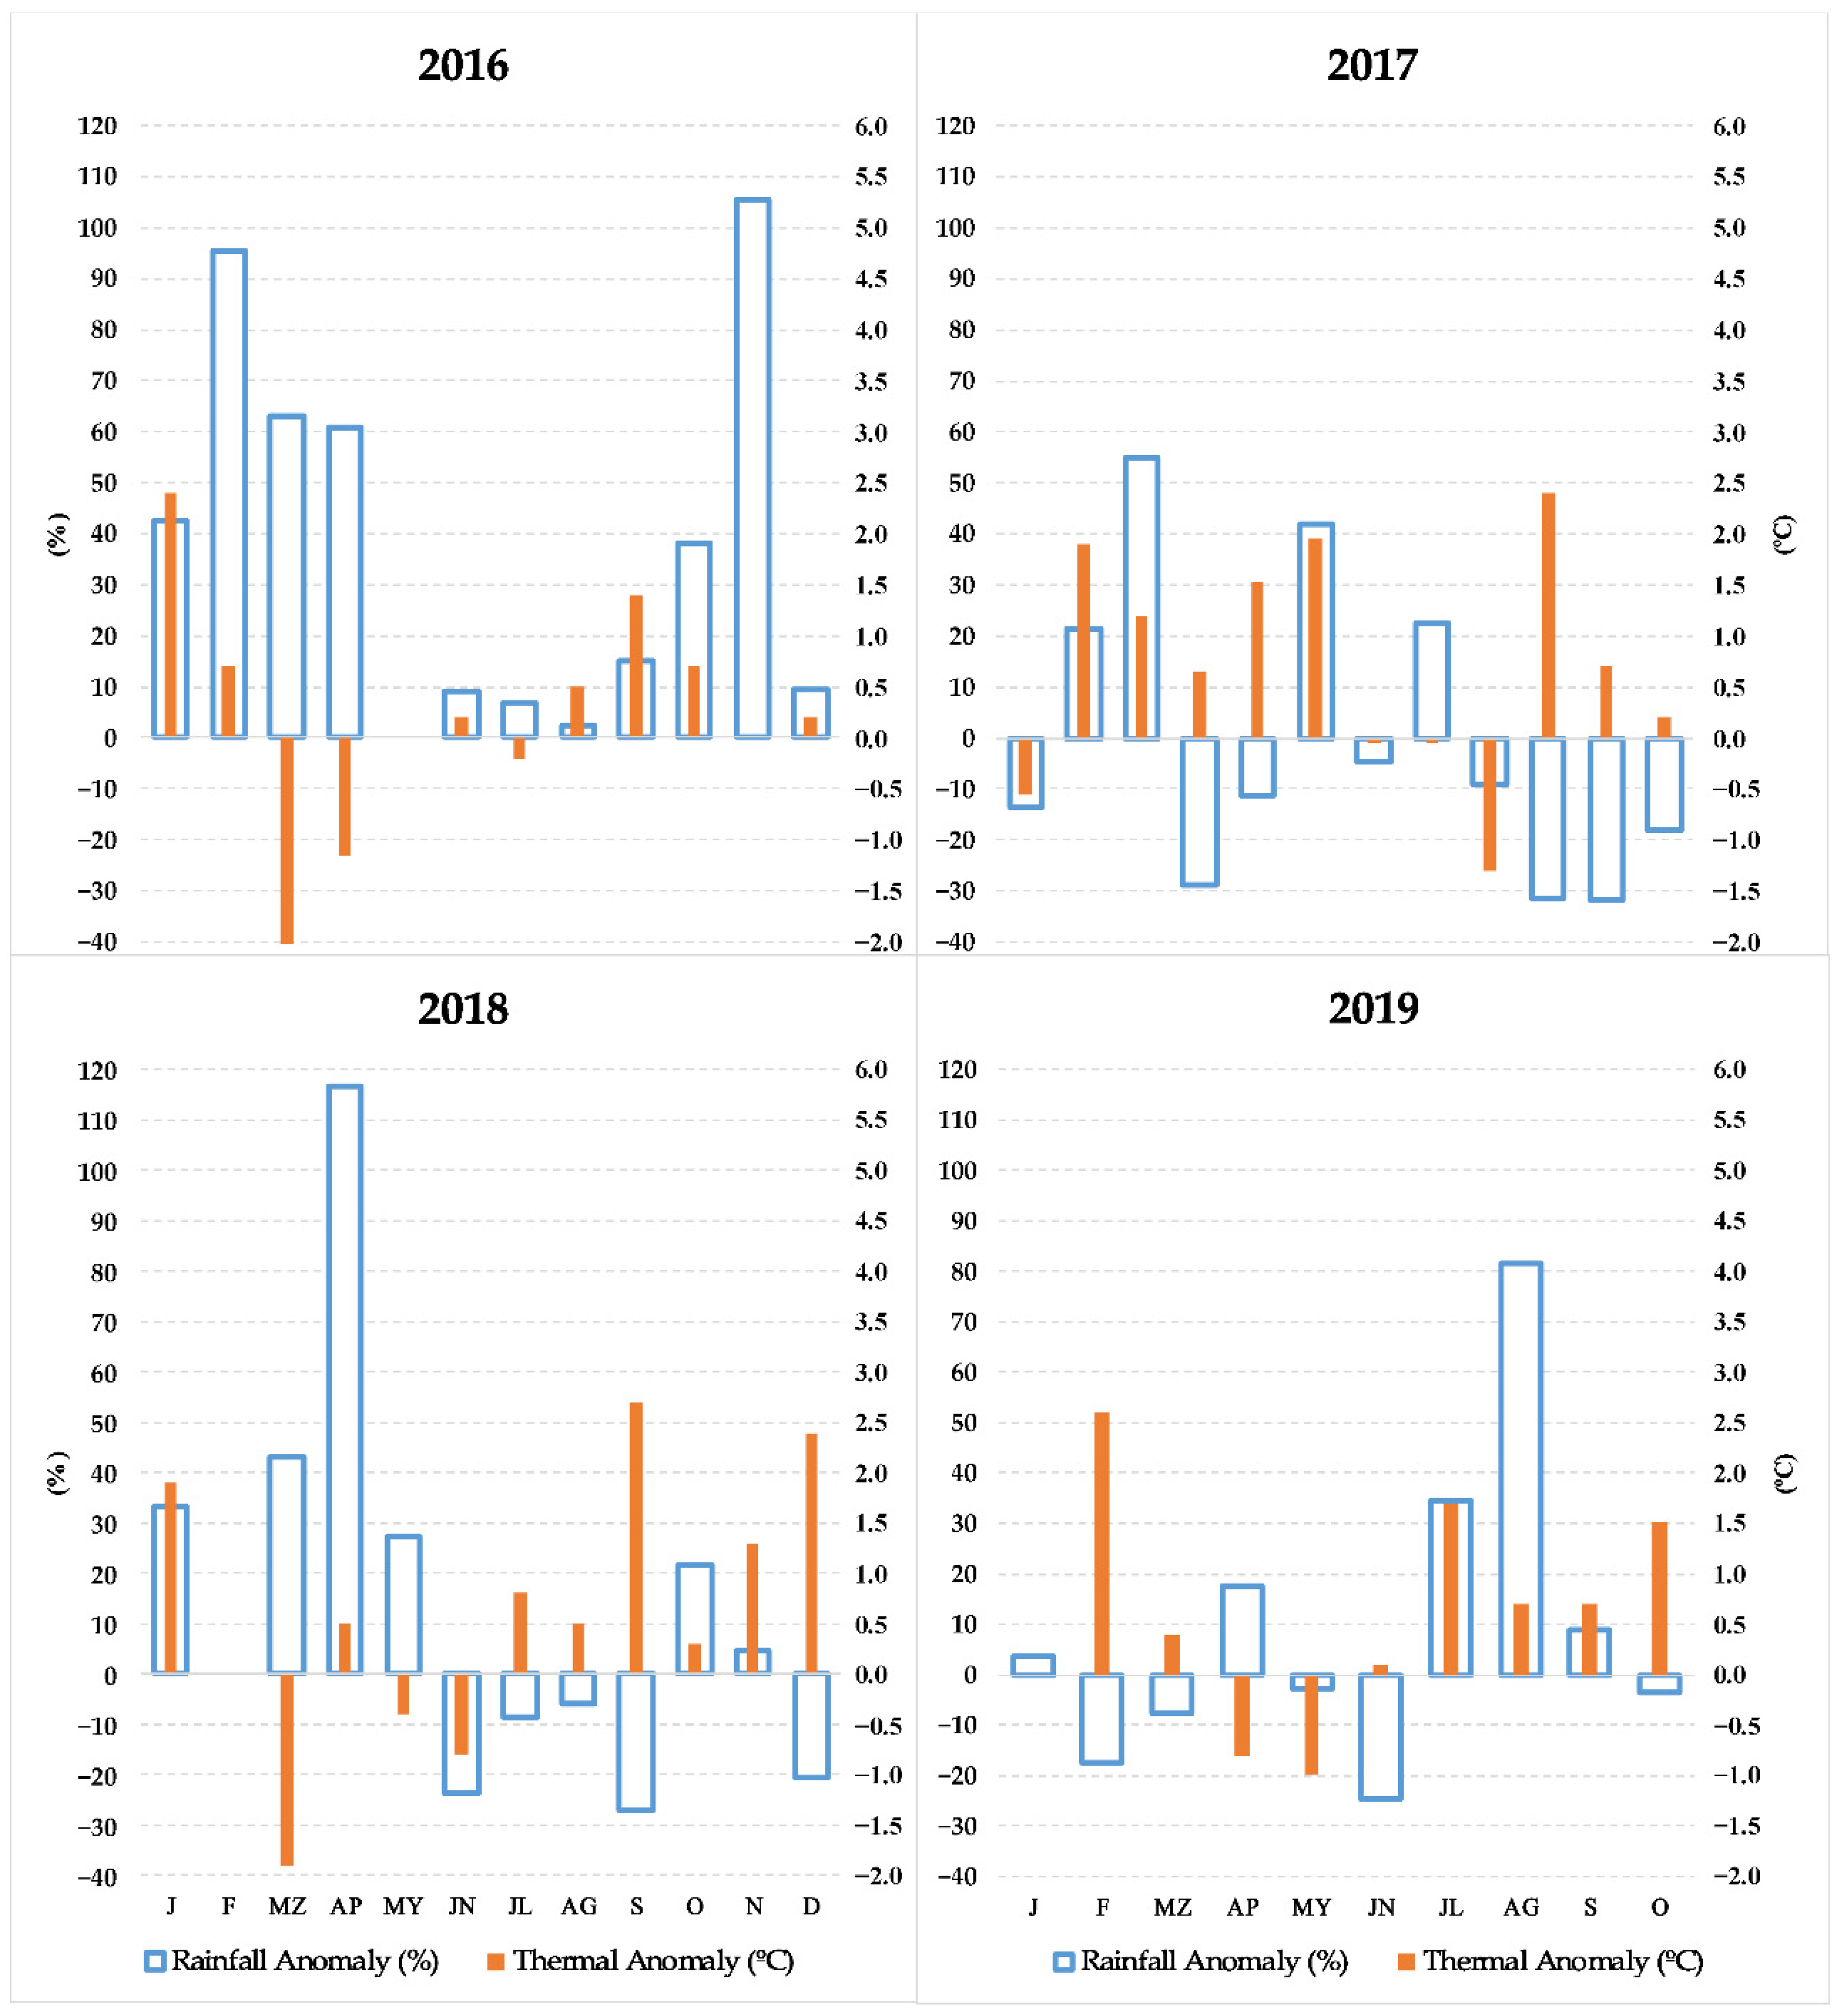
In terms of phenological profiles, very low NDVI values (0.21) were observed in 2016—similar to those in areas devoid of vegetation—with minimal seasonal variations, marked by a slight increase in June (Figure 5). However, a positive trend in vegetation recovery was evident at both sites, reflecting the typical recovery process observed in Mediterranean ecosystems affected by wildfires. Rainfall anomalies were noted that year, particularly positive deviations in spring, October, and especially November, consistent with the equinoctial rainfall patterns of the region (Figure 6). These rainfall patterns likely contributed positively to vegetation regeneration following the fire and the installation period.
Figure 5. Left: Temporal distribution of mean NDVI values with 95% confidence intervals for EB (2016–2019). Right: Temporal distribution of mean NDVI values with 95% confidence intervals for Non-Intervention areas (2016–2019).
Figure 6. Temporal distribution of thermal and rainfall anomalies (2016–2019).
In the second year (2017), NDVI values increased due to the vegetation recolonization process, with a noticeable narrowing between treatments. Compared to 2016, both the EB and NI areas experienced an approximate 140% increase in NDVI values. Both sites began to exhibit a phenological pattern typical of Mediterranean communities, regulated by temperature seasonality, water availability, and solar radiation. Two prominent peaks were observed: the first (maturity) in June and the second in autumn, despite negative rainfall anomalies recorded from August (Figure 6). Photosynthetic activity (SOS) began in March, with the lowest production observed in February and during the summer months. From a thermal-rainfall perspective, no significant anomalies were noted throughout the year. However, autumn was notably warmer and drier, and spring was characterized by alternating dry and wet months.
In 2018, both sites recorded a further increase in NDVI values (around 156%), with the difference between them decreasing. June remained the month with the highest vegetation production, followed by May and July. Climatically, a significant rainfall anomaly occurred in spring, particularly in April, coinciding with below-average temperatures for that period (Figure 6).
In the final year of the study (2019), NDVI growth stabilized and the differences between treatments were substantially reduced. There was a notable change in phenological profiles, with higher NDVI values observed between February and April, compared to other months, and maturity shifted to May. Climatically, 2019 was unique with a negative rainfall anomaly in spring, coupled with a particularly warm and wet summer. However, additional factors, such as species-specific water access strategies, soil moisture storage, and vegetative vigor from previous periods, also modulate vegetation response and buffer the effect of individual climatic events.

3.2. Differences Between Influence Areas of the EB

The descriptive statistical parameters related to NDVI and height values derived from RPAS imagery are shown in Table 6, focusing on the influence areas closest to EB at a small scale. The NDVI averages are approximately 0.4 in both plots surrounding the EB (upstream and downstream), as well as in the plots of Test Areas-NI, although the latter exhibits greater variability. These values are slightly superior to those obtained from Sentinel images on 6th August 2019, two days after carrying out the flight, due to the effects of the different spatial resolution and the pixel mixing effect (Appendix B).
Table 6. Statistical summary of the test areas (EB and NI) for the variables NDVI and vegetation height (m).
However, significant differences in NDVI are identified between the distributions of the plots in Test Areas-EB. The mixed model indicated that the mean value of the difference (Diff = downstream − upstream) was significantly more negative in plots with EB than in non-intervened plots (Estimate = −0.0226, p = 0.0088) (Table 7), and the permutation test confirmed the statistical significance of this difference (Z = −2.612, p = 0.0087).
Table 7. Results of the linear mixed-effects model for vegetation NDVI and height difference (downstream − upstream) as a function of treatment (EB = Erosion Barriers; NI = Non-Intervention).
Additionally, a greater degree of correlation is detected between plots that are not separated by stacks, compared to those separated by fences, i.e., higher photosynthetic activity is observed upstream in Test Areas-EB compared to the plots in Test Areas-NI, where differences between plots are less pronounced.
Regarding vegetation height, average values are around 27–28 cm in Test Areas-EB, with no evident differences between plots (upstream vs. downstream). In Test Areas-NI, vegetation height is notably greater (~35 cm), although the mixed-effects model indicated that the difference between treatments was not statistically significant (Estimate = −0.048, p = 0.103). The permutation tests also did not detect a significant difference (Z = 1.568, p = 0.1248).
Therefore, the effect of stacking is not substantial within test areas, but it does have an impact at a broader scale, indicating that stack formation influences the height of regenerating vegetation. In terms of dispersion, the parameters are less pronounced in the influence areas of the EB compared to Test Areas-NI, following a similar pattern to that observed for NDVI values.
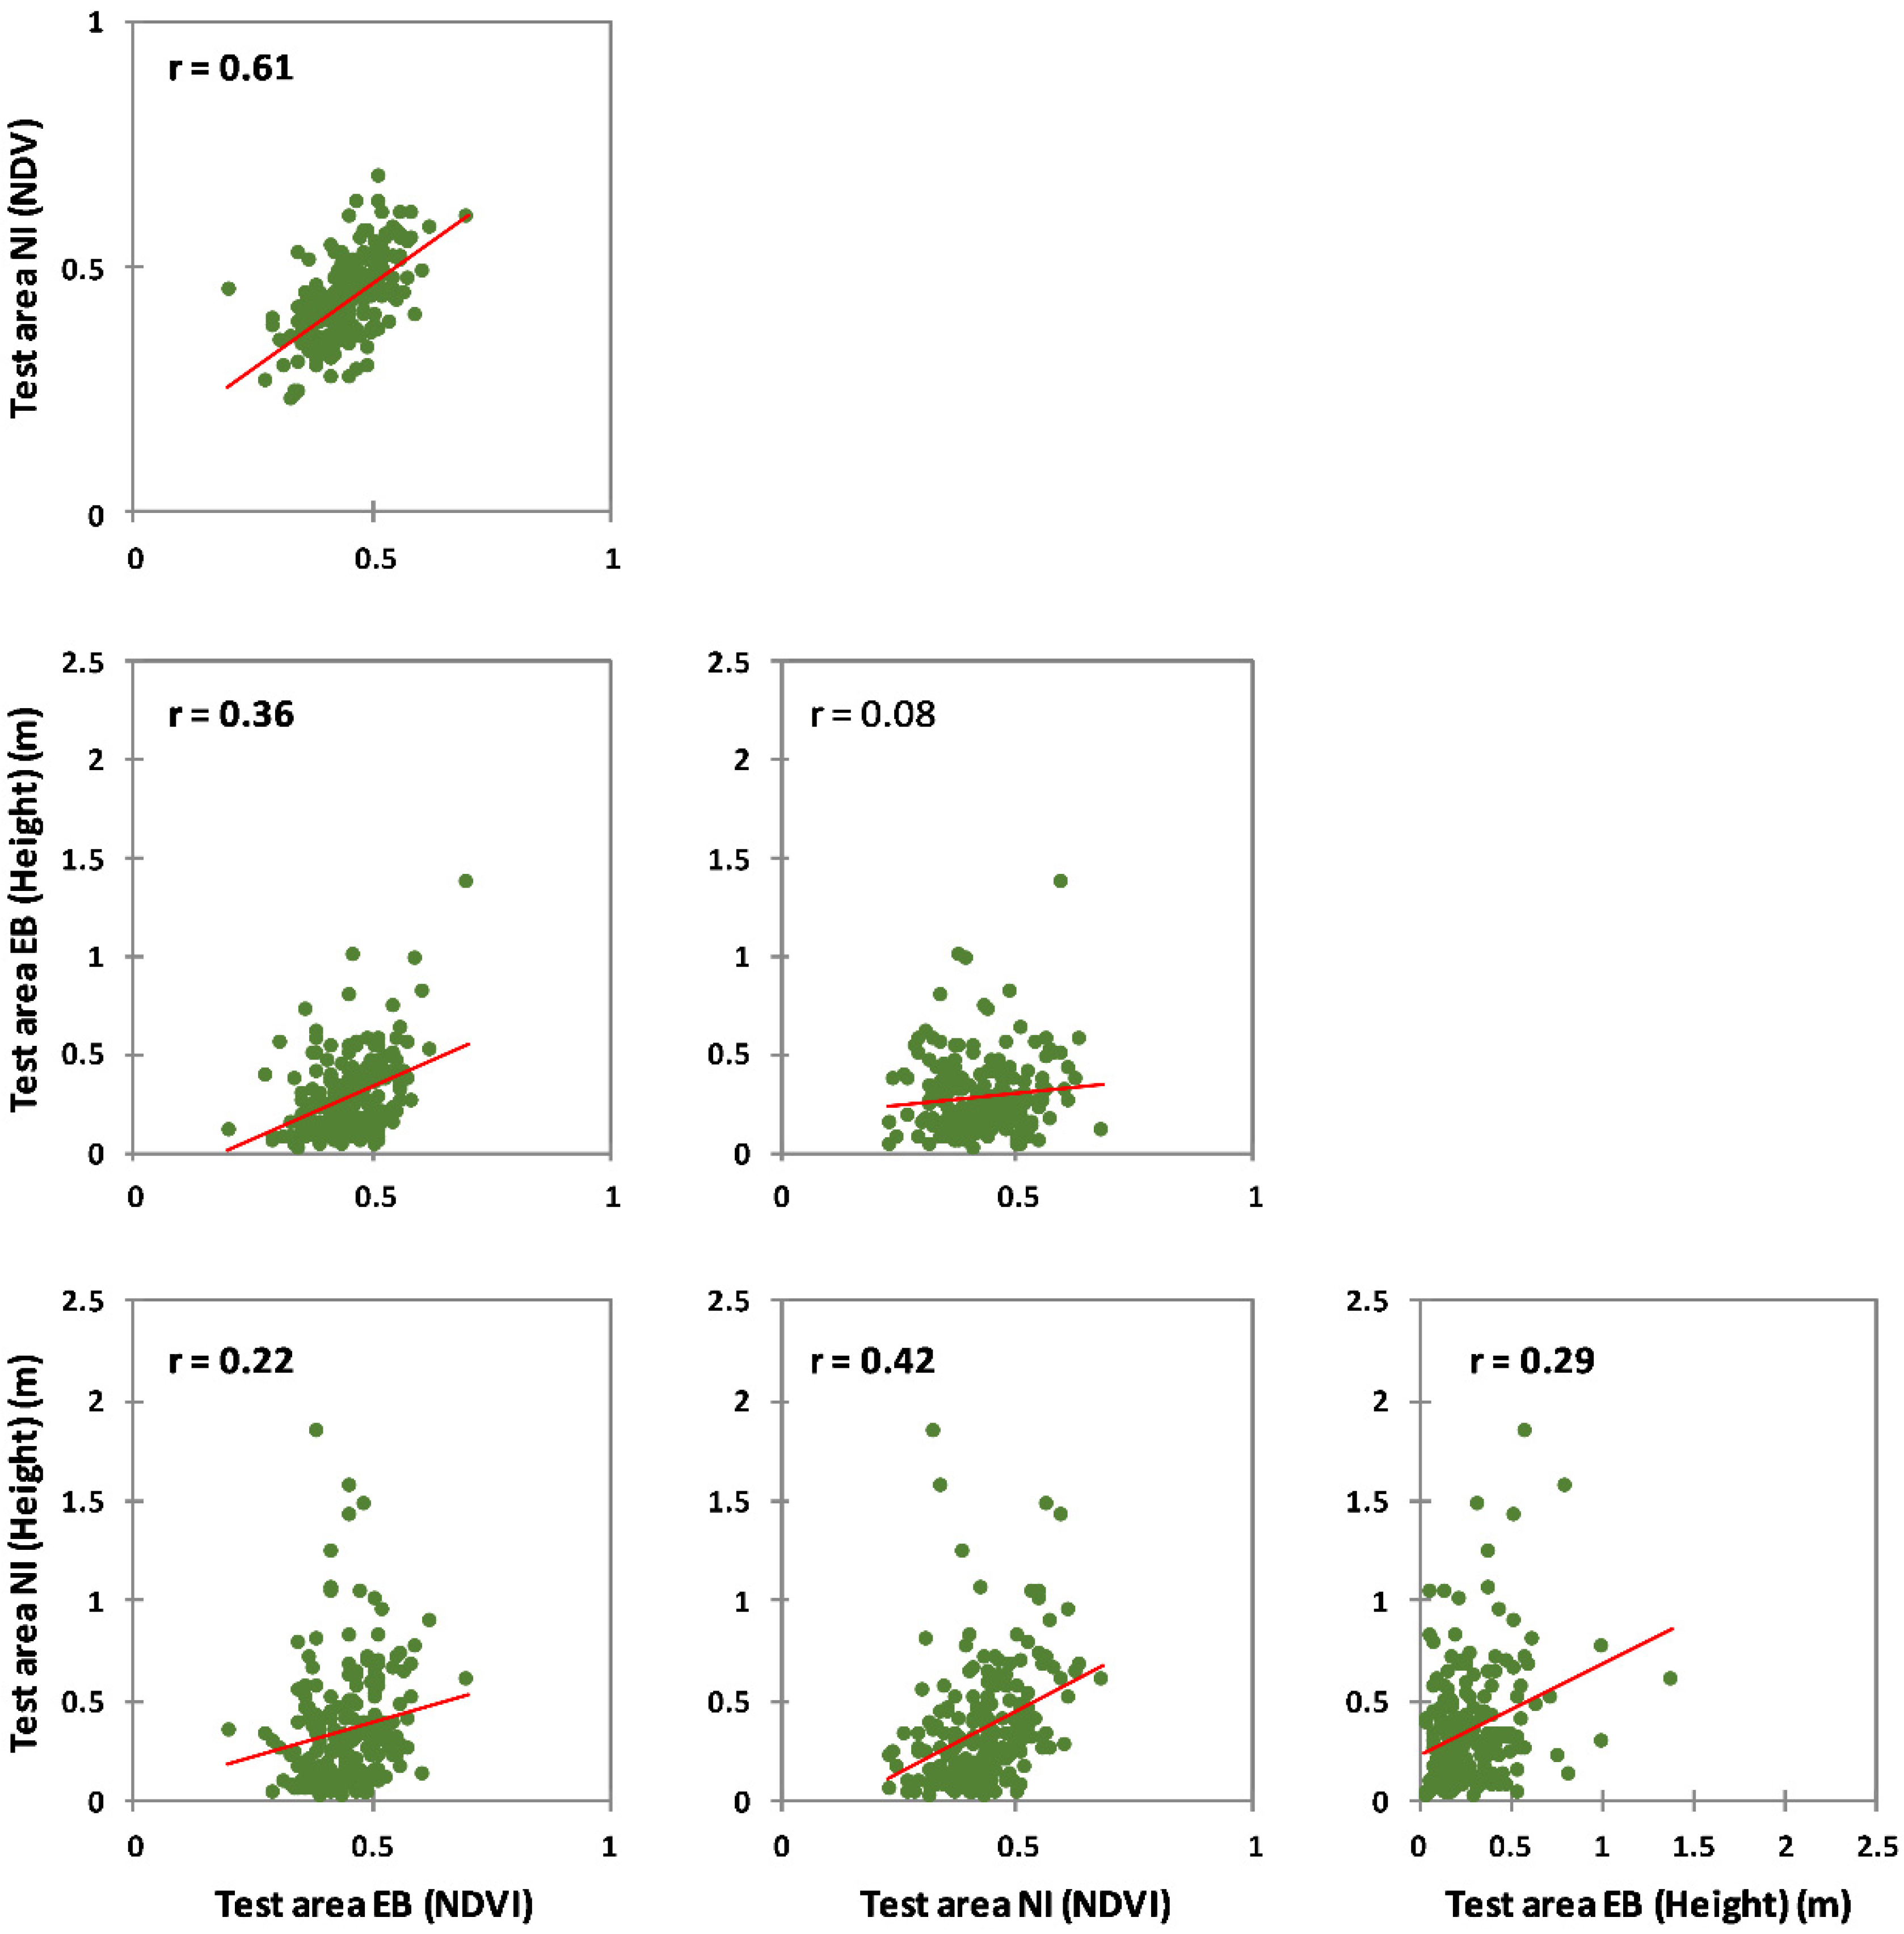
Figure 7 shows the degree of association between the test areas (EB vs. NI) for NDVI and vegetation height. The strongest association was observed for NDVI between the two areas (r = 0.61). In contrast, the relationships between NDVI and height within each area were generally weak, with r = 0.42 in EB and r = 0.36 in NI. Finally, when crossing variables between areas, the r values dropped below 0.22, confirming the absence of consistent linear associations. This suggests that erosion barriers had a stronger influence on structural attributes of vegetation recovery (height) than on spectral greenness (NDVI), reinforcing the idea that NDVI and structural metrics provide complementary perspectives on treatment effects.
Figure 7. Scatter plots for the test areas (EB and NI) showing the relationships between NDVI (X-axis) and vegetation height (m) (Y-axis). R values in bold indicate statistically significant correlations (α = 0.05). Red lines represent the fitted regression line.

4. Discussion

Erosion barriers are among the most widely implemented post-fire emergency stabilization treatments []. However, their effectiveness remains inconclusive due to interactions with other factors such as fire severity, rainfall characteristics after fires or the way in which the stacks are placed (e.g., degree of contact with the ground) [,,]. In additions, their effectiveness is generally temporary, and in many cases, their impact on reducing erosion decreases markedly after the first post-fire year, raising concerns about their long-term cost-effectiveness [].
This study compares NDVI values between different post-fire management areas (NI & EB), focusing on trends and the seasonal phenology of vegetation regeneration over a four-year period. Additionally, it analyzes the effect of EB on vegetation at a more accurate spatial scale and at a specific point in time, considering their influence zones—specifically, upstream and downstream of the stacked burned wood. The working hypothesis posits that the disruption of overland flow and the increased retention of sediment may enhance vegetation cover. This effect could be attributed to improvements in soil conditions within the influence zones located upstream of the erosion barriers.

4.1. Monitoring Post-Fire Recovery at EB and NI Sites Using Sentinel-2 Imagery (2016–2019)

Over the four-year analysis period, albeit limited, differences between the two management treatments (EB and NI) were identified using Sentinel-2 NDVI time-series data, which serves as a valuable proxy for monitoring vegetation dynamics and change []. In general, NI areas exhibited higher NDVI values compared to EB areas, although the differences were relatively small and not statistically significant (p-value > 0.05).
When integrated with findings from other studies, our results suggest that areas without post-fire intervention generally exhibit more favorable conditions for vegetation regeneration. This may be due to the absence of disturbances caused by the machinery used in hydrological and forest restoration efforts. Accordingly, through a similar methodology and using NDVI as a proxy for vegetation recovery, Vlassova & Pérez-Cabello [], demonstrated that in Pinus halepensis and Quercus coccifera ecosystems, post-fire recovery is higher in Non-Intervention areas than in those where different practices of logging were performed []. In the EB areas of the Luna Fire, residual wood was relocated (e.g., cordons, slash, and stacked piles), though not in a manner that could be considered overly disruptive to the soil. However, these activities may have had negative effects on vegetation regeneration, at least during the initial stages [], due to alterations in soil characteristics or a reduction in the surface area available for regeneration in certain locations.
Monitoring vegetation trends and intra-annual regrowth stages has enabled us to characterize post-wildfire vegetation dynamics in the short term, providing critical insights into ecosystem functioning. Our results highlight two overarching processes in both Test Areas: (1) the gradual adaptation of vegetation to a phenological pattern more typical of Mediterranean communities, dominated by thickets and pastures; and (2) a positive growth trend over the four-year period across both management approaches. However, the increasing seasonal component observed throughout this period appears to be disrupted in 2019, when phenological cycles become less distinct compared to 2017 and 2018. This disruption is characterized by unusually high values during winter and spring, followed by a decline in June and subsequent stabilization for the remainder of the year.
While the increase in NDVI during the winter and spring months could be attributed to the inertia of the vegetation recovery process in burned areas, the pattern observed from June 2019 onward is less straightforward to explain. One possible explanation involves the specific thermal and precipitation patterns of that year. In particular, a relatively dry spring and June, followed by an unusually wet summer, may have contributed to the stabilization of NDVI values until autumn.
However, it is important to emphasize that there is no direct or necessarily linear relationship between annual climatic anomalies and NDVI values, as the latter can be influenced by multiple additional factors that modulate vegetation response. In particular, plant species’ ability to access water depends not only on surface water availability or short-term precipitation, but also on eco-physiological traits such as root system depth and structure, as well as on the plant’s reserve status and vegetative vigor from previous months. Preceding climatic conditions can significantly affect soil water content and, consequently, vegetative response during the year under analysis. Therefore, an analysis based solely on monthly temperature or precipitation anomalies may be insufficient to fully explain NDVI variations. Appendix D includes the results of an additional correlation analysis (Spearman), showing the lack of a relationship between NDVI values and monthly pluvio-thermal anomalies, thereby reinforcing the complexity of the climate–vegetation response linkage in the context of this study.
Additionally, the reduced seasonality of vegetation in 2019 could be linked to shifts in the species composition of the regenerating plant communities. In this regard, the initial stages of recovery after the fire are driven primarily by herbaceous plants with short life cycles [], which typically reach their peak within 1–5 years, after which both their presence and diversity begin to decline. In contrast, shrubs and woody species exhibit a more consistent growth pattern during the first five years, with their presence stabilizing thereafter []. Although we do not have a complete sequence documenting changes in vegetation composition over these years, the use of high-resolution imagery allowed us to identify the dominant species in the burned areas at the end of the period analyzed in this study. In this regard, the prevailing plant formations (Quercus coccifera, Juniperus oxycedrus, Pinus halepensis, etc.) suggest that the transition toward more woody vegetation could be the factor that best explains the phenological profile change observed in 2019.
Despite the challenges of monitoring inter-annual vegetation dynamics of perennial grasses with remote sensing due to their short growing season, as highlighted by Villarreal et al. [], the NDVI values in the treatment areas and the inter-annual variability of phenological profiles reveal the immaturity of plant communities. They also underscore the sensitivity of colonizing communities to thermal and rainfall variability. The most notable finding is undoubtedly the gradual standardization of vegetation recovery, regardless of the treatment type applied, both in terms of the magnitude of NDVI values and the characteristics of the phenological cycle.

4.2. Differences Between EB Zones of Influence

The influence areas of the EB showed slightly higher values than those recorded in Test Areas-NI, but were lower when considering the variable of vegetation height. Specifically, within the Test Areas-EB, there were significant differences in NDVI values between the influence areas, resulting in a greater degree of regeneration in plots located upstream of the stacks. Therefore, these results suggest a modest but positive effect of the EB structures, particularly in the areas upslope of the stacks. By capturing sediment, these barriers may contribute to the improvement of soil and hydro-geomorphological conditions, such as increased moisture levels, nutrient availability, and seed accumulation, all of which are factors known to support vegetation recovery [,]. Therefore, EB not only serve a physical function but also act as a catalyst for vegetation regeneration and for improving the microclimatic conditions of the affected soil.
In this regard, Rey et al. [] observed an improvement in soil moisture, which, in turn, may promote vegetation regrowth. Similarly, Gómez-Sánchez et al. [] reported higher organic material values in areas treated with restoration actions compared to burned areas without intervention. However, both types of areas were found to be equivalent in terms of vegetation cover and diversity [].
Nevertheless, the effectiveness of EB should be interpreted with caution. This study was conducted in a small, morphologically homogeneous area with low edaphic variability, which limits the generalizability of the findings and precludes the formulation of specific recommendations regarding optimal slope ranges, soil types, or vegetation recovery stages for EB implementation. Several factors may have constrained the observed effectiveness, including the imperfect fit of the barriers to the soil surface and the delayed timing of the intervention, potentially reducing their influence on vegetation recovery. Despite these limitations, the results provide valuable evidence of the potential ecological benefits of EB in post-fire Mediterranean environments, particularly in enhancing photosynthetic activity, even if the overall magnitude of their impact remains moderate.
Regarding vegetation height, the comparisons yield varying results. Firstly, the values in Test Areas-EB were slightly lower than those recorded in Test Areas-NI. This distribution pattern of vegetation height could be explained by a greater alteration due to the use of necromass from shrubs and subshrubs to construct cordons, which may inhibit the recovery of this layer. Secondly, no significant differences in vegetation height were found between plots in any of the test areas, whether located upstream or downstream of the stacks. This suggests that the position relative to the stacks had no measurable effect on vegetation height. Moreover, the vegetation composition in EB-treated areas aligns with the observed lower vegetation height, due to the dominance of herbaceous and subshrub species, whereas NI areas are characterized by a higher presence of taller woody species (Appendix C).
Furthermore, the study highlights the potential of RPAS-based methodologies for the analysis and monitoring of such post-fire infrastructures. In relation to other studies that have applied similar methodologies in burned areas (based on RPAS-derived information), the observed increase in photosynthetic activity (NDVI) is consistent with the findings of van Blerk et al. [], who used UAVs to monitor ultra-fine-scale vegetation changes in the early post-fire period. Similarly, Pádua et al. [] demonstrated the capacity of UAV multispectral sensors to detect vegetation structure and survival following wildfire in Portugal. These studies reinforce the value of UAV-based monitoring to detect subtle spatial variations in regeneration linked to post-fire interventions. Martínez et al. [] detected variability in vegetation cover between burned and unburned areas, although they did not find significant advantages for evaluating the effectiveness of post-fire treatments—such as log erosion barriers (LEBs) and contour-felled log debris (CFDs)—in a forest in Central Eastern Spain. However, as noted by Fernández-Guisuraga et al. [], UAVs may present limitations in assessing vegetation when it is sparse or structurally heterogeneous.
In summary, although the primary objective of the erosion barriers is not strictly to enhance vegetation regeneration, the stacks do result in slight but significant differences between the plots, depending on their position relative to the stacks (upstream or downstream). Increased photosynthetic activity is observed upstream, likely due to the disruption of laminar flow and the accumulation of sediment. Furthermore, the benefits derived from the EB extend beyond hydrogeomorphological improvements, as they serve as a method to manage residual necromass, which can also provide organic contributions to the soil through decomposition [,].
This study contributes to a growing body of UAV-based research demonstrating that erosion control measures can also yield ecological co-benefits, especially when assessed with high-resolution remote sensing tools. Our approach, integrating RPAS photogrammetry with multitemporal satellite data, may serve as a replicable model for similar assessments in other post-fire Mediterranean or temperate ecosystems.

5. Conclusions

Remote sensing imagery, with varying spatial and temporal resolution, has been identified as an effective tool for understanding ecosystem responses to the installation of erosion barriers. It provides valuable insights into vegetation recovery patterns and contributes positively to sustainable forest management. More specifically, time-series NDVI satellite data serve as a key resource for detecting trends and seasonality in vegetation changes over time. Additionally, RPAS platforms enable the acquisition of high-resolution imagery, allowing for detailed mapping of surface cover within the influence areas of EB practices.
In the short term, one of the main consequences of installing the erosion barriers is a slight decrease in NDVI values compared to those from Non-Intervention sites. However, the seasonal phenological profiles and inter-annual trends display a strong similarity. In this context, the inter-annual variability in the phenological profiles reflects the initial stage of the vegetation community in the recovery process and the sensitivity of colonizing communities to thermal and rainfall anomalies. Over the four-year period, growth stabilized and intra-annual differences decreased due to an initial phase in which the bush component of the regeneration dominated the herbaceous zones.
Regarding the operational effects of erosion barriers on areas located upstream and downstream of the stacks, the influence areas upstream exhibited higher NDVI values than those downstream. This could be due to the greater accumulation of seeds, nutrients, and moisture in upstream zones. In contrast, this pattern was not observed in areas without EB. However, we found that the vegetation in the EB areas was shorter, likely because the woody structures of the thickets were used in the construction of the barriers.
The study provides indirect insight into the operation and outcomes of erosion barriers. The recovery process in post-fire treatment areas exhibits varying degrees of effectiveness, which necessitate monitoring to track environmental changes over time and to develop more effective management strategies.

Author Contributions

Conceptualization, F.P.-C., C.B.-S. and R.M.; methodology, F.P.-C., C.B.-S. and R.M.; software, C.B.-S., J.A.-P. and F.P.-C.; formal analysis, F.P.-C.; research, F.P.-C., C.B.-S. and R.M.; resources, J.A.-P. and C.B.-S.; data curation, C.B.-S. and J.A.-P.; writing—original draft preparation, F.P.-C., R.M. and C.B.-S.; writing—review and editing, F.P.-C., R.M. and J.A.-P.; supervision, J.A.-P. All authors have read and agreed to the published version of the manuscript.

Funding

This research was funded by MCIN/AEI/10.13039/501100011033, grant numbers PID2020-118886RB-I00 and PID2024-160889OA-I00.

Data Availability Statement

The original contributions presented in the study are included in the article, further inquiries can be directed to the corresponding author.

Acknowledgments

The present article has been carried out in collaboration with TecniTop S.A., a company specialized in geomatics, topography, 3D scanners, and professional drones.

Conflicts of Interest

The authors declare no conflicts of interest.

Appendix A. Spatial Correlogram of NDVI Values Based on Moran’s I
Remotesensing 17 03422 i001

Appendix B. Exploratory Comparative Analysis of NDVI Values Derived from Both Platforms (RPAS & Sentinel-2)

Table A1. Descriptive statistics of NDVI values.
NDVIMinimumMaximumMeanStd. Deviation
NI_RPAS0.15170.76780.42910.0971
EB_RPAS0.12890.74770.44730.0836
EB_SENTINEL0.25960.37420.31610.0358
NI_SENTINEL0.26570.39070.33040.0393
Table A2. Comparison of K samples (Kruskal–Wallis test).
NDVINI_RPASEB_RPASEB_SentinelNI_Sentinel
NI_RPAS10.0130<0.0001<0.0001
EB_RPAS0.01301<0.0001<0.0001
EB_Sentinel<0.0001<0.000110.3798
NI_Sentinel<0.0001<0.00010.37981

Appendix C. Distribution by Treatment (NI & EB) of Vegetation Types Obtained Through Supervised Digital Classification of High-Resolution GeoSAT-2 Imagery

Bare
Ground
Quercus
coccifera
Pinus
halepensis
Juniperus
oxycedrus
Mixture of Brachypodium retusum & Thymus vulgaris
EB1.96%19.83%6.70%7.82%63.69%
NI0.00%27.07%19.23%11.60%42.02%
Imagery provided under the IGN/CNIG–CDTI Collaboration Agreement. Classification used the Maximum Likelihood algorithm with training areas from orthophotos, false-color composites, and field data. Accuracy, validated with GNSS ground-truth data (2023–2024) and orthophotos, exceeded 90% overall (Kappa > 0.85). © GEOSAT.

Appendix D. Correlation Matrix (Spearman)

VariablesMean (ndvi)Rainfall Anomaly
(%)
Thermal Anomaly (°C)
Mean (ndvi)1−0.2554−0.0818
Rainfall Anomaly (%)−0.25541−0.1591
Thermal Anomaly (°C)−0.0818−0.15911

References

  1. Pausas, J.G.; Llovet, J.; Rodrigo, A.; Vallejo, R. Are wildfires a disaster in the Mediterranean basin? A review. Int. J. Wildland Fire 2008, 17, 713–723. [Google Scholar] [CrossRef]
  2. MacDonald, L.H.; Huffman, E.L. Post-fire Soil Water Repellency. Soil Sci. Soc. Am. J. 2004, 68, 1729. [Google Scholar] [CrossRef]
  3. Cerdà, A.; Doerr, S.H. Influence of vegetation recovery on soil hydrology and erodibility following fire: An 11-year investigation. Int. J. Wildland Fire 2005, 14, 423–437. [Google Scholar] [CrossRef]
  4. Moreno, M.V.; Conedera, M.; Chuvieco, E.; Pezzatti, G.B. Fire regime changes and major driving forces in Spain from 1968 to 2010. Environ. Sci. Policy 2014, 37, 11–22. [Google Scholar] [CrossRef]
  5. Pausas, J.G.; Keeley, J.E. A burning story: The role of fire in the history of life. Bioscience 2009, 59, 593–601. [Google Scholar] [CrossRef]
  6. Pausas, J.G. Changes in fire and climate in the eastern Iberian Peninsula (Mediterranean Basin). Clim. Change 2004, 63, 337–350. [Google Scholar] [CrossRef]
  7. Pereira, P.; Francos, M.; Brevik, E.C.; Ubeda, X.; Bogunovic, I. Post-fire soil management. Curr. Opin. Environ. Sci. Health 2018, 5, 26–32. [Google Scholar] [CrossRef]
  8. Doerr, S.H.; Cerdà, A. Fire effects on soil system functioning: New insights and future challenges. Int. J. Wildland Fire 2005, 14, 339–342. [Google Scholar] [CrossRef]
  9. Vallejo, V.R.; Arianoutsou, M.; Moreira, F. Fire ecology and post-fire restoration approaches in southern european forest. In Post-Fire Management and Restoration of Southern European Forests; Moreira, F., Arianoutsou, M., Corona, P., De las Heras, J., Eds.; Springer: Dordrecht, The Netherlands, 2012; pp. 93–119. ISBN 978-94-007-2208-8. [Google Scholar]
  10. Robichaud, P.R.; Ashmun, L.E.; Sims, B.D. Post-Fire Treatment Effectiveness for Hillslope Stabilization; RMRS-GTR-240 General Technical Report; United States Department of Agriculture: Fort Collins, CO, USA, 2010; pp. 1–62. [CrossRef]
  11. COST Association. COST Action FP0701—Post-Fire Forest Management in Southern Europe. Available online: https://www.cost.eu/actions/FP0701/ (accessed on 16 November 2023).
  12. Wohlgemuth, P.M.; Hubbert, K.R.; Robichaud, P.R. The effects of log erosion barriers on post-fire hydrologic response and sediment yield in small forested watersheds, Southern California. Hydrol. Process. 2001, 15, 3053–3066. [Google Scholar] [CrossRef]
  13. Wittenberg, L.; van der Wal, H.; Keesstra, S.; Tessler, N. Post-fire management treatment effects on soil properties and burned area restoration in a wildland-urban interface, Haifa Fire case study. Sci. Total Environ. 2020, 716, 135190. [Google Scholar] [CrossRef] [PubMed]
  14. Badía, D.; Sánchez, C.; Aznar, J.M.; Martí, C. Post-fire hillslope log debris dams for runoff and erosion mitigation in the semiarid Ebro Basin. Geoderma 2015, 237, 298–307. [Google Scholar] [CrossRef]
  15. Klauberg, C.; Hudak, A.T.; Silva, C.A.; Lewis, S.A.; Robichaud, P.R.; Jain, T.B. Characterizing fire effects on conifers at tree level from airborne laser scanning and high-resolution, multispectral satellite data. Ecol. Modell. 2019, 412, 108820. [Google Scholar] [CrossRef]
  16. Raftoyannis, Y.; Spanos, I. Evaluation of log and branch barriers as post-fire rehabilitation treatments in a Mediterranean pine forest in Greece. Int. J. Wildland Fire 2005, 14, 183. [Google Scholar] [CrossRef]
  17. Fernández, C.; Fontúrbel, T.; Vega, J.A. Effects of pre-fire site preparation and post-fire erosion barriers on soil erosion after a wildfire in NW Spain. Catena 2019, 172, 691–698. [Google Scholar] [CrossRef]
  18. Fernández, C.; Vega, J.A.; Jiménez, E.; Fonturbel, T. Effectiveness of three post-fire treatments at reducing soil erosion in Galicia (NW Spain). Int. J. Wildland Fire 2011, 20, 104–114. [Google Scholar] [CrossRef]
  19. Robichaud, P.R.; Beyers, J.L.; Neary, D.G. Evaluating the Effectiveness of Postfire Rehabilitation Treatments; RMRS-GTR-6 General Technical Report; United States Department of Agriculture: Fort Collins, CO, USA, 2000; p. 85.
  20. López-Vicente, M.; Kramer, H.; Keesstra, S. Effectiveness of soil erosion barriers to reduce sediment connectivity at small basin scale in a fire-affected forest. J. Environ. Manag. 2021, 278, 111510. [Google Scholar] [CrossRef]
  21. Albert-Belda, E.; Bermejo-Fernández, A.; Cerdà, A.; Taguas, E.V. The use of Easy-Barriers to control soil and water losses in fire-affected land in Quesada, Andalusia, Spain. Sci. Total Environ. 2019, 690, 480–491. [Google Scholar] [CrossRef] [PubMed]
  22. Aristeidis, K.; Vasiliki, K. Evaluation of the post-fire erosion and flood control works in the area of Cassandra (Chalkidiki, North Greece). J. For. Res. 2015, 26, 209–217. [Google Scholar] [CrossRef]
  23. Girona-García, A.; Vieira, D.C.S.; Silva, J.; Fernández, C.; Robichaud, P.R.; Keizer, J.J. Effectiveness of post-fire soil erosion mitigation treatments: A systematic review and meta-analysis. Earth Sci. Rev. 2021, 217, 103611. [Google Scholar] [CrossRef]
  24. Marcolin, E.; Marzano, R.; Vitali, A.; Garbarino, M.; Lingua, E. Post-Fire Management Impact on Natural Forest Regeneration through Altered Microsite Conditions. Forests 2019, 10, 1014. [Google Scholar] [CrossRef]
  25. Fernández-Guisuraga, J.M.; Calvo, L.; Fernández-García, V.; Marcos-Porras, E.; Taboada, Á.; Suárez-Seoane, S. Efficiency of remote sensing tools for post-fire management along a climatic gradient. For. Ecol. Manag. 2019, 433, 553–562. [Google Scholar] [CrossRef]
  26. Pérez-Cabello, F.; Montorio, R.; Alves, D.B. Remote sensing techniques to assess post-fire vegetation recovery. Curr. Opin. Environ. Sci. Health 2021, 21, 100251. [Google Scholar] [CrossRef]
  27. Frazier, R.J.; Coops, N.C.; Wulder, M.A.; Hermosilla, T.; White, J.C. Analyzing spatial and temporal variability in short-term rates of post-fire vegetation return from Landsat time series. Remote Sens. Environ. 2018, 205, 32–45. [Google Scholar] [CrossRef]
  28. Kato, A.; Thau, D.; Hudak, A.T.; Meigs, G.W.; Moskal, L.M. Quantifying fire trends in boreal forests with Landsat time series and self-organized criticality. Remote Sens. Environ. 2020, 237, 111525. [Google Scholar] [CrossRef]
  29. Vo, V.D.; Kinoshita, A.M. Remote sensing of vegetation conditions after post-fire mulch treatments. J. Environ. Manag. 2020, 260, 109993. [Google Scholar] [CrossRef] [PubMed]
  30. Vlassova, L.; Pérez-Cabello, F. Effects of post-fire wood management strategies on vegetation recovery and land surface temperature (LST) estimated from Landsat images. Int. J. Appl. Earth Obs. Geoinf. 2016, 44, 171–183. [Google Scholar] [CrossRef]
  31. Vacca, G.; Vecchi, E. UAV Photogrammetric Surveys for Tree Height Estimation. Drones 2024, 8, 106. [Google Scholar] [CrossRef]
  32. van Iersel, W.; Straatsma, M.; Addink, E.; Middelkoop, H. Monitoring height and greenness of non-woody floodplain vegetation with UAV time series. ISPRS J. Photogramm. Remote Sens. 2018, 141, 112–123. [Google Scholar] [CrossRef]
  33. Kim, J.; Kim, I.; Ha, E.; Choi, B. UAV Photogrammetry for Soil Surface Deformation Detection in a Timber Harvesting Area, South Korea. Forests 2023, 14, 980. [Google Scholar] [CrossRef]
  34. Alexiou, S.; Papanikolaou, I.; Schneiderwind, S.; Kehrle, V.; Reicherter, K. Monitoring and Quantifying Soil Erosion and Sedimentation Rates in Centimeter Accuracy Using UAV-Photogrammetry, GNSS, and t-LiDAR in a Post-Fire Setting. Remote Sens. 2024, 16, 802. [Google Scholar] [CrossRef]
  35. Johansen, K.; Erskine, P.D.; McCabe, M.F. Using Unmanned Aerial Vehicles to assess the rehabilitation performance of open cut coal mines. J. Clean. Prod. 2019, 209, 819–833. [Google Scholar] [CrossRef]
  36. Tian, J.; Wang, L.; Li, X.; Gong, H.; Shi, C.; Zhong, R.; Liu, X. Comparison of UAV and WorldView-2 imagery for mapping leaf area index of mangrove forest. Int. J. Appl. Earth Obs. Geoinf. 2017, 61, 22–31. [Google Scholar] [CrossRef]
  37. Zhang, X.; Zhang, F.; Qi, Y.; Deng, L.; Wang, X.; Yang, S. New research methods for vegetation information extraction based on visible light remote sensing images from an unmanned aerial vehicle (UAV). Int. J. Appl. Earth Obs. Geoinf. 2019, 78, 215–226. [Google Scholar] [CrossRef]
  38. López-Vicente, M.; Cerdà, A.; Kramer, H.; Keesstra, S. Post-fire practices benefits on vegetation recovery and soil conservation in a Mediterranean area. Land Use Policy 2021, 111, 105776. [Google Scholar] [CrossRef]
  39. Key, C.H.; Benson, N.C. Landscape Assessment (LA) Sampling and Analysis Methods; RMRS-GTR-164-CD General Technical Report; USDA Forest Service: Fort Collins, CO, USA, 2006.
  40. Montorio, R.; Pérez-Cabello, F.; Borini Alves, D.; García-Martín, A. Unitemporal approach to fire severity mapping using multispectral synthetic databases and Random Forests. Remote Sens. Environ. 2020, 249, 112025. [Google Scholar] [CrossRef]
  41. DGA (Gobierno de Aragón). Informes Técnicos y Otras Publicaciones Sobre Incendios Forestales. Available online: https://www.aragon.es/-/publicaciones-e-informes-tecnicos-incendios-forestales (accessed on 16 November 2023).
  42. Yan, J.; Zhang, G.; Ling, H.; Han, F. Comparison of time-integrated NDVI and annual maximum NDVI for assessing grassland dynamics. Ecol. Indic. 2022, 136, 108611. [Google Scholar] [CrossRef]
  43. Bolton, D.K.; Gray, J.M.; Melaas, E.K.; Moon, M.; Eklundh, L.; Friedl, M.A. Continental-scale land surface phenology from harmonized Landsat 8 and Sentinel-2 imagery. Remote Sens. Environ. 2020, 240, 111685. [Google Scholar] [CrossRef]
  44. Long, N.; Millescamps, B.; Guillot, B.; Pouget, F.; Bertin, X. Monitoring the Topography of a Dynamic Tidal Inlet Using UAV Imagery. Remote Sens. 2016, 8, 387. [Google Scholar] [CrossRef]
  45. Tagle, X. Study of Radiometric Variations in Unmanned Aerial Vehicle Remote Sensing Imagery for Vegetation Mapping. Masters’ Thesis, Lund University, Lund, Sweeden, 2017. [Google Scholar]
  46. Rouse, J.W.; Haas, R.H.; Schell, J.A.; Deering, D.W.; Harlan, J.C. Monitoring the Vernal Advancement of Natural Vegetation; NASA-GCSFC-132982 Final Report; Texas A&M Universitiy, Remote Sensing Center: College Station, TX, USA, 1974; Volume 6. [Google Scholar]
  47. Weidner, U.; Förstner, W. Towards automatic building extraction from high-resolution digital elevation models. ISPRS J. Photogramm. Remote Sens. 1995, 50, 38–49. [Google Scholar] [CrossRef]
  48. Villanueva, J.R.E.; Martínez, L.I.; Montiel, J.I.P. DEM generation from fixed-wing UAV imaging and LiDAR-derived ground control points for flood estimations. Sensors 2019, 19, 3205. [Google Scholar] [CrossRef]
  49. Zhang, H.; Bauters, M.; Boeckx, P.; Van Oost, K. Mapping canopy heights in dense tropical forests using low-cost UAV-derived photogrammetric point clouds and machine learning approaches. Remote Sens. 2021, 13, 3777. [Google Scholar] [CrossRef]
  50. Cabrera-Ariza, A.M.; Lara-Gómez, M.A.; Santelices-Moya, R.E.; de Larriva, J.E.M.; Mesas-Carrascosa, F.J. Individualization of Pinus radiata Canopy from 3D UAV Dense Point Clouds Using Color Vegetation Indices. Sensors 2022, 22, 1331. [Google Scholar] [CrossRef]
  51. Dillner, R.P.; Wimmer, M.A.; Porten, M.; Udelhoven, T.; Retzlaff, R. Combining a Standardized Growth Class Assessment, UAV Sensor Data, GIS Processing, and Machine Learning Classification to Derive a Correlation with the Vigour and Canopy Volume of Grapevines. Sensors 2025, 25, 431. [Google Scholar] [CrossRef]
  52. Chu, T.; Starek, M.J.; Brewer, M.J.; Murray, S.C.; Pruter, L.S. Characterizing canopy height with UAS structure-from-motion photogrammetry—Results analysis of a maize field trial with respect to multiple factors. Remote Sens. Lett. 2018, 9, 753–762. [Google Scholar] [CrossRef]
  53. Zhou, X.; Xing, M.; He, B.; Wang, J.; Song, Y.; Shang, J.; Liao, C.; Xu, M.; Ni, X. A Ground Point Fitting Method for Winter Wheat Height Estimation Using UAV-Based SfM Point Cloud Data. Drones 2023, 7, 406. [Google Scholar] [CrossRef]
  54. Tmušić, G.; Manfreda, S.; Aasen, H.; James, M.R.; Gonçalves, G.; Ben-Dor, E.; Brook, A.; Polinova, M.; Arranz, J.J.; Mészáros, J.; et al. Current practices in UAS-based environmental monitoring. Remote Sens. 2020, 12, 1001. [Google Scholar] [CrossRef]
  55. Kameyama, S.; Sugiura, K. Effects of differences in structure from motion software on image processing of unmanned aerial vehicle photography and estimation of crown area and tree height in forests. Remote Sens. 2021, 13, 626. [Google Scholar] [CrossRef]
  56. Pérez-Cabello, F.; Ibarra, P.; Echeverría, M.T.; de la Riva, J. Post-fire land degradation of Pinus sylvestris L. woodlands after 14 years. L. Degrad. Dev. 2010, 21, 145–160. [Google Scholar] [CrossRef]
  57. Mann, H.B. Nonparametric Tests Against Trend. Econometrica 1945, 13, 245–259. [Google Scholar] [CrossRef]
  58. Kendall, M.G. Rank Correlation Methods, 4th ed.; Charles Griffin: London, UK, 1975. [Google Scholar]
  59. Salmi, T.; Määttä, A.; Anttila, P.; Ruoho-Airola, T.; Amnell, T. Detecting Trends of Annual Values of Atmospheric Pollutants by the Mann-Kendall Test and Sen’s Slope Estimates: The Excel Template Application MAKESENS; Finnish Meteorological Institute: Helsinki, Finland, 2002; ISBN 9516975631/9789516975637. [Google Scholar]
  60. Robichaud, P.R.; Wagenbrenner, J.W.; Brown, R.E.; Wohlgemuth, P.M.; Beyers, J.L. Evaluating the effectiveness of contour-felled log erosion barriers as a post-fire runoff and erosion mitigation treatment in the western United States. Int. J. Wildland Fire 2008, 17, 255–273. [Google Scholar] [CrossRef]
  61. Fernández, C.; Vega, J.A. Effects of mulching and post-fire salvage logging on soil erosion and vegetative regrowth in NW Spain. For. Ecol. Manag. 2016, 375, 46–54. [Google Scholar] [CrossRef]
  62. Pesaresi, S.; Mancini, A.; Quattrini, G.; Casavecchia, S. Mapping mediterranean forest plant associations and habitats with functional principal component analysis using Landsat 8 NDVI time series. Remote Sens. 2020, 12, 1132. [Google Scholar] [CrossRef]
  63. Caturla, R.N.; Raventós, J.; Guàrdia, R.; Vallejo, V.R. Early post-fire regeneration dynamics of Brachypodium retusum Pers. (Beauv.) in old fields of the Valencia region (eastern Spain). Acta Oecologica 2000, 21, 1–12. [Google Scholar] [CrossRef]
  64. Villarreal, M.L.; Norman, L.M.; Buckley, S.; Wallace, C.S.A.; Coe, M.A. Multi-index time series monitoring of drought and fire effects on desert grasslands. Remote Sens. Environ. 2016, 183, 186–197. [Google Scholar] [CrossRef]
  65. Rey, F.; Isselin-Nondedeu, F.; Bédécarrats, A. Vegetation dynamics on sediment deposits upstream of bioengineering works in mountainous marly gullies in a Mediterranean climate (Southern Alps, France). Plant Soil 2005, 278, 149–158. [Google Scholar] [CrossRef]
  66. Gómez-Sánchez, E.; Lucas-Borja, M.E.; Plaza-Álvarez, P.A.; González-Romero, J.; Sagra, J.; Moya, D.; De Las Heras, J. Effects of post-fire hillslope stabilisation techniques on chemical, physico-chemical and microbiological soil properties in mediterranean forest ecosystems. J. Environ. Manag. 2019, 246, 229–238. [Google Scholar] [CrossRef]
  67. van Blerk, J.J.; West, A.G.; Smit, J.; Altwegg, R.; Hoffman, M.T. UAVs improve detection of seasonal growth responses during post-fire shrubland recovery. Landsc. Ecol. 2022, 37, 3179–3199. [Google Scholar] [CrossRef]
  68. Pádua, L.; Adão, T.; Guimarães, N.; Sousa, A.; Peres, E.; Sousa, J.J. Post-fire forestry recovery monitoring using high-resolution multispectral imagery from unmanned aerial vehicles. Int. Arch. Photogramm. Remote Sens. Spat. Inf. Sci. ISPRS Arch. 2019, 42, 301–305. [Google Scholar] [CrossRef]
  69. Martinez, J.L.; Lucas-Borja, M.E.; Plaza-Alvarez, P.A.; Denisi, P.; Moreno, M.A.; Hernández, D.; González-Romero, J.; Zema, D.A. Comparison of Satellite and Drone-Based Images at Two Spatial Scales to Evaluate Vegetation Regeneration after Post-Fire Treatments in a Mediterranean Forest. Appl. Sci. 2021, 11, 5423. [Google Scholar] [CrossRef]
  70. Fernández-Guisuraga, J.M.; Sanz-Ablanedo, E.; Suárez-Seoane, S.; Calvo, L. Using unmanned aerial vehicles in postfire vegetation survey campaigns through large and heterogeneous areas: Opportunities and challenges. Sensors 2018, 18, 586. [Google Scholar] [CrossRef]
  71. Marañón-Jiménez, S.; Castro, J.; Querejeta, J.I.; Fernández-Ondoño, E.; Allen, C.D. Post-fire wood management alters water stress, growth, and performance of pine regeneration in a Mediterranean ecosystem. For. Ecol. Manag. 2013, 308, 231–239. [Google Scholar] [CrossRef]
Disclaimer/Publisher’s Note: The statements, opinions and data contained in all publications are solely those of the individual author(s) and contributor(s) and not of MDPI and/or the editor(s). MDPI and/or the editor(s) disclaim responsibility for any injury to people or property resulting from any ideas, methods, instructions or products referred to in the content.

Article Metrics

Citations

Article Access Statistics

Multiple requests from the same IP address are counted as one view.