Highlights
What are the main findings?
- The proposed SRTSOD-YOLO series models significantly improve the detection accuracy of small targets in UAV aerial images while maintaining real-time performance. Compared with YOLO11l on the VisDrone2019 dataset, SRTSOD-YOLO-l achieves a 7.9% increase in mAP50 and a 1.08% reduction in missed target metric Emissed.
- We propose the MFCAM module (Multi-scale Feature Complementary Aggregation Module) and the GAC-FPN architecture (Gated Activation Convolutional Fusion Pyramid Network), which effectively address the issue of small target feature loss in deep networks and suppress complex background interference through a dynamic gating mechanism.
What is the implication of the main finding?
- The model series (SRTSOD-YOLO-n/s/m/l) offer flexible deployment solutions, catering to the real-time detection requirements of both airborne edge devices and ground workstations.
- Providing high-precision small-object detection benchmarks for low-altitude economic scenarios such as smart city traffic monitoring and power inspection.
Abstract
To address the challenges of small target detection in UAV aerial images—such as difficulty in feature extraction, complex background interference, high miss rates, and stringent real-time requirements—this paper proposes an innovative model series named SRTSOD-YOLO, based on YOLO11. The backbone network incorporates a Multi-scale Feature Complementary Aggregation Module (MFCAM), designed to mitigate the loss of small target information as network depth increases. By integrating channel and spatial attention mechanisms with multi-scale convolutional feature extraction, MFCAM effectively locates small objects in the image. Furthermore, we introduce a novel neck architecture termed Gated Activation Convolutional Fusion Pyramid Network (GAC-FPN). This module enhances multi-scale feature fusion by emphasizing salient features while suppressing irrelevant background information. GAC-FPN employs three key strategies: adding a detection head with a small receptive field while removing the original largest one, leveraging large-scale features more effectively, and incorporating gated activation convolutional modules. To tackle the issue of positive-negative sample imbalance, we replace the conventional binary cross-entropy loss with an adaptive threshold focal loss in the detection head, accelerating network convergence. Additionally, to accommodate diverse application scenarios, we develop multiple versions of SRTSOD-YOLO by adjusting the width and depth of the network modules: a nano version (SRTSOD-YOLO-n), small (SRTSOD-YOLO-s), medium (SRTSOD-YOLO-m), and large (SRTSOD-YOLO-l). Experimental results on the VisDrone2019 and UAVDT datasets demonstrate that SRTSOD-YOLO-n improves the mAP@0.5 by 3.1% and 1.2% compared to YOLO11n, while SRTSOD-YOLO-l achieves gains of 7.9% and 3.3% over YOLO11l, respectively. Compared to other state-of-the-art methods, SRTSOD-YOLO-l attains the highest detection accuracy while maintaining real-time performance, underscoring the superiority of the proposed approach.
1. Introduction
In recent years, the rapid advancement of deep learning has significantly accelerated progress in object detection, a key area within computer vision. Object detection enables the precise localization and classification of objects in images or videos. With the increasing integration of unmanned aerial vehicle (UAV) platforms and computer vision technologies, aerial image-based object detection has become a core technology in various applications, including traffic monitoring [1,2,3,4], smart cities [5,6], power facility inspection [7], and disaster response [8].
Current mainstream object detection algorithms are predominantly based on deep learning models and can be broadly categorized into three groups: two-stage methods, one-stage methods, and transformer-based approaches. The two-stage detection framework decomposes the detection process into two sequential steps: first, generating region proposals, and then classifying these proposals (often accompanied by bounding-box refinement). Representative algorithms in this category include R-CNN [9], SPPNet [10], Fast R-CNN [11], and Faster R-CNN [12]. While two-stage detectors generally achieve high detection accuracy, their inference speed is often a limiting factor. In contrast, one-stage methods, typified by the YOLO series, adopt a more direct strategy by integrating object localization and classification into a single regression step. This approach reformulates object detection as a regression problem rather than a classification task, significantly improving computational efficiency compared to two-stage pipelines such as the R-CNN family. In 2017, Vaswani et al. introduced the Transformer architecture [13], which utilizes a self-attention mechanism to capture global dependencies in sequence data, replacing recurrent structures like RNNs and LSTMs while enabling parallel computation. The incorporation of multi-head attention further enhances the model’s ability to capture information at different semantic levels. Although originally developed for natural language processing, the Transformer has profoundly influenced computer vision. In 2020, the Vision Transformer (ViT) [14] demonstrated that a pure Transformer architecture could achieve state-of-the-art performance on image classification tasks, rivaling and even surpassing leading CNN-based models such as ResNet on large-scale datasets like ImageNet-21K. Also in 2020, Facebook proposed DETR [15], an end-to-end object detection model that eliminates the need for hand-crafted anchor boxes and non-maximum suppression (NMS) post-processing. Despite its simplicity and strong conceptual appeal, DETR suffers from high computational and memory costs, especially under high-input resolutions.
Although current mainstream detection algorithms have achieved competitive performance on conventional targets, as evidenced by benchmarks such as MS COCO [16] and Pascal VOC [17], the detection of small objects (e.g., those smaller than 32 × 32 pixels [16]) in aerial images remains a challenging task [18,19,20].
As illustrated in Figure 1a–c, aerial images often exhibit highly complex backgrounds. Since UAVs typically capture scenes from a high-altitude vantage point, objects appear extremely small in the imagery, rendering nearly all targets in this context as small objects. Kai Liu et al. [21] reported that in the VisDrone dataset, each image contains an average of 54 objects, yet these account for only 8.1% of the total pixels. When applying current mainstream detectors to aerial imagery, the deep hierarchical structure of networks tends to cause progressive loss of subtle features of small objects, leading to degraded detection performance. Furthermore, as shown in Figure 1d–f, UAVs capture targets from diverse perspectives—frontal, lateral, and overhead—resulting in significant scale variations for the same object across different viewpoints. Even within the same scene, objects closer to the UAV appear larger, while those farther away are imaged at a much smaller scale. Additionally, imaging conditions vary considerably with time of day, as seen in Figure 1g,h; targets captured under different lighting conditions (e.g., daytime vs. nighttime) exhibit substantial appearance differences. Motion blur further complicates the problem when the UAV is moving at high speed or tracking fast-moving objects.
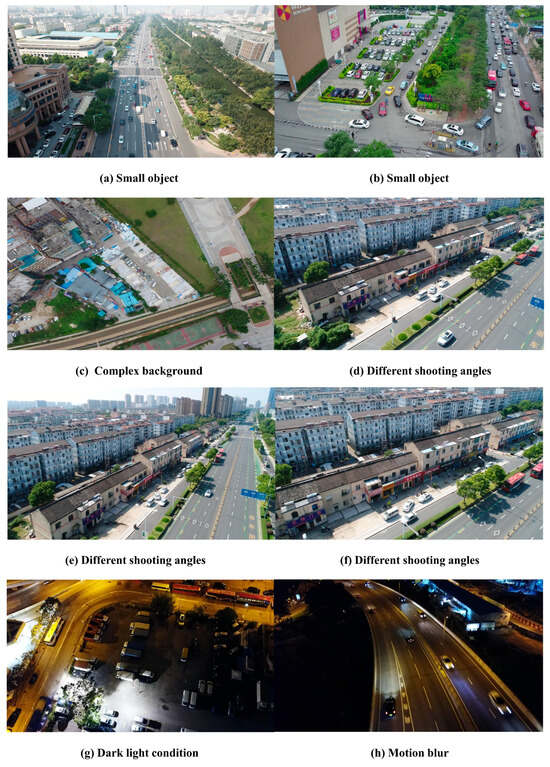
Figure 1.
Examples of drone aerial images.
Moreover, the engineering deployment of UAV object detection algorithms typically involves two distinct architectures tailored to different scenarios [22,23]:
- (1)
- Airborne Sensing-Ground Computing: In this setup, raw image data are transmitted via a low-latency link to a ground-based GPU cluster for processing. This architecture imposes no strict constraints on model size or computational cost, allowing the use of deep networks that leverage spatial details through strategies such as multi-scale feature fusion and attention mechanisms to enhance small object detection accuracy.
- (2)
- Onboard Edge Computing: Embedded systems mounted on UAVs require local real-time processing, imposing stringent limits on model complexity and power consumption. These systems demand lightweight models, often designed via neural architecture search, that balance representation capacity and computational efficiency under tight memory and power budgets. The emphasis here shifts from pure accuracy gains to achieving real-time performance within resource-constrained environments, necessitating co-optimization of low-power hardware and compact model design.
Due to these challenges, the visual analysis and processing capabilities of dedicated platforms such as UAVs have been significantly constrained [24,25]. To bridge the performance gap between small-scale and normal-scale object detection and enhance detection performance for small targets in high-resolution UAV imagery, researchers have undertaken extensive efforts in several directions. These include data augmentation [26,27,28,29,30,31], hierarchical feature aggregation [32,33,34,35], and attention-based mechanisms [36,37,38,39], among others.
However, the generalization capability of the aforementioned methods remains limited. This is primarily due to the scarce pixel coverage of small objects, which provides insufficient visual information for constructing discriminative feature representations [40]. Moreover, a fundamental trade-off persists in existing research: efforts to enhance algorithmic efficiency—such as increasing frame rates or reducing memory usage—often lead to a significant decline in detection accuracy. This asymmetric degradation in accuracy relative to efficiency severely undermines the practical deployment value of these algorithms in real-world engineering applications.
To solve the above problems, we propose a new SRTSOD-YOLO model, which is a series. Within the YOLO11 framework, we introduce two synergistic modules—MFCAM and GAC-FPN—designed to enhance the detection of small objects in aerial imagery under complex environmental conditions. Neither module alone achieves the same performance gain as their integrated use. The MFCAM module, incorporated in the backbone network, helps preserve fine-grained details of small objects, while the GAC-FPN in the neck network effectively integrates these enriched multi-scale features. This tightly coupled architectural design represents a key innovation of our approach. The improved YOLO11 model achieves enhanced detection performance for small targets without introducing substantial computational overhead. To accommodate diverse application requirements, we develop multiple variants under the SRTSOD-YOLO framework—namely SRTSOD-YOLO-n, -s, -m, and -l—differing in network width and depth. Experimental results on the widely used UAVDT [41] and VisDrone2019 [42] datasets demonstrate that the proposed SRTSOD-YOLO network attains superior detection accuracy with fewer parameters and lower computational cost, significantly outperforming the baseline YOLO11 model.
The main contributions of our study are as follows:
- To address the progressive loss of small target information with increasing network depth, we introduce the Multi-scale Feature Complementary Aggregation Module (MFCAM) into the backbone network. The MFCAM is designed to enhance feature extraction by strategically combining multi-scale convolutional features with channel and spatial attention mechanisms. This design enables the module to effectively locate small objects in the image by emphasizing critical feature channels and spatial positions.
- We design a novel neck architecture, termed the Gated Activation Convolutional Fusion Pyramid Network (GAC-FPN), to enhance multi-scale feature fusion by emphasizing semantically important features and suppressing irrelevant background noise. The GAC-FPN incorporates three key strategies to improve small target detection: (1) introducing a detection head with a smaller receptive field while removing the original one with the largest receptive field; (2) leveraging large-scale feature maps more effectively; and (3) integrating a gated activation convolutional module for adaptive feature refinement.
- To address the class imbalance between positive and negative samples, we replace the original binary cross-entropy loss with an adaptive threshold focal loss in the detection head. This modification accelerates network convergence and enhances detection accuracy for small targets.
- To accommodate diverse practical task requirements, we develop multiple versions of the SRTSOD-YOLO object detection model. These include high-capacity models tailored for ground-based workstations, which emphasize multi-scale feature fusion and contextual modeling to leverage the parallel computing capabilities of GPU clusters, as well as lightweight models designed for airborne platforms. The latter enable real-time inference at the edge while maintaining a high recall rate for critical targets. This hierarchical design paradigm enhances the flexibility of algorithm deployment across different operational scenarios.
The remainder of this paper is organized as follows: In Section 2, we provide an overview of relevant research on object detection in UAV aerial imagery, the YOLO series of algorithms, and recent advances in YOLO11-based networks. We also elaborate on the architecture and operational principles of the proposed SRTSOD-YOLO model. Section 3 describes the datasets, experimental setup (including environment and parameters), evaluation metrics with error-type analysis, and presents extensive experiments such as ablation studies and comparative evaluations on the UAVDT and VisDrone2019 datasets to validate the feasibility of our approach. Section 4 discusses how SRTSOD-YOLO addresses key challenges in UAV-based object detection. Finally, Section 5 concludes the paper and suggests potential directions for future research.
2. Materials and Methods
2.1. Target Detection Methods of UAV Aerial Images
Driven by advances in computer vision, many deep learning-based object detection methods for UAV aerial imagery have been developed. These methods have demonstrated remarkable performance improvements, contributing to considerable advancements in this field. Yue et al. [43] presented LE-YOLO, a lightweight and efficient algorithm based on the YOLOv8n architecture, for detecting small objects in aerial imagery. To enhance detection accuracy, the authors introduced the LHGNet backbone, the LGS bottleneck, and the LGSCSP feature fusion module. Bai et al. [44] introduced SFFEF-YOLO, a novel small object detection network for UAV imagery, based on fine-grained feature extraction and fusion. To improve detection accuracy for small objects, the authors developed a Fine-grained Information Extraction Module (FIEM) and a Multi-scale Feature Fusion Module (MFFM). Du et al. [25] proposed a global context-enhanced adaptive sparse convolutional network to address the insufficient integration of contextual information around small targets and the suboptimal control of mask ratios in scenes with varying foreground proportions. Their approach achieves an optimal balance between detection accuracy and computational efficiency for UAV-based targets. Wang et al. [45] introduced a diversity-aware knowledge fusion network that leverages both image-level and instance-level features to enable diversified knowledge representation. This framework establishes an innovative baseline architecture for detecting targets and their critical components in UAV imagery. Liu et al. [46] adopted the RFCAConv convolutional method to address the issue of parameter sharing in the convolution process by optimizing the receptive field of convolutional kernels. By incorporating coordinate attention, this approach effectively enhances the extraction and processing of feature information. Wang et al. [47] designed a feature fusion module named TP-Fusion, which incorporates deformable convolution (DConv) to improve the detection rate of small targets. The module integrates information from lower-level features and adaptively adjusts the shape of convolutional kernels to accommodate targets of varying sizes and poses, thereby capturing more detailed feature information. Chen et al. [48] introduced a semantic information-guided fusion module specifically designed for small target detection. This module utilizes high-level semantic cues to guide and align lower-level textural features, thereby enhancing the semantic representation of small objects at the feature level and improving the model’s detection capability for such targets. Ying et al. [49] proposed a pyramid dual-pooling attention path aggregation network to achieve accurate vehicle localization. The method integrates spatial and semantic information from different feature layers in a cohesive manner. Additionally, by incorporating a hybrid attention mechanism through a parallel strategy, the model enhances its overall vehicle detection performance. Ding et al. [50] proposed an attention module termed OSAM, which effectively captures positional features from images to represent objects using a highly parameter-efficient design.
In recent years, significant advances have been made in the field of UAV visual perception. Dedicated detection algorithms based on deep learning frameworks have demonstrated remarkable performance improvements in complex low-altitude scenarios, achieved through optimized feature extraction and spatial attention mechanisms. These innovative model architectures and algorithm designs not only effectively address longstanding challenges of traditional methods—such as scale variation, target occlusion, and illumination interference—but also successfully balance detection accuracy and computational efficiency via multimodal data fusion and lightweight network designs. Such progress offers more reliable visual perception solutions for vertical applications including smart city management, precision agriculture monitoring, and emergency response, thereby facilitating the expansion and maturation of the low-altitude economy application ecosystem.
2.2. The YOLO Series Algorithms
The YOLO series of algorithms represent a prominent class of one-stage object detection methods, achieving a favorable balance between detection accuracy and computational efficiency. As the pioneering model in this line of work, YOLOv1 [51] introduced an end-to-end detection framework that significantly improved inference speed. To enhance the detection of small objects and improve handling of multi-scale variations, YOLOv2 [52] was later developed with the incorporation of batch normalization, anchor boxes, a feature pyramid network, and multi-scale training—effectively addressing previous limitations while preserving real-time performance. Beginning with YOLOv3 [53], the architecture of this series became modularized, generally comprising three components: a backbone for multi-scale feature extraction, a neck for feature fusion across scales, and a head responsible for predicting target locations and categories in the image. In 2020, Bochkovskiy et al. [54] introduced YOLOv4, which integrated several state-of-the-art techniques of the time. These included Mosaic data augmentation, the CSPDarknet-53 backbone, the Mish activation function, spatial pyramid pooling, the DropBlock regularization strategy, and a path aggregation network for multi-scale feature fusion. Subsequently, the Ultralytics team led by Glenn Jocher released YOLOv5, which has undergone continuous iterative improvements. This version employs a lightweight CSPDarknet as the backbone and incorporates optimization strategies such as adaptive image scaling, multi-scale training, and adaptive anchor box computation.
Li et al. introduced YOLOv6 [55], which replaces the CSPDarknet backbone with an EfficientRep architecture, improving hardware compatibility while preserving high detection accuracy. Wang et al. subsequently developed YOLOv7 [56], incorporating model re-parameterization into the network design and a novel efficient layer aggregation network to enhance both inference speed and performance. In 2023, Ultralytics released YOLOv8, which adopts a new C2f module in the backbone, employs an anchor-free detection head, and streamlines the overall architecture, leading to improved capability in detecting small objects. In 2024, the team led by Chien-Yao Wang introduced YOLOv9 [57]. Key improvements include a programmable gradient information framework designed to mitigate information loss in deep networks, along with a generalized efficient layer aggregation network that enhances multi-scale feature representation. That same year, the Tsinghua University team released YOLOv10 [58], which introduces several advances such as the elimination of non-maximum suppression (NMS) to reduce post-processing latency. In 2024, the Ultralytics team launched YOLO11, which introduces several key enhancements. These include the C3K2 module for improved feature aggregation and the C2PSA module to strengthen global attention through large-kernel convolution, thereby enhancing localization awareness. Additionally, the model employs depth-wise separable convolution to reduce parameter volume, improving its suitability for deployment on edge devices.
2.3. The YOLO11 Architecture
YOLO11, released by the Ultralytics team in 2024, represents the latest progress in the YOLO series of object detection models. It continues the classic three-stage architecture of the YOLO series, consisting of Backbone, Neck and Head, as shown in Figure 2.
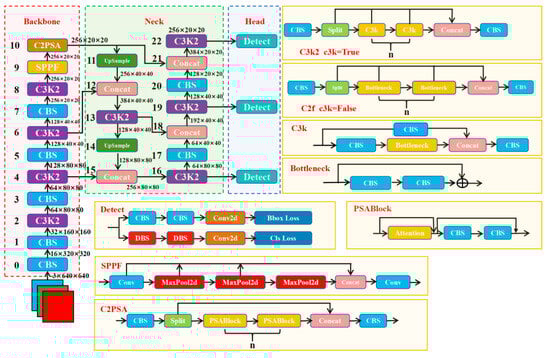
Figure 2.
The YOLO11 network structure diagram. The number on the left of each module indicates the layer where the module is located. For example, the number “10” on the left of the “C2PSA” module indicates that the “C2PSA” module is on the tenth layer of the model network.
The input image consists of three channels with a spatial size of 640 × 640 pixels. A CBS module comprises a two-dimensional convolutional layer (Conv2d), a batch normalization layer (BatchNorm2d), and a SiLU activation function. Within the backbone network, feature maps at multiple resolutions are obtained through five downsampling stages, each implemented using 3 × 3 convolutions with a stride of 2. The C3K2 module is introduced into the backbone network to replace the C2F module from YOLOv8. It employs a multi-branch architecture to capture both fine-grained details and high-level semantic information, substantially enhancing the feature extraction capability. This module supports two configurable modes: c3k = True and c3k = False, allowing flexible adaptation of the feature extraction strategy based on task requirements. When c3kis enabled, the input features are evenly divided into groups, processed by independent convolutional branches, and then concatenated to facilitate channel-wise information fusion. When disabled, the module reverts to the standard C2F behavior. The Spatial Pyramid Pooling Fast (SPPF) module serves as a core component for multi-scale feature fusion in YOLO11. Its architecture consists of three stages: feature compression, cascaded pooling, and cross-scale fusion. The compression stage uses convolutional kernels to reduce feature dimensions, minimizing spatial redundancy while preserving essential semantic content. The cascaded pooling stage employs a series of max-pooling operations with increasing kernel sizes (5 × 5, 9 × 9, 13 × 13) to capture local details, mid-level textures, and global context in a hierarchical manner. Finally, feature maps with different receptive fields are aggregated via 1 × 1 convolutions. As another core innovation in YOLO11, the Cross-Scale Pixel Spatial Attention (C2PSA) module enhances feature representation in complex scenes through multi-scale spatial perception and pixel-level refinement. Furthermore, in the classification branch of the detection head, traditional convolution is replaced with depth-wise separable convolution (DWConv), which decomposes standard convolution into depth-wise and point-wise operations, significantly reducing the number of parameters. Through the lightweight design of C3K2, the multi-scale attention mechanism in C2PSA, and efficient operations via DWConv, YOLO11 achieves an optimal balance between accuracy and inference speed. Its modular and configurable architecture makes it well-suited for industrial applications requiring both high performance and deployment flexibility.
The width and depth of the YOLO11 series models are configurable, yielding five size levels (in descending order): yolo11x, yolo11l, yolo11m, yolo11s, and yolo11n, as detailed in Table 1.

Table 1.
The YOLO11 model variants with different depths and widths.
2.4. The SRTSOD-YOLO Network Structure
Based on the YOLO11n baseline architecture, we introduced a series of optimizations and enhancements, primarily within the backbone and neck components. By varying the number of output channels and the quantity of C3K2 modules, the proposed SRTSOD-YOLO framework can be adapted to different application requirements, yielding four model variants: SRTSOD-YOLO-n, SRTSOD-YOLO-s, SRTSOD-YOLO-m, and SRTSOD-YOLO-l. The detailed configuration parameters of each network module are provided in Table 2 and Table 3.
Table 2.
The parameter settings for SRTSOD-YOLO backbone.
Table 3.
The parameter settings for SRTSOD-YOLO neck.
Figure 3 illustrates the network architecture of the proposed SRTSOD-YOLO. The backbone network comprises four key components: the CBS module, the Multi-scale Feature Complementary Aggregation Module (MFCAM), the SPPF module, and the C2PSA module.
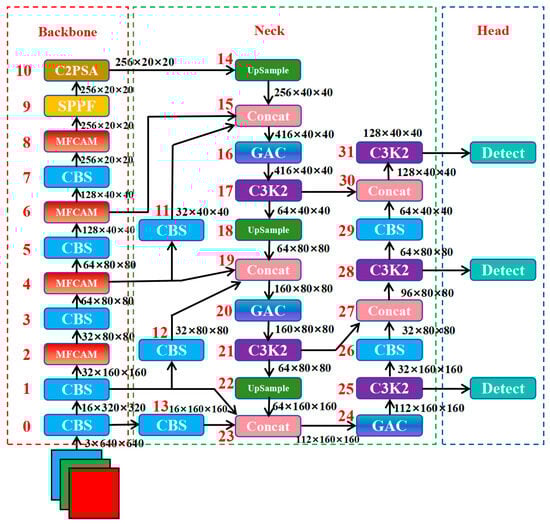
Figure 3.
The SRTSOD-YOLO network structure diagram. The number on the left of each module indicates the layer where the module is located. For example, the number “10” on the left of the “C2PSA” module indicates that the “C2PSA” module is on the tenth layer of the model network.
In the standard YOLO11 network, the CBS modules from the first, third, fifth, and seventh layers are connected to the corresponding C3K2 modules. In the proposed SRTSOD-YOLO, we introduce a novel Multi-scale Feature Complementary Aggregation Module (MFCAM) in place of this design. The MFCAM efficiently captures salient image information through a combination of channel and spatial attention mechanisms, along with multi-scale convolutional feature extraction. Specifically, it employs convolutional kernels of three different scales (3 × 3, 5 × 5, and 7 × 7) to extract multi-scale features, enabling the network to adapt to objects of varying sizes and improve recognition capability across scales. Furthermore, we developed a new neck architecture named Gated Activation Convolutional Fusion Pyramid Network (GAC-FPN) to replace the original YOLO11 neck. The GAC-FPN incorporates three major improvements: (1) introducing an additional downsampling stage in the backbone to better leverage large-scale features; (2) incorporating a gated activation convolutional module to enhance feature selectivity; (3) adding a detection head with a smaller receptive field while removing the one with the largest receptive field to improve small object detection. Additionally, to address the issue of foreground-background sample imbalance, we replaced the original binary cross-entropy loss with an adaptive threshold focal loss in the detection head, which accelerates convergence and improves detection accuracy for small objects.
2.5. The Multi-Scale Feature Complementary Aggregation Module
Inspired by [59], we propose a Multi-scale Feature Complementary Aggregation Module (MFCAM) to mitigate the loss of small-target information in deep networks, which often complicates feature extraction. By integrating multi-scale convolutional feature extraction with channel and spatial attention mechanisms, this module enhances feature representation and effectively locates small objects in the image, as illustrated in Figure 4.
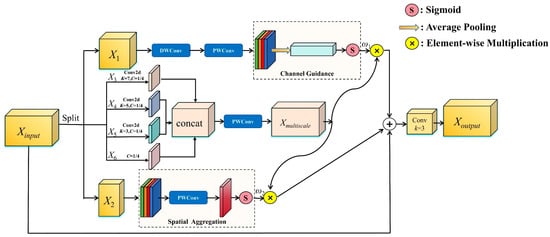
Figure 4.
The structure diagram of multi-scale feature complementary aggregation module.
The first is the segmentation stage of the MFCAM module. We divide the channels of input features (Xinput ∈ RC×H×W) into βC channels and (1 − β) C channels, corresponding to X1 and X2 respectively. Where 0 ≤ β ≤ 1 is the shunt ratio, and the value of β is very important in the network. As the deep neural network continues to evolve deeper, the low-level spatial feature representations at the basic level gradually show an explicit trend, and are implicitly encoded into high-dimensional latent vectors through nonlinear mapping. In addition, the input feature Xinput is evenly divided into 4 parts in the channel dimension, and X3, X4, X5 and X6 are obtained, respectively. The segmentation stage can be expressed as:
where X1 ∈ Rβ×H×W, X2 ∈ R(1−β)C×H×W, X3 ∈ RC/4×H×W, X4 ∈ RC/4×H×W, X5 ∈ RC/4×H×W, X6 ∈ RC/4×H×W.
Then, there is the directional conversion phase of the MFCAM module. We send the obtained X1 to the branch consisting of depth-wise convolution and point-wise convolution, and then pass it into the channel attention module to obtain the weight on each channel. In Figure 4, the weight output by the channel attention module is denoted as ω1 ∈ RC×1×1. X2 is sent to the spatial attention module, and weights are assigned to each spatial position of the feature map, emphasizing important regions related to the target and suppressing irrelevant regions. In Figure 4, the weights output by the spatial attention module are expressed as ω2 ∈ R 1×H×W. Then, X3, X4, and X5 are processed using convolutions with convolution kernel sizes of 7 × 7, 5 × 5, and 3 × 3, respectively, to extract multi-scale image features. Then, the feature maps processed by convolution kernels of different sizes are spliced in channel dimensions, and then the feature map Xmultiscale is obtained after point-wise convolution. For many visual tasks, objects and scenes may have different representations at different scales. Through multiscale convolution, the model is able to adapt to objects or regions of different sizes. This conversion process is represented by the following formula:
Next, there is the feature aggregation stage of the MFCAM. After obtaining the channel attention weight ω1 and spatial attention weight ω2, they are, respectively, mapped to the feature map Xmultiscale containing multi-scale information. Then the two branches are connected together and added to the input feature Xinput, and then passed to a 3 × 3 convolution layer. Finally, the output of the MFCAM, namely the feature map Xoutput, is obtained (Xoutput ∈ RC×H×W). Xoutput is calculated as follows:
where ⨂ is element-wise multiplication.
While drawing inspiration from prior research, the proposed MFCAM serves a distinct purpose and operates through a different mechanism compared to feature fusion modules such as FPN or PANet. FPN and PANet employ top-down or bidirectional pathways to integrate multi-scale features, constructing a feature pyramid where each level exhibits enhanced semantic strength and spatial accuracy. These modules typically operate across different stages of the backbone. In contrast, MFCAM functions as an intra-level feature enhancement module. It is embedded within a single backbone stage to refine and amplify the most salient features before they are propagated to the neck for further fusion. The key innovations of MFCAM are as follows:
- (1)
- Multi-Scale Convolution with Dual Attention Fusion: Unlike conventional approaches that rely on single-branch convolution or basic attention mechanisms, MFCAM extracts multi-scale contextual features in parallel and fuses them strategically using combined channel and spatial attention. This enables the simultaneous capture of fine-grained details and broader contextual information, while emphasizing both “what” and “where” to focus. As a result, the module demonstrates exceptional capability in preserving and enhancing weak features of small objects.
- (2)
- Split-Aggregation Strategy: MFCAM introduces a unique split-aggregation workflow, where input features are divided, processed by specialized branches (e.g., attention and multi-scale convolution), and then reaggregated. This design efficiently maximizes the representational power of features.
In visual inspection tasks using UAV platforms, preserving the high-resolution spatial representation capability of large-scale feature maps is crucial for accurately detecting small objects. To this end, the proposed Multi-scale Feature Complementary Aggregation Module (MFCAM) integrates channel and spatial attention mechanisms with multi-scale convolutional feature extraction. It is designed to enhance the representation of small-object features in aerial images, improve the processing of multi-scale visual information, and suppress interference from irrelevant features. Furthermore, the module incorporates depth-wise and point-wise convolutions, enabling the effective propagation of multi-scale shallow spatial information to deeper network layers while maintaining relatively low computational cost. Compared to the C3K2 module, MFCAM demonstrates superior performance in mitigating spatial information loss of small targets and strengthening their multi-scale feature representation.
2.6. The Gated Activation Convolutional Fusion Pyramid Network
In target detection for UAV aerial imagery, two key challenges must be addressed simultaneously: position awareness and category discrimination. During feature extraction, accurate localization relies on precise spatial information, while category classification demands rich semantic context. As convolutional layers deepen within the backbone network, the semantic abstraction capacity of feature maps improves; however, this comes at the cost of gradual attenuation of spatial location information. Although existing enhancements—such as the MFCAM module—have partially mitigated this issue, there remains considerable potential for better balancing spatial precision and semantic depth in a dynamic manner. Therefore, by optimizing the feature fusion structure to integrate multi-level backbone features and establishing a complementary mechanism between spatial and semantic information, more discriminative composite features can be delivered to the detector head.
To achieve multi-scale feature fusion, YOLO11 employs a path aggregation feature pyramid network (PA-FPN) [32,60] at the neck. In this structure, multi-level features from the backbone are propagated along a top-down pathway: high-level semantic features (e.g., the output of layer 10 in Figure 2) are upsampled and concatenated channel-wise with lower-level features (e.g., the output of layer 6) to form semantically enriched representations. This process is repeated layer by layer, ultimately constructing a feature pyramid infused with high-level semantics. The path aggregation mechanism further strengthens feature propagation and interaction, facilitating effective transmission of object information to subsequent detection layers.
However, the conventional PA-FPN exhibits several limitations in the context of small object detection in UAV imagery. A primary issue is its underutilization of large-scale feature maps, which are essential for preserving the spatial details of small targets. Moreover, the feature interaction mechanism relies primarily on simple channel concatenation and convolution, often leading to feature redundancy and semantic misalignment—particularly as high-level features tend to lose fine-grained details of small objects. These shortcomings result in inefficient collaboration across feature resolutions and hinder the establishment of a complementary hierarchy.
To overcome these challenges, we design a new neck architecture termed the Gated Activation Convolutional Fusion Pyramid Network (GAC-FPN), as illustrated in the neck section of Figure 3. The GAC-FPN enhances multi-scale fusion by emphasizing relevant features while suppressing background interference. It incorporates three key strategies:
- (1)
- Introducing an additional detection head with a smaller receptive field while removing the original largest receptive field head to better capture small objects.
- (2)
- Making full use of large-scale shallow features to preserve spatial detail.
- (3)
- Incorporating a gated activation convolution module to dynamically control feature flow.
In this study, the classical feature pyramid network is topologically enhanced in two key aspects. As illustrated in Figure 3, the first enhancement focuses on spatial feature enrichment: shallow feature maps are leveraged more effectively through a hierarchical expansion strategy. Specifically, the large-target detection head at the top of the original pyramid is removed, and a new prediction head dedicated to tiny targets is introduced. This modification enables the network to better capture high-resolution edge and texture information from shallow features.
The second enhancement targets cross-level feature interaction by reconstructing the multi-scale fusion pathway. Feature maps from backbone layers 0, 1, and 4 are downsampled and routed to the 23rd, 19th, and 15th layers of the neck network, respectively. Layer 15 receives inputs from the downsampled output of layer 4, along with feature maps from layers 6 and 14. Layer 19 integrates downsampled features from layer 1 with feature maps from layers 4 and 18. Layer 23 combines the downsampled output of layer 0 with features from layers 1 and 22.
This redesigned interaction path fully incorporates multi-level representations from large-scale feature maps and establishes a cross-scale feature integration mechanism. The improvement facilitates collaborative optimization between pixel-level localization accuracy and high-level semantic abstraction by dynamically aligning low-level spatial details with deep semantic representations.
In addition, drawing inspiration from [61], we introduce a gated activation convolutional module to mitigate issues of feature redundancy and semantic misalignment in multi-scale, multi-level feature fusion. This module enhances relevant features while suppressing irrelevant background information. As depicted in Figure 5, an adaptive gating unit is employed to achieve dynamic weight allocation across both feature channels and spatial dimensions. Element-wise feature modulation [62,63] is further applied to improve the model’s ability to perceive fine-grained details. To optimize computational efficiency, a lightweight convolutional module (BottConv) based on rank-constrained optimization [64] is designed. This component projects high-dimensional feature tensors into a lower-dimensional latent space, thereby reducing computational resource requirements while preserving feature representational capacity.
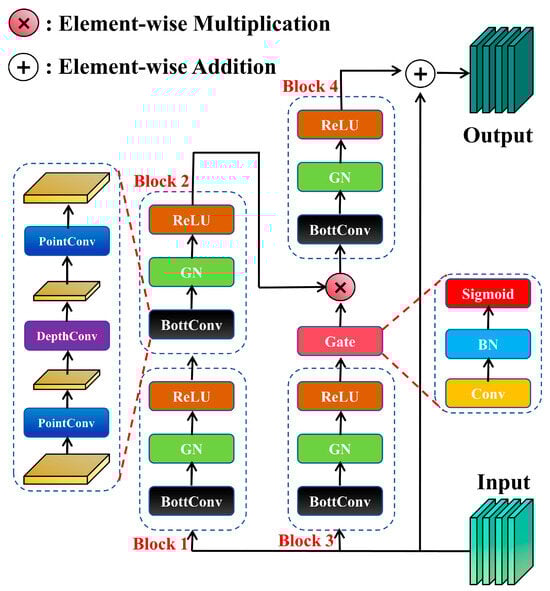
Figure 5.
The structure diagram of gated activation convolutional module.
As shown in Figure 5, the input feature x ∈ RC×H×W passes through the branch path composed of Block1 and Block2 and the branch path of Block3, respectively, one is used to perform standard convolution and the other is used to generate gating weights. Each Block module includes a BottConv layer, followed by a normalization and activation function, resulting in features Block2out and Block3out as follows:
Then, the output of Block3 is processed by the gating unit to generate the gating weight Gateout:
To generate a gated feature map, Block2out and Gateout are combined by a Hadamard product:
The gated feature map gfm(x) is then processed again by Block4 to further extract fine-grained details, and finally, after applying residual connection, the resulting output is:
The proposed gated activation convolutional module comprises a BottConv component and deeper gated branches. This design allows the model to preserve critical multi-scale features of small targets in aerial imagery while maintaining computational efficiency. Furthermore, it enhances the perception of fine-grained details, thereby significantly improving detection performance for small objects.
2.7. Categorization of Feature Fusion Methods
Feature fusion is a pivotal technique in object detection networks, designed to enhance feature representation and handle challenges such as scale variation. Based on their core mechanisms, we categorize existing feature fusion approaches into three primary classes: Operation-Based Fusion, Attention-Based Fusion, and Pyramid-Based Fusion. This taxonomy provides a clear theoretical framework for understanding the design philosophies and applicability of different methods, particularly for small object detection in UAV imagery.
Operation-Based Fusion methods rely on simple mathematical operations to combine features from different layers or scales. They are computationally efficient but may lack adaptability. For example, element-wise addition, channel concatenation, and averaging. These are commonly used in early fusion approaches and in networks like U-Net [65] for skip connections. The fusion process is fixed and non-adaptive, meaning it does not dynamically adjust to input content. The advantages of this type of methods are low computational cost and easy implementation. However, due to the inability to highlight key features or suppress interference noise, it often leads to poor performance in complex scenes containing small objects.
Attention-Based Fusion methods employ attention mechanisms to dynamically weight features, highlighting salient regions and suppressing irrelevant information. For example, SE-Net (Squeeze-and-Excitation Network) [66], CBAM (Convolutional Block Attention Module) [67], and EMA (Efficient Multi-scale Attention) [68]. The key characteristic of such methods is the use of channel or spatial attention to refine features, typically applied sequentially. The advantages of this type of methods are that it effectively enhances feature distinctiveness and reduces background interference. However, most methods operate on single-scale features, neglecting multi-scale contextual information. Additionally, due to complex attention computation mechanisms, these methods may incur additional computational overhead.
Pyramid-Based Fusion methods focus on multi-scale feature integration through pyramidal structures, combining features from different network levels to capture context at varying scales. For example, FPN, PANet, BiFPN [69], and AFPN [70]. The main characteristic of this type of methods is the adoption of a top-down or bidirectional approach, combining high-level semantic features with low-level spatial details. The advantage of this type of methods is its proficiency in handling object scale variations, thereby improving detection accuracy across different sizes. However, when integrating different levels, issues such as feature redundancy or semantic gaps may arise. They typically employ simple operations (e.g., addition) for fusion, lacking a dynamic weighting mechanism.
The proposed MFCAM and GAC-FPN modules in SRTSOD-YOLO integrate innovations from these categories to address their limitations for UAV-based small object detection. MFCAM combines elements from attention-based and pyramid-based fusion: it employs parallel multi-scale convolutions (3 × 3, 5 × 5, 7 × 7) to capture context at varying receptive fields (inspired by pyramid methods), while integrating channel and spatial attention in a split-transform-merge strategy (enhancing adaptability beyond simple operations). This design preserves fine-grained details and dynamically highlights critical regions, overcoming the non-adaptability of operation-based methods and the single-scale focus of pure attention mechanisms. GAC-FPN leverages pyramid-based structures but introduces dynamic gating: it uses a Gated Activation Convolution (GAC) module for adaptive feature weighting during fusion, addressing the fixed operation limitations in standard pyramid methods. Its structural optimization (e.g., replacing large detection heads with small ones) enhances high-resolution feature utilization, crucial for small objects.
By categorizing existing works into these three classes, we emphasize that SRTSOD-YOLO’s fusion strategies offer a hybrid approach that integrates multi-scale context capture (from pyramid-based methods), dynamic modulation (from attention-based methods), and computational efficiency (improving upon operation-based methods). This theoretical framework sets the stage for the empirical validation in Section 3.
2.8. The Adaptive Threshold Focus Loss Function
In UAV aerial imagery, the background typically occupies most of the image, while target objects cover only a small area. This imbalanced data distribution causes the model to more easily learn background features rather than those of the targets during training. In this context, the background can be viewed as easy-to-learn samples, whereas the targets represent hard samples. Even after the model has sufficiently learned the background characteristics, these regions continue to contribute disproportionately to the training loss due to their dominance. Consequently, the simple—yet pervasive—background samples unduly influence the weight updates, thereby overshadowing the gradient contributions from the more critical target regions. To mitigate this issue, we employ the adaptive threshold focal loss proposed by Yang et al. [71] to replace the original binary cross-entropy loss. This loss function dynamically adjusts the loss value based on the predicted probability, thereby down-weighting easy samples and focusing training on hard examples. This adaptation enhances the detection performance for small targets in UAV aerial imagery.
The classical cross-entropy loss function can be expressed as:
where p represents the prediction probability and y represents the true label. Its concise expression is:
where
The expression for the adaptive threshold focus loss can be expressed as:
where λ is a hyperparameter greater than 1 and the expression of pc is as follows:
where pc represents the predicted value of the next epoch, pt represents the current average predicted probability value, and pi represents the average predicted probability value of each training epoch.
3. Results
3.1. Image Datasets for Small Object Detection
To evaluate the performance of the proposed SRTSOD-YOLO model, we conducted experiments on two widely used and representative UAV perspective datasets: VisDrone and UAVDT. The VisDrone dataset is a well-established and authoritative benchmark in the field of UAV vision research. We adopted the 2019 version, which was released by the AISKYEYE team at Tianjin University to advance visual perception technologies under UAV platforms—particularly in tasks such as object detection, tracking, and semantic segmentation. Owing to its large scale and notable scenario diversity, VisDrone2019 has become a standard reference dataset in this domain. It contains 288 video sequences captured in diverse and challenging environments, including urban streets, rural areas, and construction sites. In addition, the dataset provides 10,209 static aerial images with a wide variety of geographical and environmental conditions, suitable for image-based object detection research. These images are meticulously annotated with 10 categories of target objects. In accordance with the official partitioning protocol of the VisDrone2019 challenge, the samples are divided into training (6471 images), validation (548 images), and test (1610 images) sets.
The UAVDT dataset was jointly released by researchers from the University of Chinese Academy of Sciences, Harbin Institute of Technology, Huawei’s Noah’s Ark Lab, and the University of Texas at San Antonio. It comprises 100 video sequences selected from more than 10 h of raw footage captured by UAV platforms across various urban locations. The dataset covers a range of typical traffic scenarios, such as squares, main roads, toll stations, highways, intersections, and T-junctions. From the original video material, approximately 80,000 representative frames were extracted and fully annotated with bounding boxes, along with up to 14 attributes—including weather conditions, flight altitude, camera viewpoint, vehicle category, and occlusion level. These annotations support three fundamental computer vision tasks: object detection, single object tracking, and multi-object tracking.
3.2. Experimental Setup
The experiment was executed on the ubuntu operating system. At the time of the experiment, the Python version was 3.8, the PyTorch version was 1.2.0, and the Cuda version was 11.3. The hardware used for these experiments was two NVIDIA 3090 graphics cards with 24G of video memory. SRTSOD-YOLO is improved based on YOLO11 Ultralytics version 8.3.39. The training was carried out for 300 epochs and the input image was resized to 640 × 640 pixels. The optimization utilizes the stochastic gradient descent algorithm, starting from an initial learning rate of 0.01 and gradually decreasing to a final learning rate of 0.0001. Table 4 shows the setting of relevant parameters during the model training process. Each model is trained without the use of pre-trained weights to ensure a fair comparison.
Table 4.
Setting of relevant parameters during model training.
3.3. Experimental Evaluation Index
To fully evaluate model performance, we measure from the following dimensions: In terms of detection accuracy, the performance of all target categories is evaluated with the mean average precision mAP@0.5 and mAP@0.5:0.95 indicators. In terms of computational complexity, giga floating-point operations (GFLOPs) are used for quantization. In terms of model scale, it is reflected by the total amount of parameters. In terms of processing speed, the frames per second (FPS) indicator is used to reflect the real-time inference throughput of the model. The time taken by the model to process an image mainly consists of three stages: preprocessing, inference, and post-processing. The FPS is calculated by dividing 1000 by the sum of the time taken for each stage. FPS was measured by performing inference on the entire VisDrone2019 validation set (548 images), using a batch size of 1.
3.4. Assessment of Error Types
In object detection tasks, the evaluation of the model cannot rely solely on the mean average precision (mAP) metric. Although mAP provides a global quantitative evaluation of model performance and comprehensively reflects the detection accuracy of the model in various categories, it is difficult to fully reflect the specific performance of the model in real scenarios. The key point is that it is difficult to effectively identify the specific error patterns generated by the model based on the mAP score alone. For example, false positive (FP) results may stem from duplicate boxes, mislabels, mislocation, or confusion with background regions. A false negative (FN) may indicate a true target that failed to be detected or a complete prediction omission [72]. The frequency and combination of these different types of errors can have a differentiated impact on the final mAP result. Therefore, it is of great value to deeply analyze the error composition of the model.
Based on this, we attribute all FPs and FNs to the following six error types: label error (Cls), position bias (Loc), label and position double error (both), duplicate detection (Dup), background misjudgment (Bkg), and Missed target (Missed) (as shown in Figure 6). To accurately identify these error types, we adopted the TIDE toolkit [72]. This tool not only classifies and summarizes errors clearly and concisely, but also completely isolates the impact of each error type on the final result, making the error analysis results more intuitive and easy to understand.
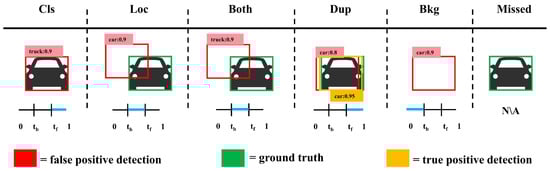
Figure 6.
Introduction to six error types. The blue line indicates the range of IOUmax values for different types of errors.
The core principle of the TIDE tool is that for each false positive box, calculate its maximum IoU (denoted as IoUmax) with all real target boxes in the same category. Two key IoU thresholds are set: the threshold tf for distinguishing the foreground (target) defaults to 0.5, and the threshold tb for distinguishing the background defaults to 0.1 (unless a different value is specifically specified).
- Classification Error: IoUmax ≥ tf for GT of the incorrect class (i.e., localized correctly but classified incorrectly).
- Localization Error: tb ≤ IoUmax ≤ tf for GT of the correct class (i.e., classified correctly but localized incorrectly).
- Both Cls and Loc Error: tb ≤ IoUmax ≤ tf for GT of the incorrect class (i.e., classified incorrectly and localized incorrectly).
- Duplicate Detection Error: IoUmax ≥ tf for GT of the correct class but another higher-scoring detection already matched that GT (i.e., would be correct if not for a higher scoring detection).
- Background Error: IoUmax ≤ tb for all GT (i.e., detected background as foreground).
- Missed GT Error: All undetected ground truth (false negatives) not already covered by classification or localization error.
3.5. Comparative Analysis with YOLO11
After elaborating on the SRTSOD-YOLO model proposed in Chapter 2 and the evaluation metrics in Section 3.3 and Section 3.4, we trained the different versions of the SRTSOD-YOLO model and the corresponding versions of the YOLO11 model on the VisDrone2019 dataset three times, each time using a different random seed (the random seeds were 0/42/123, respectively). The performance and model sizes of SRTSOD-YOLO and YOLO11 are shown in Table 5 and Figure 7.
Table 5.
Comparison of individual versions of SRTSOD-YOLO and YOLO11 on VisDrone2019 dataset.
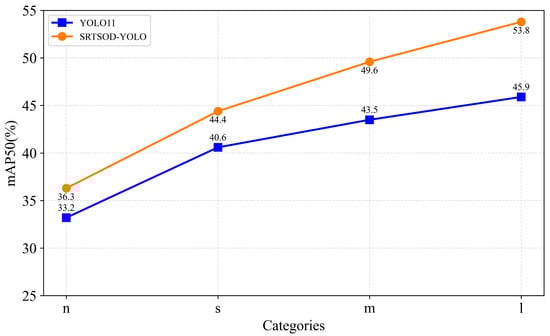
Figure 7.
Relationship between detection accuracy and scale.
As shown in Table 5, the values of mAP50 and mAP50-95 along with their standard deviations, the number of parameters, the amount of floating-point operations, and FPS of each model are presented. Compared with the standard YOLO11 model, different versions of the SRTSOD-YOLO model show a leading advantage. Specifically, compared with YOLO11n, SRTSOD-YOLO-n has an increase of 13.8% in GFLOPs and a 34.6% increase in parameters, resulting in an improvement of 3.1% in mAP50 and 1.2% in mAP50-95. Compared with YOLO11s, SRTSOD-YOLO-s has an increase of 12.0% in GFLOPs and an 18.1% increase in parameters, leading to an increase of 3.8% in mAP50 and 2.5% in mAP50-95. Compared with YOLO11m, SRTSOD-YOLO-m has an increase of 6.6% in GFLOPs and a 10.4% increase in parameters, resulting in an increase of 6.1% in mAP50 and 4.1% in mAP50-95. Compared with YOLO11l, SRTSOD-YOLO-l has an increase of 8.5% in GFLOPs and a 9.1% increase in parameters, leading to an increase of 7.9% in mAP50 and 5.6% in mAP50-95. These results prove that SRTSOD-YOLO achieves higher detection performance on the premise of a small increase in model parameters and computational cost. In addition, although the FPS of each version of SRTSOD-YOLO is only slightly lower than that of YOLO11, it can still fully meet the real-time processing requirements required by UAV scenarios.
As shown in Figure 7, each version of the proposed detection model SRTSOD-YOLO consistently outperforms each version of the corresponding baseline model YOLO11 regardless of the model size. In-depth analysis reveals that the difference in detection performance between the two shows a significant trend of expanding with the increase in model scale. Under the scale of version “n”, based on the mAP50 index, SRTSOD-YOLO-n achieved a performance lead of 3.1% compared to YOLO11n. However, when the model size was increased to version “l”, its mAP50 dominance value increased to 7.9%, significantly widening the gap between the two models. This phenomenon confirms that with the increase in model parameters and computational complexity, the improvement rate of SRTSOD-YOLO in detection accuracy is significantly accelerated. Therefore, when deployed on a hardware platform with sufficient computing power, especially in a large-scale model configuration, the model is expected to achieve higher target detection accuracy.
We use the TIDE toolkit to perform error type analysis on the “s” and “l” versions of the proposed SRTSOD-YOLO model and YOLO11 model, respectively, as shown in Table 6. Compared with YOLO11s, SRTSOD-YOLO-s showed a 0.24 decrease in label error measure Ecls, a 0.21 decrease in position bias measure Eloc, a 0.02 decrease in label versus position double error measure Eboth, a 0.03 decrease in duplicate detection measure Edup, a 0.09 decrease in background misjudgment measure Ebkg, and a 0.19 decrease in omission target measure Emissed. Compared with YOLO11l, SRTSOD-YOLO-l had a 0.5 decrease in label error measure Ecls, a 0.28 decrease in position bias measure Eloc, a 0.04 decrease in label versus position double error measure Eboth, a 0.09 decrease in duplicate detection measure Edup, a 0.42 decrease in background misjudgment measure Ebkg, and a 1.08 decrease in missing target measure Emissed. It can be seen that compared with the baseline model YOLO11, the six error type indicators in the detection results of the SRTSOD-YOLO model have all declined, especially the missing target measure Emissed indicator has the largest decrease. Our proposed model has better small target localization ability and fewer missed detections, which significantly proves the detection performance of the SRTSOD-YOLO model.
Table 6.
Comparison of error types between SRTSOD-YOLO and YOLO11 on the VisDrone2019 dataset.
As shown in Figure 8, two typical types of detection errors are illustrated: classification errors and missed detections.
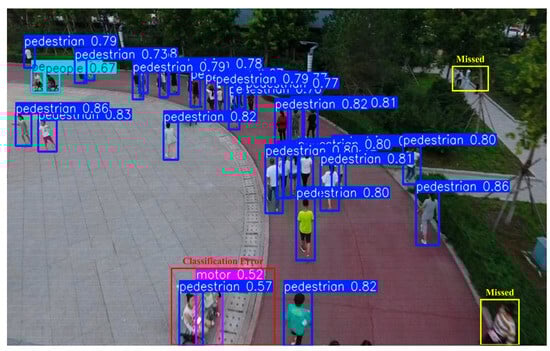
Figure 8.
Visualization of typical detection error types. The red box in the figure indicates the classification error results. Two “people” were wrongly predicted as one “motor” and one “pedestrian”. The yellow box indicates the missed detection results.
To comprehensively evaluate the performance of the proposed model, we employ two distinct datasets for validation. During training on both the VisDrone2019 and UAVDT datasets, input images are resized to 640 × 640 pixels, and the models are trained for 300 epochs. It is important to note that GFLOPs and the number of model parameters are intrinsic properties of the network architecture; thus, their values remain unaffected by the type or size of the dataset. Therefore, this study focuses on accuracy metrics obtained on the UAVDT dataset, with specific emphasis on mAP@0.5 and mAP@0.5:0.95.
As shown in Table 7, the performance of each variant of SRTSOD-YOLO is compared against the corresponding YOLO11 model on the UAVDT dataset. In terms of mAP@0.5, SRTSOD-YOLO-n shows an improvement of 1.2% over YOLO11n, SRTSOD-YOLO-s improves by 3.8% compared to YOLO11s, SRTSOD-YOLO-m achieves a 4.9% gain over YOLO11m, and SRTSOD-YOLO-l outperforms YOLO11l by 3.3%. Regarding mAP@0.5:0.95, SRTSOD-YOLO-n exceeds YOLO11n by 0.6%, SRTSOD-YOLO-s shows a 2.2% improvement over YOLO11s, SRTSOD-YOLO-m outperforms YOLO11m by 3.1%, and SRTSOD-YOLO-l surpasses YOLO11l by 2.2%. These results demonstrate that the proposed model exhibits consistently better detection performance than the baseline across all evaluated scales on the UAVDT dataset.
Table 7.
Comparison of individual versions of SRTSOD-YOLO and YOLO11 on UAVDT dataset.
Based on the VisDrone2019 and UAVDT datasets, this subsection presents a comprehensive comparison of multiple evaluation metrics across several versions of the proposed model and their corresponding baseline models. Experimental results demonstrate that our method exhibits significant advantages in small target detection performance. Further analysis indicates that although the four variants of SRTSOD-YOLO slightly exceed the baseline versions in terms of parameter count and computational complexity, the improved model achieves higher localization accuracy and substantially reduces the rates of missed detections and false alarms.
3.6. Ablation Experiment
To verify the effectiveness of the improved method used in the SRTSOD-YOLO network, we conducted ablation experiments based on the YOLO11n model with incremental addition of the improved method. We train the model with the same hyperparameters to conduct a fair experiment. The ablation experiment was designed as follows:
- (1)
- A: Multi-scale Feature Complementary Aggregation Module (MFCAM) is used in the backbone network.
- (2)
- B: Add a detector with a small receptive field and delete the detector with the original maximum receptive field.
- (3)
- C: A multi-scale and multi-level feature fusion pathway is reconstructed at the neck of the model to fully integrate the multi-level expression of large-size feature maps.
- (4)
- D: Use gated activation convolutional modules at the neck of the model.
- (5)
- E: The original binary cross-entropy loss was replaced by using an adaptive threshold focus loss.
The experimental results in Table 8 clearly show that with the sequential introduction of improvement strategies at each stage, the accuracy of the detection model continues to improve. In particular, the second stage has the most significant improvement in accuracy, and its mAP@0.5 index is 1.2 percentage points higher than that of the first stage when the multi-scale feature complementary aggregation module is used in the YOLO11n backbone network. Furthermore, the GAC-FPN introduces an additional detection head and removes one of the original detection heads with the largest receptive field. Compared with YOLO11n, this structural change results in a decrease in FPS from 164 to 160, an increase in the model’s parameter quantity metric from 2.6 to 2.8, and an increase in the model’s computational complexity metric from 6.5 to 6.7. In addition, the third stage increases the parameter quantity and computational complexity of the model most significantly. This result verifies that large-scale feature maps contain rich spatial detail information, and effective mining and utilization of such information can significantly improve the small target detection ability of the model. Finally, the ablation study on the VisDrone2019 dataset further confirmed that the proposed series of optimization strategies effectively improved the detection accuracy.
Table 8.
Results of ablation experiments in VisDrone2019.
As shown in Figure 9, the visual results of the ablation experiments are presented.
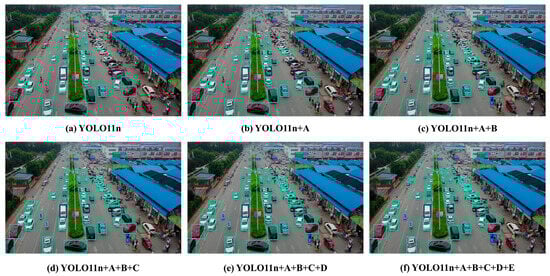
Figure 9.
The visual results of the ablation experiments. As the improvement strategies at each stage were successively introduced, the detection performance of the model gradually improved, and more targets were detected.
Furthermore, we conducted an ablation study on the channel separation ratio β in MFCAM. We tested β values in the range of [0.1, 0.9] on the VisDrone2019 test set using our SRTSOD-YOLO-n model. The results are summarized in Table 9.
Table 9.
Ablation study on the channel separation ratio β in MFCAM.
The results indicate that the model achieves the best performance when β = 0.25. We hypothesize that this ratio strikes an optimal balance: a smaller proportion of channels (X1) is refined by the computationally lighter channel attention path, while a larger proportion (X2) is processed by the spatial attention path to preserve and highlight spatial structural information, which is critical for small object localization. Setting β too high or too low disrupts this balance, leading to a performance drop. Based on this experiment, we set β = 0.25 for all MFCAM modules in our final model.
Additionally, we conducted a comparative experiment on the attention mechanism module. We introduced various attention mechanisms into the baseline YOLO11n model, and the related results are summarized in Table 10. Among them, the MFCAM structure achieved the best detection accuracy when integrated into YOLO11n, and its robust feature fusion capability was fully demonstrated.
Table 10.
Comparison of MFCAM with Other Attention Mechanisms on the VisDrone2019 Dataset.
We incorporated various Feature Pyramid Network (FPN) methods into the baseline YOLO11n model for conducting comparative experiments on the neck architecture. The results are presented in Table 11. When the GAC-FPN structure was integrated into the YOLO11n model, the highest detection accuracy was achieved. These findings clearly demonstrate the superiority of the proposed GAC-FPN method.
Table 11.
Comparison of GAC-FPN with Other Feature Pyramid Networks on the Vis Drone2019 Dataset.
3.7. Visual Comparison
To provide a more intuitive comparison between the proposed model and the baseline, we visually contrast the detection results of SRTSOD-YOLO-s and SRTSOD-YOLO-l against the YOLO11s and YOLO11l benchmarks. As illustrated in Figure 10, Figure 11, Figure 12, Figure 13 and Figure 14, which present multiple representative images from the VisDrone2019 test set, our model demonstrates superior detection accuracy under identical input conditions. It also achieves a notable reduction in both false detection and missed detection rates. In scenes with densely distributed objects, bounding boxes of different colors are used to distinguish object categories. For clarity, confidence scores and category labels are omitted in such cases.
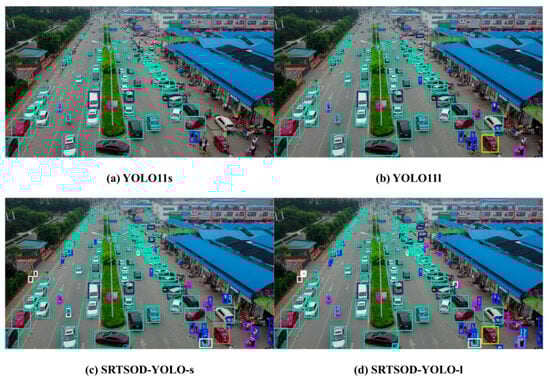
Figure 10.
Visualization of experimental results. A visual comparative analysis of detection performance between the proposed model and the baseline model on the VisDrone2019 dataset demonstrates that our method achieves improved detection of densely distributed small targets. Boxes of different colors represent targets of different categories predicted by the model.
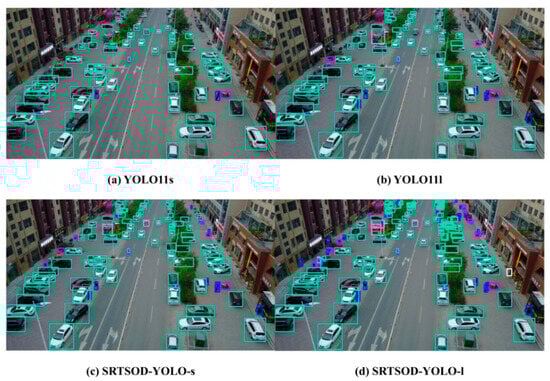
Figure 11.
Visualization of experimental results. Boxes of different colors represent targets of different categories predicted by the model.
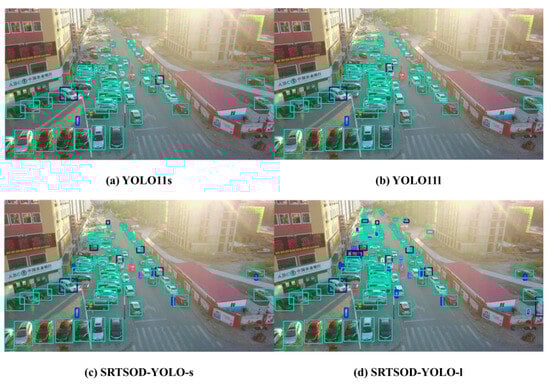
Figure 12.
Visualization of experimental results. Our method is capable of detecting small targets that are densely distributed in complex scenarios more effectively. Boxes of different colors represent targets of different categories predicted by the model.
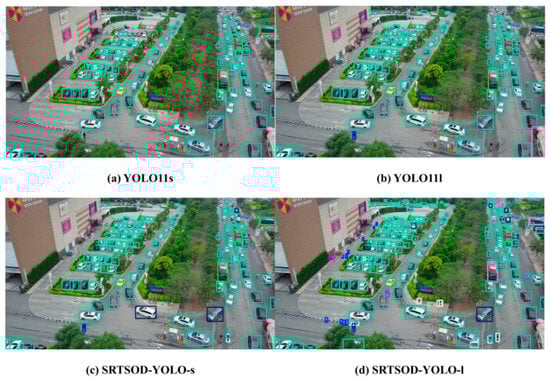
Figure 13.
Visualization of experimental results. Boxes of different colors represent targets of different categories predicted by the model.
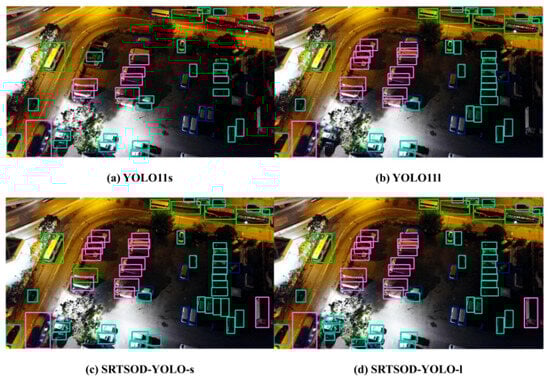
Figure 14.
Visualization of experimental results. Our method is capable of detecting targets in low-light conditions more effectively. Boxes of different colors represent targets of different categories predicted by the model.
Furthermore, visual comparisons of class activation maps reveal that our proposed model substantially outperforms the baseline in target perception and localization accuracy. As shown in Figure 15, Figure 16, Figure 17, Figure 18 and Figure 19, the heatmap visualization clearly illustrates the model’s ability to suppress false detections and improve target capture in complex scenes. In these maps, warm-colored areas (e.g., red or yellow) indicate regions with high model confidence regarding target presence, reflecting reliable localization. This form of analysis not only demonstrates the advantage of our approach but also offers valuable visual guidance for subsequent model tuning and refinement. Using such visualization, we can accurately assess model behavior in specific scenarios and identify potential directions for improvement.
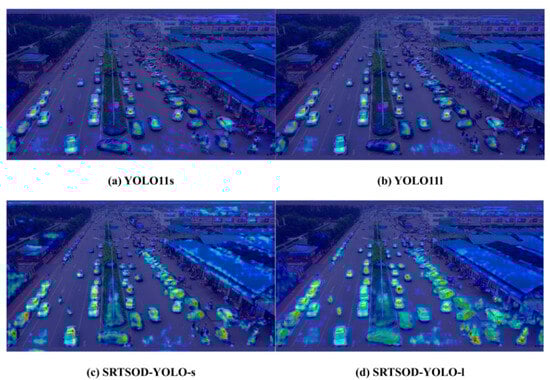
Figure 15.
The heat map visualization comparison between the proposed model and the benchmark model on the Visdrone2019 dataset. Our model can precisely locate the targets in complex scenarios.
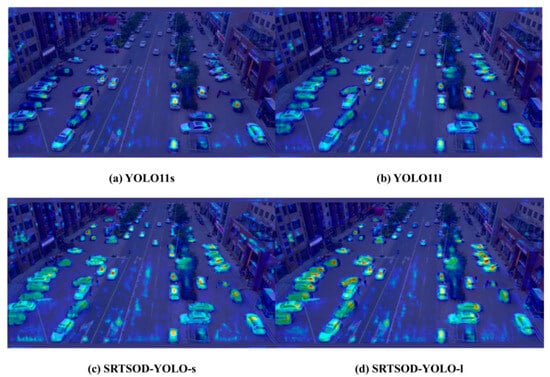
Figure 16.
The heat map visualization comparison between the proposed model and the benchmark model on the Visdrone2019 dataset.
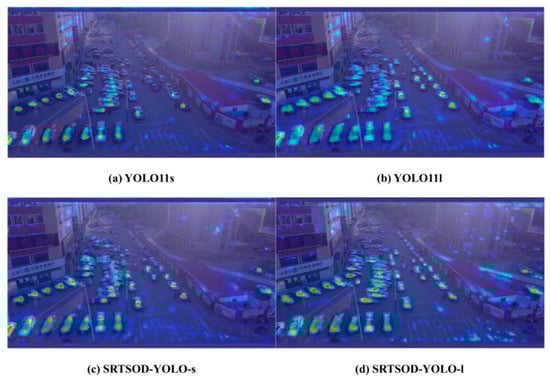
Figure 17.
The visualization of heat map results. Our model can precisely locate the targets in complex scenarios.
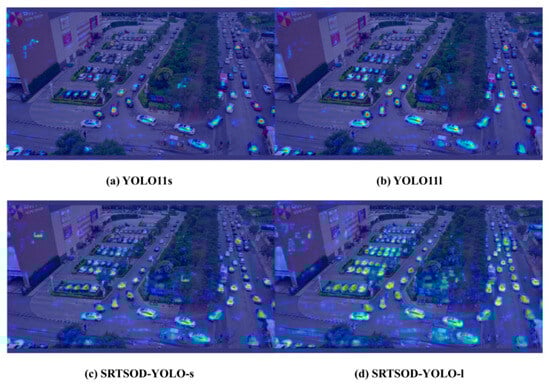
Figure 18.
The visualization of heat map results.
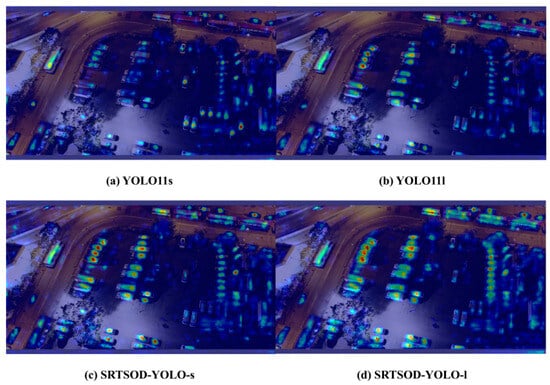
Figure 19.
The visualization of heat map results. Our model can precisely locate the target even in low-light conditions, without paying attention to the background.
As shown in Figure 20, both of the two scenarios in the picture are facing the problems of insufficient light and motion blur. The first row represents the prediction results of YOLO11l, and the second row represents the prediction results of SRTSOD-YOLO-l. Compared with YOLO11l, our model is capable of accurately detecting small targets under low-light conditions and targets with motion blur, demonstrating the superiority of the proposed method.
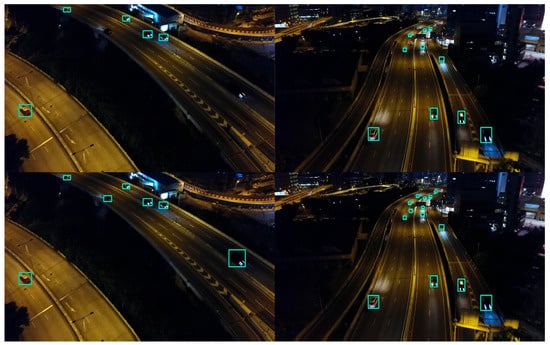
Figure 20.
Comparison of detection results of SRTSOD-YOLO-l and YOLO111 in low-light and motion-blurred scenes. The first row shows the prediction results of YOLO111, and the second row shows the prediction results of SRTSOD-YOLO-l. Our model can detect moving blurry targets under low-light conditions.
3.8. Comparison with YOLO Series Algorithms
The YOLO network is a benchmark framework for one-stage object detection. To validate the effectiveness of SRTSOD-YOLO, particularly for UAV applications, we systematically compared it against other YOLO series models on the VisDrone2019 dataset, focusing on detection accuracy, model parameters, and computational complexity.
3.8.1. Comparison with YOLO Series Lightweight Models
To fairly compare the performance of various lightweight models, we selected YOLOv3 Tiny, YOLOv5s, YOLOv6s, YOLOv7 Tiny, YOLOv8s and YOLOv10s for testing. All models were trained with consistent hyperparameter settings, and none were loaded with any pre-training weights. Specific performance data are recorded in Table 12 and Figure 21.
Table 12.
Comparison of SRTSOD-YOLO-s and YOLO series lightweight models.
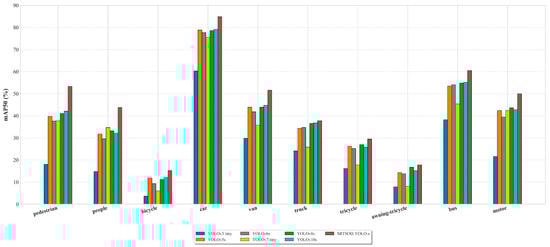
Figure 21.
Detection accuracy of various lightweight models for different classes on Visdrone2019 dataset.
The experimental data finally confirmed that compared with the YOLO series lightweight models, SRTSOD-YOLO-s achieved the best recognition effect on the premise of fewer parameters and lower computing resource requirements, and its advancement was confirmed. As shown in Figure 21, compared with large-scale targets such as “cars” and “buses”, SRTSOD-YOLO-s shows the best recognition ability in recognizing small targets (such as “people” and “pedestrian”). Specifically, in the “pedestrian” target category, compared with the YOLOv10s model, its detection performance has improved by 11.2%, and in the “people” target category, compared with the YOLOv10s model, its detection performance has improved by 11.5%. It demonstrates the model’s excellent ability in small-size target recognition tasks. The efficiency of other lightweight networks in this detection task is low, because the design of these models is positioned on the detection of conventional-scale targets, and the recognition of small-scale targets is not particularly enhanced.
3.8.2. Comparison with YOLO Series Large-Scale Models
In order to verify the competitive performance of the proposed model SRTSOD-YOLO, we conducted a systematic horizontal evaluation of the YOLO series of large models based on the VisDrone2019 dataset. See Table 13 and Figure 22 for details of the comparison results of refinement performance.
Table 13.
Comparison of large-scale models of SRTSOD-YOLO-l and YOLO series.
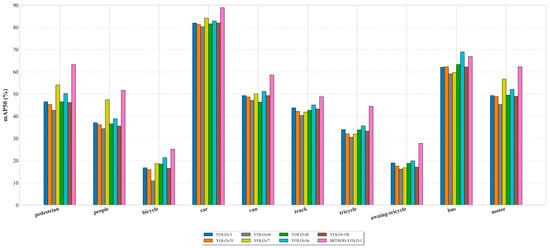
Figure 22.
Detection accuracy of various large-scale models for different classes on the Visdrone2019 dataset.
We included the YOLOv9e model in this comparison. Table 13 shows that SRTSOD-YOLO-1 is the best in three indicators: mAP@0.5, mAP@0.5:0.95 and floating-point computation, and YOLOv9e ranks second in mAP@0.5 indicator. Specifically, the mAP50 index of SRTSOD-YOLO-1 was 4.9% higher than that of YOLOv9e, but only 48.1% of the number of parameters of YOLOv9e. Figure 22 shows that YOLOv9e surpasses SRTSOD-YOLO-1 in detecting “bus” objects. However, its detection accuracy for other small-sized objects is significantly lower than that of SRTSOD-YOLO-l. These findings highlight the excellent performance of the SRTSOD-YOLO series in small object detection. It is worth noting that SRTSOD-YOLO-l has the least amount of floating-point operations among all models, highlighting its design efficiency.
In conclusion, experiments confirm that the proposed model provides the best performance at different scales. It has higher accuracy and computational efficiency than other models and is more compact. The results provide a reliable basis for selecting the most appropriate model scale according to the task requirements and computing platform conditions in practical applications.
3.9. Comparison with Other Object Detection Models
To comprehensively evaluate the performance of the SRTSOD-YOLO series models, we established a multi-dimensional comparison framework that incorporates various scaled versions of YOLO-based algorithms as well as well-established classical detection methods as benchmark references. In the field of object detection research, significant discrepancies exist across experimental paradigms adopted by different research teams. Variations are commonly observed in dataset selection, hardware configurations, and hyperparameter settings. Moreover, widely used models often lack uniformity in data partitioning strategies—such as the ratio of training, validation, and test sets—as well as in the definition of target categories. Some studies do not fully disclose experimental details or report a complete set of evaluation metrics, and many advanced models have not released source code. These factors collectively hinder the fair comparison of results across studies. To ensure the rigor and verifiability of our conclusions, we strictly adhered to the data splitting protocols and input size standards used by leading models in the domain. All models were trained on the public VisDrone benchmark dataset, and their performance was evaluated on a standardized test set.
As shown in Table 14, we provide a systematic quantitative comparison between the proposed model and several state-of-the-art methods on the VisDrone dataset. The horizontal evaluation demonstrates a key advantage of our approach: it achieves leading performance in both target recognition and localization accuracy while maintaining low architectural complexity. This balance of high accuracy and low resource demand endows the model with strong perceptual capability and high computational efficiency. The resulting improvement in real-time processing efficiency enhances the practical value of the model and its potential for integration into systems operating in highly dynamic environments.
Table 14.
Comparison of SRTSOD-YOLO series models and other object detection models on Visdrone2019 dataset.
3.10. Comparison of UAVDT Dataset
To evaluate the generalization capability of the proposed model, we conducted comparative experiments on the UAVDT dataset. The results are shown in Table 15, and SRTSOD-YOLO-1 showed the best performance on the mAP@0.5 evaluation index. In addition, SRTSOD-YOLO-n has the best performance in model parameters and floating-point calculations. Based on these findings, the proposed model has a satisfactory generalization ability.
Table 15.
Comparison of SRTSOD-YOLO series models and other object detection models on UAVDT dataset.
4. Discussion
There are many difficulties in target detection of UAV aerial images. This section describes SRTSOD-YOLO’s solutions to these problems.
4.1. Multi-Scale Object Coexistence and Difficult Feature Extraction Problem
UAVs capture targets from varying angles and distances, resulting in significant scale variations for the same object across different viewpoints. Furthermore, within the same aerial scene, targets closer to the UAV appear larger, while those farther away are imaged at smaller scales. The presence of multi-scale targets and the difficulty in extracting discriminative features—particularly for small objects—pose considerable challenges for object detection in UAV imagery.
To address these issues, SRTSOD-YOLO incorporates a Multi-scale Feature Complementary Aggregation Module (MFCAM) into the backbone network. The MFCAM effectively combines multi-scale convolutional feature extraction with channel and spatial attention mechanisms, enabling the model to capture the positions of objects across varying scales. Additionally, in the neck of the network, SRTSOD-YOLO integrates large-scale shallow features, which are rich in spatial detail, with deep features that carry strong semantic information.
At the detection head, SRTSOD-YOLO removes the large-object detection head (20 × 20 pixels) from the top of the original feature pyramid and introduces a new detection head specialized for tiny targets (160 × 160 pixels). As a result, the three detection heads of SRTSOD-YOLO are responsible for large, medium, and small targets, respectively.
4.2. Complex Background Interference and Positive and Negative Sample Imbalance Problem
To address the challenges of complex background interference and foreground-background sample imbalance in UAV aerial imagery, we introduce a new neck architecture termed Gated Activation Convolutional Fusion Pyramid Network (GAC-FPN). This module enhances the integration of spatial and semantic information during multi-scale feature fusion, establishes a complementary interaction mechanism across multi-level features, and effectively emphasizes salient features while suppressing irrelevant background noise. Furthermore, to mitigate the issue of sample imbalance, we replace the conventional binary cross-entropy loss in the detection head with an adaptive threshold focal loss. Collectively, these enhancements enable SRTSOD-YOLO to accurately localize objects even under complex background conditions and significant sample imbalance.
5. Conclusions
This study presents and validates an improved real-time object detection algorithm for identifying small targets—including various common vehicles and pedestrians—in UAV aerial imagery. The core contributions are threefold. First, a Multi-scale Feature Complementary Aggregation Module (MFCAM) is incorporated into the backbone network. By integrating channel and spatial attention mechanisms with multi-scale convolutional feature extraction, the module enhances the capability to accurately localize small objects in the image. Second, a novel Gated Activation Convolutional Fusion Pyramid Network (GAC-FPN) is introduced to optimize multi-scale feature fusion. Finally, an adaptive threshold focal loss function is adopted in place of the standard binary cross-entropy loss to better handle foreground-background sample imbalance. The synergistic effect of these innovations significantly improves the model’s accuracy in detecting small objects under complex background conditions.
To accommodate diverse application requirements, we developed the SRTSOD-YOLO series of models with varying parameter scales. Our model variants (n, s, m, l) follow a structured scaling strategy tailored for practical deployment. Each variant is systematically designed to offer a spectrum of solutions—from lightweight versions suitable for onboard drone computation to larger models intended for ground-station processing. This scalable and application-oriented design constitutes a key contribution of our work, emphasizing real-world usability across diverse operational settings. Experiments on two widely used UAV datasets, VisDrone2019 and UAVDT, fully demonstrate the effectiveness and real-time capability of the proposed algorithm. Compared to several state-of-the-art object detection models, SRTSOD-YOLO achieves competitive performance on key metrics including mAP@0.5 and mAP@0.5:0.95. It also significantly reduces both false and missed detection rates while maintaining low computational overhead.
The innovative method proposed in this work not only effectively addresses the challenge of small target detection in UAV imagery but also demonstrates broad application potential. In critical domains such as smart city management, dynamic environmental monitoring, and post-disaster emergency response, accurate identification of small targets is essential for enabling efficient decision-making and timely operational response. Future research will focus on further compressing the model size and reducing computational overhead while maintaining high accuracy. In light of the environmental diversity and dynamic conditions encountered in UAV applications, we will also explore more adaptive mechanisms and robust learning strategies to enhance the model’s generalization across diverse and complex mission scenarios. Additionally, we plan to engage in industry collaboration to facilitate real-world deployment and experimental validation of the model, with the goal of providing more powerful and flexible target detection solutions for UAV-related fields.
Author Contributions
Conceptualization, Z.X., H.Z. and P.L.; methodology, Z.X., H.Z. and P.L.; software, Z.X. and G.Z.; validation, Z.X., G.Z. and Y.C.; writing—original draft preparation, Z.X.; writing—review and editing, Z.X. and L.W. All authors have read and agreed to the published version of the manuscript.
Funding
This research received no external funding.
Data Availability Statement
The original contributions presented in the study are included in the article, further inquiries can be directed to the corresponding author.
Acknowledgments
We thank the editors and reviewers for their hard work and valuable advice.
Conflicts of Interest
The authors declare no conflicts of interest.
References
- Byun, S.; Shin, I.-K.; Moon, J.; Kang, J.; Choi, S.-I. Road Traffic Monitoring from UAV Images Using Deep Learning Networks. Remote Sens. 2021, 13, 4027. [Google Scholar] [CrossRef]
- Sun, W.; Dai, L.; Zhang, X.; Chang, P.; He, X. RSOD: Real-Time Small Object Detection Algorithm in UAV-Based Traffic Monitoring. Appl. Intell. 2022, 52, 8448–8463. [Google Scholar] [CrossRef]
- Muhmad Kamarulzaman, A.M.; Wan Mohd Jaafar, W.S.; Mohd Said, M.N.; Saad, S.N.M.; Mohan, M. UAV Implementations in Urban Planning and Related Sectors of Rapidly Developing Nations: A Review and Future Perspectives for Malaysia. Remote Sens. 2023, 15, 2845. [Google Scholar] [CrossRef]
- Yu, Y.; Gu, T.; Guan, H.; Li, D.; Jin, S. Vehicle Detection From High-Resolution Remote Sensing Imagery Using Convolutional Capsule Networks. IEEE Geosci. Remote Sens. Lett. 2019, 16, 1894–1898. [Google Scholar] [CrossRef]
- Li, Y.; Huang, Y.; Tao, Q. Improving Real-Time Object Detection in Internet-of-Things Smart City Traffic with YOLOv8-DSAF Method. Sci. Rep. 2024, 14, 17235. [Google Scholar] [CrossRef]
- An, R.; Zhang, X.; Sun, M.; Wang, G. GC-YOLOv9: Innovative Smart City Traffic Monitoring Solution. Alex. Eng. J. 2024, 106, 277–287. [Google Scholar] [CrossRef]
- Li, Z.; Zhang, Y.; Wu, H.; Suzuki, S.; Namiki, A.; Wang, W. Design and Application of a UAV Autonomous Inspection System for High-Voltage Power Transmission Lines. Remote Sens. 2023, 15, 865. [Google Scholar] [CrossRef]
- Vedanth, S.; Udit Narayana, K.B.; Harshavardhan, S.; Rao, T.; Kodipalli, A. Drone-Based Artificial Intelligence for Efficient Disaster Management: The Significance of Accurate Object Detection and Recognition. In Proceedings of the 2024 IEEE 9th International Conference for Convergence in Technology (I2CT), Pune, India, 5–7 April 2024; pp. 1–5. [Google Scholar] [CrossRef]
- Girshick, R.; Donahue, J.; Darrell, T.; Malik, J. Rich Feature Hierarchies for Accurate Object Detection and Semantic Segmentation. In Proceedings of the 2014 IEEE Conference on Computer Vision and Pattern Recognition (CVPR), Columbus, OH, USA, 23–28 June 2014. [Google Scholar] [CrossRef]
- He, K.; Zhang, X.; Ren, S.; Sun, J. Spatial Pyramid Pooling in Deep Convolutional Networks for Visual Recognition. IEEE Trans. Pattern Anal. Mach. Intell. 2015, 37, 1904–1916. [Google Scholar] [CrossRef]
- Girshick, R. Fast R-CNN. In Proceedings of the IEEE International Conference on Computer Vision (ICCV), Santiago, Chile, 7–13 December 2015; pp. 1440–1448. [Google Scholar] [CrossRef]
- Ren, S.; He, K.; Girshick, R.; Sun, J. Faster R-CNN: Towards Real-Time Object Detection with Region Proposal Networks. IEEE Trans. Pattern Anal. Mach. Intell. 2017, 39, 1137–1149. [Google Scholar] [CrossRef]
- Vaswani, A.; Shazeer, N.; Parmar, N.; Uszkoreit, J.; Jones, L.; Gomez, A.N.; Kaiser, Ł.; Polosukhin, I. Attention Is All You Need. In Proceedings of the 31st Annual Conference on Neural Information Processing Systems (NIPS), Long Beach, CA, USA, 4–9 December 2017. [Google Scholar]
- Dosovitskiy, A.; Beyer, L.; Kolesnikov, A.; Weissenborn, D.; Zhai, X.; Unterthiner, T.; Dehghani, M.; Minderer, M.; Heigold, G.; Gelly, S.; et al. An Image Is Worth 16 × 16 Words: Transformers for Image Recognition at Scale. arXiv 2021, arXiv:2010.11929. [Google Scholar] [CrossRef]
- Carion, N.; Massa, F.; Synnaeve, G.; Usunier, N.; Kirillov, A.; Zagoruyko, S. End-to-End Object Detection with Transformers. In Lecture Notes in Computer Science; Springer International Publishing: Cham, Switzerland 2020; pp. 213–229. [Google Scholar] [CrossRef]
- Lin, T.; Maire, M.; Belongie, S.; Hays, J.; Perona, P.; Ramanan, D.; Zitnick, L. Microsoft COCO: Common Objects in Context. In Lecture Notes in Computer Science; Springer International Publishing: Cham, Switzerland, 2014; pp. 740–755. [Google Scholar] [CrossRef]
- Everingham, M.; Van Gool, L.; Williams, C.K.I.; Winn, J.; Zisserman, A. The Pascal Visual Object Classes (VOC) Challenge. Int. J. Comput. Vis. 2010, 88, 303–338. [Google Scholar] [CrossRef]
- Long, Y.; Gong, Y.; Xiao, Z.; Liu, Q. Accurate Object Localization in Remote Sensing Images Based on Convolutional Neural Networks. IEEE Trans. Geosci. Remote Sens. 2017, 55, 2486–2498. [Google Scholar] [CrossRef]
- Yu, X.; Gong, Y.; Jiang, N.; Ye, Q.; Han, Z. Scale Match for Tiny Person Detection. In Proceedings of the 2020 IEEE Winter Conference on Applications of Computer Vision (WACV), Snowmass Village, CO, USA, 1–5 March 2020. [Google Scholar] [CrossRef]
- Li, W.; Wei, W.; Zhang, L. GSDet: Object Detection in Aerial Images Based on Scale Reasoning. IEEE Trans. Image Process. 2021, 30, 4599–4609. [Google Scholar] [CrossRef] [PubMed]
- Liu, K.; Fu, Z.; Jin, S.; Chen, Z.; Zhou, F.; Jiang, R.; Chen, Y.; Ye, J. ESOD: Efficient Small Object Detection on High-Resolution Images. IEEE Trans. Image Process. 2025, 34, 183–195. [Google Scholar] [CrossRef]
- Adaimi, G.; Kreiss, S.; Alahi, A. Perceiving Traffic from Aerial Images. arXiv 2020, arXiv:2009.07611. [Google Scholar] [CrossRef]
- Bouguettaya, A.; Zarzour, H.; Kechida, A.; Taberkit, A.M. Vehicle Detection From UAV Imagery with Deep Learning: A Review. IEEE Trans. Neural Netw. Learn. Syst. 2022, 33, 6047–6067. [Google Scholar] [CrossRef] [PubMed]
- Zhu, P.; Wen, L.; Bian, X.; Ling, H.; Hu, Q. Vision Meets Drones: A Challenge. arXiv 2018, arXiv:1804.07437. [Google Scholar] [CrossRef]
- Du, B.; Huang, Y.; Chen, J.; Huang, D. Adaptive Sparse Convolutional Networks with Global Context Enhancement for Faster Object Detection on Drone Images. In Proceedings of the 2023 IEEE/CVF Conference on Computer Vision and Pattern Recognition (CVPR), Vancouver, BC, Canada, 18–22 June 2023; pp. 13435–13444. [Google Scholar] [CrossRef]
- Ghiasi, G.; Cui, Y.; Srinivas, A.; Qian, R.; Lin, T.-Y.; Cubuk, E.D.; Le, Q.V.; Zoph, B. Simple Copy-Paste Is a Strong Data Augmentation Method for Instance Segmentation. In Proceedings of the 2021 IEEE/CVF Conference on Computer Vision and Pattern Recognition (CVPR), Nashville, TN, USA, 19–25 June 2021. [Google Scholar] [CrossRef]
- Kisantal, M.; Wojna, Z.; Murawski, J.; Naruniec, J.; Cho, K. Augmentation for Small Object Detection. arXiv 2019, arXiv:1902.07296. [Google Scholar] [CrossRef]
- Chen, C.; Zhang, Y.; Lv, Q.; Wei, S.; Wang, X.; Sun, X.; Dong, J. RRNet: A Hybrid Detector for Object Detection in Drone-Captured Images. In Proceedings of the 2019 IEEE/CVF International Conference on Computer Vision Workshop (ICCVW), Seoul, Republic of Korea, 27 October–2 November 2019. [Google Scholar] [CrossRef]
- Zhang, X.; Izquierdo, E.; Chandramouli, K. Dense and Small Object Detection in UAV Vision Based on Cascade Network. In Proceedings of the 2019 IEEE/CVF International Conference on Computer Vision Workshop (ICCVW), Seoul, Republic of Korea, 27 October–2 November 2019; pp. 118–126. [Google Scholar] [CrossRef]
- Wang, X.; Zhu, D.; Yan, Y. Towards Efficient Detection for Small Objects via Attention-Guided Detection Network and Data Augmentation. Sensors 2022, 22, 7663. [Google Scholar] [CrossRef]
- Bosquet, B.; Cores, D.; Seidenari, L.; Brea, V.M.; Mucientes, M.; Bimbo, A.D. A Full Data Augmentation Pipeline for Small Object Detection Based on Generative Adversarial Networks. Pattern Recognit. 2023, 133, 108998. [Google Scholar] [CrossRef]
- Liu, S.; Qi, L.; Qin, H.; Shi, J.; Jia, J. Path Aggregation Network for Instance Segmentation. In Proceedings of the 31st IEEE/CVF Conference on Computer Vision and Pattern Recognition (CVPR), Salt Lake City, UT, USA, 18–22 June 2018; pp. 8759–8768. [Google Scholar] [CrossRef]
- Liu, Z.; Gao, G.; Sun, L.; Fang, L. IPG-Net: Image Pyramid Guidance Network for Small Object Detection. In Proceedings of the 2020 IEEE/CVF Conference on Computer Vision and Pattern Recognition Workshops (CVPRW), Seattle, WA, USA, 14–19 June 2020; pp. 4422–4430. [Google Scholar] [CrossRef]
- Gong, Y.; Yu, X.; Ding, Y.; Peng, X.; Zhao, J.; Han, Z. Effective Fusion Factor in FPN for Tiny Object Detection. In Proceedings of the 2021 IEEE Winter Conference on Applications of Computer Vision (WACV), Waikoloa, HI, USA, 3–8 January 2021; pp. 1159–1167. [Google Scholar] [CrossRef]
- Liu, S.; Huang, D.; Wang, Y. Learning Spatial Fusion for Single-Shot Object Detection. arXiv 2019, arXiv:1911.09516. [Google Scholar] [CrossRef]
- Yang, X.; Yang, J.; Yan, J.; Zhang, Y.; Zhang, T.; Guo, Z.; Sun, X.; Fu, K. SCRDet: Towards More Robust Detection for Small, Cluttered and Rotated Objects. In Proceedings of the 2019 IEEE/CVF International Conference on Computer Vision (ICCV), Seoul, Republic of Korea, 27 October–2 November 2019; pp. 8231–8240. [Google Scholar] [CrossRef]
- Fu, J.; Sun, X.; Wang, Z.; Fu, K. An Anchor-Free Method Based on Feature Balancing and Refinement Network for Multiscale Ship Detection in SAR Images. IEEE Trans. Geosci. Remote Sens. 2021, 59, 1331–1344. [Google Scholar] [CrossRef]
- Lu, X.; Ji, J.; Xing, Z.; Miao, Q. Attention and Feature Fusion SSD for Remote Sensing Object Detection. IEEE Trans. Instrum. Meas. 2021, 70, 1–9. [Google Scholar] [CrossRef]
- Ran, Q.; Wang, Q.; Zhao, B.; Wu, Y.; Pu, S.; Li, Z. Lightweight Oriented Object Detection Using Multiscale Context and Enhanced Channel Attention in Remote Sensing Images. IEEE J. Sel. Top. Appl. Earth Obs. Remote Sens. 2021, 14, 5786–5795. [Google Scholar] [CrossRef]
- Wu, X.; Hong, D.; Chanussot, J. UIU-Net: U-Net in U-Net for Infrared Small Object Detection. IEEE Trans. Image Process. 2023, 32, 364–376. [Google Scholar] [CrossRef]
- Du, D.; Qi, Y.; Yang, Y.; Duan, K.; Zhang, W.; Huang, Q.; Tian, Q. The Unmanned Aerial Vehicle Benchmark: Object Detection and Tracking. In Lecture Notes in Computer Science; Springer International Publishing: Cham, Switzerland, 2018; pp. 375–391. [Google Scholar] [CrossRef]
- Zhu, P.; Wen, L.; Du, D.; Bian, X.; Fan, H.; Hu, Q.; Ling, H. Detection and Tracking Meet Drones Challenge. IEEE Trans. Pattern Anal. Mach. Intell. 2022, 44, 7380–7399. [Google Scholar] [CrossRef]
- Yue, M.; Zhang, L.; Huang, J.; Zhang, H. Lightweight and Efficient Tiny-Object Detection Based on Improved YOLOv8n for UAV Aerial Images. Drones 2024, 8, 276. [Google Scholar] [CrossRef]
- Bai, C.; Zhang, K.; Jin, H.; Qian, P.; Zhai, R.; Lu, K. SFFEF-YOLO: Small Object Detection Network Based on Fine-Grained Feature Extraction and Fusion for Unmanned Aerial Images. Image Vision. Comput. 2025, 156, 105469. [Google Scholar] [CrossRef]
- Wang, H.; Shen, Q.; Deng, Z. A Diverse Knowledge Perception and Fusion Network for Detecting Targets and Key Parts in UAV Images. Neurocomputing 2025, 612, 128748. [Google Scholar] [CrossRef]
- Liu, J.; Wen, B.; Xiao, J.; Sun, M. Design of UAV Target Detection Network Based on Deep Feature Fusion and Optimization with Small Targets in Complex Contexts. Neurocomputing 2025, 639, 130207. [Google Scholar] [CrossRef]
- Wang, J.; Li, X.; Chen, J.; Zhou, L.; Guo, L.; He, Z.; Zhou, H.; Zhang, Z. DPH-YOLOv8: Improved YOLOv8 Based on Double Prediction Heads for the UAV Image Object Detection. IEEE Trans. Geosci. Remote Sens. 2024, 62, 1–15. [Google Scholar] [CrossRef]
- Chen, Y.; Ye, Z.; Sun, H.; Gong, T.; Xiong, S.; Lu, X. Global–Local Fusion with Semantic Information Guidance for Accurate Small Object Detection in UAV Aerial Images. IEEE Trans. Geosci. Remote Sens. 2025, 63, 1–15. [Google Scholar] [CrossRef]
- Ying, Z.; Zhou, J.; Zhai, Y.; Quan, H.; Li, W.; Genovese, A.; Piuri, V.; Scotti, F. Large-Scale High-Altitude UAV-Based Vehicle Detection via Pyramid Dual Pooling Attention Path Aggregation Network. IEEE Trans. Intell. Transport. Syst. 2024, 25, 14426–14444. [Google Scholar] [CrossRef]
- Ding, X.; Zhang, R.; Liu, Q.; Yang, Y. Real-Time Small Object Detection Using Adaptive Weighted Fusion of Efficient Positional Features. Pattern Recognit. 2025, 167, 111717. [Google Scholar] [CrossRef]
- Redmon, J.; Divvala, S.; Girshick, R.; Farhadi, A. You Only Look Once: Unified, Real-Time Object Detection. In Proceedings of the 2016 IEEE Conference on Computer Vision and Pattern Recognition (CVPR), Las Vegas, NV, USA, 27–30 June 2016; pp. 779–788. [Google Scholar] [CrossRef]
- Redmon, J.; Farhadi, A. YOLO9000: Better, Faster, Stronger. In Proceedings of the 2017 IEEE Conference on Computer Vision and Pattern Recognition (CVPR), Honolulu, HI, USA, 21–26 July 2017; pp. 6517–6525. [Google Scholar] [CrossRef]
- Redmon, J.; Farhadi, A. YOLOv3: An Incremental Improvement. arXiv 2018, arXiv:1804.02767. [Google Scholar] [CrossRef]
- Bochkovskiy, A.; Wang, C.-Y.; Liao, H.-Y.M. YOLOv4: Optimal Speed and Accuracy of Object Detection. arXiv 2020, arXiv:2004.10934. [Google Scholar] [CrossRef]
- Li, C.; Li, L.; Jiang, H.; Weng, K.; Geng, Y.; Li, L.; Ke, Z.; Li, Q.; Cheng, M.; Nie, W.; et al. YOLOv6: A Single-Stage Object Detection Framework for Industrial Applications. arXiv 2022, arXiv:2209.02976. [Google Scholar] [CrossRef]
- Wang, C.-Y.; Bochkovskiy, A.; Liao, H.-Y.M. YOLOv7: Trainable Bag-of-Freebies Sets New State-of-the-Art for Real-Time Object Detectors. In Proceedings of the 2023 IEEE/CVF Conference on Computer Vision and Pattern Recognition (CVPR), Vancouver, BC, Canada, 17–24 June 2023; pp. 7464–7475. [Google Scholar] [CrossRef]
- Wang, C.; Yeh, I.; Yuan, H. YOLOv9: Learning What You Want to Learn Using Programmable Gradient Information. In Lecture Notes in Computer Science; Springer Nature Switzerland: Cham, Switzerland, 2025; pp. 1–21. [Google Scholar] [CrossRef]
- Wang, A.; Chen, H.; Liu, L.; Chen, K.; Lin, Z.; Han, J.; Ding, G. YOLOv10: Real-Time End-to-End Object Detection. Adv. Neural Inf. Process. Syst. 2024, 37, 107984–108011. [Google Scholar]
- Xiao, Y.; Xu, T.; Xin, Y.; Li, J. FBRT-YOLO: Faster and Better for Real-Time Aerial Image Detection. In Proceedings of the 39th AAAI Conference on Artificial Intelligence, Philadelphia, PA, USA, 25 February–4 March 2025; pp. 8673–8681. [Google Scholar]
- Lin, T.-Y.; Dollar, P.; Girshick, R.; He, K.; Hariharan, B.; Belongie, S. Feature Pyramid Networks for Object Detection. In Proceedings of the 2017 IEEE Conference on Computer Vision and Pattern Recognition (CVPR), Honolulu, HI, USA, 21–26 July 2017. [Google Scholar] [CrossRef]
- Liu, H.; Jia, C.; Shi, F.; Cheng, X.; Chen, S. SCSegamba: Lightweight Structure-Aware Vision Mamba for Crack Segmentation in Structures. In Proceedings of the 2025 IEEE Conference on on Computer Vision and Pattern Recognition (CVPR), Nashville, TN, USA, 10–17 June 2025; pp. 29406–29416. [Google Scholar] [CrossRef]
- Dauphin, Y.N.; Fan, A.; Auli, M.; Grangier, D. Language Modeling with Gated Convolutional Networks. In Proceedings of the International Conference on Machine Learning, Sydney, NSW, Australia, 6–11 August 2017; pp. 933–941. [Google Scholar]
- Yu, J.; Lin, Z.; Yang, J.; Shen, X.; Lu, X.; Huang, T.S. Free-Form Image Inpainting With Gated Convolution. In Proceedings of the 2019 IEEE/CVF International Conference On Computer Vision (ICCV 2019), Seoul, Republic of Korea, 27 October–2 November 2019; pp. 4470–4479. [Google Scholar] [CrossRef]
- Li, J.; Nie, Q.; Fu, W.; Lin, Y.; Tao, G.; Liu, Y.; Wang, C. LORS: Low-Rank Residual Structure for Parameter-Efficient Network Stacking. In Proceedings of the 2024 IEEE/CVF Conference on Computer Vision and Pattern Recognition (CVPR), Seattle, WA, USA, 17–21 June 2024; pp. 15866–15876. [Google Scholar] [CrossRef]
- Ronneberger, O.; Fischer, P.; Brox, T. U-Net: Convolutional Networks for Biomedical Image Segmentation. In Proceedings of the Medical Image Computing and Computer-Assisted Intervention—MICCAI 2015, Munich, Germany, 5–9 October 2015; Navab, N., Hornegger, J., Wells, W.M., Frangi, A.F., Eds.; Lecture Notes in Computer Science; Springer International Publishing: Cham, Switzerland, 2015; Volume 9351, pp. 234–241. [Google Scholar] [CrossRef]
- Hu, J.; Shen, L.; Albanie, S.; Sun, G.; Wu, E. Squeeze and Excitation Networks. IEEE Trans. Pattern Anal. Mach. Intell. 2020, 42, 2011–2023. [Google Scholar] [CrossRef]
- Woo, S.; Park, J.; Lee, J.-Y.; Kweon, I.S. CBAM: Convolutional Block Attention Module. arXiv 2018, arXiv:1807.06521. [Google Scholar] [CrossRef]
- Ouyang, D.; He, S.; Zhang, G.; Luo, M.; Guo, H.; Zhan, J.; Huang, Z. Efficient Multi-Scale Attention Module with Cross-Spatial Learning. In Proceedings of the ICASSP 2023—2023 IEEE International Conference on Acoustics, Speech and Signal Processing (ICASSP), Rhodes Island, Greece, 4–9 June 2023; pp. 1–5. [Google Scholar] [CrossRef]
- Tan, M.; Pang, R.; Le, Q.V. EfficientDet: Scalable and Efficient Object Detection. In Proceedings of the 2020 IEEE/CVF Conference on Computer Vision and Pattern Recognition (CVPR), Seattle, WA, USA, 13–19 June 2020; pp. 10778–10787. [Google Scholar] [CrossRef]
- Yang, G.; Lei, J.; Zhu, Z.; Cheng, S.; Feng, Z.; Liang, R. AFPN: Asymptotic Feature Pyramid Network for Object Detection. In Proceedings of the 2023 IEEE International Conference on Systems, Man, and Cybernetics (SMC), Honolulu, Oahu, HI, USA, 1–4 October 2023; pp. 2184–2189. [CrossRef]
- Yang, B.; Zhang, X.; Zhang, J.; Luo, J.; Zhou, M.; Pi, Y. EFLNet: Enhancing Feature Learning Network for Infrared Small Target Detection. IEEE Trans. Geosci. Remote Sens. 2024, 62, 1–11. [Google Scholar] [CrossRef]
- Bolya, D.; Foley, S.; Hays, J.; Hoffman, J. TIDE: A General Toolbox for Identifying Object Detection Errors. In Lecture Notes in Computer Science; Springer International Publishing: Cham, Switzerland, 2020; pp. 558–573. [Google Scholar] [CrossRef]
- Xu, H.; Zheng, W.; Liu, F.; Li, P.; Wang, R. Unmanned Aerial Vehicle Perspective Small Target Recognition Algorithm Based on Improved YOLOv5. Remote Sens. 2023, 15, 3583. [Google Scholar] [CrossRef]
- Li, Y.; Fan, Q.; Huang, H.; Han, Z.; Gu, Q. A Modified YOLOv8 Detection Network for UAV Aerial Image Recognition. Drones 2023, 7, 304. [Google Scholar] [CrossRef]
- Tahir, N.U.A.; Long, Z.; Zhang, Z.; Asim, M.; ELAffendi, M. PVswin-YOLOv8s: UAV-Based Pedestrian and Vehicle Detection for Traffic Management in Smart Cities Using Improved YOLOv8. Drones 2024, 8, 84. [Google Scholar] [CrossRef]
- Wang, G.; Chen, Y.; An, P.; Hong, H.; Hu, J.; Huang, T. UAV-YOLOv8: A Small-Object-Detection Model Based on Improved YOLOv8 for UAV Aerial Photography Scenarios. Sensors 2023, 23, 7190. [Google Scholar] [CrossRef]
- Zhang, Z. Drone-YOLO: An Efficient Neural Network Method for Target Detection in Drone Images. Drones 2023, 7, 526. [Google Scholar] [CrossRef]
- Liu, Y.; Zhang, J.; Liu, S.; Xu, L.; Wang, Y. Aams-Yolo: A Small Object Detection Method for UAV Capture Scenes Based on YOLOv7. Clust. Comput. 2025, 28, 1–14. [Google Scholar] [CrossRef]
- Chen, Z.; Zhang, Y.; Xing, S. YOLO-LE: A Lightweight and Efficient UAV Aerial Image Target Detection Model. Comput. Mater. Contin. 2025, 84, 1787–1803. [Google Scholar] [CrossRef]
- Lu, Y.; Sun, M. Lightweight Multidimensional Feature Enhancement Algorithm LPS-YOLO for UAV Remote Sensing Target Detection. Sci. Rep. 2025, 15, 1340. [Google Scholar] [CrossRef]
- Wang, H.; Liu, J.; Zhao, J.; Zhang, J.; Zhao, D. Precision and Speed: LSOD-YOLO for Lightweight Small Object Detection. Expert. Syst. Appl. 2025, 269, 126440. [Google Scholar] [CrossRef]
- Zhou, L.; Zhao, S.; Liu, Z.; Zhang, W.; Qiao, B.; Liu, Y. A Lightweight Aerial Image Object Detector Based on Mask Information Enhancement. IEEE Trans. Instrum. Meas. 2025, 74, 1–17. [Google Scholar] [CrossRef]
- Jiang, L.; Yuan, B.; Du, J.; Chen, B.; Xie, H.; Tian, J.; Yuan, Z. MFFSODNet: Multiscale Feature Fusion Small Object Detection Network for UAV Aerial Images. IEEE Trans. Instrum. Meas. 2024, 73, 1–14. [Google Scholar] [CrossRef]
- Yan, H.; Kong, X.; Wang, J.; Tomiyama, H. ST-YOLO: An Enhanced Detector of Small Objects in Unmanned Aerial Vehicle Imagery. Drones 2025, 9, 338. [Google Scholar] [CrossRef]
Disclaimer/Publisher’s Note: The statements, opinions and data contained in all publications are solely those of the individual author(s) and contributor(s) and not of MDPI and/or the editor(s). MDPI and/or the editor(s) disclaim responsibility for any injury to people or property resulting from any ideas, methods, instructions or products referred to in the content. |
© 2025 by the authors. Licensee MDPI, Basel, Switzerland. This article is an open access article distributed under the terms and conditions of the Creative Commons Attribution (CC BY) license (https://creativecommons.org/licenses/by/4.0/).