Article

Method for Obtaining Water-Leaving Reflectance from Unmanned Aerial Vehicle Hyperspectral Remote Sensing Based on Air–Ground Collaborative Calibration for Water Quality Monitoring

1
Key Laboratory of Spectral Imaging Technology, Xi’an Institute of Optics and Precision Mechanics, Chinese Academy of Sciences, Xi’an 710119, China
2
School of Electronic and Information Engineering, Xi’an Jiao Tong University, Xi’an 710049, China
3
Department of Computer Sciences, University of Miami, Miami, FL 33136, USA
*
Author to whom correspondence should be addressed.
Remote Sens. 2025, 17(20), 3413; https://doi.org/10.3390/rs17203413 (registering DOI)
Submission received: 1 August 2025 / Revised: 30 September 2025 / Accepted: 9 October 2025 / Published: 12 October 2025
(This article belongs to the Special Issue Remote Sensing in Water Quality Monitoring)

Abstract

Highlights

What are the main findings?
  • This study proposed an air–ground collaboration + neural network method, which achieved superior water-leaving reflectance inversion (450–900 nm band), with inversion curves closely matching ground measurements obtained using an analytical spectral device (ASD). In addition, the proposed method reduced the average spectral angle matching (SAM) from 0.5433 using existing methods to 0.1070, improving quantitative accuracy of approximately 80%.
  • High-precision water quality inversion models (R2 > 0.85 for turbidity, color, TN, and TP) were established and validated in both the demonstration areas (Three Gorges and Poyang Lake), showing strong applicability across diverse water bodies.
What is the implication of the main finding?
  • It addresses key limitations of traditional water-leaving reflectance methods, such as satellite dependence, limited ground applicability, and low-accuracy UAV approaches. It introduces a reliable UAV hyperspectral processing solution that enables accurate three-dimensional water monitoring.
  • The constructed water quality parameter inversion models demonstrated high accuracy and verified the feasibility of air–ground integrated UAV monitoring, thereby addressing the research gap in non-linear conversion from hyperspectral to water-leaving reflectance and providing practical support for water quality assessment.

Abstract

Unmanned aerial vehicle (UAV) hyperspectral remote sensing imaging systems have demonstrated significant potential for water quality monitoring. However, accurately obtaining water-leaving reflectance from UAV imagery remains challenging due to complex atmospheric radiation transmission above water bodies. This study proposes a method for water-leaving reflectance inversion based on air–ground collaborative correction. A fully connected neural network model was developed using TensorFlow Keras to establish a non-linear mapping between UAV hyperspectral reflectance and the measured near-water and water-leaving reflectance from ground-based spectral. This approach addresses the limitations of traditional linear correction methods by enabling spatiotemporal synchronization correction of UAV remote sensing images with ground observations, thereby minimizing atmospheric interference and sensor differences on signal transmission. The retrieved water-leaving reflectance closely matched measured data within the 450–900 nm band, with the average spectral angle mapping reduced from 0.5433 to 0.1070 compared to existing techniques. Moreover, the water quality parameter inversion models for turbidity, color, total nitrogen, and total phosphorus achieved high determination coefficients (R2 = 0.94, 0.93, 0.88, and 0.85, respectively). The spatial distribution maps of water quality parameters were consistent with in situ measurements. Overall, this UAV hyperspectral remote sensing method, enhanced by air–ground collaborative correction, offers a reliable approach for UAV hyperspectral water quality remote sensing and promotes the advancement of stereoscopic water environment monitoring.

1. Introduction

The spectral characteristics of water bodies are primarily influenced by the composition and concentration of compounds present in the water, which convey specific information regarding water quality. Simultaneously, they are affected by external factors, mainly manifested in the substantial variations in absorption and reflection of different wavelength ranges for water quality parameters at various concentrations; this constitutes the principle and basis of quantitative remote sensing for monitoring water quality parameters [1,2]. Therefore, the objective of water quality remote sensing monitoring is to obtain valuable information regarding water bodies while minimizing external interference, thereby enabling the identification of various substances and their concentrations by mitigating the noise effects [3]. Water-leaving reflectance is a core parameter in watercolor remote sensing, defined as the reflection signal of solar radiation that escapes from the water surface after being absorbed and scattered by the water body. Its spectral characteristics directly reflect the optical properties of total nitrogen, total phosphorus, suspended solids, chlorophyll, dissolved organic matter, and sediment in the water body [4,5,6,7,8]. Research has demonstrated that unmanned aerial vehicle systems offer great potential for water monitoring due to their high spatial resolution, operational flexibility, and real-time monitoring capabilities [9,10,11]. However, because of the complexity of atmospheric radiation transmission above the water surface, it is challenging for unmanned aerial vehicle hyperspectral remote sensing to accurately retrieve water-leaving reflectance [12]. Therefore, atmospheric correction is essential for obtaining reliable water-leaving reflectance. Correlations and differences exist between the atmospheric correction methods used in unmanned aerial vehicle systems and those applied in satellite constellations. Although drone and satellite data require atmospheric correction, the methods and complexity differ. Specifically, this complexity mainly arises from the following aspects: first, sky glint is an important interference source, and its intensity and distribution are affected by various factors such as solar altitude angle, observation geometry, atmospheric aerosols, and Rayleigh scattering, which significantly increase the non-water signal components in the total radiance signal received by the sensor [13]. Second, surface mirror reflection (Sun Glint) closely resembles that of a mirror. The resulting flare noise can notably interfere with the weak underwater radiance signal, and its intensity is closely related to the surface roughness (wind and waves) [14].
Furthermore, the refraction and reflection processes at the air–water interface and the internal light field characteristics of the water body contribute to the complex nature of electromagnetic wave transmission in the water body complex [15]. In addition, unmanned aerial vehicle platforms are usually located within the atmosphere (usually at an altitude of <1 km), and their observation geometry differs significantly from satellite platforms. Traditional atmospheric correction methods for satellite remote sensing may no longer be entirely applicable [16]. Finally, there are significant differences in the degree of influence of different angles of sky light (such as zenith angles of 0° and 45°) (with an average absolute percentage difference MAPD of up to 17.21%), further complicating the accurate removal of sky light effects [17].
The method for obtaining water-leaving reflectance based on satellite platforms focuses on atmospheric correction and extracts optical signals of pure water by eliminating interference such as Rayleigh scattering, aerosol scattering, and solar flares [18,19,20]. The main process involves the use of single scattering models (e.g., Gordon algorithm) or dual-band near-infrared methods (e.g., SeaWiFS) to estimate aerosol contribution [21]; this is combined with shortwave infrared band (SWIR) data to correct the near-infrared water reflectance of turbid water bodies. Raw data is converted into reflectance via radiometric calibration, whereas the Rayleigh scattering path radiation is calculated based on radiative transfer models (e.g., 6S and 6SV). The aerosol parameters are optimized using the dark pixel assumption or multi-band collaborative inversion. Concurrently, geometric correction, solar flare models, and empirical regression methods are used to improve accuracy. Typical sensors, such as MODIS, achieve high-precision inversion of a class of water bodies using the above methods [22]; however, complex aerosol and flare interference remain the main challenges. The commonly used models for atmospheric radiation correction include the FLAASH [23] and QUAC [24] models.
The atmospheric impact on unmanned aerial vehicle systems is relatively minimal due to their low flight altitude; however, calibration is still required [25]. The atmospheric correction of unmanned aerial vehicles usually adopts the empirical linear method, dark target method, or radiative transfer model [26]. For example, in the ESA-MDN study, researchers increased the sample size through data augmentation and corrected it using a radiative transfer model [27]. In addition, some studies use ground calibration targets for real-time calibration to improve data accuracy. Notably, polarization remote sensing is emerging as a new direction for atmospheric correction. The IPAC (Intelligent Polarization Atmospheric Correction) algorithm developed by the team led by He Xianqiang utilizes polarization information to eliminate atmospheric interference and improve correction accuracy; this approach is suitable for implementation on both unmanned aerial vehicles and satellite platforms [28]. Currently, no standard method for obtaining water reflectance through atmospheric correction on unmanned water surfaces exists. The following are typical existing studies:
Researchers from the East China Normal University studied river and lake water environment detection using UAV hyperspectral remote sensing [29]. They employed spectral measurement methods above the water surface to simultaneously acquire the sky radiance above the reference plate. The influence of atmospheric radiation is ignored at this scale. Under stable lighting conditions, it is assumed that the sky radiance measured synchronously on the ground is consistent with the sky radiance of the corresponding area in the UAV aerial image. Based on this, the formula for calculating R r s U A V ( λ ) of the UAV hyperspectral remote sensing water-leaving reflectance is as follows:
R r s U A V ( λ ) = L U A V ( λ ) 0.023 L s k y ( λ ) π L r e f ( λ ) / R r e f ( λ )
In Formula (1), L U A V ( λ ) represents the conversion of the digital signal collected by the hyperspectral detector into radiance data; L s k y ( λ ) is the sky light incident radiance measured synchronously on the ground, corresponding to the sky light radiance above the drone image. As the drone passes over the area, a ground spectrometer is used to synchronously measure the reflectance R r e f ( λ ) and downward radiance L r e f ( λ ) of the reference plate multiple times. λ represents the wavelength.
Researchers from Belgium and the UK studied UAVs for inland water quality mapping [30]. The formula for calculating water-leaving reflectance ρ ω ( i ) is presented as follows:
ρ ω ( i ) = π L c a m e r a ( i ) E d ( i ) π r ( θ υ ) L s k y ( θ υ , φ υ , i ) E d ( i )
In Formula (2), i is the wavelength; r ( θ υ ) is the Fresnel reflectance; θ υ is the view zenith angle; φ υ is the view azimuth angle; L s k y is the downwelling sky radiance; and E d is the downwelling irradiance above the surface.
Researchers from Hubei and Wuhan Universities used near-water end remote sensing reflectance measured at water surface control points to establish a corresponding relationship with the remote sensing data cube collected by UAVs. They performed radiometric correction of the UAV remote sensing system to obtain correction coefficients [31,32]. The corresponding relationship for obtaining the water-leaving reflectance is outlined as follows:
r e f l e c tan c e = a D N ( r a d i a n c e ) + b
In Formula (3), DN is the digital number, and a and b are parameters.
In May 2025, researchers from the Indian Institute of Technology proposed an atmospheric correction algorithm specifically designed for UAV-based hyperspectral data, known as the Hycor method [33]. The Hycor algorithm integrates direct on-site atmospheric measurements, such as pressure, temperature, and relative humidity, along with solar and sensor geometries, to enhance the accuracy of atmospheric path radiation estimation. This novel method greatly reduces systematic and random errors across the entire visible and near-infrared wavelength range, thereby improving the accuracy of water radiation inversion. The primary calculation formula for this method is outlined as follows:
R r s ( λ ) = L T ( λ ) L r ( λ ) L a ( λ ) d 2 × cos θ × e T T ( λ ) 2 1 cos θ × t ( λ ) F 0 ( λ )
In Formula (4), L T ( λ ) represents the top-of-atmosphere total radiance; L r ( λ ) is the Rayleigh scattering radiance; L a ( λ ) represents aerosol scattering radiance; d represents the distance from the sensor to the target; θ is the observation zenith angle; T T ( λ ) represents the vertical transmittance of the top atmosphere; t ( λ ) denotes diffuse atmospheric transmission; F 0 ( λ ) is the solar spectral irradiance; and λ represents the wavelength.
In addition, when employing specific equipment, such as hyperspectral radiometers, to obtain near-water end reflectance on the ground near the water surface, the commonly used observation method above the water surface [34] involves synchronously measuring the surface radiance of the water body, background radiance of the sky, and reflection signal from a standard reference plate at a specific observation angle. The near-water end reflectance of a pure water body is calculated by subtracting the skylight interference reflected by the air–water interface [35] and combining it with solar irradiance data [36]. To ensure accuracy, strict control of environmental disturbances (e.g., waves), adherence to standardized operating procedures, and reliable data support for ground validation and atmospheric correction model optimization are essential.
Therefore, A key challenge in retrieving water-leaving reflectance using unmanned aerial vehicle hyperspectral water remote sensing is that traditional satellite platforms require complex atmospheric correction, and are dependent on specific satellite platforms, rendering them unsuitable for unmanned aerial vehicle platforms. If the near water surface measurement method is used, it is important to note that although there are standard methods for measuring the water-leaving reflectance at the near water end, these cannot be directly applied to the water-leaving reflectance obtained from unmanned aerial vehicle surface sources. The method employed by the East China Normal University [29] directly incorporates the remote sensing radiance measured by UAVs into the formula for quantifying the water-leaving reflectance at the inlet end. This method requires rigorous and precise radiometric calibration of the spectrometer carried by the UAV. The methods used by researchers in Belgium and the UK [30] are fundamentally identical to those used by researchers at East China Normal University [29]. The methods used by researchers from the Hubei and Wuhan Universities [31,32] quantify near-water end reflectance on the ground and subsequently apply a straightforward linear formula to linearly convert radiance into reflectance, notwithstanding the inherent non-linear relationship. The Hycor method employed by researchers at the Indian Institute of Technology Madras [33] requires the simultaneous measurement of pressure, temperature, and relative humidity, along with multiple environmental indicators, such as solar energy and sensor geometry, thereby rendering the calibration process relatively complex.
The main objectives of this study were as follows: First, a UAV-based water quality monitoring and treatment process based on air–ground collaborative correction was proposed to resolve issues in existing UAV remote sensing water quality monitoring methods. Second, a mapping method between the hyperspectral reflectance of UAVs and near-water end water-leaving reflectance based on a fully connected neural network model using TensorFlow Keras was proposed to address the challenge of deriving water reflectance from UAV hyperspectral remote sensing. Finally, the effectiveness of the proposed method for converting water-leaving reflectance was verified through comparative experimental data, and the feasibility of the basic process of air–ground integrated three-dimensional UAV water quality monitoring was demonstrated through actual concentration parameter inversion. The findings of this study are anticipated to advance our understanding of UAV-based hyperspectral reflectance retrieval for aquatic environments and provide a theoretical basis for high-resolution, air–ground integrated water quality monitoring frameworks.

2. Materials and Methods

2.1. Research Area and Data Collection

Two inland water experimental areas were selected to verify the effectiveness of the innovative method proposed in this study: the Poyang Lake and Three Gorges test sites. The specific locations of the research areas were as follows: Wucheng Town in Jiujiang City, Jiangxi Province, China (29°11′12.4″N, 116°0′46.2″E) and Guojiaba Town in Yichang City, Hubei Province, China (30°57′21.5″N, 110° 44′58.7″E). The rationale for selecting the above two research areas is as follows: First, Poyang Lake is a typical large freshwater lake in China, and the Three Gorges is a key water conservancy hub on the main stream of the Yangtze River. Both are core inland water bodies of the Yangtze River Basin and are highly representative regarding hydrological conditions, ecological functions, and water environment evolution. Studying these areas enhances the value of the research findings for basin-scale promotion. Second, this study is part of the Chinese Academy of Sciences’ major strategic pilot special Class A plan (“Yangtze River mainstream water environment and water ecology integration multifactor monitoring technology and application”, project number: XDA23040101). Poyang Lake and the Three Gorges were predetermined key research areas for this project, with comprehensive baseline data and on-site observation conditions, providing a solid foundation for the smooth implementation of the research. The specific settings for the two experimental sites are presented in Figure 1.
The weather conditions are favorable for conducting drone flight experiments in both experimental areas, with clear skies and minimal wind, and the specific experimental time is during the window period of direct sunlight. In the remote sensing experiment conducted on water bodies outside the Three Gorges Demonstration Zone, a camera lens with a focal length of 16 mm was used; the drone flight altitude was set to 100 m, the theoretical ground resolution of the image was 0.045 m, and 34 control points were established on the ground. In the field remote sensing experiment of water bodies in the Poyang Lake demonstration area, a camera lens with a focal length of 16 mm was also used; the drone flight altitude was set to 120 m, the theoretical ground resolution of the image was 0.038 m, and 30 control points were established on the ground. The planning method for drone flight experiments is the route + waypoint approach.
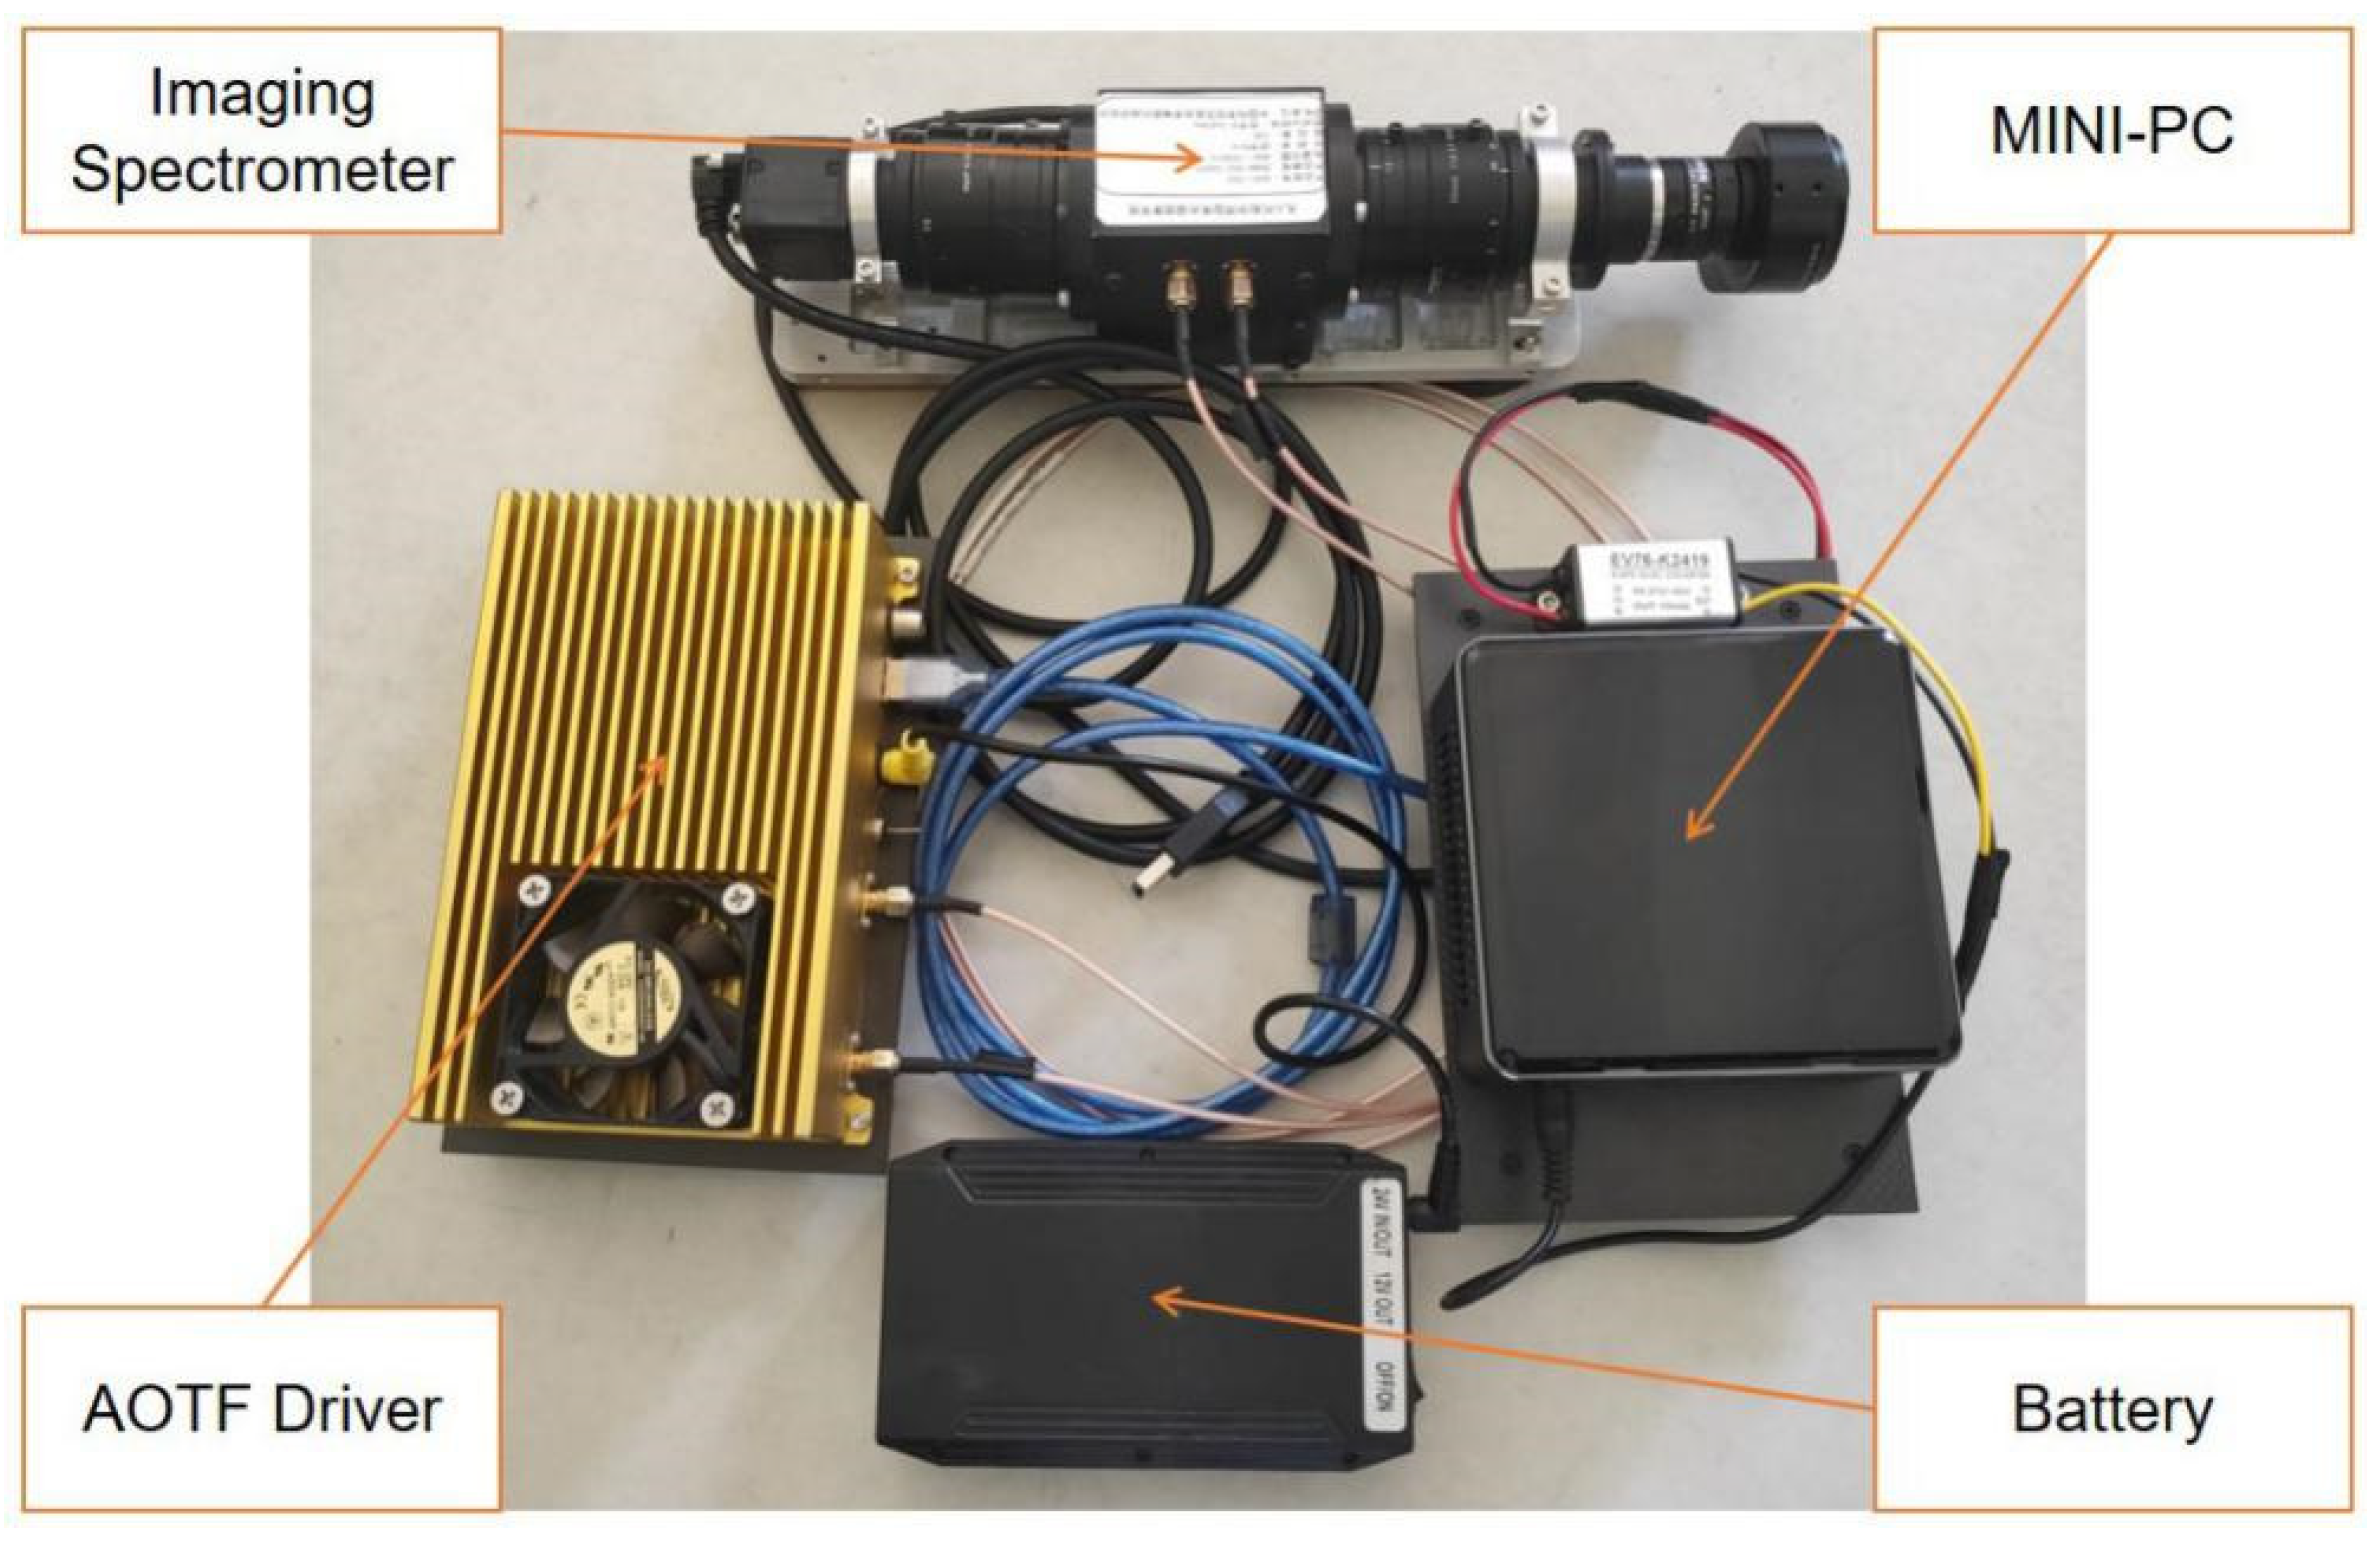
The data acquisition system comprised a UAV hyperspectral imaging system based on acousto-optic tunable filtering (AOTF) [37], an innovative technology integration solution in low altitude remote sensing. The fundamental principle is to control the radio frequency signal driver (AOTF Driver) by transmitting instructions to the control computer (MINI-PC) to generate sine wave radio frequency signals of specific frequencies. Second, the RF signal is transmitted to the ultrasonic transducer of the AOTF module to complete the conversion between RF and ultrasonic signals. Ultrasonic waves induce birefringence changes in AOTF crystals (TeO2 crystals are used in this system), enabling filtering selection of incident light [38] and obtaining an image of monochromatic light. When combined with an array camera, an image of a single spectral band is captured, and spatial images of all spectral bands are captured through rapid spectral tuning, ultimately forming a hyperspectral data cube [39]. The hyperspectral imaging device used in this research institute is a self-developed equipment (Figure 2).
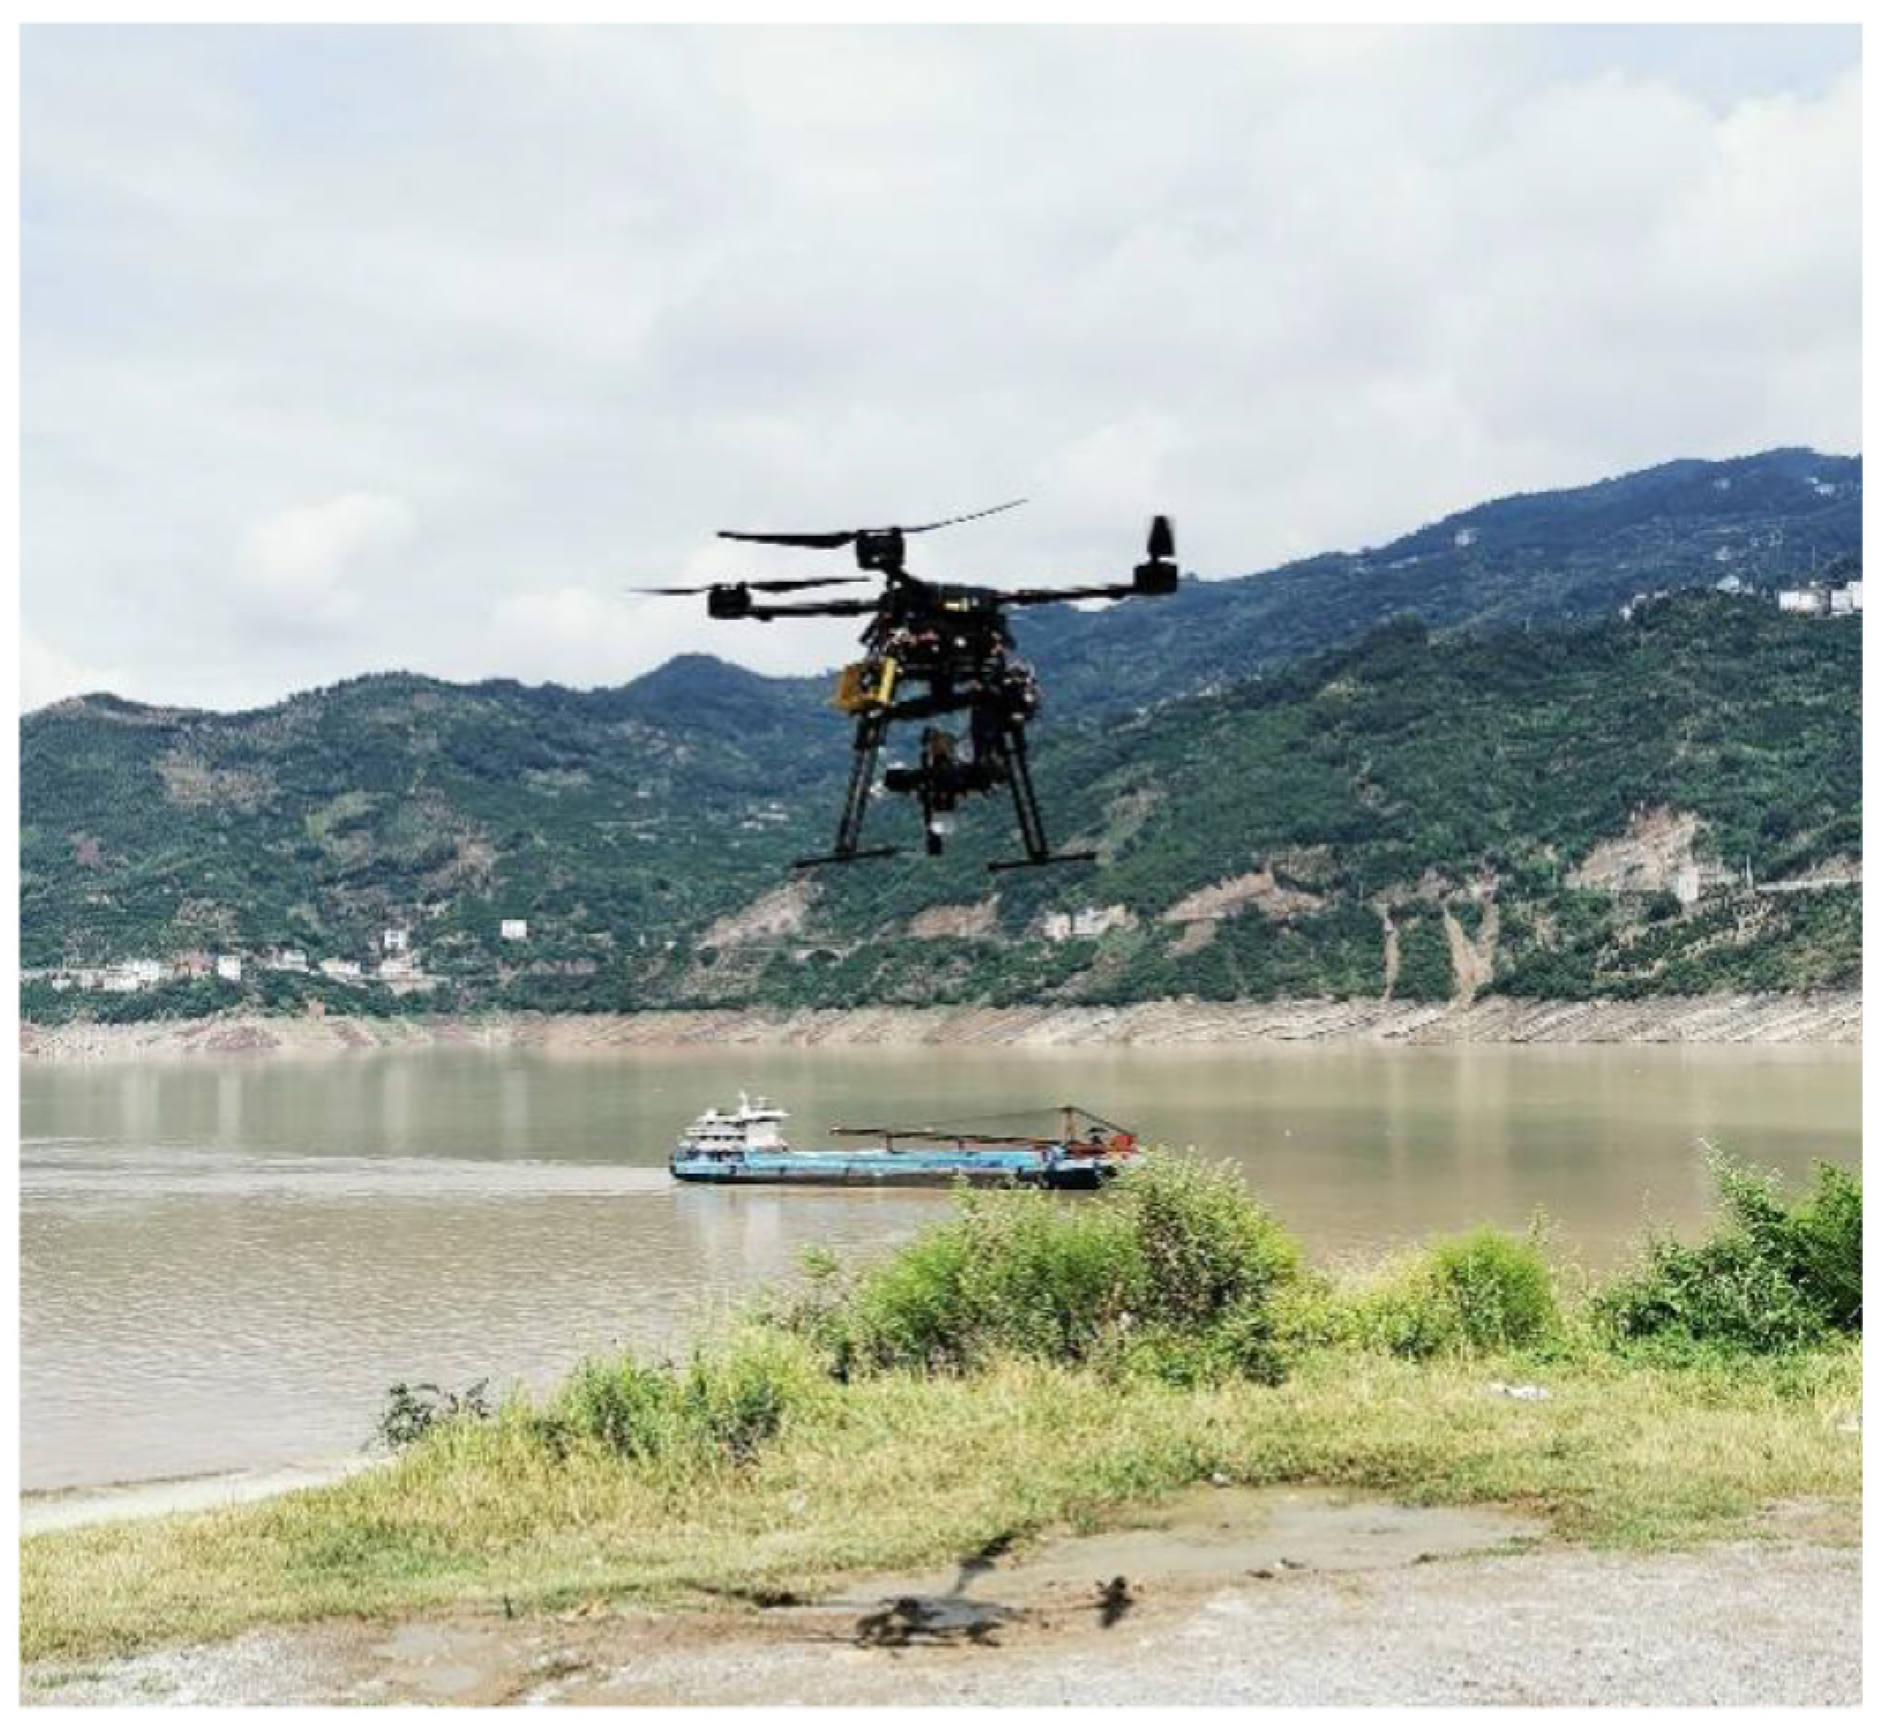
The AOTF spectral imaging instrument designed in this study mainly consisted of four parts: an imaging spectrometer, an AOTF driver, a MINI-PC, and a battery. It is compatible with various types of unmanned aerial vehicle platforms, such as multirotor and fixed wing, with extremely fast response speed (microsecond-level band switching), capable of autonomously completing data acquisition. The AOTF-based unmanned aerial vehicle hyperspectral imaging system used in this study was composed of a quadcopter unmanned aerial vehicle (DJI WIND4 customized flight platform [40]), a stable platform system (DJI Ronin MX gimbal system [41]), and a microcomputer (Intel NUC mini host, model: NUC7i5BNH, processor: Intel Core i5-7260U; Manufacturer: Intel Corporation, City: Beijing, Country: China) based on the core AOTF spectral imaging instrument. Data collection was conducted using the mode of flight route + waypoint to collect a hyperspectral data cube. The actual flight image of the UAV hyperspectral remote sensing imaging system based on AOTF is shown in Figure 3:
The AOTF-based UAV hyperspectral imaging remote sensing system consisted of a quadcopter UAV, an AOTF-based spectral scanning imaging spectrometer, a stable platform system, a microprocessor, and other components. Data collection was performed using the flight route + waypoint mode. The primary technical parameters of the AOTF-based UAV hyperspectral remote sensing imaging system used in this study are listed in Table 1.

2.2. Air–Ground Collaborative UAV Hyperspectral Water Quality Monitoring Method

Establishing a mapping relationship between UAV-based hyperspectral reflectance and near-water end water-leaving reflectance is a key research focus with substantial practical value for water body remote sensing applications. This approach aims to retrieve accurate water-leaving reflectance using UAV spectral imaging.
First, an analytical spectral device (ASD, an American ASD FieldSpec 3 field portable spectrometer (wavelength range of 350–2500 nm), manufactured by ASD Lnc. (Boulder, CO, USA), was used on the ground to measure the radiance at the water surface control point and obtain the near-ground control point (GCP) water reflectance. The water-leaving reflectance measured directly near the water surface reflects the intrinsic optical characteristics of the water body, including chlorophyll and suspended solid concentrations, and serves as a key parameter for watercolor remote sensing inversion. Second, the hyperspectral reflectance of UAVs: The reflectance data acquired using hyperspectral sensors mounted on UAVs typically contain hundreds of continuous narrowband information but are affected by atmospheric scattering, lighting conditions, and sensor noise [42].
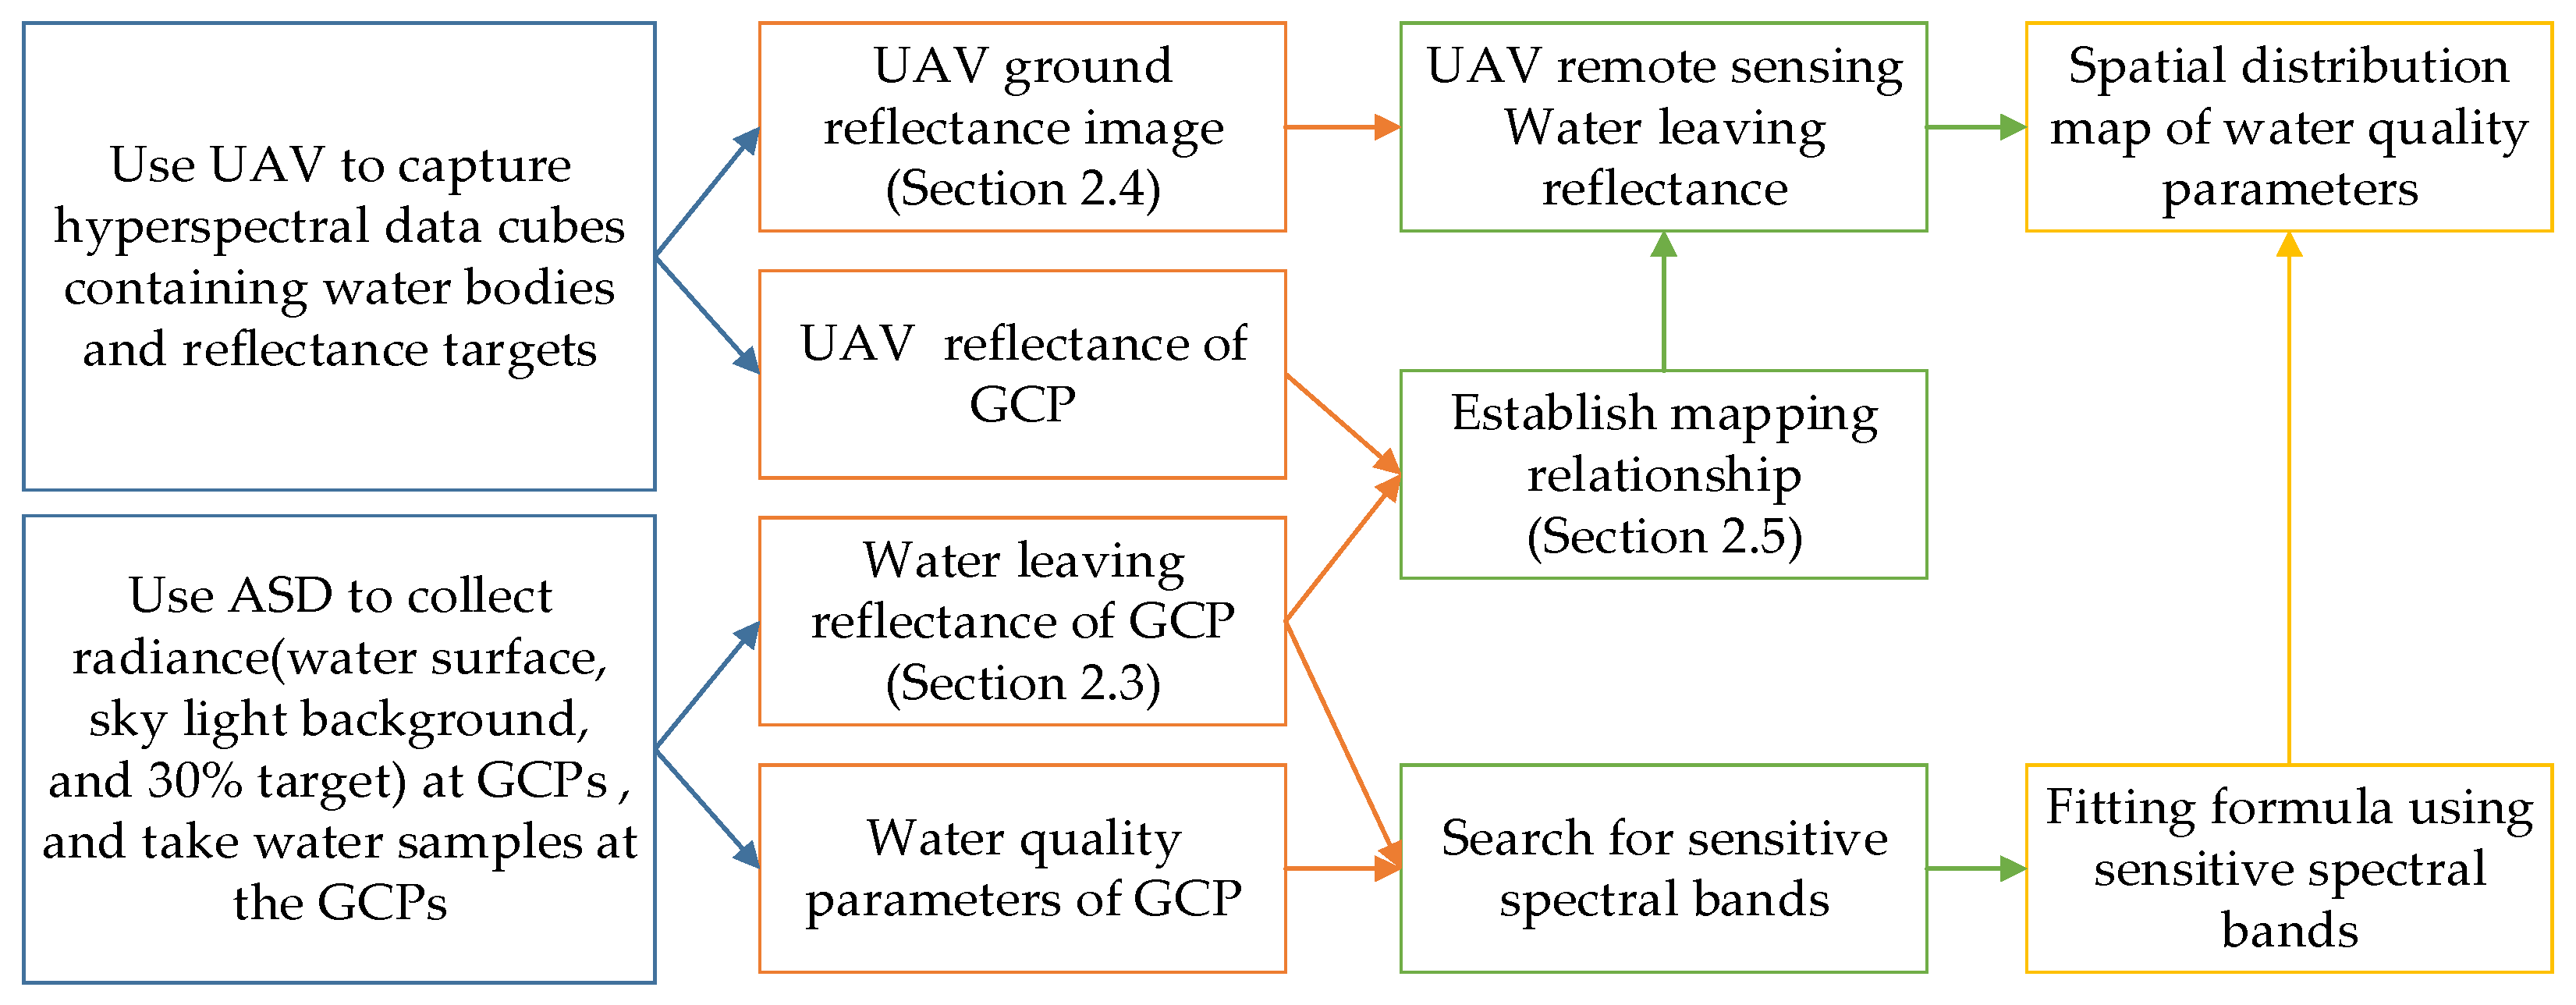
The impact of atmospheric scattering includes the addition of path radiance, which causes the measured radiation to deviate from the true reflectance. Variations in lighting conditions, such as the lighting angle/aerosol load, affect multiple scattering intensity and interfere with the radiation levels. Sensor noise arises from dark current, timing deviation, and anomalies in GPS/IMU data. Then, the mapping relationship was obtained by correcting the interfered UAV reflectance data to the near-water end measurement equivalent water reflectance, thereby improving the water quality parameter inversion accuracy. Finally, we identified the sensitive bands, fitted the conversion formula between water quality parameters and sensitive bands, and combined it with UAV remote sensing (water-leaving) reflectance images to obtain a spatial distribution map of water quality parameters via spectral segment calculation. A flowchart of the integrated three-dimensional UAV water quality monitoring system is presented in Figure 4.
The proposed monitoring procedure involved the following steps:
Step 1: The UAV flight experiment captured a hyperspectral data cube containing water bodies and reflectance targets. After capture, data preprocessing (including flat-field correction, registration, mosaicking, etc.) was performed. According to the method described in Section 2.4, the UAV-derived ground reflectance images were obtained, and the reflectance spectra of the ground control points were extracted based on the coordinates of these points.
Step 2: While the UAV captured data in the air, an ASD spectrometer was used at the ground control points to measure the radiance of the water surface, skyglow background, and a 30% reflectance target. Meanwhile, water samples were collected at the ground control points, and the actual water quality parameters of the control points were measured using sensors (measuring turbidity, color, and other parameters) or chemical methods (measuring total nitrogen, total phosphorus, and other parameters). According to the method in Section 2.3, the remote sensing reflectance (Rrs) of the control points was calculated.
Step 3: Using the reflectance spectra of the ground control points acquired by the UAV in Step 1 and the remote sensing reflectance spectra of the ground control points collected by the ASD in Step 2, the mapping relationship between these two sets of reflectance spectra was established based on the “UAV-borne hyperspectral remote sensing reflectance conversion method using a fully connected neural network” described in Section 2.5.
Step 4: Using the mapping relationship established in Step 3, the reflectance images acquired by the UAV were converted into UAV remote sensing reflectance images. Then, the sensitive bands corresponding to specific water quality parameters were identified using the remote sensing reflectance spectra of the ground control points and the actual water quality parameters. Subsequently, the fitting formula between the sensitive bands and water quality parameters was obtained by fitting the sensitive bands with the actual water quality parameters.
Step 5: The UAV remote sensing reflectance images converted in Step 3 were input into the water quality parameter fitting formula obtained in Step 4, and band operation was performed. Finally, the spatial distribution map of water quality parameters was generated.

2.3. Method for Obtaining the Water-Leaving Reflectance of the Ground near the Water End

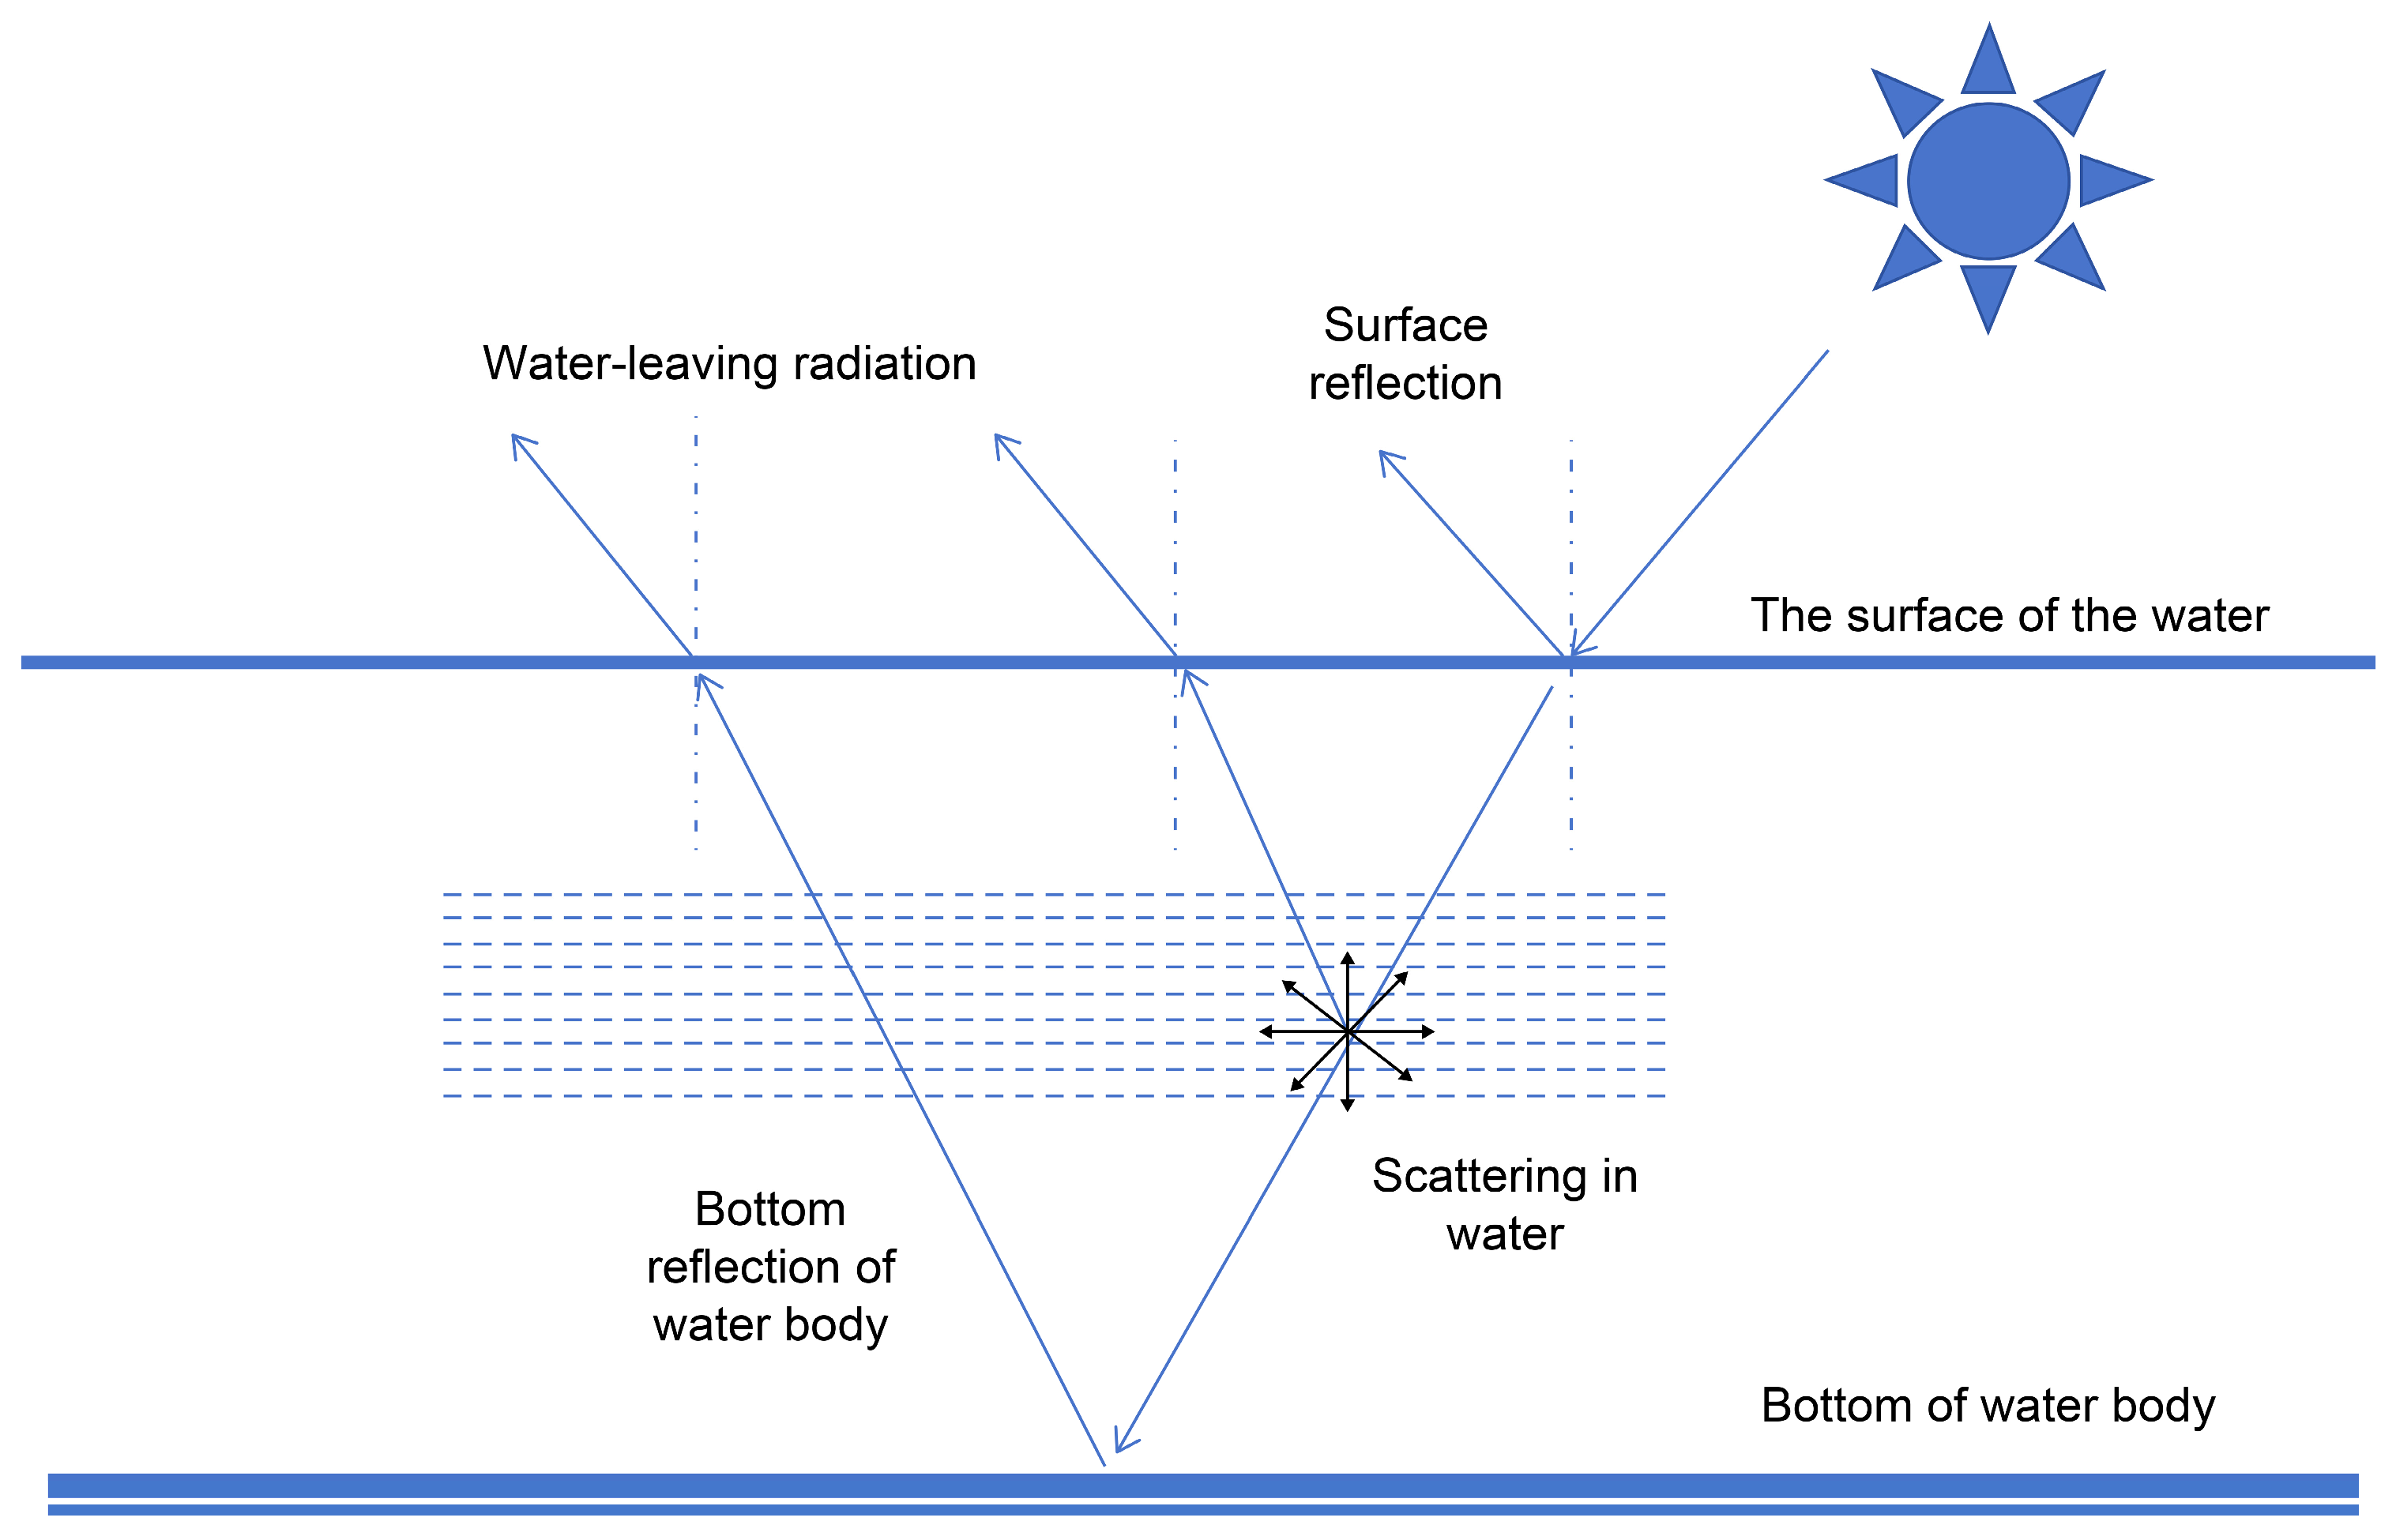
Sunlight incident on the water surface is partially reflected back into the atmosphere, while the majority of it enters the water body. Most of the light is absorbed by the water itself; however, a portion is reflected by suspended solids (e.g., sediment and organic matter). A small amount reaches the bottom of the water body, where it is absorbed and partially reflected by the sediment. A certain amount of this light is redirected back to the surface and undergoes refraction as it exits into the atmosphere. Accordingly, the radiation energy received by the spectrometer includes light reflected from the water surface, impurities in the water, the bottom of the water, and the sky [43]. Variations in the surface properties of water bodies, the nature and content of impurities in water bodies, water depth, and characteristics of underwater substances lead to spectral differences in sensor readings. Figure 5 shows the interaction between sunlight and a water body.
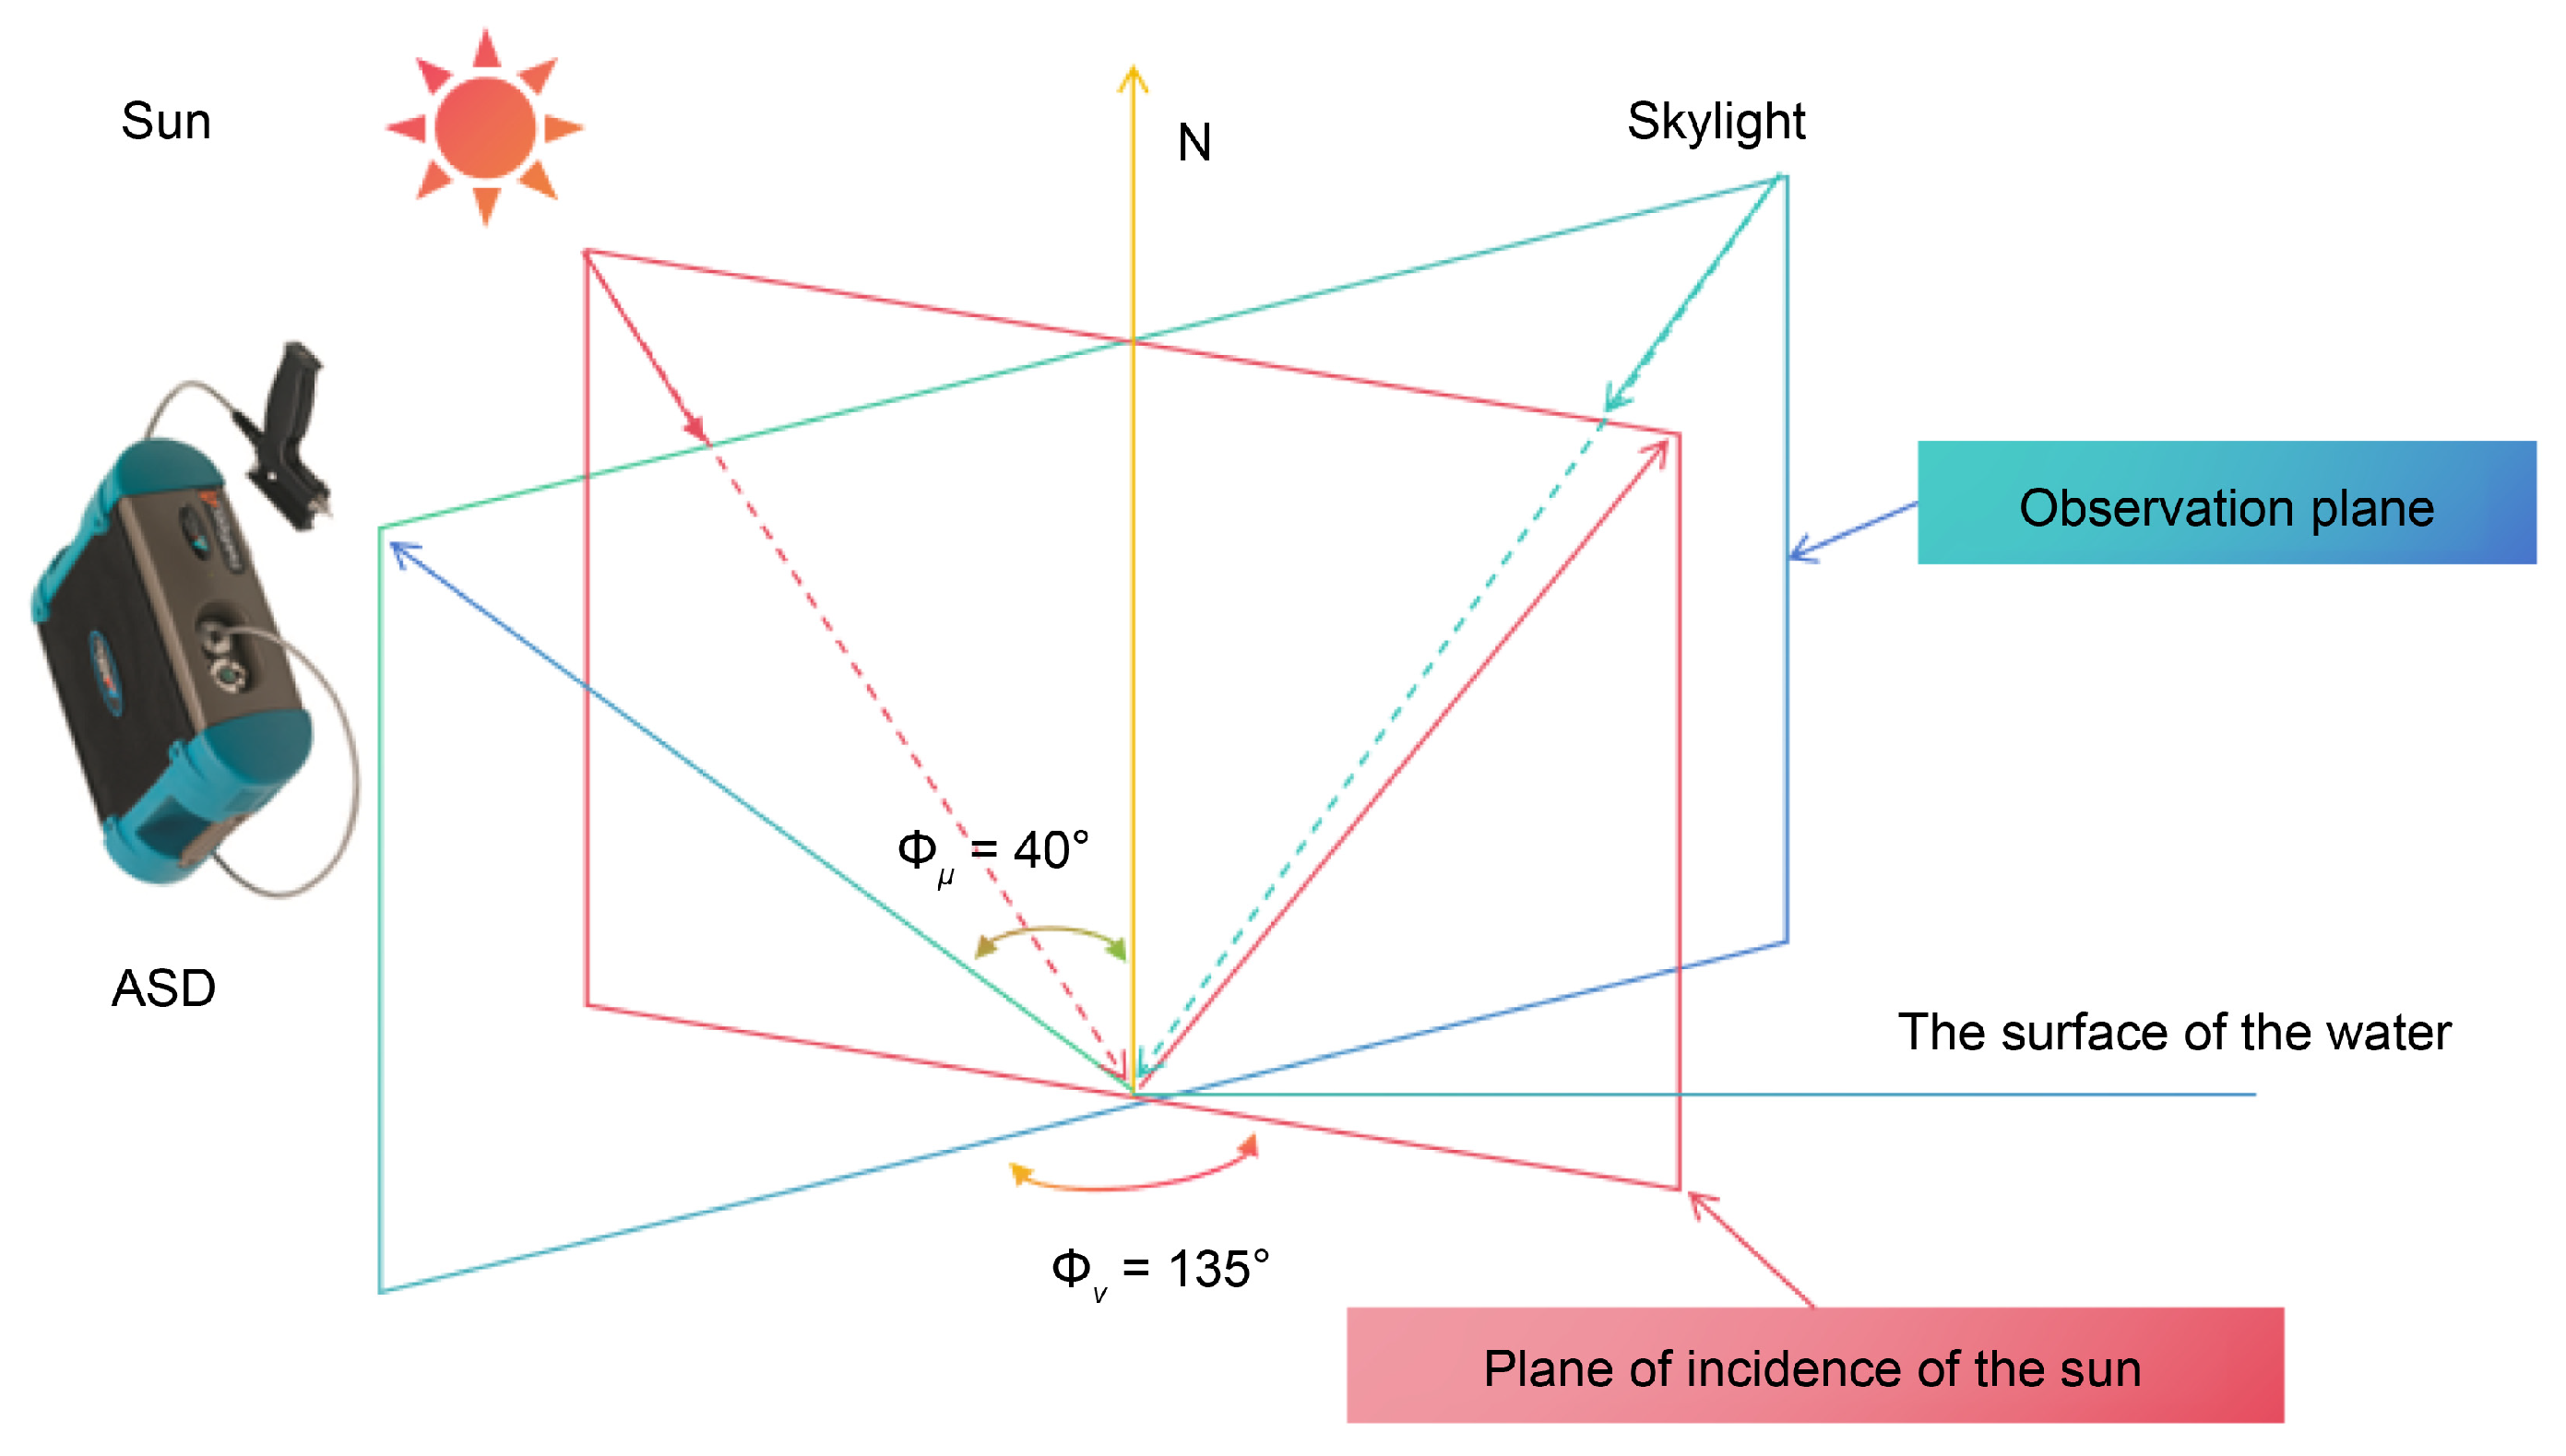
For UAV-based remote sensing applications to water bodies, estimating the water-leaving reflectance captured by the airborne hyperspectral imaging instrument first requires measuring the water-leaving radiance at the water surface control point using a radiometer spectrometer on the ground [17]. Figure 6 shows a schematic of the reflectance measurement at the GCP near the water end.
According to the relevant literature [44], the radiance observed using an ASD spectrometer, excluding direct sunlight reflection, is expressed in the following equation:
L s w = L w + r L s k y
where L w is the water leaving radiance; L s k y is the diffuse reflection of light from the sky; and r is the reflectance of skylight at the air–water interface, which depends on various factors, such as solar position, observation geometry, and wind speed. Under the geometric observation conditions shown in Figure 5, r = 0.022 occurs when wind is absent, r = 0.025 at a wind speed of approximately 5 m/s, and r 0.026 0.028 at a wind speed of approximately 10 m/s.
Next, the total incident irradiance E d ( 0 + ) on the water surface is derived by measuring the standard target plate [45]. Among them, 0+ represents the position exactly on the air side of the water surface (i.e., immediately above the water surface), as shown in Equation (6) below:
E d ( 0 + ) = L p * π / ρ p
where L p is the radiance of the ASD-measured standard board, and ρ p is the reflectivity given by the target plate manufacturer. Both the water surface and the reference panel must be measured under consistent illumination conditions.
Finally, the following formula can be used to calculate the near-water end water-leaving reflectance of the water body in remote sensing applications:
R rs = L w E d ( 0 + ) = ( L s w r L s k y ) π L p ρ p

2.4. Method for Obtaining the Reflectance of Remote Sensing Objects via UAVs

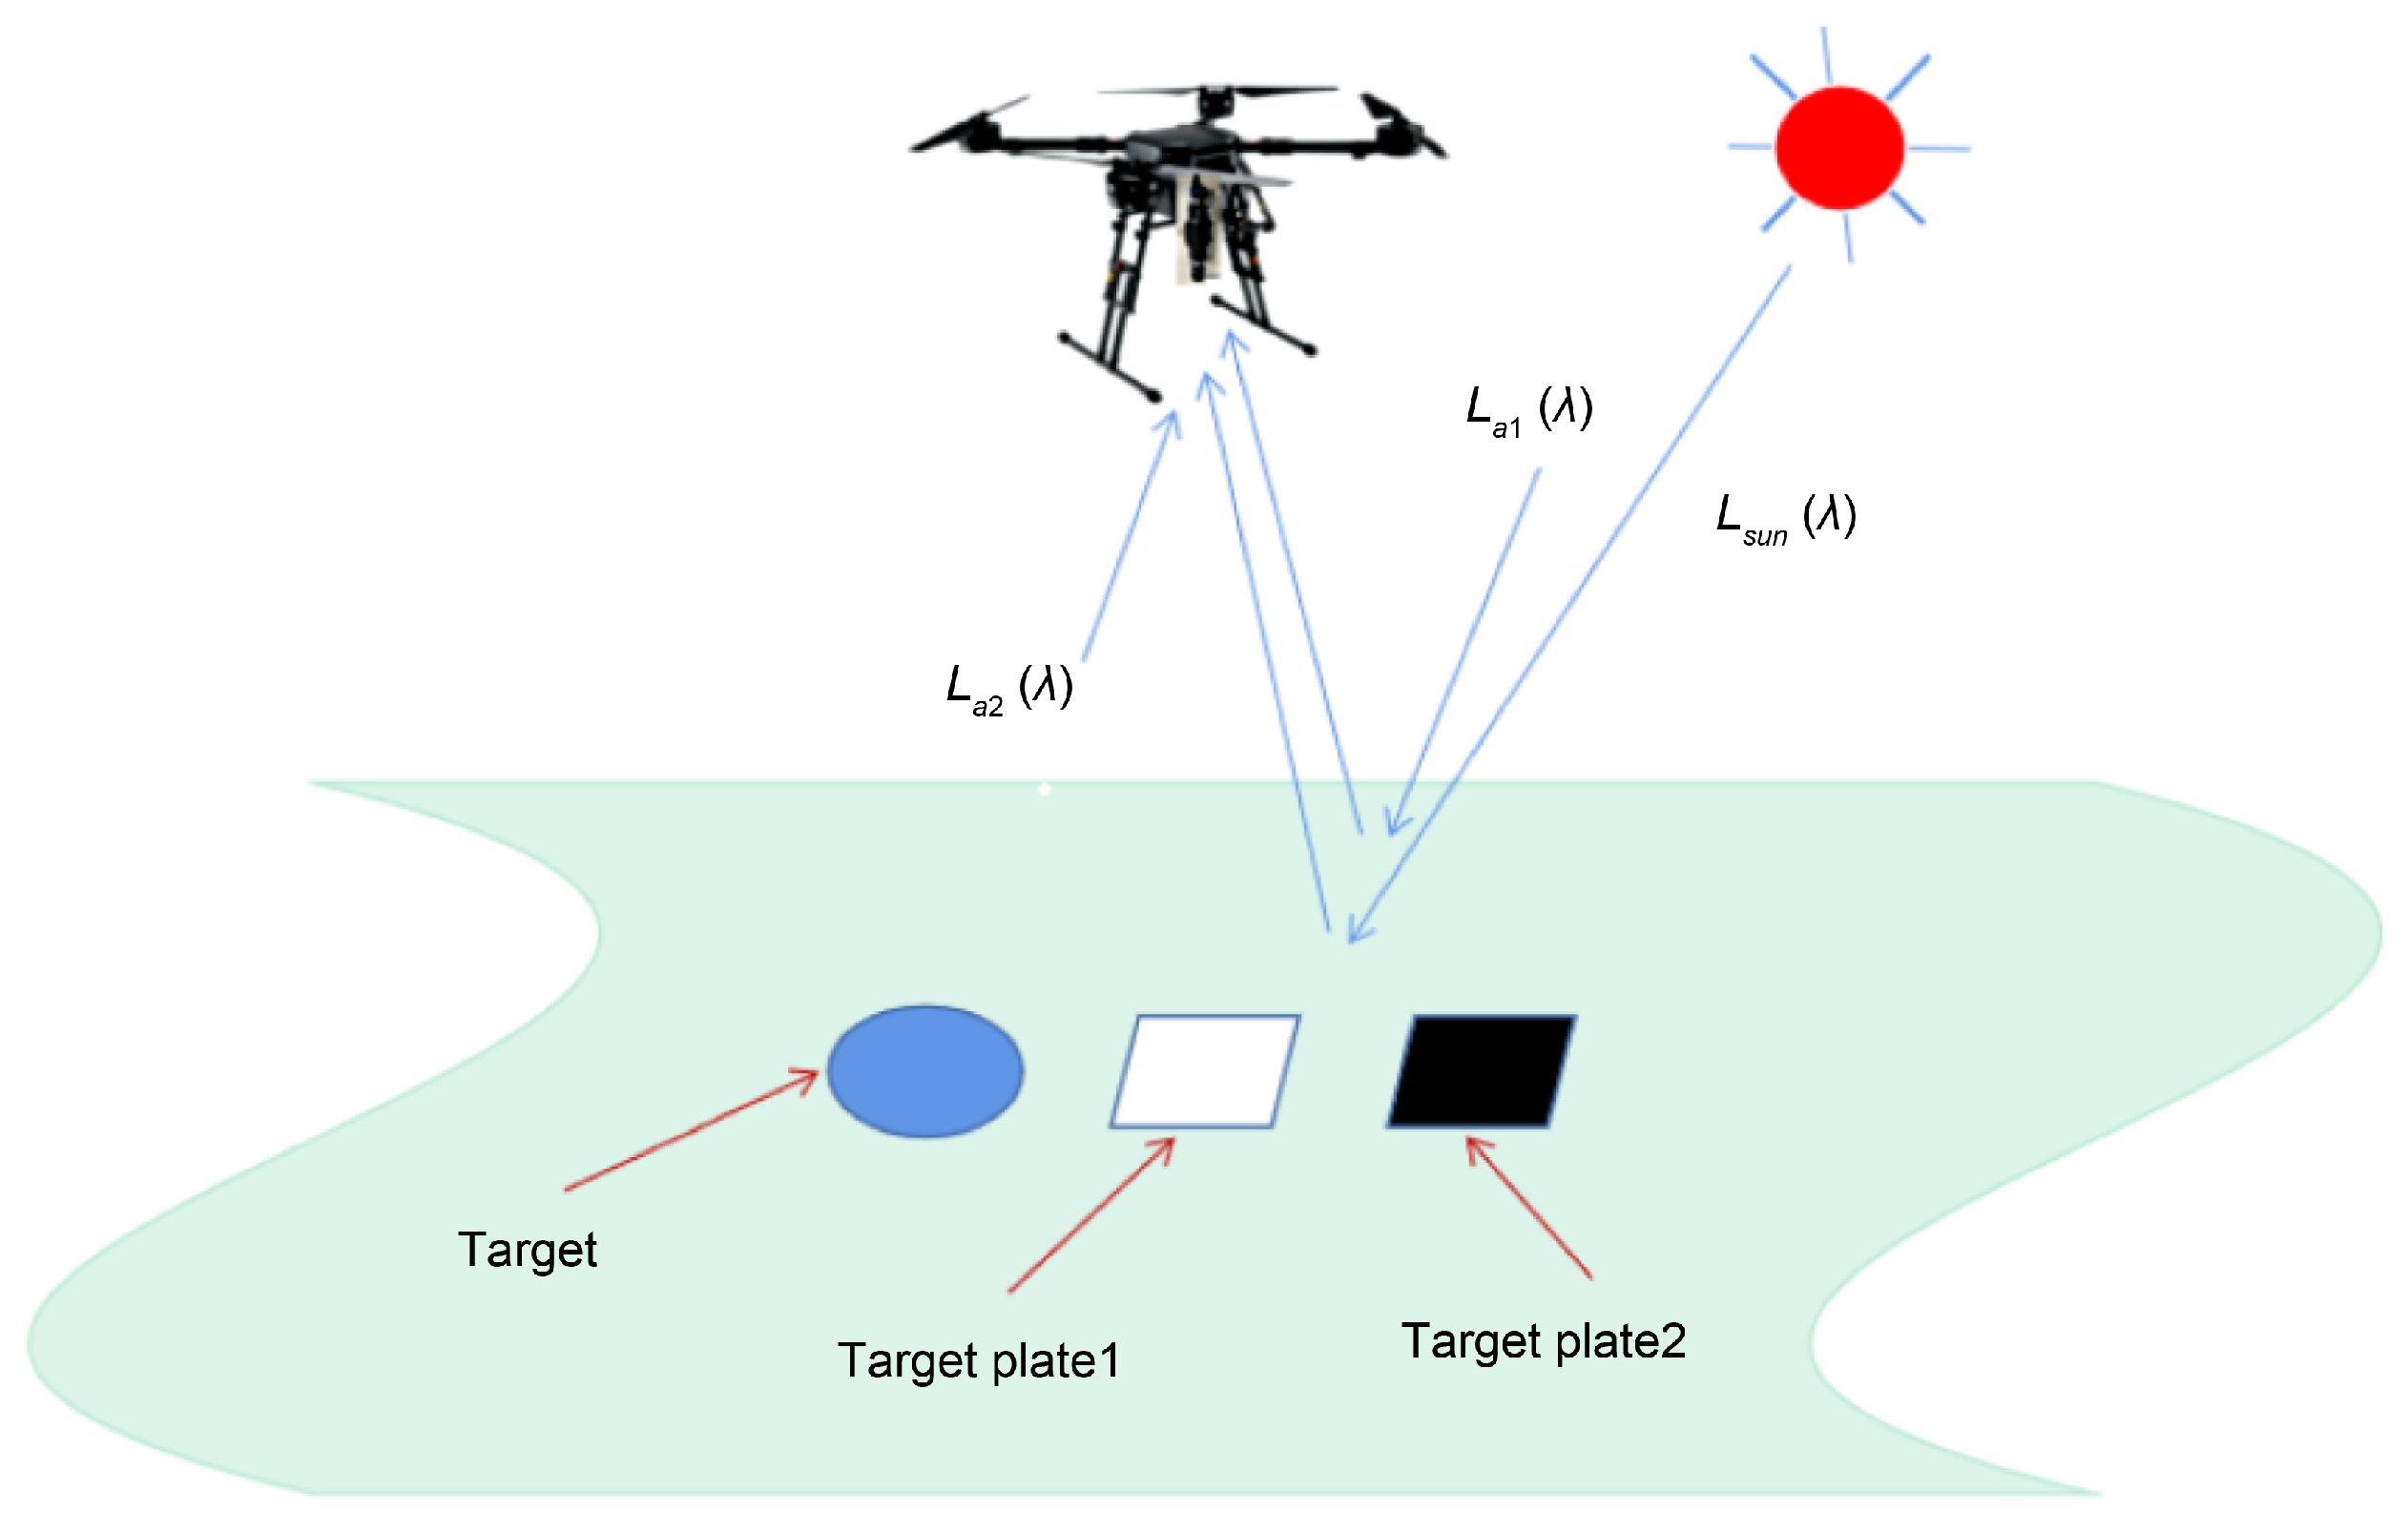
The airborne spectral imaging instrument employed site calibration to correct the radiation characteristics of the target being measured by utilizing objects with known radiation characteristics. Multiple reflectivity targets were placed on the site, such as a 30% target 1 and a 60% target 2. The reflectance of targets along the same route can be inverted using the values of targets 1 and 2. Figure 7 shows a schematic diagram of the method used to obtain the reflectance of ground objects via UAV remote sensing.
When conducting airborne flight experiments with a UAV hyperspectral imaging system, the radiance received by the system can be expressed as follows:
L 0 ( λ ) = ( τ a ( λ ) L s ( λ ) cos θ + L a 1 ( λ ) ) ρ ( λ ) + L a 2 ( λ )
where L s ( λ ) is the spectral radiance of the sun outside the Earth’s atmosphere; λ is the wavelength; τ a is the atmospheric transmittance; and θ is the solar elevation angle. L a 1 and L a 2 are both atmospheric scattering spectral radiances. The former enters the hyperspectral imager through the target reflection, whereas the latter enters directly. According to the principle of absolute radiometric calibration, the output data of hyperspectral imaging are linearly related to the radiance. Assuming that the reflectances of targets 1 and 2 are ρ 1 ( λ ) and ρ 2 ( λ ) , and that the corresponding image data are D N 1 and D N 2 , respectively, the reflectance ρ t ( λ ) of the target to be tested can be calculated using the following formula:
ρ t = D N t D N 1 D N 2 D N 1 ( ρ 2 ρ 1 ) + ρ 1

2.5. Conversion Method for UAV Hyperspectral Water-Leaving Reflectance Based on a Fully Connected Neural Network Model

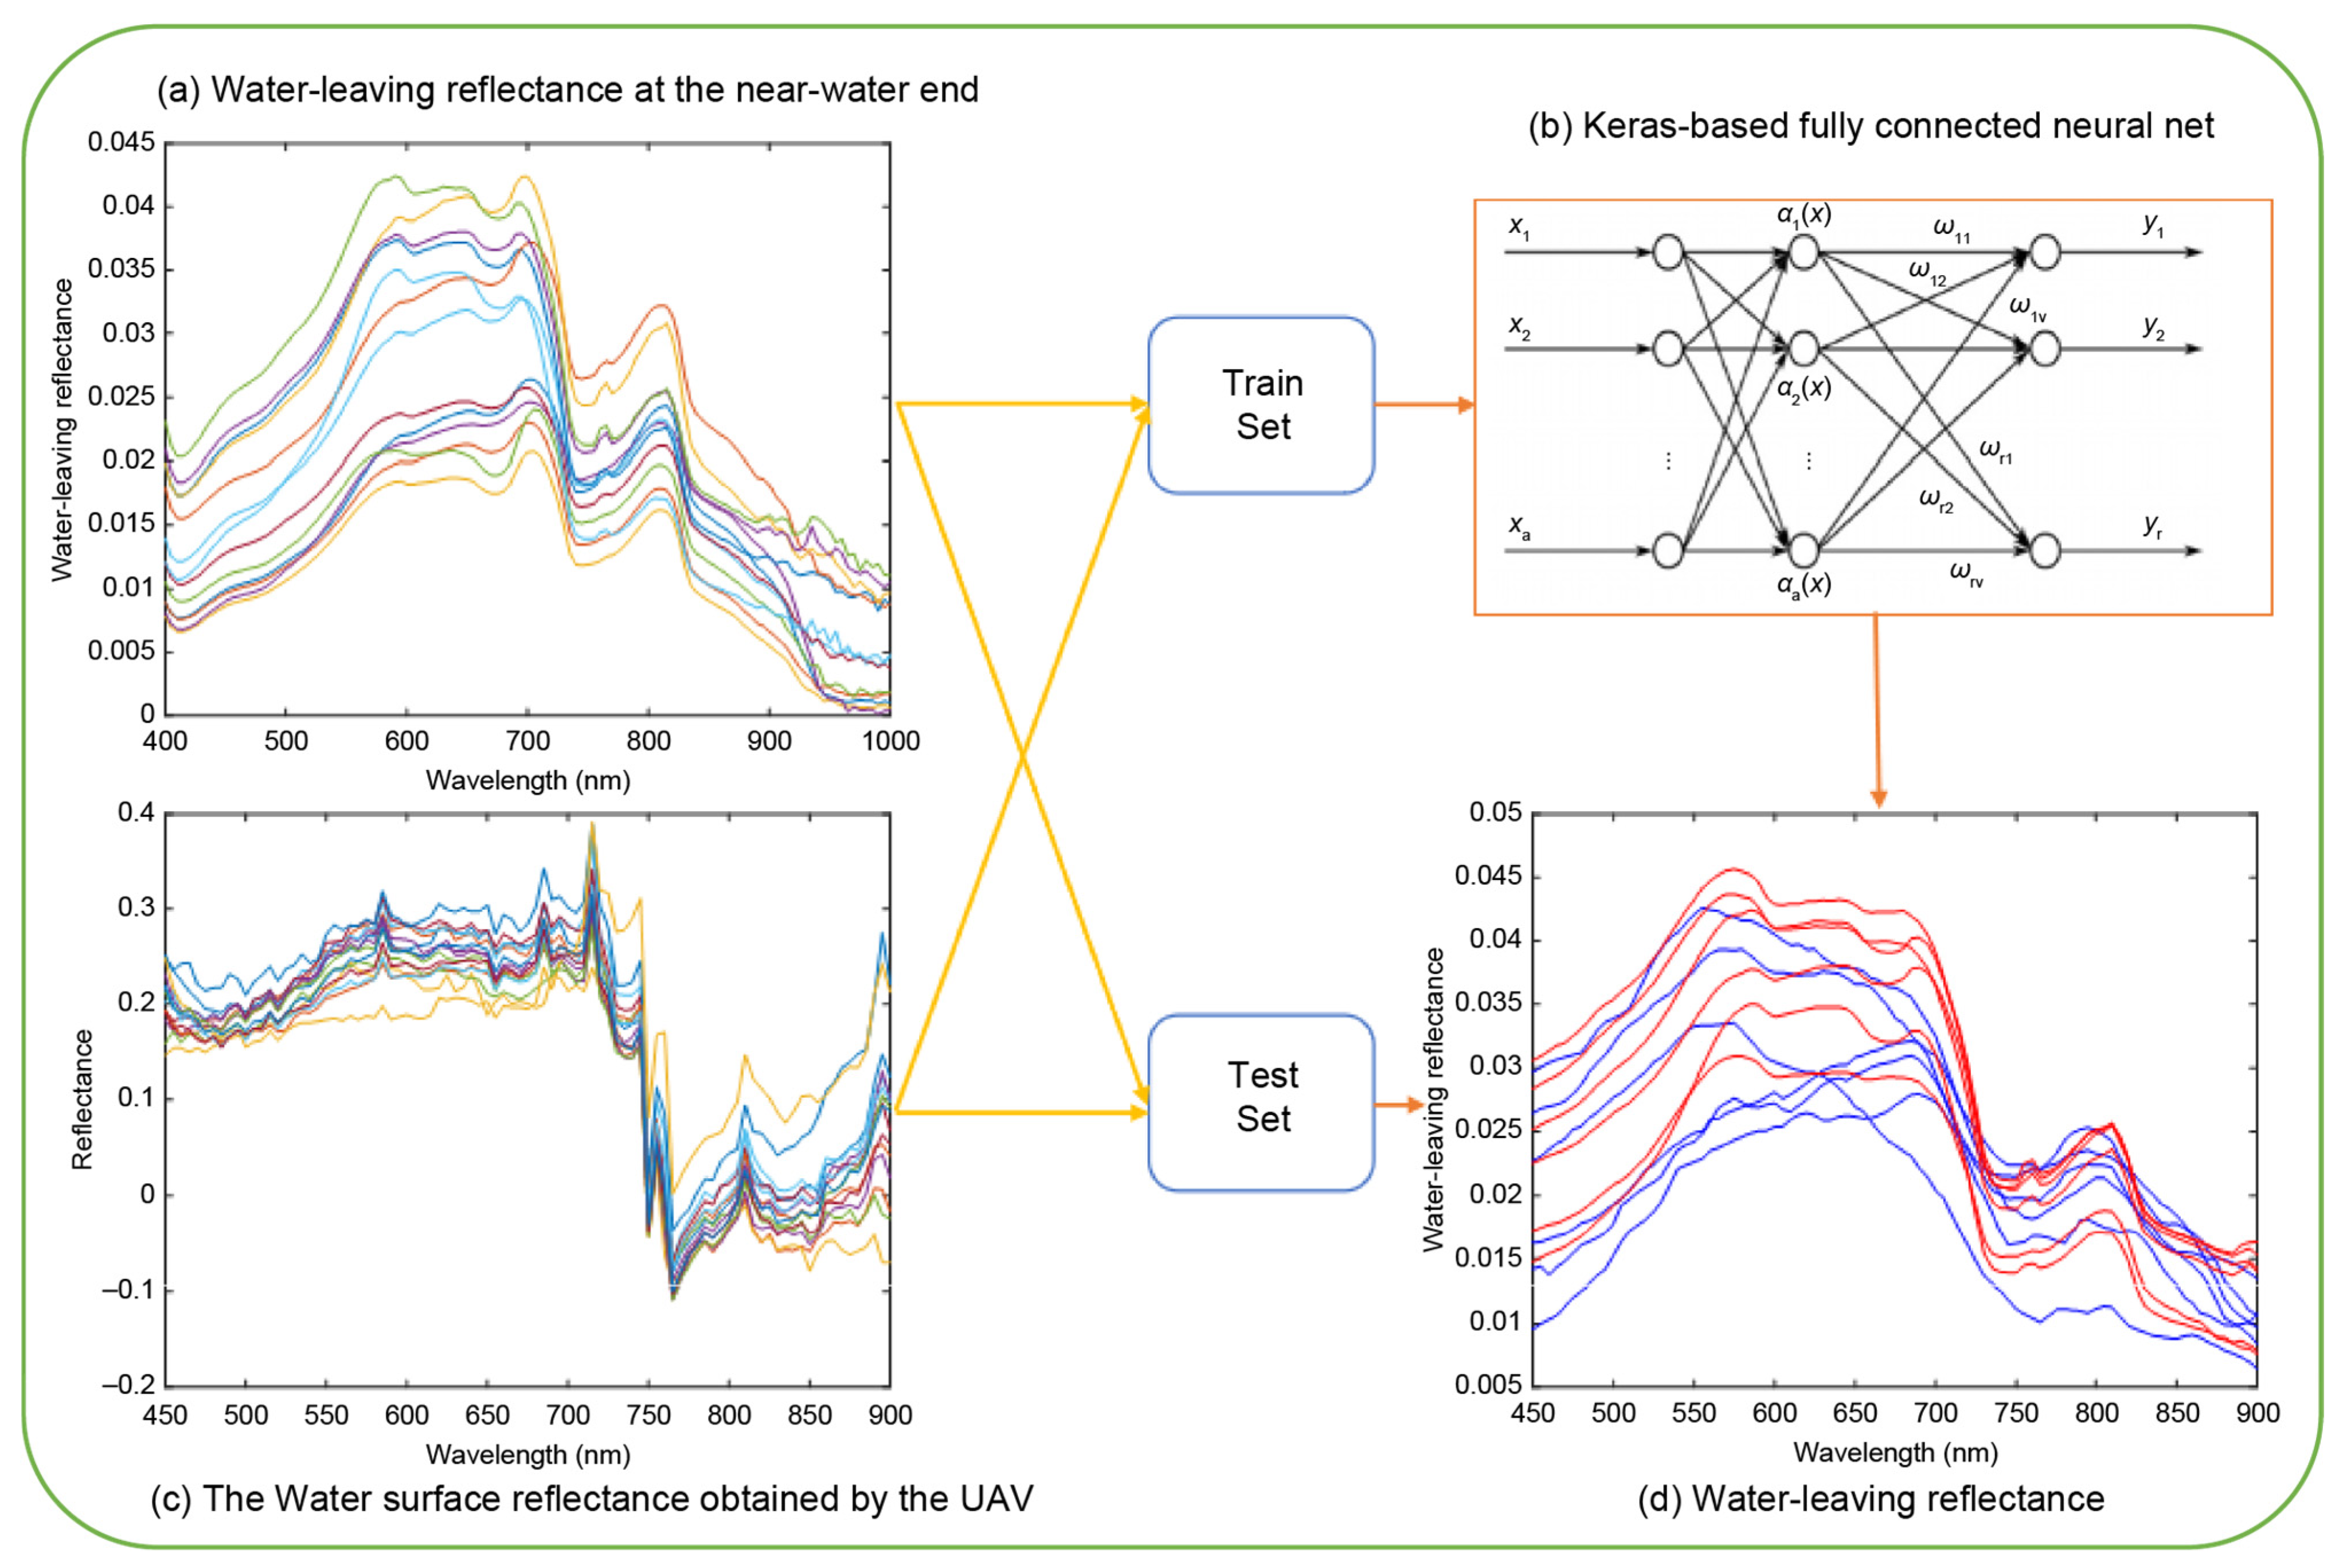
The study proposed the following method for hyperspectral water reflectance using UAVs. Step 1 involves employing the method in Section 2.2 to acquire water reflectance near the GCPs. Step 2 requires using the method described in Section 2.3 to obtain the remote sensing reflectance of ground objects at the GCPs using UAVs. Step 3, as shown in Figure 8, employs a fully connected neural network model based on TensorFlow Keras to establish a mapping transformation relationship between the hyperspectral ground reflectance of UAVs and near-water end water-leaving reflectance. Step 4 involves inputting the remote sensing data of water surface ground reflectance obtained from UAVs in Step 2 into the mapping transformation relationship, ultimately yielding the hyperspectral water reflectance from the UAVs.
The fully connected neural network model based on TensorFlow Keras encompassed three core steps: model definition, compilation, and training. The model definition section constructed a sequential model using tf.keras.Sequential, which consisted of two fully connected (dense) layers. The first layer was the hidden layer, with units equal to the number of spectral segments (the number of spectral bands was 91, ranging from 450 to 900 nm with a step size of 5 nm), which included 91 neuron units. The input data were specified as feature vectors in unit dimensions, and the activation function was a rectified linear unit (ReLU). The ReLU function can map input values less than zero to zero and retain input values greater than zero. This non-linear property enables the model to learn complex data patterns while simultaneously mitigating the issue of gradient vanishing and accelerating the training convergence speed. The second layer was the output layer, and the activation function was set to linear; this enabled the output value to assume any real number. This configuration is appropriate for predicting continuous values in regression tasks and enables direct output of prediction results with the same dimension as the input dimension.
During the model-compilation phase, the key parameters required for training were configured using the model.compile method. The optimizer selects Adam, an optimization algorithm that integrates momentum gradient descent with an adaptive learning rate. It can dynamically adjust the learning rate based on the update frequency of the parameters and demonstrates excellent convergence performance and stability in most regression tasks. The loss function adopts the mean_Squared_error, which is calculated as the average square of the difference between the predicted and true values. The loss function is sensitive to prediction errors and can effectively guide the model to update the parameters toward minimizing prediction bias; this is one of the most commonly used loss functions in regression tasks.
The training process was implemented using the model.fit method, with a set number of training iterations (training epochs ≥ 1000). In each iteration, the model sequentially reads the training data based on the batch (default batch size), calculates the prediction value through forward propagation, computes the prediction error using the loss function, and updates the network parameters using the backpropagation algorithm to minimize the loss value.
A regression prediction model with a simple structure and complete functionality was constructed. Non-linear relationships of the input features were derived via fully connected layers, whereas parameter optimization was achieved using the Adam optimizer and mean squared error loss function. This method is suitable for continuous value prediction tasks, where both input and output dimensions correspond to the number of spectral segments, and for the conversion mapping from hyperspectral reflectance on UAVs to near-water end water-leaving reflectance.

2.6. Evaluation Indicators

(1)
Spectral angle mapping (SAM) [46]
SAM is a method for calculating the similarity of spectral curves. It treats each spectral curve as a high-dimensional vector and assesses the similarity between two spectral curves by determining the angle between the two vectors. When the angle is small, the two spectral curves are similar. As the angle becomes larger, the two spectral curves exhibit reduced similarity. The equations x and y represent the target and reference spectral curves, respectively, with the dimensionality of the spectral curve vectors being n (Equation (10)).
S A M ( x , y ) = arccos i = 1 n x i y i i = 1 n x i 2 i = 1 n y i 2
where i = 1 n x i 2 and i = 1 n y i 2 are the magnitudes of the two spectral vectors. S A M ( x , y ) is the spectral angle value between the two spectra.
(2)
Root mean squared error (RMSE) [47]
The root mean squared error (RMSE) is used to evaluate the accuracy of a model; the smaller the calculated value, the higher the accuracy of the model. Specifically, for water quality monitoring models, a decreased RMSE signifies a reduced deviation between the predicted outcomes of the model and actual water quality parameters.
R M S E = 1 n i = 1 n ( y i y ^ i ) 2
where y i is the measured water quality parameter value; y ^ i is the predicted water quality parameter value; and n is the sample size.
(3)
Residual prediction deviation (RPD) [48]
The residual prediction deviation (RPD) is a performance evaluation index for model prediction and is used to determine the model’s predictive ability on the data. A higher RPD value indicates a greater degree of dispersion between the predicted values of the model and measured values, thereby enhancing the model’s predictive ability. This formula is defined as follows:
R P D = S D o b s R M S E
where S D o b s is the standard deviation of the measured values, which reflects the degree of dispersion in the actual data. According to the RPD performance grading standard in reference [49], an RPD value >2 indicates strong predictive ability of the model; when 1.4 < RPD ≤ 2, it suggests moderate predictive ability of the model; and an RPD value ≤1.4 reflects poor predictive ability.

3. Results

3.1. Results of Obtaining Hyperspectral Water Reflectance from UAVs

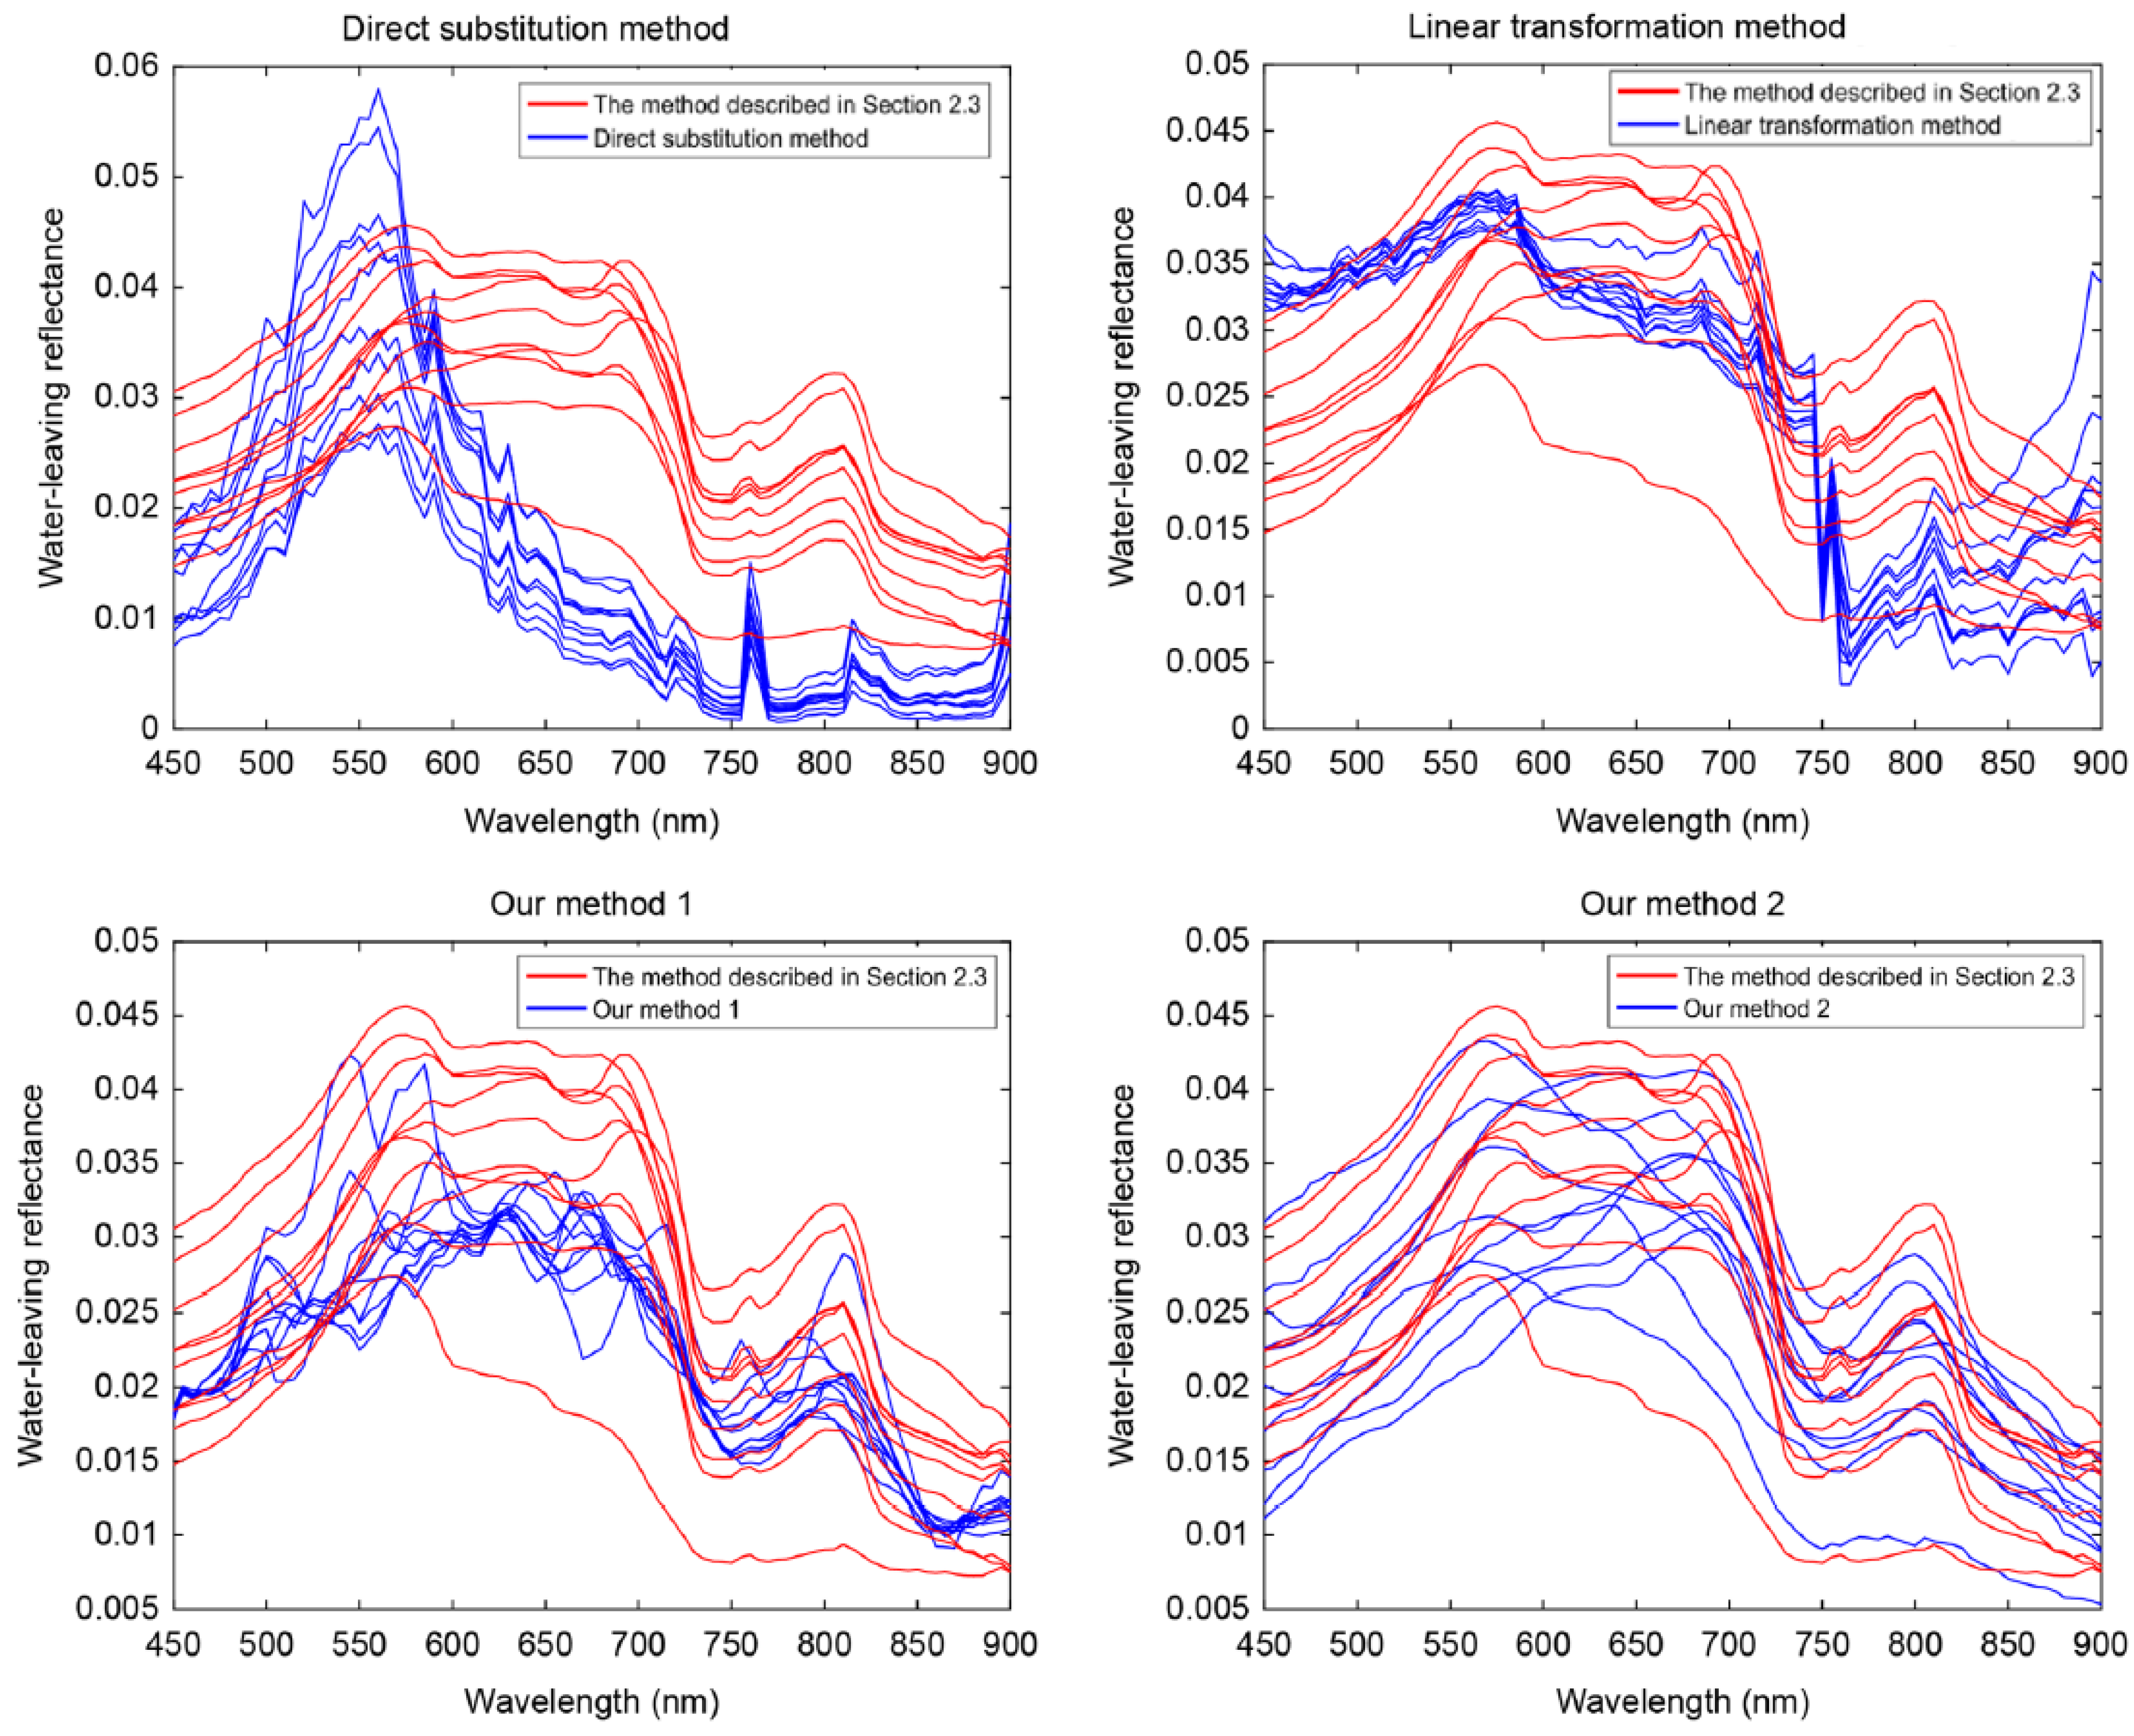
The experimental results of this study were compared with those of existing research methods. The relationship between the control point water reflectance obtained using the four methods and the measured water reflectance value (true value) at a point close to the ground was compared. The four methods for obtaining water reflectance were as follows: Method 1: Direct input method, adopted by researchers from East China Normal University, Belgium, and the United Kingdom [29,30]; Method 2: Linear transformation method, adopted by researchers from Hubei and Wuhan Universities [31,32]; our Method 1: Using a neural network based on radial basis function (RBF), the input method entails selecting a specific wavelength spectral range (e.g., 450 nm) from the reflectance curve in the test set to establish a regression relationship, and then traverse all spectral ranges in sequence to establish multiple regression relationships (e.g., 450–900 nm, with a step size of 5 nm, resulting in a total of 91 regression relationships); our Method 2: We used a fully connected neural network model based on TensorFlow Keras, with a single reflectance curve as input. We used the test set to train and establish regression relationships. Figure 9 shows a comparison of the water-free reflectance curves of these four methods.
As shown in Figure 8, a significant difference exists in the overall trend between the water-leaving reflectance curve (blue) obtained using the direct substitution method (method 1) and the measured true value curve (red). There is also a difference in the range between the maximum and minimum values of the curve. The range of the maximum to minimum values of the water-leaving reflectance (blue) obtained via the linear transformation method in Method 2 was equivalent to the true value; however, the curve was too concentrated. The water-free reflectance (blue) obtained by our Method 1 had both an overall trend and a range from maximum to minimum that were close to the true values; however, most of the curves were too concentrated, with some abrupt changes. In contrast, our Method 2, considering the overall trend, the range between maximum and minimum values and the smoothness of the curve more aligned with the true values of the measured water reflectance at the point close to the ground.
For further comparison, SAM was employed to calculate the similarity between the water reflectance curves derived from the conversion of these four methods and measured water reflectance values (true values) at the point close to the ground. The SAM calculation results are listed in Table 2.
The smaller the value of SAM, the higher the similarity between the two spectral curves. The SAM values calculated for the 10 curves using the direct substitution and linear transformation methods were generally higher than those derived from our proposed method. In addition, the proposed method, which performed single spectral regression using a single spectral segment, did not display high similarity in the water-free reflectance when the complete spectral curve was used as input for regression. Regarding the average SAM values calculated from the 10 curves, our method 2 yielded the lowest SAM, indicating that it achieved the highest similarity in water-free reflectance, which was closest to the true value.

3.2. Acquisition of Results from Sensitive Spectral Bands for Water Quality Monitoring

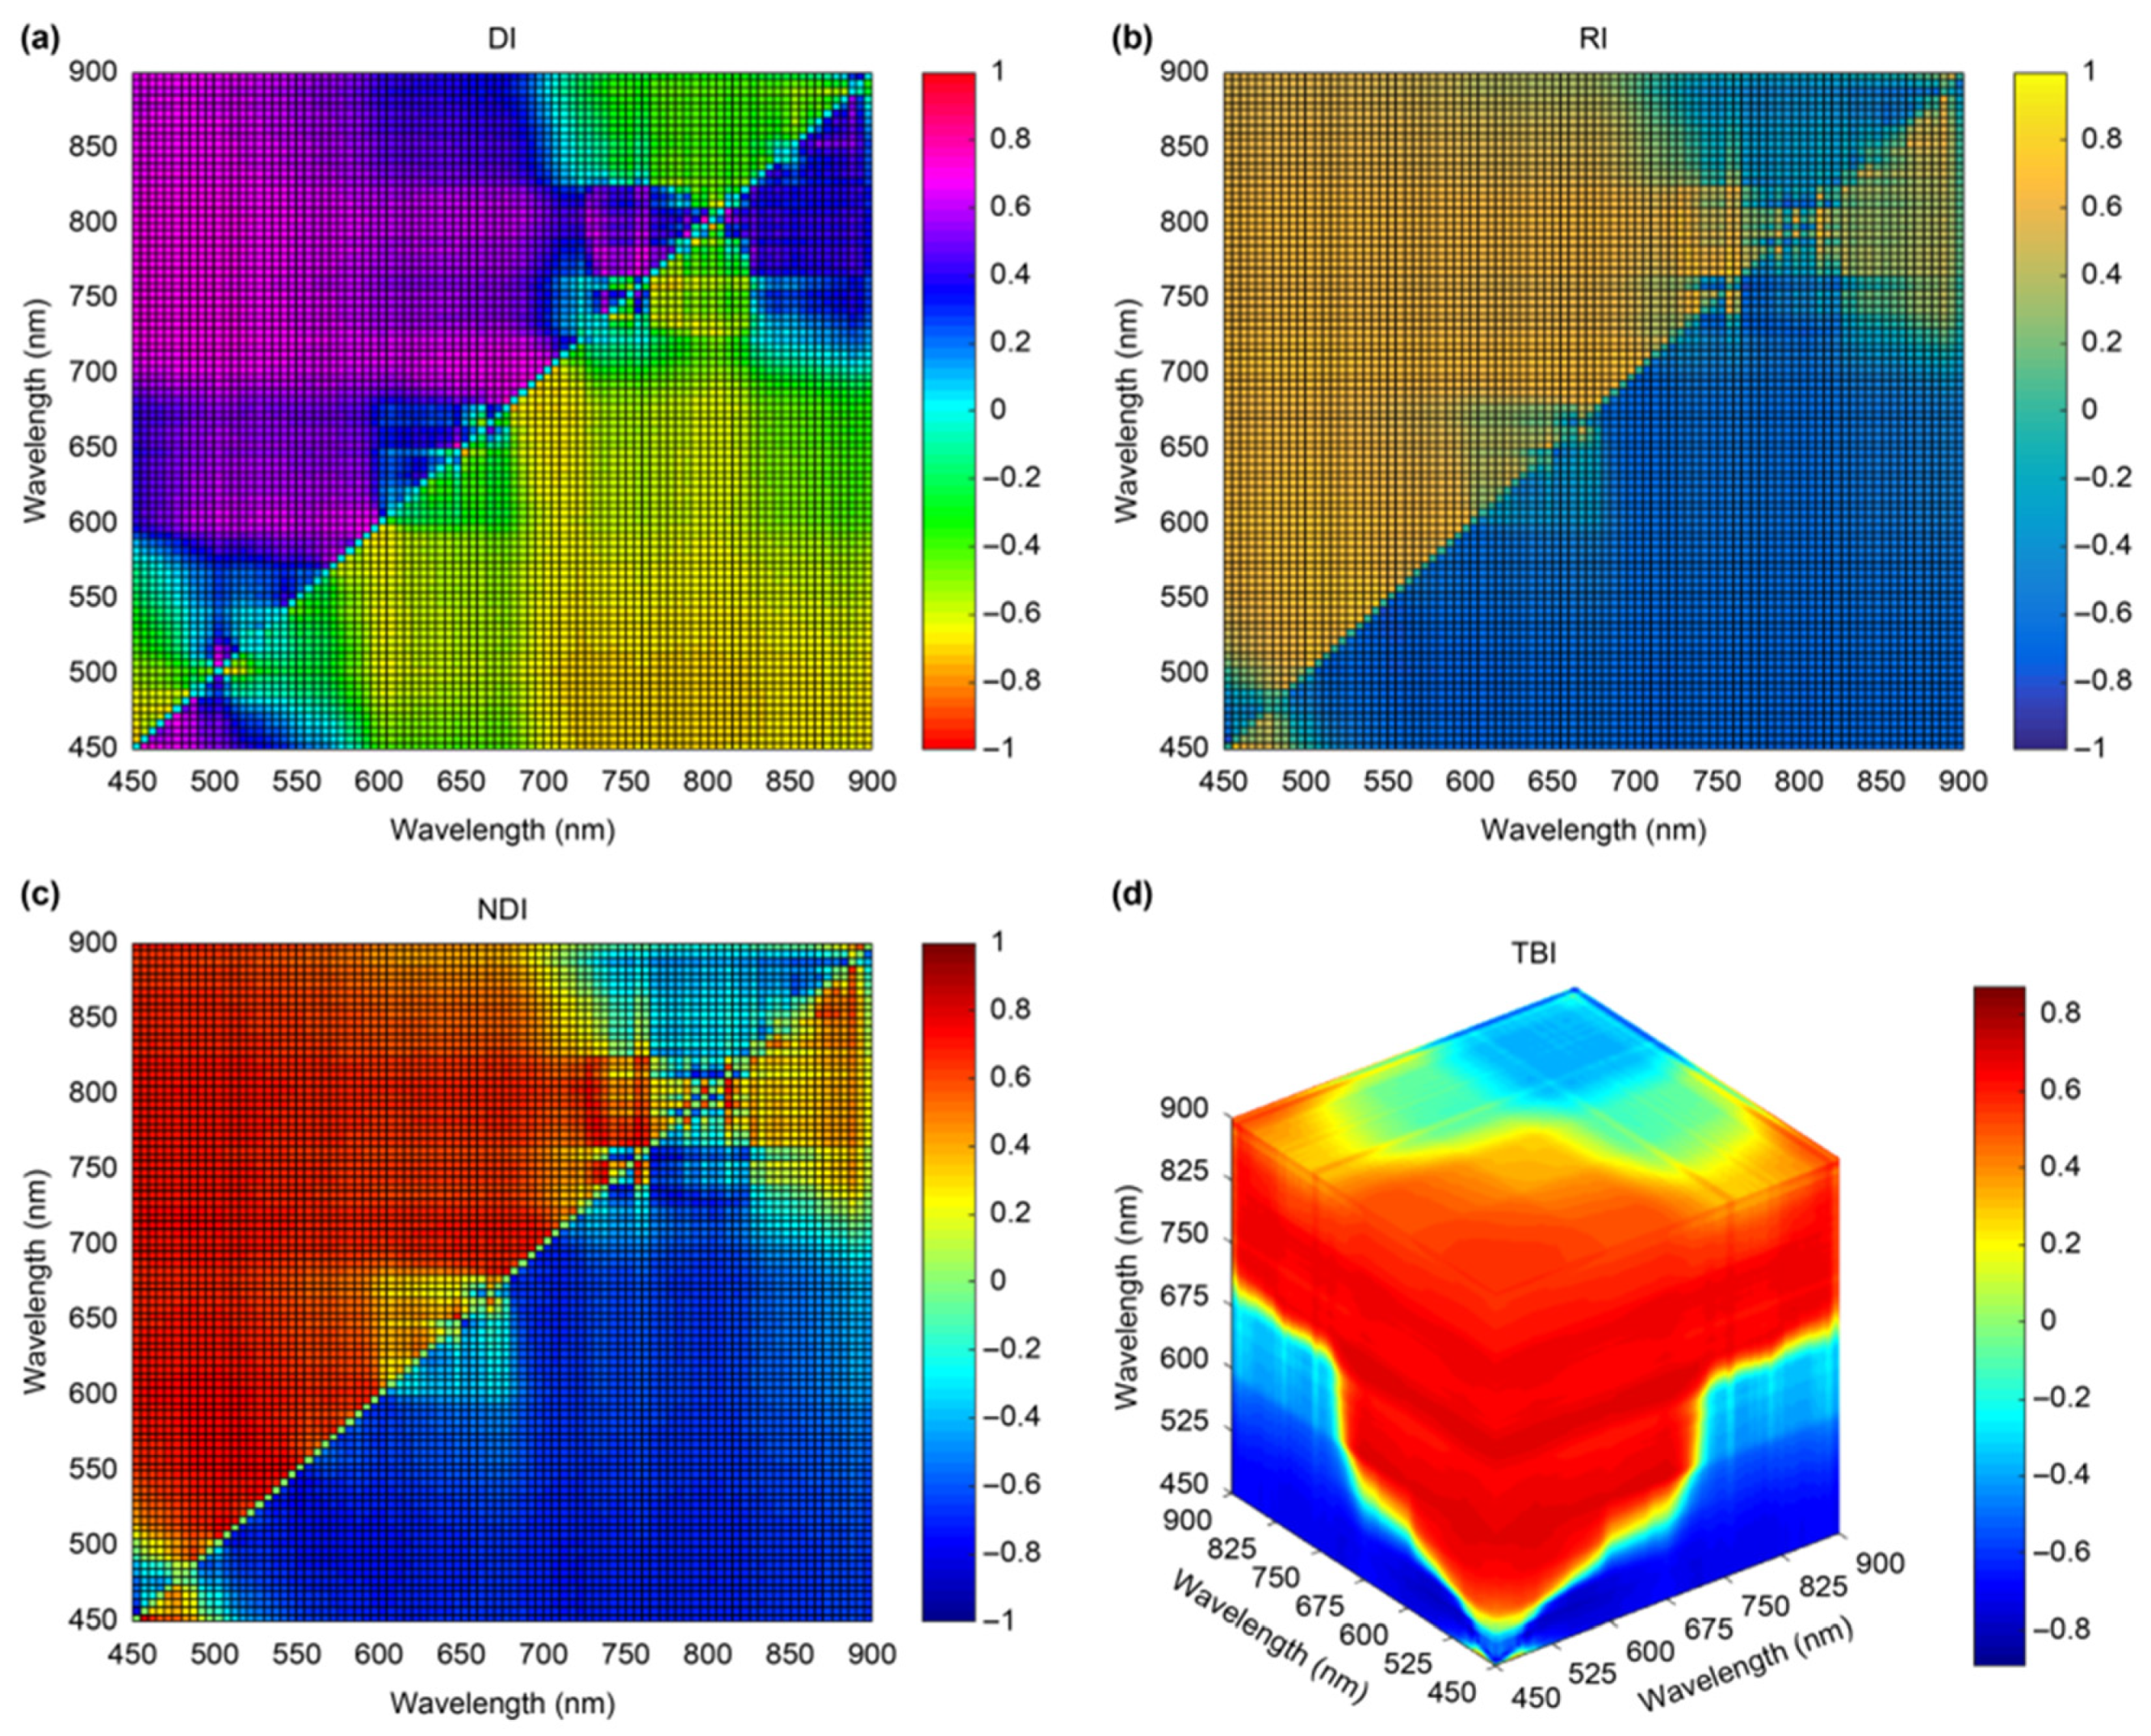
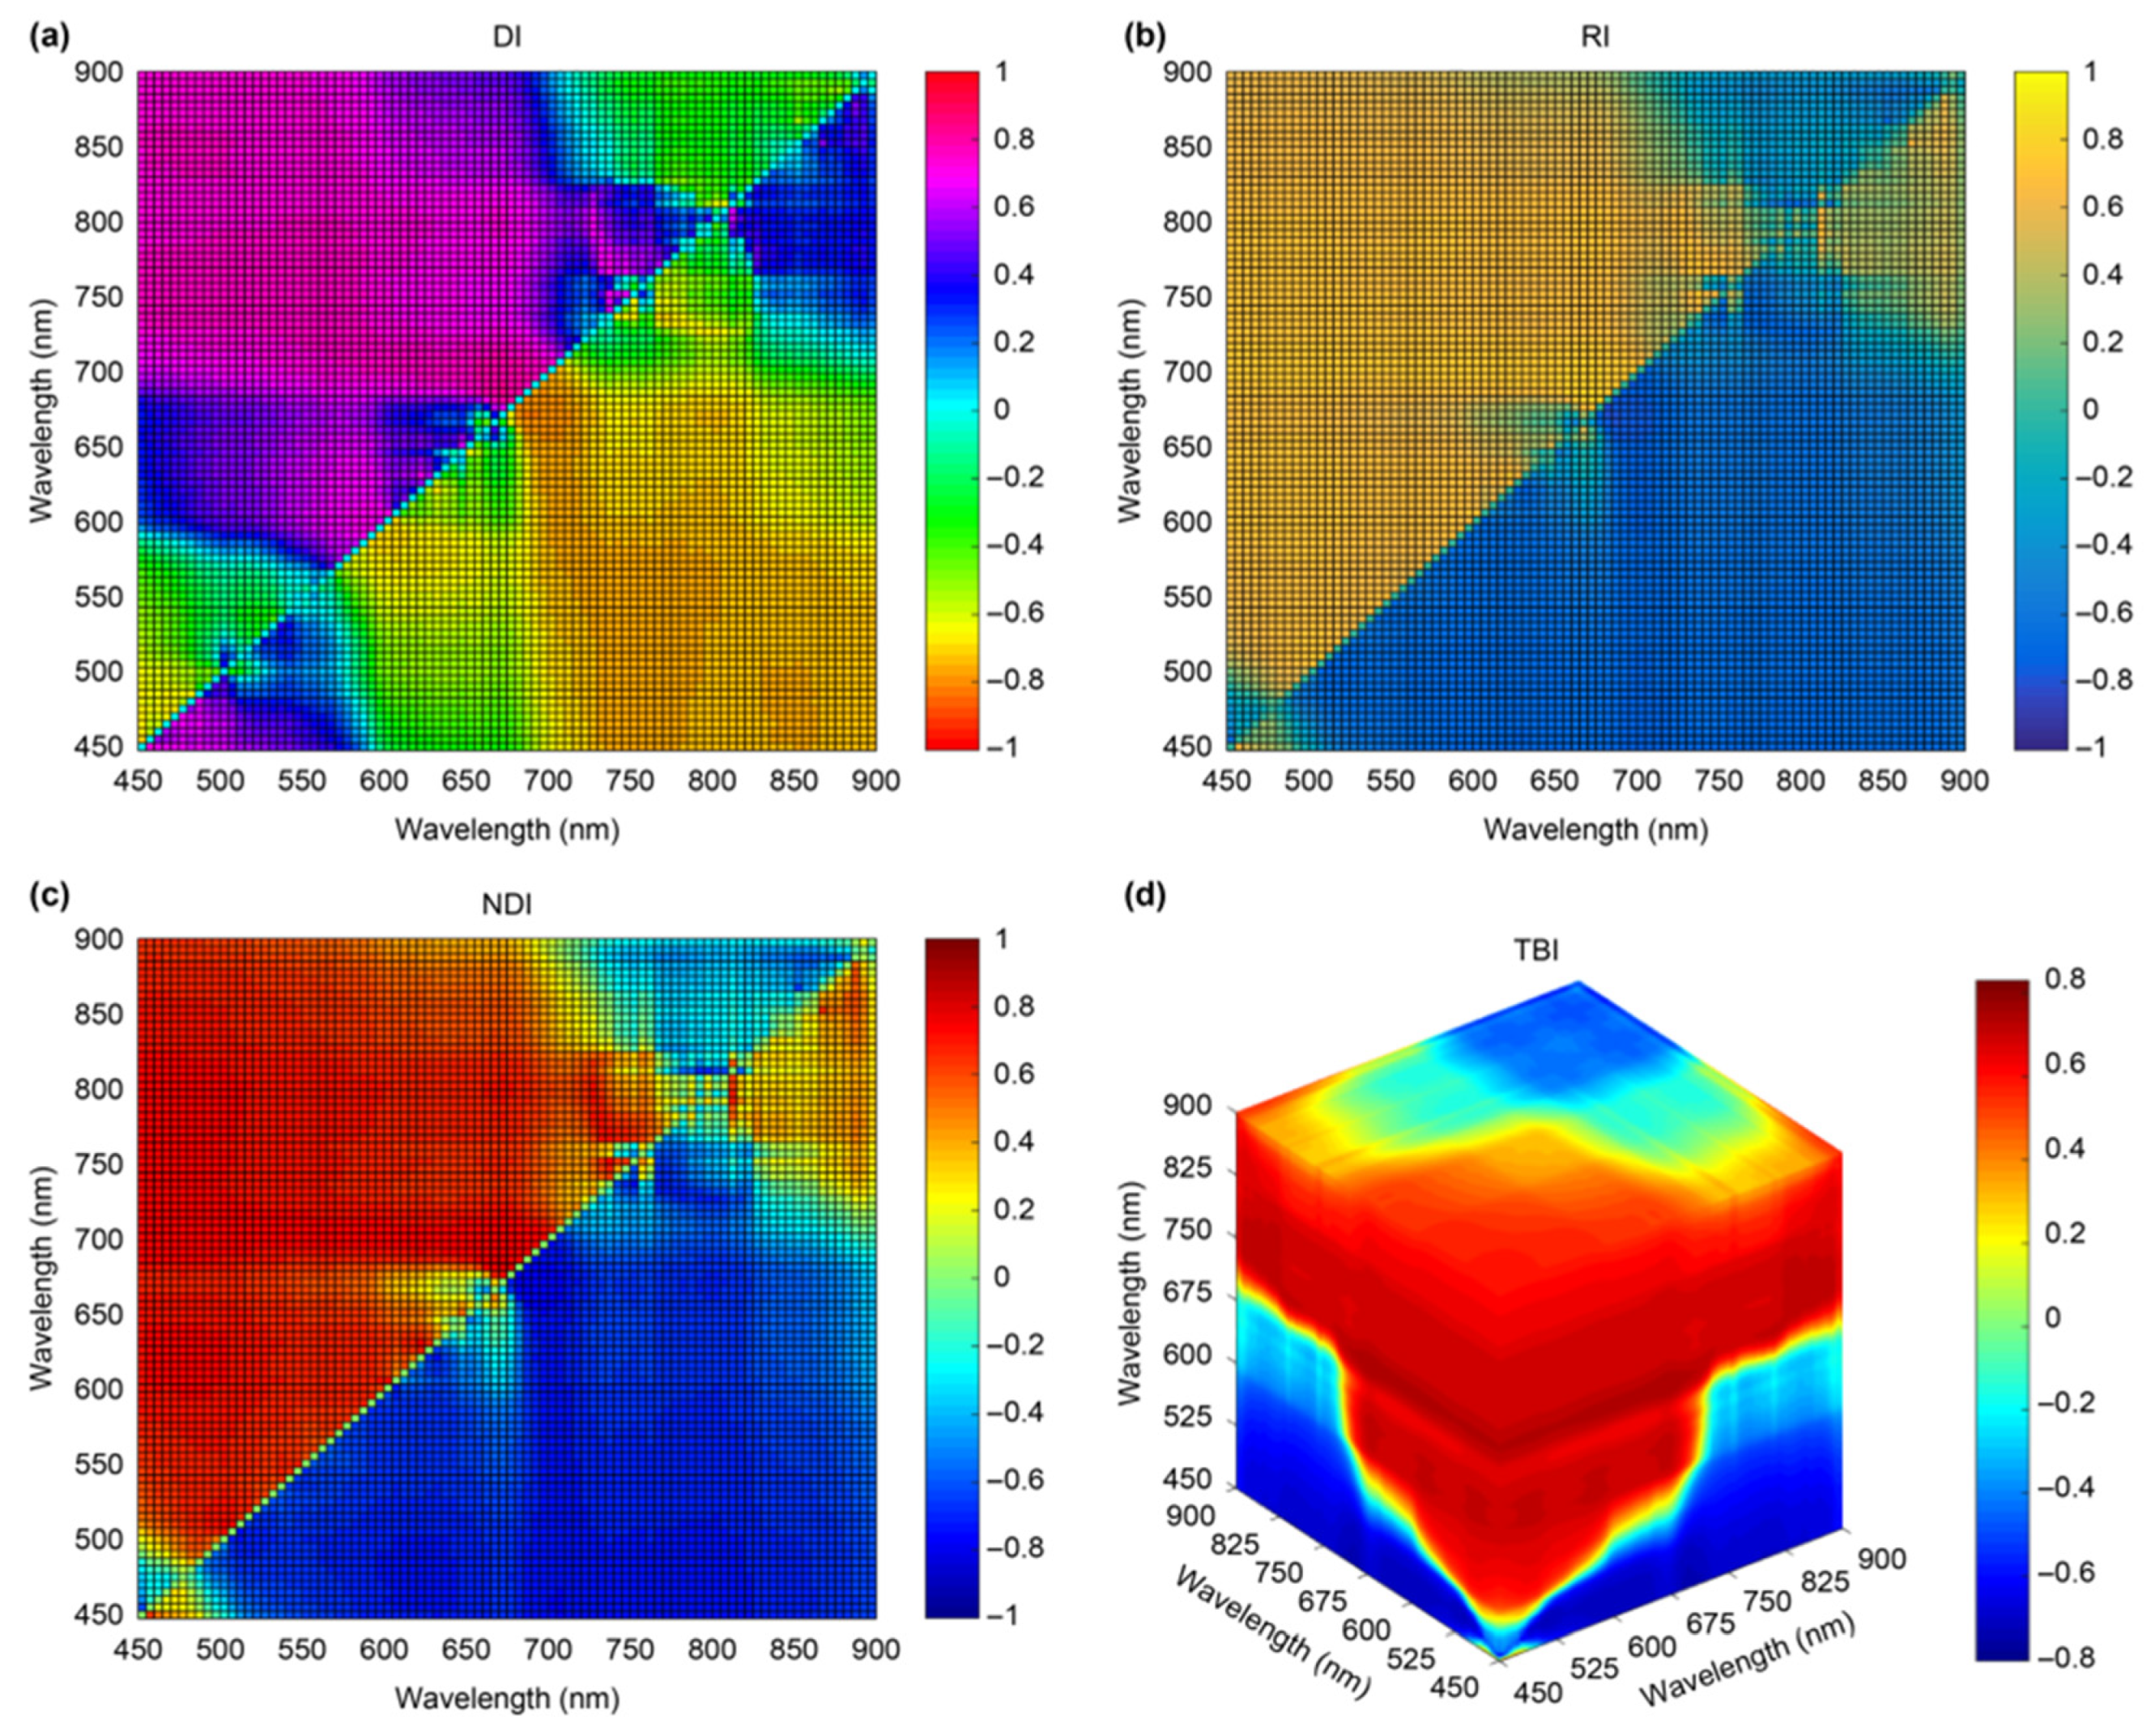
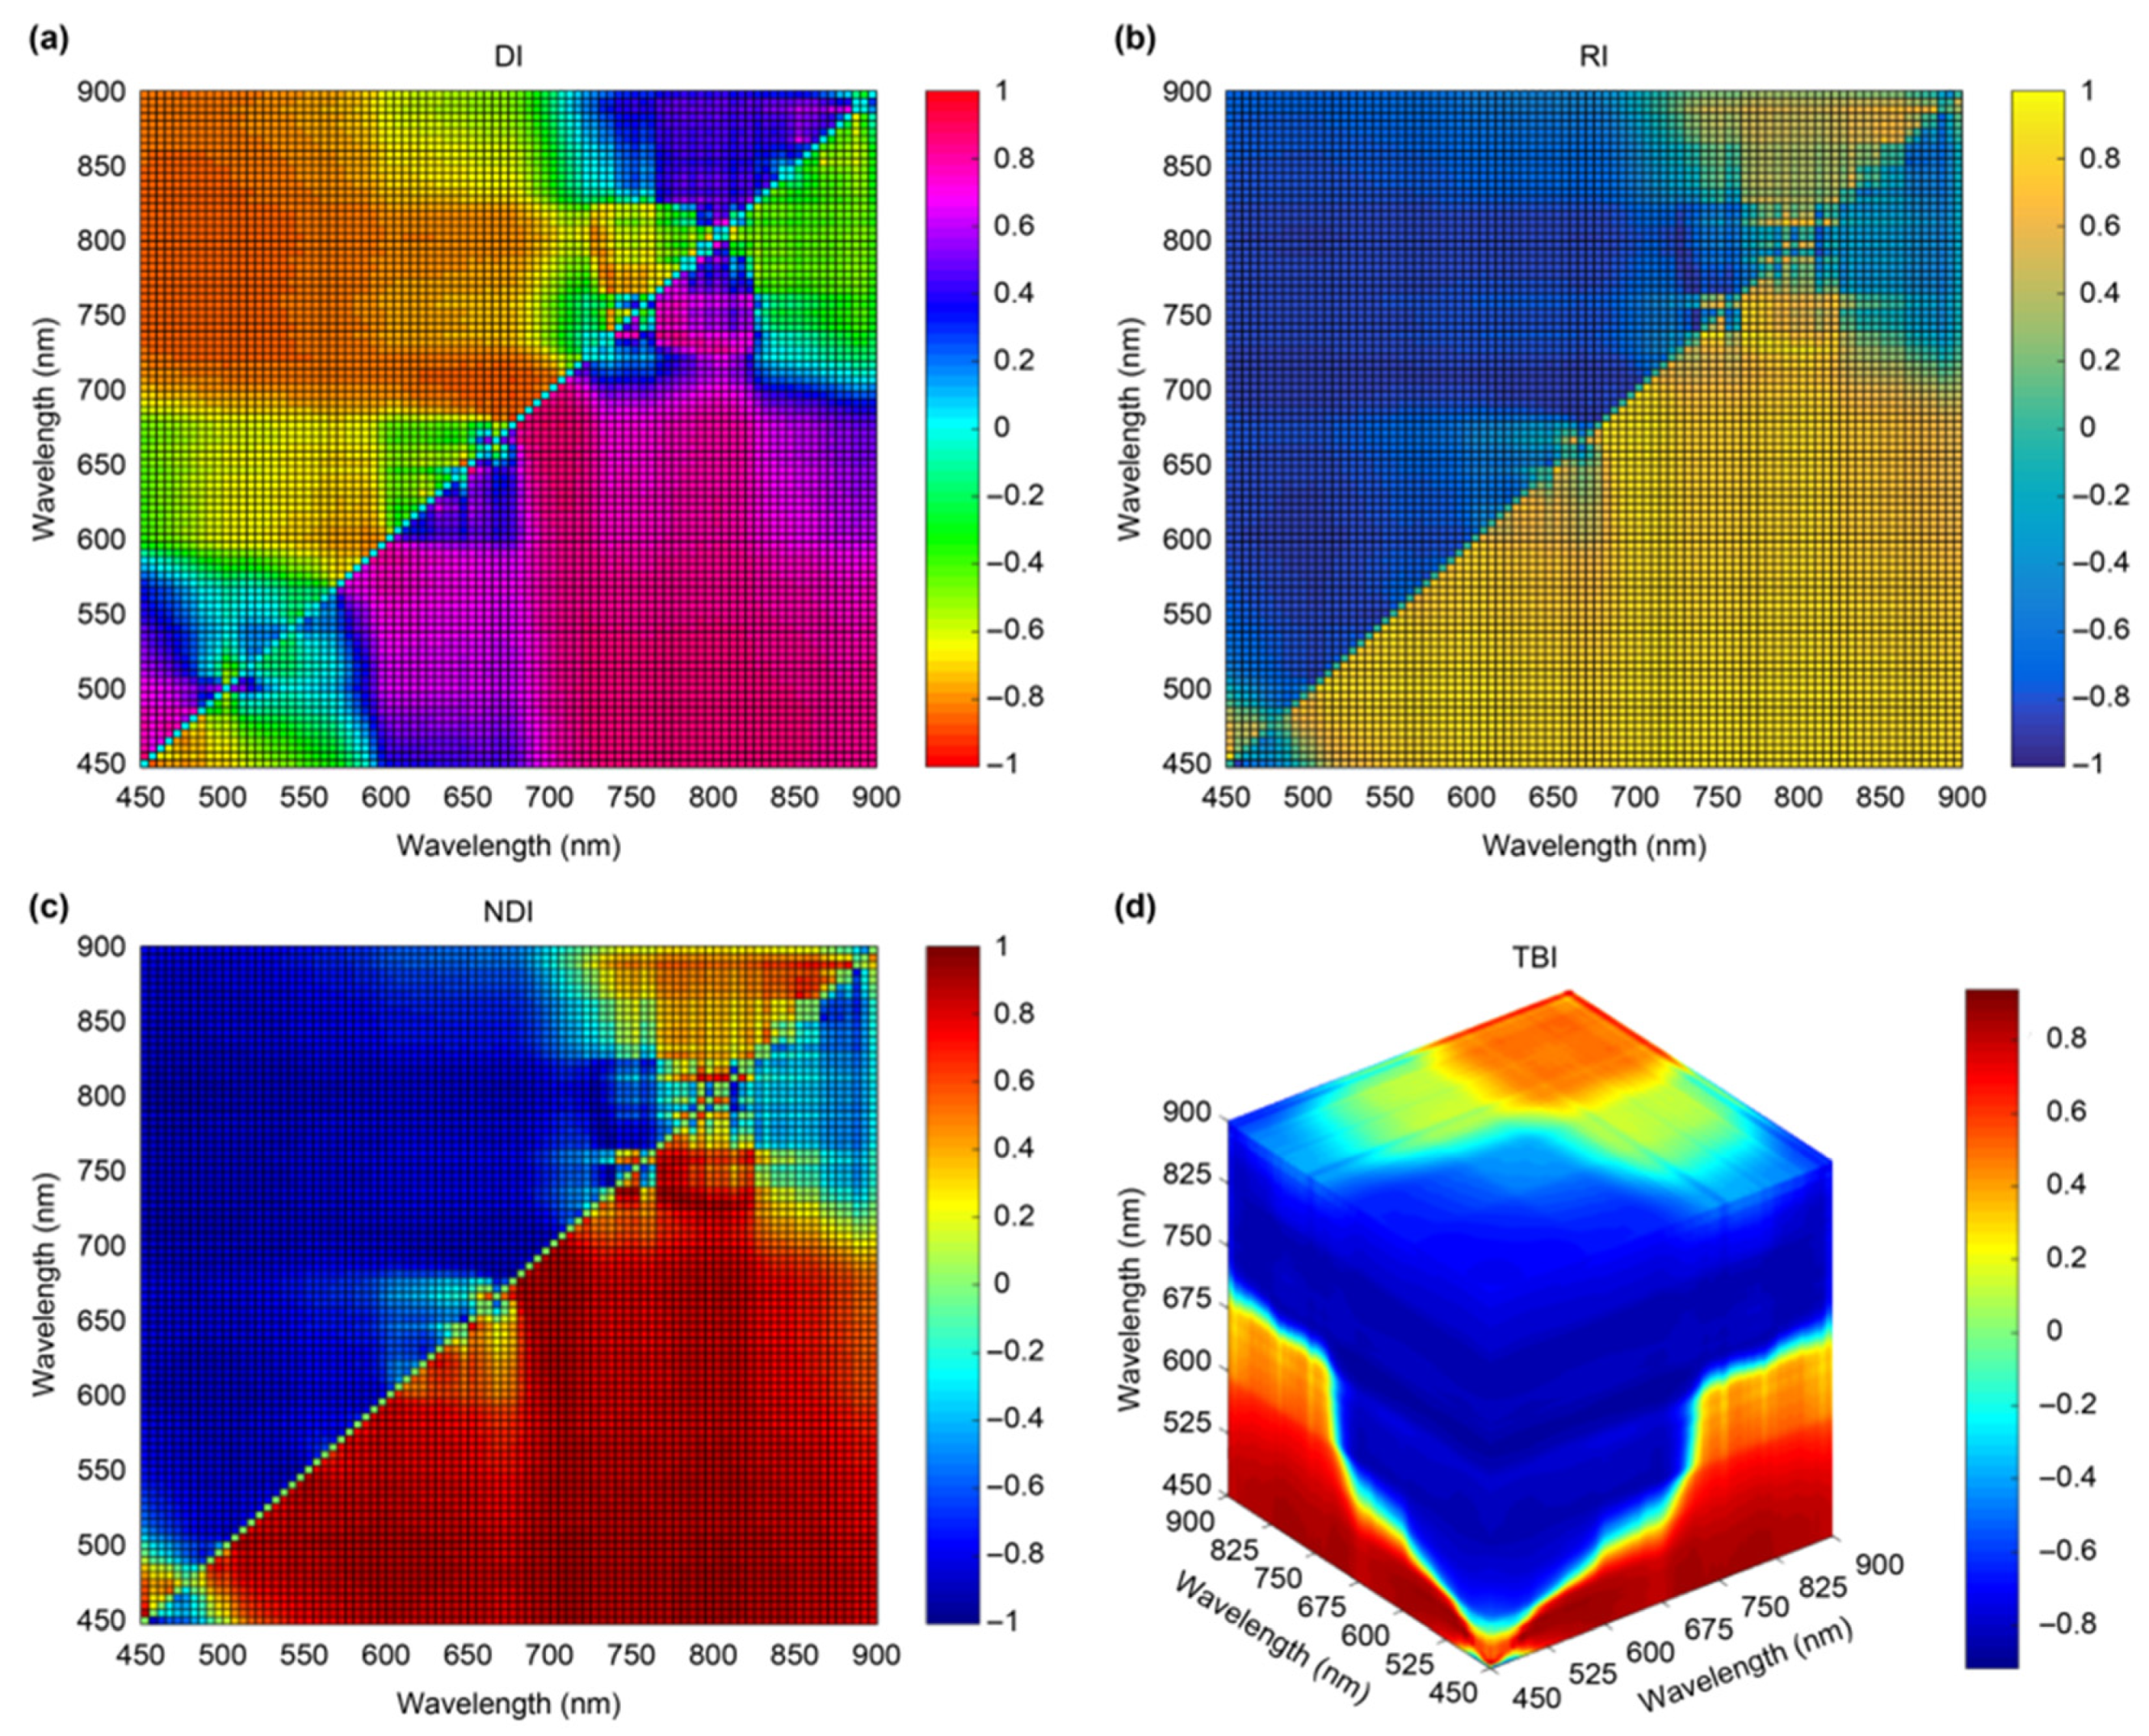
Based on obtaining the water reflectance, using turbidity, color, total nitrogen (TN), and total phosphorus (TN) as examples, we calculated the correlation coefficient matrix between water quality parameters and any combination of the dual-band difference index (DI), ratio index (RI), normalization index (NDI), and triple-band index (TBI). The spectral segment corresponding to the maximum correlation coefficient, the sensitive spectral segment, was determined from the correlation coefficient matrix.
Pearson’s correlation analysis was performed between the DI, RI, NDI, and TBI and measured turbidity parameters. The results of this analysis are presented in Figure 10.
The spectral segment with the highest correlation coefficient was identified from the correlation coefficient matrix. Subsequently, the partial least squares method was used to establish a degree inversion prediction model using the index (DI, RI, NDI, or TBI) corresponding to the spectral segment with the highest correlation coefficient and measured turbidity parameters. The test set was substituted into the established prediction model to obtain R2, RMSE, RPD, and other model indicators. The results are summarized in Table 3:
Among the turbidity monitoring indices listed in Table 3, the optimal band combinations selected by the four indices were relatively similar, at approximately 770 nm. The modeling accuracy R2, verification accuracy R2, RMSE, and RPD of the DI were significantly lower than those of the other three indices. The RI and NDI had the same optimal band combination, while the modeling accuracy R2, verification accuracy R2, RMSE, and RPD of the RI and the TBI were also similar. Therefore, the NDI prediction of water turbidity parameters in the 768 nm and 774 nm bands was quite effective.
Pearson’s correlation analysis was performed between the DI, RI, NDI, and TBI and measured color parameters. The results of this analysis are presented in Figure 11.
The spectral segment with the highest correlation coefficient was identified from the correlation coefficient matrix. Subsequently, the partial least squares method was used to establish a degree inversion prediction model using the index (DI, RI, NDI, or TBI) corresponding to the spectral segment with the highest correlation coefficient and measured color parameters. The test set was substituted into the established prediction model to obtain R2, RMSE, RPD, and other model indicators. The results are summarized in Table 4:
Table 4 presents the optimal band combinations selected by various indices for color monitoring: the DI indicates 613 nm and 623 nm; the RI indicates 683 nm and 718 nm; the normalization index indicates 683 nm and 713 nm; and the TBI indicates 819 nm, 774 nm, and 840 nm. The first three indices exhibited R2 values greater than 0.9 in the modeling set and R2 values greater than 0.8 in the testing set. The modeling set R2 and testing set R2 of the TBI were both less than 0.7, whereas the RMSE and RPD of the DI were superior to those of the other three indices. Based on the above table, the DI in the 613 nm and 623 nm bands effectively predicted the color parameters in water.
Pearson’s correlation analysis was performed between the DI, RI, NDI, and TBI and measured total nitrogen parameters. The results of this analysis are shown in Figure 12.
The spectral segment corresponding to the maximum correlation coefficient was identified from the correlation coefficient matrix. Subsequently, the partial least squares method was used to establish a degree inversion prediction model using the index (DI, RI, NDI, or TBI) corresponding to the spectral segment with the highest correlation coefficient and measured total nitrogen parameter. The test set was substituted into the established prediction model to obtain R2, RMSE, RPD, and other model indicators. The results are summarized in Table 5:
Table 5 displays the optimal band combinations selected by various indices for total nitrogen monitoring: the DI indicates 844 nm and 855 nm; the RI indicates 517 nm and 548 nm; and the NDI indicates 517 nm and 548 nm. The optimal band combinations for the TBI were 661 nm, 548 nm, and 639 nm. The modeling set R2, testing set R2, RMSE, and RPD indices of the difference index were worse than those of the other three indices. The RI and NDI were very close; however, the testing set R2 of the TBI was higher than that of the other indices. Therefore, the TBI prediction of total nitrogen parameters in water at 661 nm, 548 nm, and 639 nm was relatively effective.
Pearson’s correlation analysis was performed between the DI, RI, NDI, and TBI and measured total nitrogen parameters. The results of this analysis are shown in Figure 13.
The spectral segment corresponding to the maximum correlation coefficient was identified from the correlation coefficient matrix. Subsequently, the partial least squares method was used to establish a degree inversion prediction model using the index (DI, RI, NDI, or TBI) corresponding to the spectral segment with the highest correlation coefficient and the measured total phosphorus parameter. The test set was substituted into the established prediction model to obtain R2, RMSE, RPD, and other model indicators. The results are summarized in Table 6:
Table 6 shows the optimal band combinations selected by various indices for total phosphorus monitoring: the DI indicated 819 nm and 824 nm, whereas the optimal band combinations selected by the RI and NDI were 542 nm and 527 nm, respectively. The optimal band combinations for the TBI were 558 nm, 588 nm, and 527 nm. The first three indices had R2 values less than 0.8 in the modeling set and R2 values less than 0.8 in the testing set. The R2 values of the RI between the training and test sets were both maximum. The RMSE and RPD of the RI were similar to those of the other two indices. The modeling set R2 and testing set R2 of the TBI and the RMSE and RPD were all worse than the other three indices. Therefore, the RI in the 542 nm and 527 nm bands had a superior effect on predicting the total phosphorus parameters in water.

3.3. Water Quality Parameter Inversion Results

Based on the acquisition of sensitive spectral bands derived from the four indices (DI, RI, NDI, and TBI), four models for each index were established for each parameter. In Section 3.2, the models developed for each water quality parameter were compared, and the model corresponding to the best index was selected. Utilizing UAVs to acquire surface-source water reflectance, sensitive spectral bands were input into the corresponding water quality parameter model to perform surface-source concentration inversion and generate a spatial distribution map of water quality parameters. Simultaneously, statistical analysis was conducted on the measured data to enable comparison with the spatial distribution map of the water quality parameters.
Following sampling at the control point of the Three Gorges test site and subsequent laboratory measurements, statistical analysis was conducted on the four measured water quality parameters: turbidity, color, total nitrogen, and total phosphorus. The results are summarized in Table 7.
From the chart, the observed ranges for the four water quality parameters were as follows: turbidity (NTU; 1.41–41.40), color (PCU; 8.85–48.66), total nitrogen (mg·L−1; 0.49–2.17), and total phosphorus (mg·L−1; 0.01–0.07). These values reflect the variability of each indicator in the monitoring scenario. The mean value represents the average level and serves as a reference for this group’s standard water quality condition. Discreteness: The standard deviation (STD) reflected low data dispersion. The coefficient of variation (C.V.) was dimensionless, with turbidity being 0.92. The high degree of data variability suggests substantial influence from environmental factors. The color C.V. was 0.45, exhibiting relative stability.
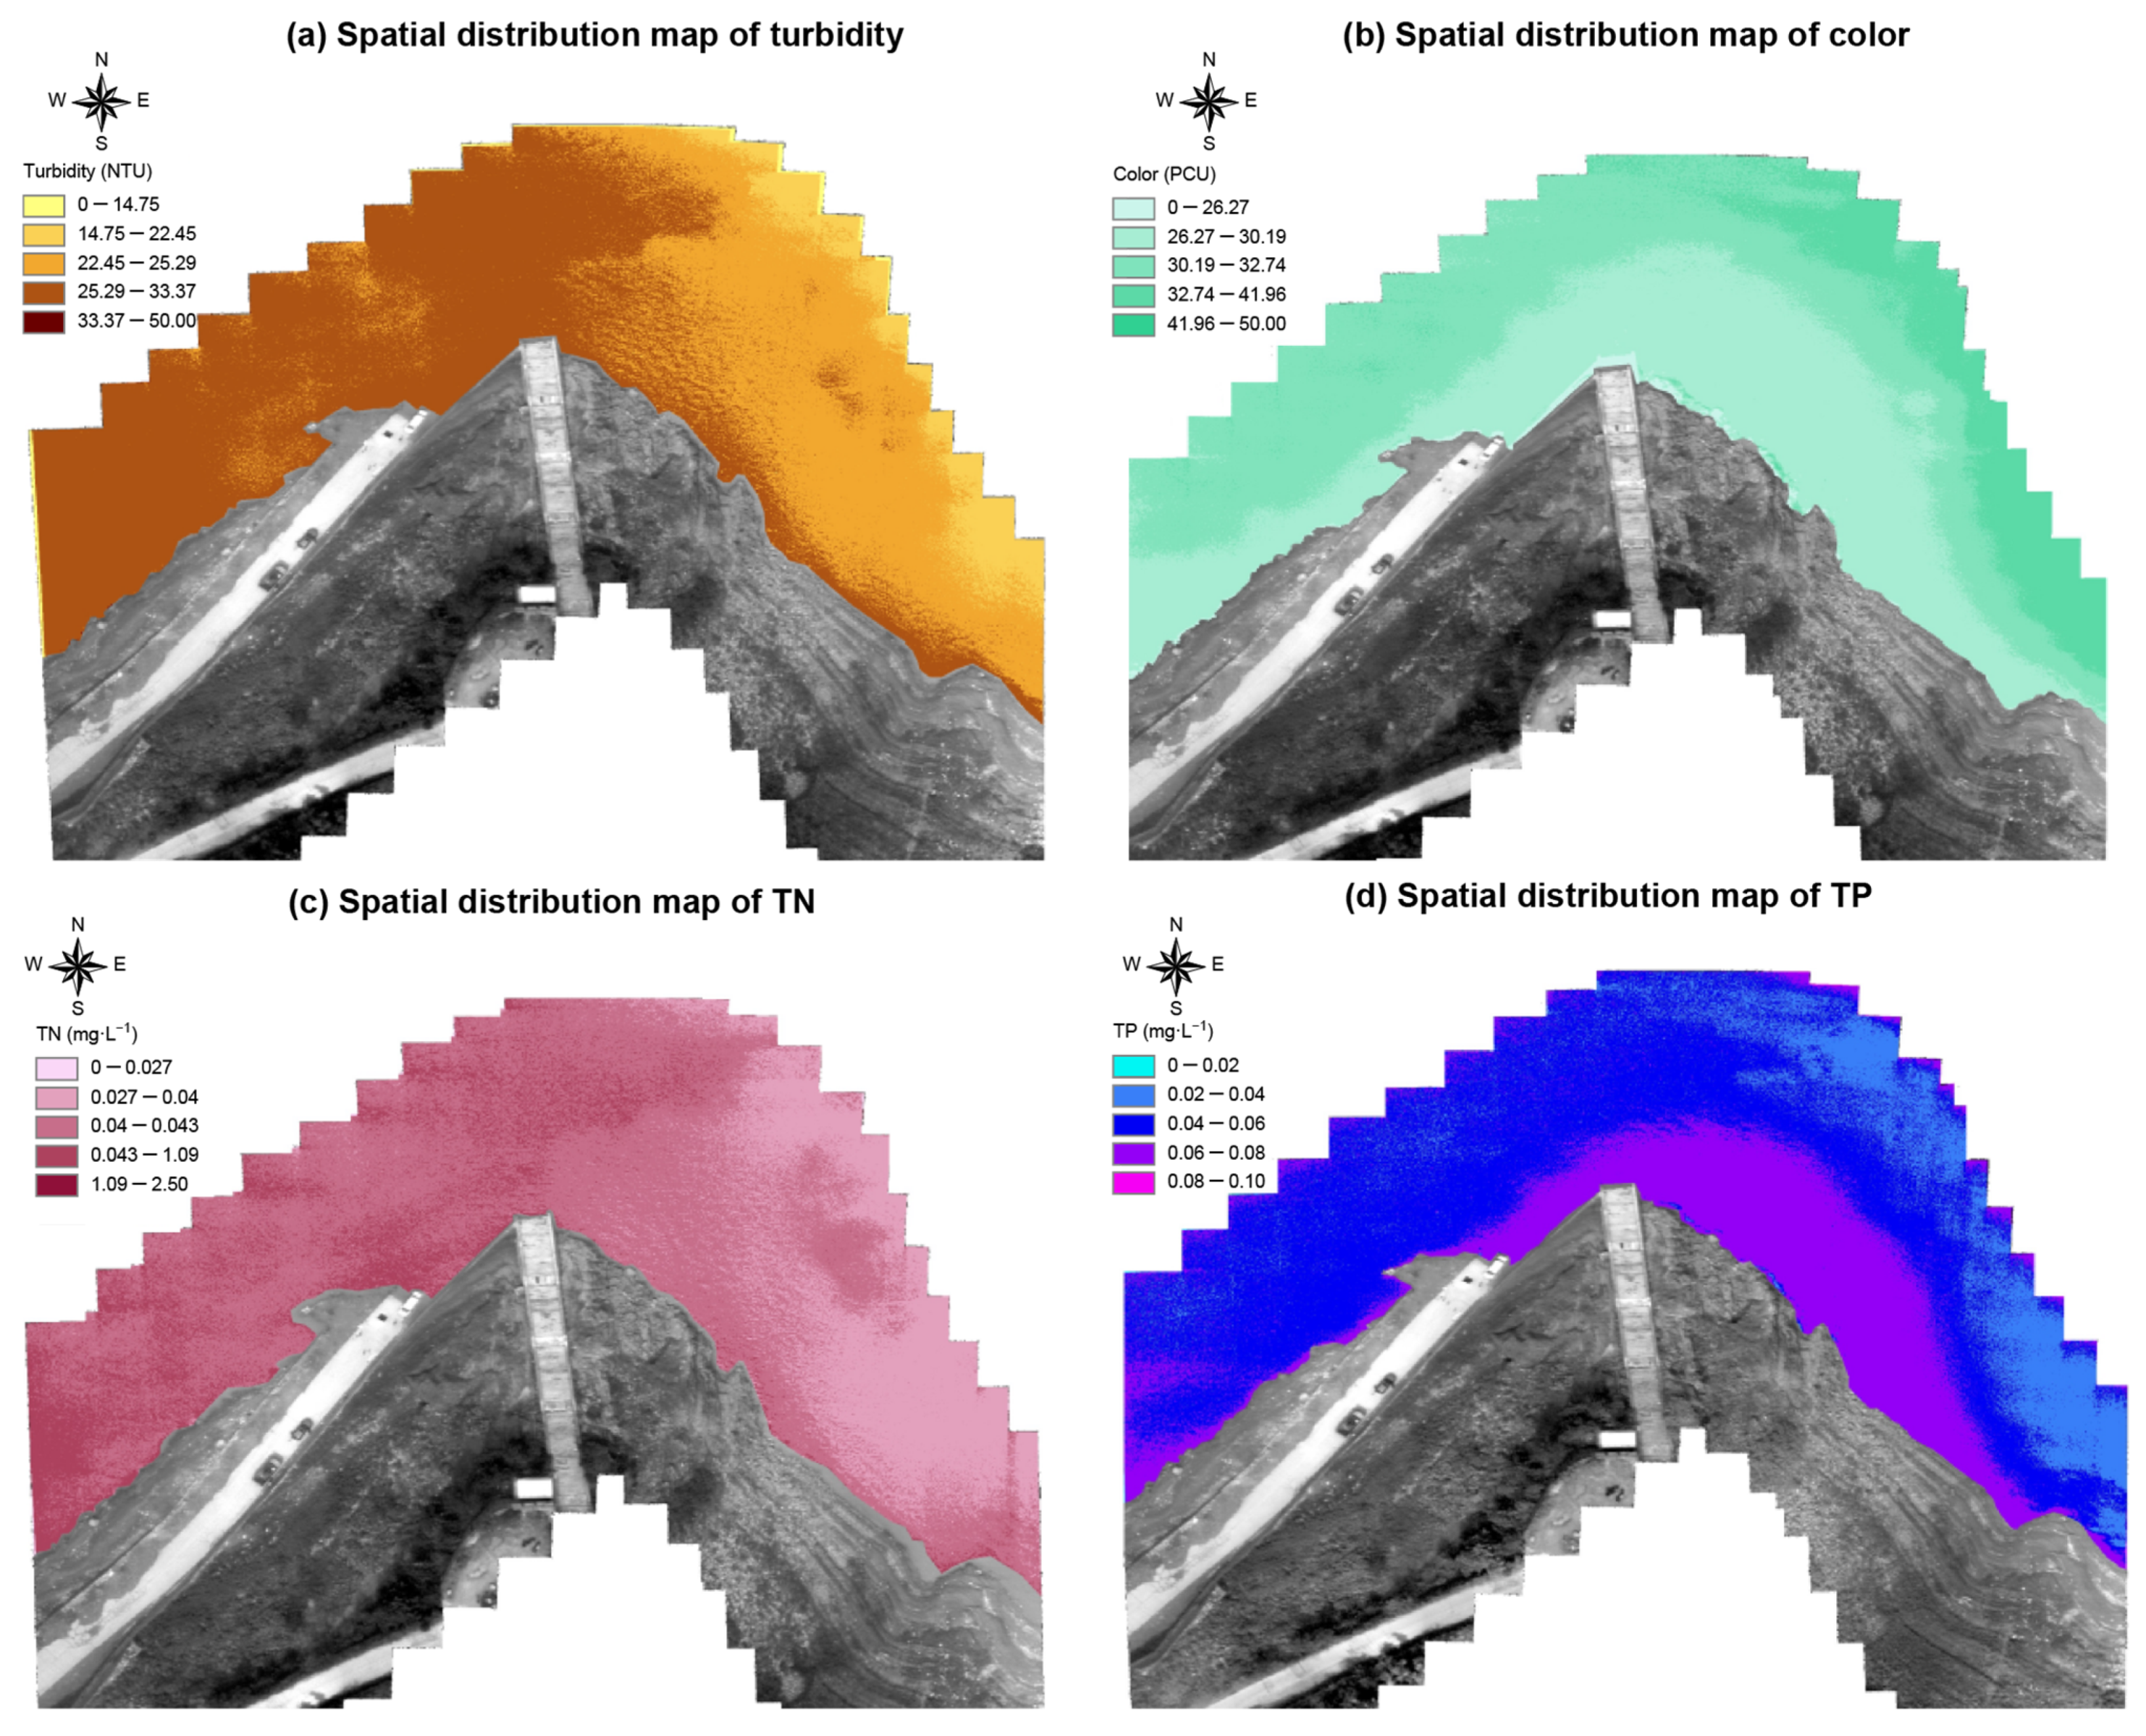
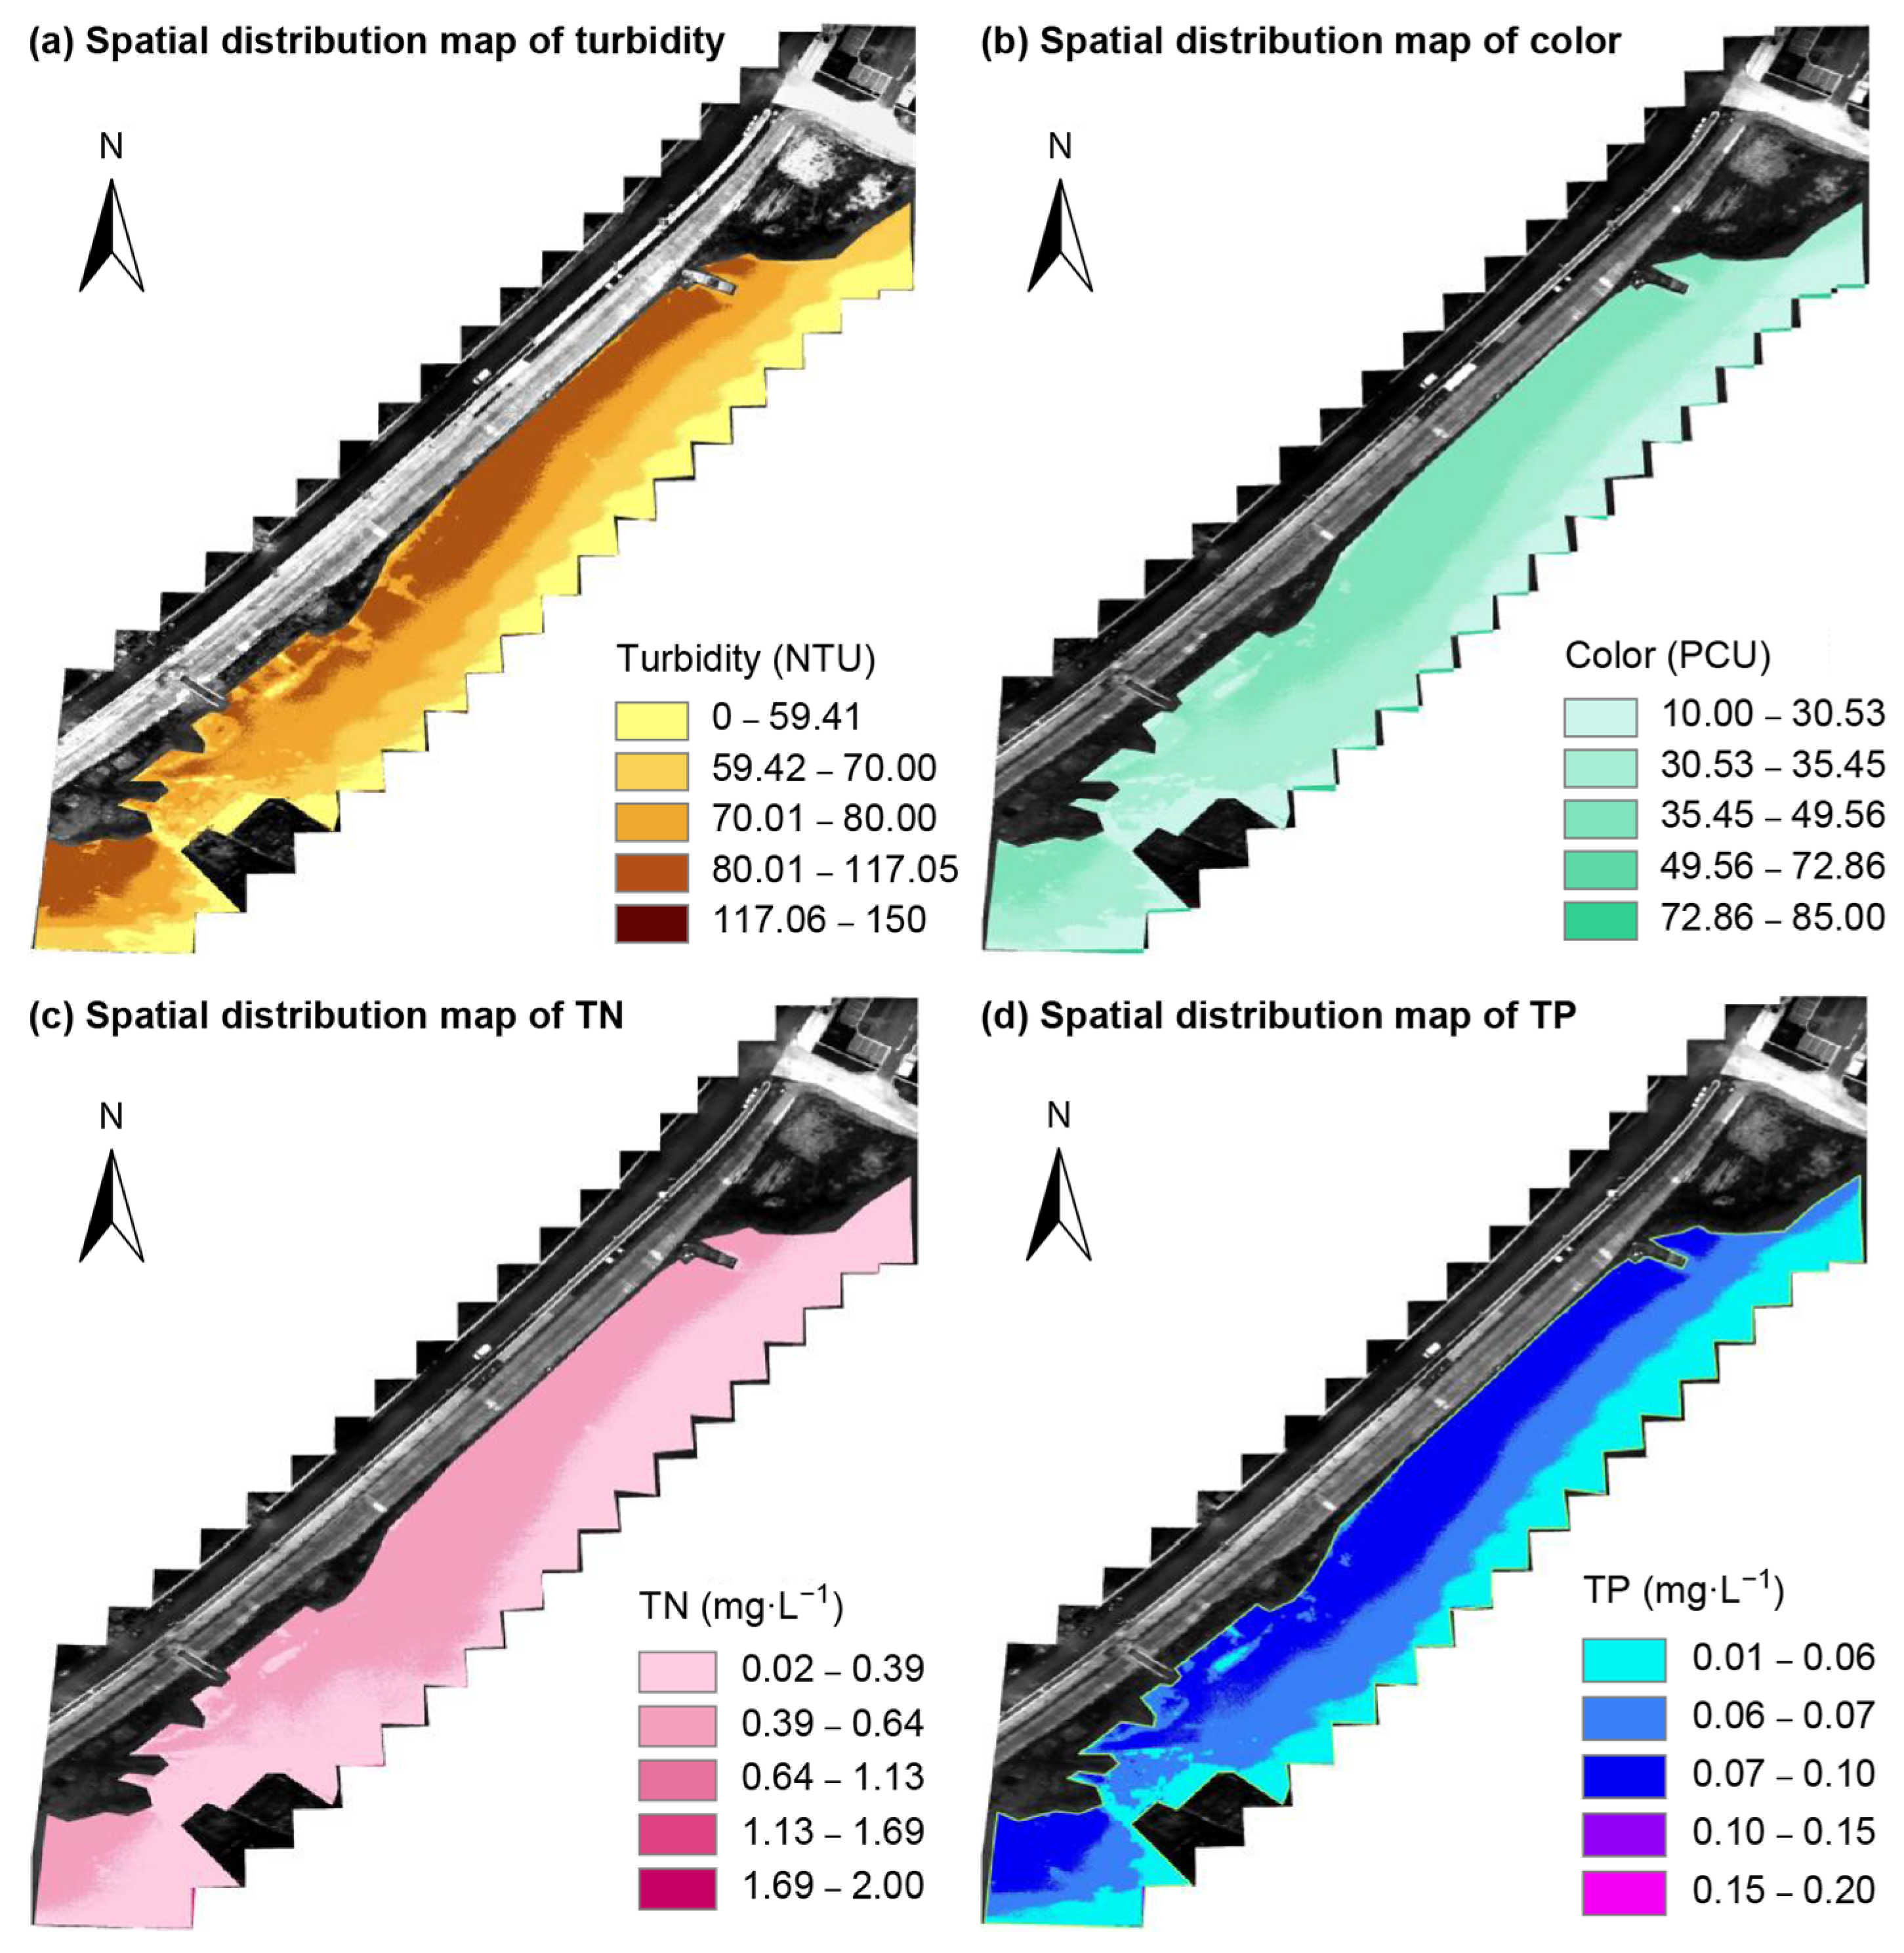
Based on the selected optimal prediction model and using the Guojiaba experimental site in the Three Gorges test site as an example, Figure 14 shows the concentration spatial distribution of water turbidity, color, total nitrogen, and total phosphorus parameters at the Guojiaba experimental site.
Figure 14 shows that the range of water quality parameter fluctuations in the spatial distribution of the Guojiaba test point in the Three Gorges is consistent with the parameter ranges in Table 7. Specific manifestation: Turbidity shows a trend of decreasing in the east and increasing in the west, as observed at the Guojiaba experimental site situated at a ferry crossing point. After a period, the regular passage of ferries in the west is anticipated to disturb the sediment in the water, leading to higher turbidity levels in that area. Therefore, the turbidity in the west is notably higher than that in the east. The distribution of color concentration at the Guojiaba experimental point exhibits similarities to turbidity and is also affected by the ferry receiving barge. The distribution of total phosphorus shows a high concentration band near the middle shore. During our experiment, we found that the steps of the experimental point depicted in the figure represent the locations where swimming enthusiasts complete their swimming and reach the shore. Upon completion of their swim, it was noted that they typically wash clothes at the shore near the ascending steps. The available data show that certain laundry products contain phosphorus, which may contribute to the elevated concentration levels in the total phosphorus concentration distribution map. The graph also demonstrates a pattern of low total nitrogen concentration in the east and high concentration in the west.
After sampling from the GCPs at the Poyang Lake experimental site and subsequent laboratory measurements, statistical analysis was conducted on the four measured water quality parameters: turbidity, color, total nitrogen, and total phosphorus. The results are summarized in Table 8.
The ranges for the set of water quality parameter statistics were as follows: turbidity (NTU; 5.69–144.00), color (PCU; 30.96–79.63), total nitrogen (mg·L−1; 0.70–1.81), and total phosphorus (mg·L−1; 0.05–0.15). Central tendency: The mean reflects the average level and can be used as a reference for general water quality conditions. Discreteness: Standard deviation (STD) indicates data variability. The coefficient of variation (C.V.) eliminates the influence of dimensionality. The turbidity C.V. was 0.62, indicating a high degree of fluctuation. Conversely, the color C.V. was 0.22, exhibiting relative stability.
Based on the selected best prediction model and using the Wucheng Town experimental site in the Poyang Lake Test Site as an example, Figure 15 illustrates the spatial distribution of water turbidity, color, total nitrogen, and total phosphorus concentrations in the study area of the Wucheng Town experimental site in Poyang Lake.
Figure 15 shows that the range of water quality parameter fluctuations in the spatial distribution of the Poyang Lake test points closely aligns with the maximum and minimum values of each parameter shown in Table 8. Notably, the proximity of the experimental site to residential areas, two rainwater discharge outlets, and recent rainfall before the experiment contributed to a particularly wide range in turbidity values. Similar patterns were observed for color, total nitrogen, and total phosphorus. In addition, the spatial distribution of concentrations revealed a distinct gradient, with values stratifying as the distance from the shoreline increased.

4. Discussion

4.1. Methods for Obtaining the Water-Leaving Reflectance Curve

The method for obtaining underwater reflectance using UAVs can be directly adapted from previously proposed methods [29,30], including that of East China Normal University, which inputs UAV-measured remote sensing radiance into a formula for calculating underwater reflectance at the inlet end. The methods used by the researchers in Belgium and the UK were essentially the same as those used by East China Normal University.
An alternative approach is the linear transformation method [31,32] employed by researchers from Hubei and Wuhan Universities. This method measured water reflectance near the water end on the ground and then used a simple linear formula to linearly convert radiance into reflectance. We proposed two novel methods: Method 1: Based on the BRF neural network, the input consists of a single spectral segment for single spectral segment regression. Method 2: A fully connected neural network model based on TensorFlow Keras with a single reflectance curve as the input. Based on the experimental data in this study, a comparison was made in Figure 8 between the four methods in acquiring UAV water-leaving reflectance. The red curve represents the water-leaving reflectance curve of the control point measured using standard methods with an ASD near the ground end. Conversely, the blue curve in the four subplots denotes the UAV water-leaving reflectance curve obtained using the four methods. The direct substitution method yielded a water-free reflectance curve that differed significantly from that at the inlet end. The linear transformation method showed a similar trend to the water-leaving reflectance curve at the inlet end; however, the transformed water-leaving reflectance curve was more concentrated. Our method 1 demonstrated consistent local trends, particularly within the 750–900 nm range, and displayed some characteristic peaks in detail. However, the overall performance of the reflectance curve was poor, and sudden changes in the trend could occur. Method 2 exhibited a favorable overall trend; however, its drawback was the lack of prominent feature peaks in the details. Table 2 provides the average SAM results from a quantitative perspective based on determining spectral angles: direct substitution method > linear transformation method > our method 1 > our method 2. Consequently, our method 2, based on the fully connected neural network model of TensorFlow Keras, effectively facilitated the mapping conversion between the UAV hyperspectral and near-water reflectance.
Based on the results in Table 2, we provide mechanistic and physical explanations for the observed performance differences. Method 2 outperforms Method 1 because its model design better aligns with the physical nature of water body remote sensing reflectance (Rrs). Specifically, Rrs is a continuous optical signal formed by the absorption and scattering of light by substances such as suspended solids and colored dissolved organic matter [50]. Reflectance values across different spectral bands are inherently correlated, exhibiting overall synergy dictated by the laws of radiative transfer. Method 1, which employs single-band independent regression, disrupts this spectral continuity, failing to capture cross-band correlations and often misinterpreting local noise as signal [51]. This results in discontinuities and distortions in the overall spectral trend.
In contrast, Method 2 uses the complete reflectance curve as input. By integrating full-spectrum information through a fully connected neural network, the method accurately conforms to the continuous variation of water body reflectance while filtering non-physical noise. Consequently, the output spectrum of Method 2 shows notably higher consistency with actual remote sensing reflectance in terms of overall physical morphology, as evidenced by the SAM index.

4.2. Concentration Inversion from Water Quality Parameters

Using the reflectance curves and corresponding in situ water quality measurements at control points, dual-band differences, ratios, normalization, and three-band indices were constructed to analyze correlations with various water quality parameters, identifying their sensitive spectral bands. Corresponding mathematical models were developed using the least squares method and evaluated using RMSE and RPD. Finally, the derived models were applied to the converted free water reflectance to generate spatial distribution maps of water quality parameters.
For turbidity inversion, a normalized difference index (NDI) was constructed using 768 nm and 774 nm. This selection captures two key effects: it corresponds to the strong scattering characteristics of suspended solids in the near-infrared, accurately reflecting turbidity changes, and the narrow band combination mitigates atmospheric and environmental noise through spectral synergy, enhancing inversion stability [52]. Color inversion employed 613 nm and 623 nm to construct a difference index (DI), leveraging the strong absorption of yellow substances in the shortwave visible region. Three-dimensional fluorescence spectroscopy further confirms that the absorption coefficient of colored dissolved organic matter (CDOM) in the 400–700 nm range is positively correlated with organic carbon concentration, supporting the use of reflectance differences to characterize water color [53].
Total nitrogen inversion used 661 nm, 548 nm, and 639 nm to construct a three-band index (TBI), overcoming the lack of direct optical activity of nitrogen. Bands at 548 nm and 639 nm respond to nitrate absorption, whereas 661 nm reflects optical correlations of organic nitrogen, enabling indirect total nitrogen estimation [54]. Total phosphorus inversion used 542 nm and 527 nm to construct a ratio index (RI), reflecting the optical characteristics of phosphorus, which predominantly binds to suspended particles. The 542 nm band corresponds to the particle scattering peak, and 527 nm to the chlorophyll absorption valley. This ratio amplifies phosphorus-related optical signals, and its placement in the green light region ensures sensitivity to phosphorus concentration, consistent with previous studies [27].
Finally, comparison of in situ water quality measurements from the Three Gorges and Poyang Lake demonstration zones with UAV-based hyperspectral concentration maps (Table 7 and Table 8; Figure 14 and Figure 15) shows that the parameter ranges measured at UAV hyperspectral control points are largely consistent with the spatial distribution maps, validating the accuracy and reliability of the inversion approach.

4.3. Limitations of the Study

One of the limitations of this study is the limited sample size employed. Additional samples are required to establish the stability and accuracy of the neural network model for mapping water reflectance, thereby enhancing both stability and accuracy. Moreover, the number of control points in this study is relatively limited, which is an area that requires improvement in future research.

5. Conclusions

Current determination of water reflectance primarily relies on ASD measurements conducted near the water end on the ground or by acquiring water reflectance via atmospheric radiation correction using a satellite remote sensing platform. However, limited research has been conducted on obtaining water reflectance through UAV remote sensing of ground reflectance. In response to the shortcomings of the current direct input and linear transformation methods, this study proposes a neural network-based conversion method between the hyperspectral reflectance of UAVs and near-water end water-leaving reflectance. It implements a UAV hyperspectral water remote sensing water reflectance acquisition method based on air–ground cooperative correction. The average spectral angle in SAM decreases from 0.5433 to 0.1070. A water quality parameter inversion model was established based on sensitive spectral ranges of various water quality parameters, achieving a determination coefficient R2 greater than 0.85. This resulted in a spatial distribution map of water quality parameters that closely aligned with the measured values, thereby verifying the feasibility and reliability of the proposed method.
The future research strategy involves investigating and evaluating a small-sample network model, incorporating an attention mechanism into the neural network model based on the characteristics of water reflectance, or increasing the number of experiments to identify a more universal methodology. We plan to continuously improve the UAV hyperspectral water remote sensing water reflectance acquisition method based on air–ground collaborative correction and investigate novel methods for water quality parameter inversion.

Author Contributions

Conceptualization, B.H. and X.H.; data curation, H.L.; formal analysis, H.L. and Z.Z.; funding acquisition, T.Y. and B.H.; investigation, Z.T. and T.Y.; methodology, H.L.; project administration, T.Y.; resources, T.Y.; software, X.L.; supervision, B.H.; validation, Z.T.; visualization, X.W.; writing—original draft, H.L.; writing—review and editing, B.H. and X.H. All authors have read and agreed to the published version of the manuscript.

Funding

This research was funded by the National Natural Science Foundation of China (Grant Numbers 62272376 and 61872286) and a Class A plan from a major strategic pilot project of the Chinese Academy of Sciences (Grant Number XDA23040101).

Data Availability Statement

All data generated or analyzed during this study are included in this published article.

Acknowledgments

GenAI was not used for any aspect of the data analysis or writing process.

Conflicts of Interest

The authors declare no conflicts of interest. The funders had no role in the design of the study; in the collection, analyses, or interpretation of data; in the writing of the manuscript; or in the decision to publish the results.

Abbreviations

The following abbreviations are used in this manuscript:
AOTFAcousto-Optic Tunable Filter
ASDAnalytical Spectral Device
C.V.Coefficient of Variation
DIDifference Index
DNDigital Number
FCNNFully Connected Neural Network
GCPGround Control Point
NDINormalized Difference Index
NTUNephelometric Turbidity Units
PCUPlatinum-Cobalt Units (Color)
R2Coefficient of Determination
RIRatio Index
RMSERoot Mean Squared Error
RPDResidual Prediction Deviation
SAMSpectral Angle Mapping
STDStandard Deviation
SWIRShortwave Infrared
TNTotal Nitrogen
TPTotal Phosphorus
TBITriple-Band Index
UAVUnmanned Aerial Vehicle

References

  1. Wu, J.; Cao, Y.; Wu, S.; Parajuli, S.; Zhao, K.; Lee, J. Current capabilities and challenges of remote sensing in monitoring freshwater cyanobacterial blooms: A scoping review. Remote Sens. 2025, 17, 918. [Google Scholar] [CrossRef]
  2. Wasehun, E.T.; Beni, L.H.; Di Vittorio, C.A. UAV and satellite remote sensing for inland water quality assessments: A literature review. Environ. Monit. Assess. 2024, 196, 277. [Google Scholar] [CrossRef] [PubMed]
  3. Bai, X.; Wang, J.; Chen, R.; Kang, Y.; Ding, Y.; Lv, Z.; Ding, D.; Feng, H. Research progress of inland river water quality monitoring technology based on unmanned aerial vehicle hyperspectral imaging technology. Environ. Res. 2024, 257, 119254. [Google Scholar] [CrossRef]
  4. Liang, Y.-H.; Deng, R.-R.; Liang, Y.-J.; Liu, Y.-M.; Wu, Y.; Yuan, Y.-H.; Ai, I.X.-J. Spectral characteristics of sediment reflectance under the background of heavy metal polluted water and analysis of its contribution to water-leaving reflectance. Spectrosc. Spect. Anal. 2024, 44, 111–117. [Google Scholar]
  5. Guo, X.; Liu, H.; Zhong, P.; Hu, Z.; Cao, Z.; Shen, M.; Tan, Z.; Liu, W.; Liu, C.; Li, D.; et al. Remote retrieval of dissolved organic carbon in rivers using a hyperspectral drone system. Int. J. Digit. Earth 2024, 17, 2358863. [Google Scholar] [CrossRef]
  6. Jung, S.H.; Kwon, S.; Seo, I.W.; Kim, J.S. Comparison between hyperspectral and multispectral retrievals of suspended sediment concentration in rivers. Water 2024, 16, 1275. [Google Scholar] [CrossRef]
  7. Hou, Y.; Zhang, A.; Lyu, R.; Xue, X.; Zhang, Y.; Pang, J. Assessing river water quality using different remote sensing technologies. J. Irrig. Drain. 2023, 42, 121–130. [Google Scholar] [CrossRef]
  8. Adjovu, G.E.; Stephen, H.; James, D.; Ahmad, S. Measurement of total dissolved solids and total suspended solids in water systems: A review of the issues, conventional, and remote sensing techniques. Remote Sens. 2023, 15, 3534. [Google Scholar] [CrossRef]
  9. Kieu, H.T.; Pak, H.Y.; Trinh, H.L.; Pang, D.S.C.; Khoo, E.; Law, A.W.-K. UAV-based remote sensing of turbidity in coastal environment for regulatory monitoring and assessment. Mar. Pollut. Bul. 2023, 196, 115482. [Google Scholar] [CrossRef]
  10. Ma, Q.; Li, S.; Qi, H.; Yang, X.; Liu, M. Rapid prediction and inversion of pond aquaculture water quality based on hyperspectral imaging by unmanned aerial vehicles. Water 2025, 17, 40517. [Google Scholar] [CrossRef]
  11. Trinh, H.L.; Kieu, H.T.; Pak, H.Y.; Pang, D.S.C.; Tham, W.W.; Khoo, E.; Law, A.W.-K. A comparative study of multi-rotor unmanned aerial vehicles (UAVs) with spectral sensors for real-time turbidity monitoring in the coastal environment. Sensors 2024, 8, 52. [Google Scholar] [CrossRef]
  12. Zeng, H.; He, X.; Bai, Y.; Gong, F.; Wang, D.; Zhang, X. Design and construction of UAV-based measurement system for water hyperspectral remote-sensing reflectance. Sensors 2025, 25, 2879. [Google Scholar] [CrossRef]
  13. Wei, J.; Wang, M.; Lee, Z.; Ondrusek, M.; Zhang, S.; Ladner, S. Experimental analysis of the measurement precision of spectral water-leaving radiance in different water types. Opt. Express 2021, 29, 2780–2797. [Google Scholar] [CrossRef]
  14. Wang, S.; Shen, F.; Li, R.; Li, P. Research on water surface glint removal and information reconstruction methods for unmanned aerial vehicle hyperspectral images. J. East. China Norm. Univ. Nat. Sci. 2024, 2024, 36–49. [Google Scholar]
  15. Yang, X.; Huang, H.; Liu, Y.; Yan, L. Direction characteristic of radiation energy and transmission characteristic of waters at water-air surface. Geomat. Inf. Sci. Wuhan. Univ. 2013, 38, 1003–1008. [Google Scholar]
  16. Su, X.; Cui, J.; Zhang, J.; Guo, J.; Xu, M.; Gao, W. “Ground-Aerial-Satellite” atmospheric correction method based on UAV hyperspectral data for coastal waters. Remote Sens. 2025, 17, 2768. [Google Scholar] [CrossRef]
  17. Zhong, P.; Guo, X.; Jiang, X.; Zhai, Y.; Duan, H. Study on the effect of sky scattered light on the reflectance of UAV hyperspectral about remote sensing of water color. Remote Sens. Technol. Appl. 2024, 39, 1128–1140. [Google Scholar]
  18. He, X.; Pan, T.; Bai, Y.; Shanmugam, P.; Wang, D.; Li, T.; Gong, F. Intelligent atmospheric correction algorithm for polarization ocean color satellite measurements over the open ocean. IEEE Trans. Geosci. Remote Sens. 2024, 62, 4201322. [Google Scholar] [CrossRef]
  19. Kim, M.; Danielson, J.; Storlazzi, C.; Park, S. Physics-based satellite-derived bathymetry (SDB) using Landsat OLI images. Remote Sens. 2024, 16, 843. [Google Scholar] [CrossRef]
  20. Rodrigues, G.; Potes, M.; Costa, M.J. Assessment of water surface reflectance and optical water types over two decades in Europe’s largest artificial lake: An intercomparison of ESA and NASA satellite data. IEEE J. Sel. Top. Appl. Earth Obs. Remote Sens. 2025, 18, 2942–2958. [Google Scholar] [CrossRef]
  21. Gao, B.-C.; Li, R.-R. A multi-band atmospheric correction algorithm for deriving water leaving reflectances over turbid waters from VIIRS data. Remote Sens. 2023, 15, 425. [Google Scholar] [CrossRef]
  22. Liu, X.; Warren, M.; Selmes, N.; Simis, S.G.H. Quantifying decadal stability of lake reflectance and chlorophyll-a from medium-resolution ocean color sensors. Remote Sens. Environ. 2024, 306, 114120. [Google Scholar] [CrossRef]
  23. Luo, Y.; Zhong, X.; Fu, D.; Yan, L.; Zhang, Y.; Liu, Y.; Huang, H.; Zhang, Z.; Qi, Y.; Wang, Q. Evaluation of applicability of Sentinel-2-MSI and Sentinel-3- OLCI water-leaving reflectance products in Yellow River Estuary. J. Atmos. Environ. Opt. 2023, 18, 585–601. [Google Scholar] [CrossRef]
  24. Bernstein, L.S.; Adler-Golden, S.M.; Sundberg, R.L.; Levine, R.Y.; Perkins, T.C.; Berk, A.; Ratkowski, A.J.; Felde, G.; Hoke, M.L. A new method for atmospheric correction and aerosol optical property retrieval for VIS-SWIR multi- and hyperspectral imaging sensors: QUAC (QUick Atmospheric Correction). In Proceedings of the 25th IEEE International Geoscience and Remote Sensing Symposium (IGARSS 2005), Seoul, Republic of Korea, 25–29 July 2005; pp. 3549–3552. [Google Scholar]
  25. Feng, C.; Fang, C.; Yuan, G.; Wu, J.; Wang, Q.; Dong, C. Water pollution monitoring based on unmanned aerial vehicle (UAV) hyperspectral and BP neural network. Chin. J. Environ. Eng. 2023, 17, 3996–4006. [Google Scholar] [CrossRef]
  26. Zhang, M.; Sun, J.; He, X.; Cao, H.; Zhao, K. Comparison and accuracy evaluation of UAV hyperspectral atmospheric and radiometric correction methods. Geomat. Spat. Inf. Technol. 2022, 45, 98–104. [Google Scholar] [CrossRef]
  27. Yang, X.; Wang, J.; Jing, Y.; Zhang, S.; Sun, D.; Li, Q. ESA-MDN: An ensemble self-attention enhanced mixture density framework for UAV multispectral water quality parameter retrieval. Remote Sens. 2025, 17, 3202. [Google Scholar] [CrossRef]
  28. Bai, R.; He, X.; Ye, X.; Li, H.; Bai, Y.; Ma, C.; Song, Q.; Jin, X.; Zhang, X.; Gong, F. Development of the operational atmospheric correction algorithm for the COCTS2 onboard the Chinese new-generation ocean color satellite. Opt. Express 2025, 33, 38029–38053. [Google Scholar] [CrossRef]
  29. Zang, C.S.F.; Yang, Z. Aquatic environmental monitoring of inland waters based on UAV hyperspectral remote sensing. Nat. Resour. Remote Sens. 2021, 33, 45–53. [Google Scholar] [CrossRef]
  30. De Keukelaere, L.; Moelans, R.; Knaeps, E.; Sterckx, S.; Reusen, I.; De Munck, D.; Simis, S.G.H.; Constantinescu, A.M.; Scrieciu, A.; Katsouras, G.; et al. Airborne drones for water quality mapping in inland, transitional and coastal Waters—MapEO water data processing and validation. Remote Sens. 2023, 15, 1345. [Google Scholar] [CrossRef]
  31. Wei, L.; Huang, C.; Zhong, Y.; Wang, Z.; Hu, X.; Lin, L. Inland waters suspended solids concentration retrieval based on PSO-LSSVM for UAV-borne hyperspectral remote sensing imagery. Remote Sens. 2019, 11, 1455. [Google Scholar] [CrossRef]
  32. Wei, L.; Huang, C.; Wang, Z.; Wang, Z.; Zhou, X.; Cao, L. Monitoring of urban black-odor water based on Nemerow index and gradient boosting decision tree regression using UAV-borne hyperspectral imagery. Remote Sens. 2019, 11, 2402. [Google Scholar] [CrossRef]
  33. Shanmugam, V.; Shanmugam, P. Retrieval of water-leaving radiance from UAS-based hyperspectral remote sensing data in coastal waters. Int. J. Remote Sens. 2025, 46, 4883–4915. [Google Scholar] [CrossRef]
  34. Jiang, H.; Zhang, P.; Guan, H.; Zhao, Y. A mobile triaxial stabilized ship-borne radiometric system for in situ measurements: Case study of Sentinel-3 OLCI validation in highly turbid waters. Remote Sens. 2025, 17, 1223. [Google Scholar] [CrossRef]
  35. Coqué, A.; Morin, G.; Peroux, T.; Martinez, J.-M.; Tormos, T. Lake SkyWater—A portable buoy for measuring water-leaving radiance in lakes under optimal geometric conditions. Sensors 2025, 25, 1525. [Google Scholar] [CrossRef]
  36. Liu, S.; Jiang, Y.; Wang, K.; Zhang, Y.; Wang, Z.; Liu, X.; Yan, S.; Ye, X. Design and Characterization of a portable multiprobe high-resolution system (PMHRS) for enhanced inversion of water remote sensing reflectance with surface glint removal. Sensors 2024, 11, 837. [Google Scholar] [CrossRef]
  37. Hong, L.; Tao, Y.; Bingliang, H.; Xingsong, H.; Zhoufeng, Z.; Xiao, L.; Jiacheng, L.; Xueji, W.; Jingjing, Z.; Zhengxuan, T.; et al. UAV-borne hyperspectral imaging remote sensing system based on acousto-optic tunable filter for water quality monitoring. Remote Sens. 2021, 13, 204069. [Google Scholar] [CrossRef]
  38. Calpe-Maravilla, J.; Vila-Frances, J.; Ribes-Gomez, E.; Duran-Bosch, V.; Munoz-Mari, J.; Amoros-Lopez, J.; Gomez-Chova, L.; Tajahuerce-Romera, E. 400-to 1000-nm imaging spectrometer based on acousto-optic tunable filters. J. Electron. Imaging 2006, 15, 023001. [Google Scholar] [CrossRef]
  39. Liu, H.; Hou, X.; Hu, B.; Yu, T.; Zhang, Z.; Liu, X.; Liu, J.; Wang, X.; Zhong, J.; Tan, Z. Image blurring and spectral drift in imaging spectrometer system with an acousto-optic tunable filter and its application in UAV remote sensing. Int. J. Remote Sens. 2022, 43, 6957–6978. [Google Scholar] [CrossRef]
  40. Dji. Available online: https://www.dji.com/cn (accessed on 6 February 2025).
  41. Ronin-MX. Available online: https://store.dji.com/cn/product/ronin-mx (accessed on 6 February 2024).
  42. Zhang, H.; Zhang, B.; Wei, Z.; Wang, C.; Huang, Q. Lightweight integrated solution for a UAV-borne hyperspectral imaging system. Remote Sens. 2020, 12, 657. [Google Scholar] [CrossRef]
  43. Liu, S.; Lin, Y.; Jiang, Y.; Cao, Y.; Zhou, J.; Dong, H.; Liu, X.; Wang, Z.; Ye, X. Kohler-polarization sensor for glint removal in water-leaving radiance measurement. Water 2025, 17, 1977. [Google Scholar] [CrossRef]
  44. Tang, J.; Tian, G.; Wang, X.; Wang, X.; Song, Q. The methods of water spectra measurement and analysis I: Above-water method. J. Remote Sens. 2004, 8, 37–44. [Google Scholar]
  45. Mobley, C.D. Estimation of the remote-sensing reflectance from above-surface measurements. Appl. Opt. 1999, 38, 7442–7455. [Google Scholar] [CrossRef]
  46. Mo, Y.; Kang, X.; Duan, P.; Li, S. A robust UAV hyperspectral image stitching method based on deep feature matching. IEEE Trans. Geosci. Remote Sens. 2022, 60, 5517514. [Google Scholar] [CrossRef]
  47. Chen, J.; Wang, J.; Feng, S.; Zhao, Z.; Wang, M.; Sun, C.; Song, N.; Yang, J. Study on parameter inversion model construction and evaluation method of UAV hyperspectral urban inland water pollution dynamic monitoring. Remote Sens. 2023, 15, 4131. [Google Scholar] [CrossRef]
  48. Wang, X.-Y.; Liu, S.-B.; Zhu, J.-W.; Ma, T.-T. Inversion of chemical oxygen demand in surface water based on hyperspectral data. Spectrosc. Spectr. Anal. 2024, 44, 997–1004. [Google Scholar] [CrossRef]
  49. Xu, X.; Chen, Y.; Wang, M.; Wang, S.; Li, K.; Li, Y. Improving estimates of soil salt content by using two-date image spectral changes in Yinbei, China. Remote Sen. 2021, 13, 4165. [Google Scholar] [CrossRef]
  50. Zhang, J.; Xu, Z.; Liu, Y.; Yang, Y.; Zhou, W.; Yang, Z.; Li, C. A general multilayer analytical radiative transfer-based model for reflectance over shallow water. IEEE Trans. Geosci. Remote Sens. 2024, 62, 4205320. [Google Scholar] [CrossRef]
  51. Syariz, M.A.; Lin, B.-Y.; Denaro, L.G.; Jaelani, L.M.; Math Van, N.; Lin, C.-H. Spectral-consistent relative radiometric normalization for multitemporal Landsat 8 imagery. ISPRS J. Photogramm. Remote Sens. 2019, 147, 56–64. [Google Scholar] [CrossRef]
  52. Zhang, Y.; Wu, L.; Deng, L.; Ouyang, B. Retrieval of water quality parameters from hyperspectral images using a hybrid feedback deep factorization machine model. Water Res. 2021, 204, 117618. [Google Scholar] [CrossRef]
  53. Huang, Q.; Liu, L.; Huang, J.; Chi, D.; Devlin, A.T.; Wu, H. Seasonal dynamics of chromophoric dissolved organic matter in Poyang Lake, the largest freshwater lake in China. J. Hydrol. 2022, 605, 127298. [Google Scholar] [CrossRef]
  54. Liu, C.; Zhang, F.; Ge, X.; Zhang, X.; Chan, N.W.; Qi, Y. Measurement of Total Nitrogen Concentration in Surface Water Using Hyperspectral Band Observation Method. Water 2020, 12, 1842. [Google Scholar] [CrossRef]
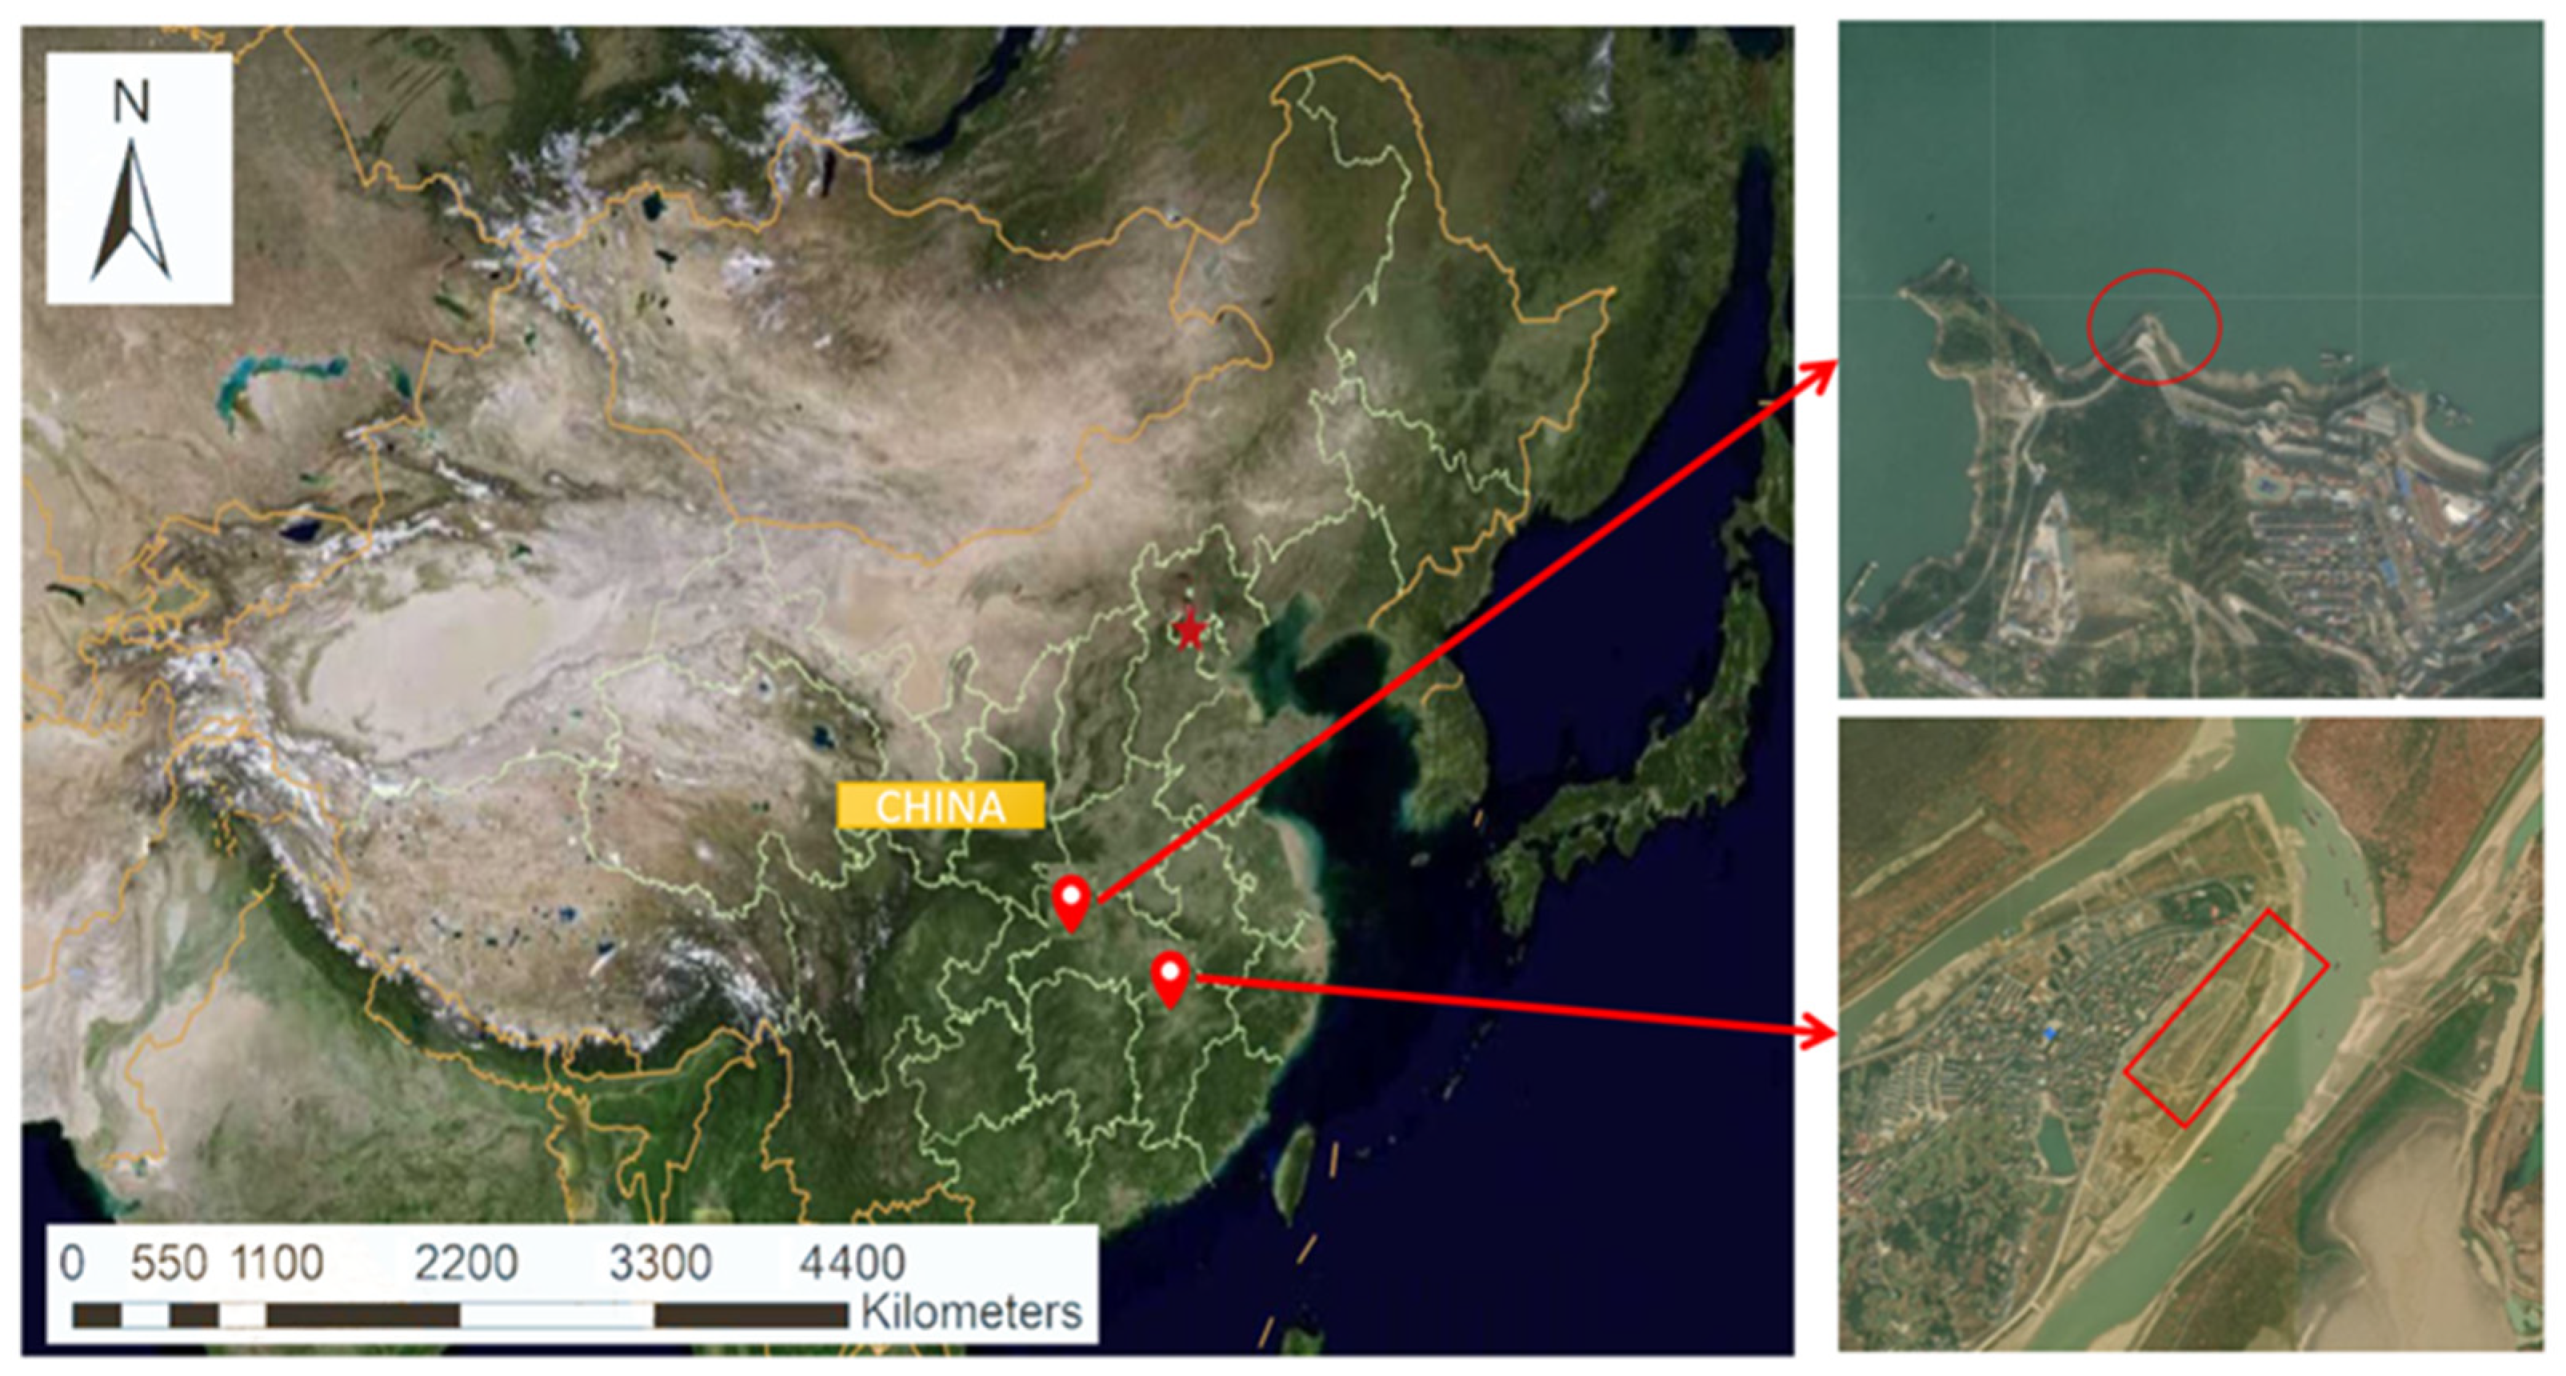
Figure 1. Inland water experimental sites (The red circle represents the Poyang Lake test point, and the red rectangle represents the Three Gorges test point).
Remotesensing 17 03413 g001
Figure 2. Physical image of the unmanned aerial hyperspectral imager based on AOTF.
Remotesensing 17 03413 g002
Figure 3. The unmanned aerial vehicle (UAV) hyperspectral imaging system based on acousto-optic tunable filtering (AOTF).
Remotesensing 17 03413 g003
Figure 4. Air–ground collaborative calibration unmanned aerial vehicle for water quality monitoring.
Remotesensing 17 03413 g004
Figure 5. Schematic diagram illustrating sunlight interaction with a water body.
Remotesensing 17 03413 g005
Figure 6. Schematic diagram of water-leaving reflectance measurement at a ground control point near the water end.
Remotesensing 17 03413 g006
Figure 7. Schematic diagram illustrating the method for obtaining ground object reflectance using UAV-based remote sensing.
Remotesensing 17 03413 g007
Figure 8. Mapping conversion between the water surface reflectance obtained by the UAV and near-water end water-leaving reflectance using a fully connected neural network model based on TensorFlow Keras, thereby obtaining the water-leaving reflectance. (a) The curves of different colors represent the water-leaving reflectance of ground control points at the near-water end; (b) It represents the Keras-based fully connected neural network; (c) The curves of different colors represent the reflectance of ground control points obtained from the UAV; (d) The red curves represent the true value of water-leaving reflectance, and the blue curves represent the value obtained after conversion.
Remotesensing 17 03413 g008
Figure 9. Comparison of control point water-leaving reflectance obtained using four methods. The red curve represents the measured water-leaving reflectance value (true value) at a point close to the ground using the method described in Section 2.3. The blue curve represents the converted water-leaving reflectance curve [29,30,31,32].
Remotesensing 17 03413 g009
Figure 10. Distribution of correlation coefficient between turbidity concentration and reflectance: (a) distribution of the exponential correlation coefficients between turbidity and dual-band reflectance difference; (b) distribution of correlation coefficients between turbidity and dual-band reflectance ratio index; (c) normalization of the correlation coefficient distribution between turbidity and dual-band reflectance; (d) distribution of the correlation coefficients between turbidity and reflectance in the three-band index.
Remotesensing 17 03413 g010
Figure 11. Distribution of correlation coefficients between color concentration and reflectance: (a) distribution of the exponential correlation coefficients between color and dual-band reflectance difference; (b) distribution of correlation coefficients between color and dual-band reflectance ratio index; (c) normalization of the correlation coefficient distribution between color and dual-band reflectance; (d) distribution of correlation coefficients between color and reflectance indices in three bands.
Remotesensing 17 03413 g011
Figure 12. Distribution of correlation coefficients between total nitrogen concentration and reflectance: (a) distribution of the exponential correlation coefficients between total nitrogen and the difference in dual-band reflectance; (b) the distribution of the exponential correlation coefficients between total nitrogen and dual-band reflectance ratio; (c) normalization of the correlation coefficient distribution between total nitrogen and dual-band reflectance; (d) distribution of correlation coefficients between total nitrogen and reflectance in the triple-band index.
Remotesensing 17 03413 g012
Figure 13. Distribution of correlation coefficients between total phosphorus concentration and reflectance: (a) distribution of the exponential correlation coefficients between total phosphorus and the difference in dual-band reflectance; (b) distribution of the index correlation coefficients between total phosphorus and dual-band reflectance ratio; (c) distribution of normalized correlation coefficients between total phosphorus and dual-band reflectance; (d) distribution of correlation coefficients between total phosphorus and reflectance in the triple-band index.
Remotesensing 17 03413 g013
Figure 14. Spatial distribution of the four water quality parameters (turbidity, color, total nitrogen, and total phosphorus) at the Guojiaba test site.
Remotesensing 17 03413 g014
Figure 15. Spatial distribution of the four water quality parameters ((a) turbidity, (b) color, (c) total nitrogen, and (d) total phosphorus) at the Poyang Lake experimental site.
Remotesensing 17 03413 g015
Table 1. Main technical parameters of the AOTF-based UAV hyperspectral imaging system.
Technical ParametersDetailsTechnical ParametersDetails
Spectral range400–1000 nmFlight time≤30 min
Spectral resolution8 nm @ 625 nmFlight speed≤50 km/h
Focal length12 mmFlight altitude≤500 m
ApertureF2.8–F16.0Data capacity200 GB
Pixel size4.8 × 4.8 µmMounting weight≤7.5 kg
Resolution600 × 2048Transmission distance≤3.5 km
Table 2. Comparison of spectral angles between 10 pairs of water-free reflectance calculated by the four methods.
Direct Substitution Method [29,30]Linear Transformation Method [31,32]Our Method 1Our Method 2
10.50060.19760.07410.0444
20.33080.15670.22130.0915
30.51340.25810.10660.1175
40.51770.25260.09530.0841
50.52680.15290.13300.0716
60.73360.45820.15970.0644
70.60720.28470.10600.0361
80.55320.28990.10850.1379
90.57400.24520.09550.1768
100.57530.30290.18160.2453
Mean0.54330.25990.12820.1070
Table 3. Monitoring model and evaluation of water quality parameters (turbidity).
Water Quality ParametersModeling
Method
Independent
Variables
Mathematical
Model
Train SetTest SetRMSERPD
R2R2
TurbidityDIb787 − b774y = −4237.43x − 67.000.380.4418.891.47
RIb768/b774y = −120.30x + 161.960.970.926.844.07
NDI(b768 − b774)/(b768 + b774)y = −239.74x + 37.260.970.946.524.26
TBI(b768/b774) − (b768/b758)y = 106.23x − 213.710.950.926.764.11
Table 4. Monitoring model and evaluation of water quality parameters (color).
Water Quality ParametersModeling
Method
Independent
Variables
Mathematical
Model
Train SetTest SetRMSERPD
R2R2
ColorDIb613 − b623y = 11254.15x + 51.310.930.9332.214.30
RIb683/b718y = 655.70x − 589.210.970.8647.052.94
NDI(b683 − b713)/(b683 + b713)y = 1565.60x + 69.060.970.8744.413.12
TBI(b819/b774) − (b819/b840)y =−549.65x + 1316.470.690.5386.431.60
Table 5. Monitoring model and evaluation of water quality parameters (total nitrogen).
Water Quality ParametersModeling
Method
Independent
Variables
Mathematical
Model
Train SetTest SetRMSERPD
R2R2
Total
nitrogen
DIb844 − b855y = −76.66x + 2.150.690.490.4331.22
RIb517/b548y = 2.62x − 0.070.870.770.271.91
NDI(b517 − b548)/(b517 + b548)y = 4.31x + 2.530.850.810.281.86
TBI(b661/b639) − (b661/b548)y = 1.46x − 0.200.860.880.262.06
Table 6. Monitoring model and evaluation of water quality parameters (total phosphorus).
Water Quality ParametersModeling
Method
Independent
Variables
Mathematical
Model
Train SetTest SetRMSERPD
R2R2
Total
phosphorus
DIb819 − b824y = 4.03x + 0.120.750.820.022.61
RIb542/b527y = 0.32x − 0.270.780.850.022.71
NDI(b542 − b527)/(b542 + b527)y = 0.71x + 0.050.780.810.022.50
TBI(b558/b588) − (b558/b527)y = 0.16x − 0.230.690.530.031.60
Table 7. Measured statistical values of water quality parameters at the Three Gorges test site.
Water Quality ParametersTurbidity/
(NTU)
Color/
(PCU)
TN/
(mg·L−1)
TP/
(mg·L−1)
Minimum1.418.850.490.01
Maximum41.4048.662.170.07
Mean7.2823.611.810.05
STD6.6810.640.320.01
C.V.0.920.450.180.29
Table 8. Measured statistical values of water quality parameters at the Poyang Lake experimental site.
Water Quality ParametersTurbidity/
(NTU)
Color/
(PCU)
TN/
(mg·L−1)
TP/
(mg·L−1)
Minimum5.6930.960.700.05
Maximum144.0079.631.810.15
Mean44.1553.311.310.07
STD27.2811.700.240.02
C.V.0.620.220.190.29
Disclaimer/Publisher’s Note: The statements, opinions and data contained in all publications are solely those of the individual author(s) and contributor(s) and not of MDPI and/or the editor(s). MDPI and/or the editor(s) disclaim responsibility for any injury to people or property resulting from any ideas, methods, instructions or products referred to in the content.