Highlights
This study develops an innovative color nighttime light remote sensing approach and applies it to systematically quantify the spatiotemporal coupling relationship and underlying mechanisms between urban form and carbon emissions in a major Chinese metropolis.
What are the main findings?
- A high-resolution color nighttime light remote sensing imagery (color-NLRSI) dataset was generated using an NSCT-IHS dual-transform fusion method, significantly improving the accuracy of built-up area extraction and spatial delineation compared to traditional NPP-VIIRS data.
- Applied to Guangzhou, this method revealed that urban spatial expansion is the dominant influencing factor of carbon emissions, with a standardized influence coefficient of 22.43%, substantially higher than those of economic development (10.34%) and urbanization rate (14.91%).
What is the implication of the main finding?
- The color-NLRSI dataset and the integrated technical framework provide a reliable, high-resolution foundation for accurately monitoring carbon emissions and urban dynamics, enabling fine-grained environmental governance and low-carbon spatial planning.
- The integration of color nighttime light data with spatiotemporal modeling reveals a distinct “core-periphery” heterogeneity in urban development-carbon emission relationships, highlighting the need for region-specific policies to mitigate carbon lock-in and promote sustainable transformation.
Abstract
This study addresses the limitations of traditional nighttime light remote sensing data in ground object feature recognition and carbon emission monitoring by proposing a fusion framework based on Nonsubsampled Contourlet Transform (NSCT) and Intensity-Hue-Saturation (IHS). This framework successfully generates a high-resolution color nighttime light remote sensing imagery (color-NLRSI) dataset. Focusing on Guangzhou, an important city in the Guangdong-Hong Kong-Macao Greater Bay Area, the study systematically analyzes the spatiotemporal coupling mechanism between urban form evolution and carbon footprint by integrating multiple remote sensing data sources and socio-economic statistical information. Key findings include: (i) The color-NLRSI dataset outperforms traditional NPP-VIIRS data in built-up area extraction, providing more accurate spatial information by refining urban boundary recognition logic. (ii) Spatial correlation analysis reveals a remarkably strong positive relationship between built-up area expansion and carbon emissions, with the correlation coefficient for numerous districts exceeding 0.9. High-density built-up areas are strongly associated with a carbon lock-in effect, hindering low-carbon transformation efficiency. (iii) Geographically Weighted Regression analysis demonstrates that in population-polarized regions, the impact coefficient of built-up area expansion on carbon emissions is notably high at 0.961. This factor’s association (22.43%) surpasses economic development (10.34%) and urbanization rate (14.91%). The established “data fusion—dynamic monitoring—mechanism analysis” technical system, which generates a novel high-resolution color-NLRSI dataset and reveals a distinct ‘core-periphery’ heterogeneity pattern in Guangzhou, demonstrating that urban expansion is the dominant driver of carbon emissions. This approach offers a scientific basis for tailored urban low-carbon development strategies, spatial optimization, and enhanced precision in carbon emission monitoring.
1. Introduction
Urbanization, a pivotal issue for global sustainable development in the 21st century, is rapidly transforming the spatial configuration of human civilization [1]. China, as the world’s most populous developing nation, has undergone rapid urbanization in the past two decades, marked by significant spatial and functional urban changes [2]. While urbanization has spurred regional economic growth and social well-being, unchecked expansion often results in inefficient sprawl, longer commutes, and fragmented ecological spaces, exacerbating the “carbon lock-in” effect and diminishing carbon emission efficiency [3,4,5]. Urban carbon emissions, the primary source of greenhouse gases, not only drive changes in the global climate system but also form a complex feedback loop with urban development models, energy policies, and technological innovation, making them a central focus in sustainable development research [6,7].
Accurate quantification of urban carbon emissions is essential for understanding their drivers and developing reduction policies. Traditional estimation methods include “top-down” approaches based on energy statistics, “bottom-up” approaches using activity data, and hybrid methods combining both [8,9,10]. However, at finer scales like the county level, these methods often suffer from significant accuracy issues due to incomplete or missing statistical data [11]. The advent of satellite nighttime light remote sensing data (e.g., DMSP-OLS and NPP-VIIRS NTL) offers a valuable solution, providing large-scale, periodic observations to address data deficiencies in certain regions [12,13,14,15,16,17,18,19].
However, the inherent single-band (black-and-white) nature of nighttime light data constrains its applicability in research domains that demand higher accuracy, particularly in distinguishing diverse functional zones within urban areas and characterizing the urban form in fine detail. To overcome this limitation, enhancing the temporal-spatial and spectral resolutions of nighttime light data has emerged as a research frontier. Li et al. leveraged unmanned aerial vehicle (UAV) technology to dynamically monitor urban nighttime lights, thereby substantially improving the spatial resolution [20]. Lu et al. introduced a dual multi-source remote sensing imagery fusion strategy [21], successfully generated high-resolution, spectrally-rich color nighttime light (Color-NTL) imagery. This provides a more accurate and comprehensive data foundation for estimating carbon emissions at the county level and finer scales, as well as for the precise delineation of urban built-up areas. The core of this fusion technology lies in combining high-resolution panchromatic (PAN) and multispectral (MS) imagery. Various fusion methods exist, including principal component analysis (PCA), IHS transformation, high-pass filtering (HPF), and wavelet transform (WT) [22,23,24]. However, a significant challenge in enhancing spatial resolution is preserving the integrity and authenticity of MS imagery spectral information, avoiding distortion. Zhang et al. addressed this by introducing the L1-TV (total variation) constraint and developing an improved GIHS-TV framework for pansharpening, which effectively reduces spectral distortion during fusion [25]. Ma et al. proposed a method combining PCA and NSCT to facilitate the bidirectional transfer of spatial details from high-resolution PAN imagery and rich spectral information from MS imagery, thereby enhancing fusion quality [26]. These advancements support the generation of more reliable Color-NTL data.
Based on the analysis of current research, this study focuses on the limitations of traditional black-and-white nighttime light (NTL) data in accurately capturing urban form and its connection to carbon emissions due to their spectral information deficiency. In contrast, the emerging technology of color nighttime light remote sensing (Color-NTL) offers a new data source with high spatial and spectral resolutions, enabling a more detailed analysis of the relationship between urban spatial structure and carbon emissions. This study employs a dual-transform imagery fusion technique that combines NSCT and IHS to produce high-quality Color-NTL imagery. This study aims to enhance the accuracy of estimating urban carbon emissions at the county level by addressing the limitations associated with traditional statistical data deficiencies and the lack of detailed spectral information from single Nighttime Light (NTL) imagery. It seeks to improve the identification and characterization of urban built-up areas, including their structure, density, and distribution of functional zones, with enhanced precision using Color-NTL data. Additionally, the study aims to differentiate between various types of urban land use by leveraging the detailed spectral information provided by Color-NTL. Furthermore, the research intends to investigate the spatiotemporal relationship and coordination between urban form (identified through Color-NTL data) and carbon emissions. It also aims to quantitatively analyze the influence of different urbanization patterns (e.g., sprawling and intensive modes) on carbon emissions by revealing their impact pathways and intensities.
2. Research Data and Methods
The systematic technical route of this study, as shown in Figure 1, mainly consists of the following four parts: First, high-resolution color nightlight remote sensing imagery (Color-NLRSI) are generated based on the NSCT-IHS dual-transform fusion algorithm, covering key steps such as imagery preprocessing, IHS forward transform, histogram matching, NSCT multi-scale decomposition, fusion of high and low frequency components, and inverse transform reconstruction; Second, the scope of built-up areas is extracted using the fusion results, and urbanized areas are identified by combining the stable threshold of nighttime light brightness to conduct spatiotemporal dynamic analysis of built-up areas; Third, a fixed-effect variable-slope panel model is constructed, and regional carbon emissions are estimated based on color nightlight data to reveal their spatiotemporal evolution characteristics; Finally, methods such as Pearson correlation analysis, spatiotemporal comparison, and multiple linear regression are comprehensively applied, combined with the Geographically and Temporally Weighted Regression (GTWR) model, to empirically test the coupling mechanism between built-up area expansion and carbon emissions. The overall technical route is logically clear with multi-method collaboration, aiming to systematically reveal the spatiotemporal coupling relationship between urban form and carbon footprint.
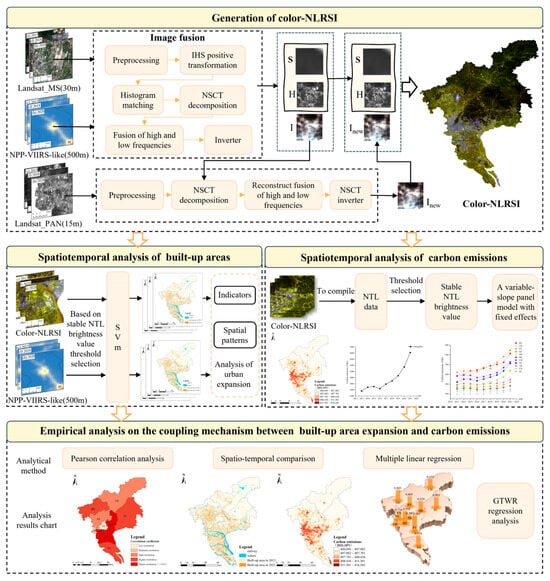
Figure 1.
Overall research technology roadmap.
2.1. Overview of the Study Area
The study area is located in Guangzhou, Guangdong Province, China. As a central city in the Pearl River Delta in southern China, Guangzhou faces Hong Kong and Macao across the sea and is adjacent to the Pearl River Delta of Guangdong Province. It enjoys a superior geographical location and holds a significant position in port trade. It lies between 112°57′E and 114°3′E in longitude, and 22°26′N and 23°56′N in latitude, with a total area of approximately 7434.4 square kilometers. In recent years, the rapid development of Guangzhou has facilitated the exploration of the coupling and coordination mechanism between nighttime light and carbon emissions, as well as the intrinsic relationship between urban expansion and carbon emissions. The specific overview map is shown in Figure 2 below.
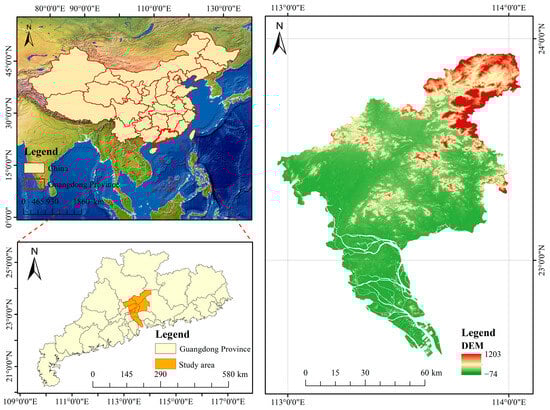
Figure 2.
Location Map of the Study Area in Guangzhou. (a) shows the geographical location of Guangdong Province in China; (b) shows the geographical location of Guangzhou in Guangdong Province; (c) shows the elevation map of Guangzhou.
2.2. Data Preprocessing
The primary datasets utilized in the study are as follows:
- (i)
- Landsat-8 OLI_TIRS dataset, sourced from the Geospatial Data Cloud Platform of the Computer Network Information Center at the Chinese Academy of Sciences (http://www.gscloud.cn) (accessed on 2 January 2025). Panchromatic images with a spatial resolution of 15 m and MS images with a spatial resolution of 30 m in the Guangzhou area spanning from 2013 to 2021 were chosen.
- (ii)
- NPP/VIIRS-like nighttime light remote sensing imagery dataset, obtained from the collaborative research efforts of Yu Bailang’s team and Chen Zuoqi’s team [27], consolidated and made available by the Yangtze River Delta Sub-center of the National Earth System Science Data Center (National Earth System Science Data Center (https://www.geodata.cn/) (accessed on 2 January 2025). With a spatial resolution of 500 m, NPP-VIIRS-like image data of the Guangzhou area from 2013 to 2021 were selected.
- (iii)
- Other statistical data were obtained from the Guangzhou Statistical Yearbook of the Guangzhou Municipal Bureau of Statistics (https://tjj.gz.gov.cn/) (accessed on 6 February 2025). Data on population, economic development, etc., of Guangzhou from 2013 to 2021 were selected.
Preprocessing steps, such as imagery reprojection, resampling, cloud removal, and region of interest (ROI) extraction, were carried out on the images of each dataset to enhance the quality of color nighttime light remote sensing imagery. Specifically, atmospheric correction was applied to Landsat MS images, radiometric calibration was conducted on Landsat PAN images, and resampling was implemented on NPP/VIIRS-like nighttime light remote sensing images. The preprocessing outcomes of the datasets are illustrated in Figure 3, Figure 4 and Figure 5.
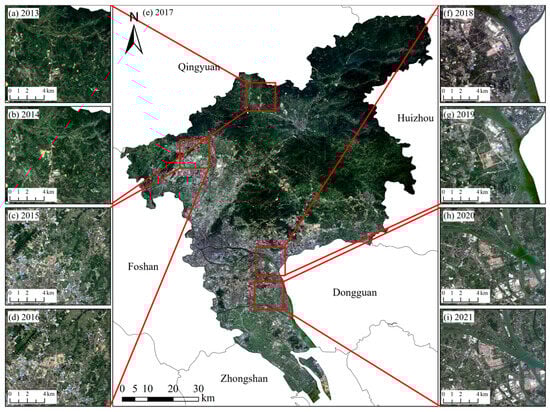
Figure 3.
Preprocessing results of the Landsat MS dataset in Guangzhou. Subfigures (a–d,f–i) show partial preprocessing results for the years 2013, 2014, 2015, 2016, 2018, 2019, 2020, and 2021, respectively; subfigure (e) displays the complete preprocessing result for the year 2017.
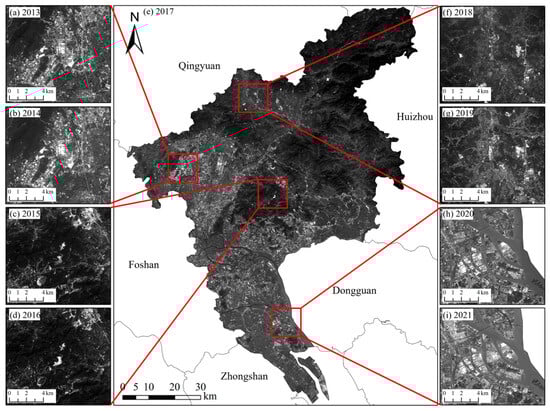
Figure 4.
Preprocessing results of the Landsat PAN dataset in Guangzhou. Subfigures (a–d,f–i) show partial preprocessing results for the years 2013, 2014, 2015, 2016, 2018, 2019, 2020, and 2021, respectively; subfigure (e) displays the complete preprocessing result for the year 2017.
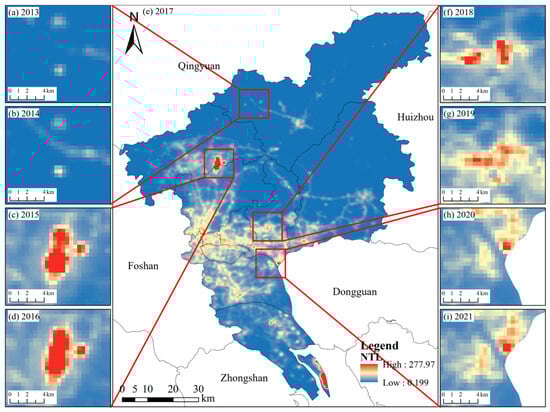
Figure 5.
Preprocessing results of “NPP-VIIRS-like” NLRSI dataset in Guangzhou. Subfigures (a–d,f–i) show partial preprocessing results for the years 2013, 2014, 2015, 2016, 2018, 2019, 2020, and 2021, respectively; subfigure (e) displays the complete preprocessing result for the year 2017.
2.3. Color Nighttime Light Remote Sensing Imagery Fusion Method Based on NSCT-IHS Dual Transform
This study utilizes a dual-transform fusion algorithm that integrates the Nonsubsampled Contourlet Transform (NSCT) and IHS color space transformation to enhance the spatial resolution and maintain spectral fidelity in fused imagery of MS and PAN data.
The traditional IHS fusion method can effectively retain the spatial details of PAN imagery, but it is prone to causing spectral distortion of the original MS imagery, which affects the accuracy of surface feature recognition and quantitative analysis in the study area. As an improved algorithm of Contourlet Transform (CT), NSCT solves the problem of translation sensitivity by eliminating downsampling operations and can decompose and reconstruct the spectral information of imagery more accurately. Introducing NSCT into the fusion process and performing directional fusion processing on the decomposed high-frequency sub-bands can significantly improve the extraction accuracy of spectral and geometric features of the original imagery, effectively suppress spectral distortion, and fully retain the advantage of high spatial resolution, providing a better technical path for generating high-quality fused imagery. The implementation of the specific imagery fusion algorithm is as follows:
- (i)
- Imagery preprocessing. Perform precise spatial registration on Landsat MS imagery (30 m) and Landsat PAN imagery (15 m). By selecting control points on the MS imagery and aligning them with the reference coordinates of the PAN imagery, ensure that their spatial positions, sizes, and directions are consistent. In view of the significant resolution difference between Landsat data and nighttime light remote sensing imagery (NLRSI, 500 m), resample both to a uniform resolution (40 m × 40 m) to ensure the spatial scale consistency of multi-source data.
- (ii)
- IHS transformation. Based on the principle of IHS transformation, convert the RGB color space of MS remote sensing imagery to the IHS color space [21,22,23]. The transformation Formulas (1) and (2) are as follows:
Hue and saturation can be calculated from the following Formula (3):
In the Formulas (1)–(3), and represent intermediate variables of the transformation.
- (iii)
- Histogram Matching. Perform histogram matching between the intensity component (I) obtained after IHS transformation and the PAN imagery with richer spatial details to optimize their statistical characteristics.
- (iv)
- NSCT Decomposition. Perform NSCT decomposition on the PAN imagery and the I component after histogram matching processing, respectively. This process decomposes the imagery into one low-frequency approximate component and multi-scale, multi-directional high-frequency sub-bands, facilitating the separation of different frequency components for key information extraction.
- (v)
- High-Frequency and Low-Frequency Fusion. The contours of imagery are often affected by the dominant energy information in low-frequency components. To ensure high-quality visual effects, it is necessary to select appropriate low-frequency sub-band coefficients. Based on the weight selection rule of regional energy, the system automatically identifies and selects regions with higher energy, and assigns optimal weights to these regions. This effectively enables the fused imagery to retain and highlight the features of high-resolution imagery, thereby improving the overall quality of the imagery. Assuming that the low-frequency components obtained after transforming the I components of the two images are IA and IB respectively, the fused low-frequency component IL is as follows [26]:
In the Formula (4), and represent the weight coefficients corresponding to the respective pixels, and their expressions are:
In the Formula (5), .
During the high-frequency fusion step, high-frequency components were derived separately for each year to capture temporal changes in urban illumination. SSIM analysis confirmed spatial consistency of small-scale features (SSIM > 0.89), ensuring valid interannual comparisons. The sum of the gradient changes in 8 directions between the high-frequency coefficient and its adjacent coefficients is taken as the selected threshold. This makes the contrast of a certain region in the source imagery more obvious and also combines the correlation between the central pixel and the surrounding pixels of the imagery as much as possible. Assume that the high-frequency coefficients of different levels and different angles of the fused remote sensing imagery are (that is, the high-frequency sub-band of the i-th level and k-th angle obtained by NSCT decomposition), then:
In the Formula (6), is obtained from Formula (7):
- (vi)
- IHS Inverse Transformation. Perform NSCT inverse transformation on the fused low-frequency components and the high-frequency coefficients selected according to the rules to reconstruct a new intensity component Inew. Then, perform the IHS inverse transformation Inew together with the original hue (H) and saturation (S) components, and finally generate the fused color nighttime light remote sensing imagery [21].
- (vii)
- (vii) Integration of Nighttime Light Data: The high-resolution intensity component (Inew) obtained from the inverse NSCT is replaced by the histogram-matched NPP-VIIRS-like nighttime light data. A final inverse IHS transformation is then applied to this modified intensity component (INTL), the hue (H), and saturation (S) components to generate the fused color nighttime light remote sensing imagery (Color-NTL). In the resulting RGB composite, the spectral information is derived from the MS bands, while the luminance is driven by the NTL data, which is primarily rendered in the blue channel.
In conclusion, the process of the color nighttime light remote sensing images of Guangzhou from 2013 to 2021 generated based on this method is shown in Figure 6.
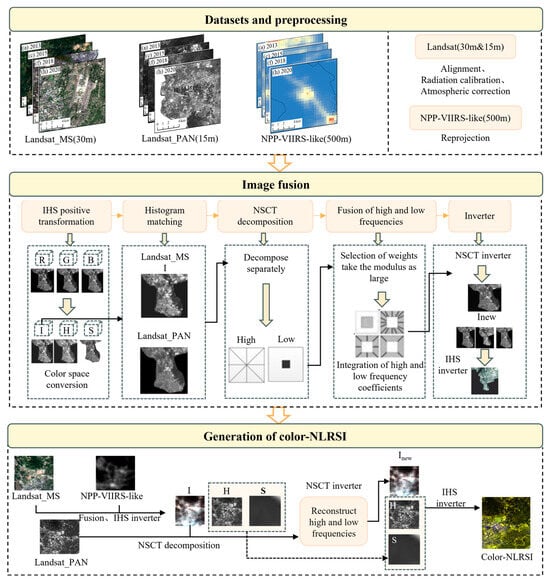
Figure 6.
Generation of color-NLRSI via NSCT-IHS dual-transformation fusion.
To examine the spatiotemporal evolution of nighttime lights in Guangzhou and assess the representational quality of color nighttime light remote sensing images (Color-NTL), the year 2017 is chosen as a midpoint reference. A comparative approach is employed using biennial intervals (i.e., 2013 vs. 2015, 2015 vs. 2017, …, 2019 vs. 2021). The analysis primarily focuses on two key aspects:
- (i)
- Temporal analysis of Color-NTL imagery in specific regions: An investigation into temporal changes in Color-NTL imagery details across typical local regions, including urban centers, emerging development zones, and urban-rural fringes.
- (ii)
- Detailed comparison between Color-NTL and “NPP-VIIRS-like” nighttime light images: In the same specific region, compare the detailed presentation capabilities of Color-NTL images with the corresponding years’ “NPP-VIIRS-like” nighttime light images.
Figure 7 presents the results of the temporal comparison of Guangzhou from 2013 to 2021, clearly revealing the following key findings:
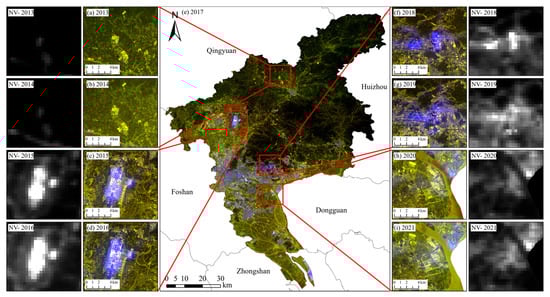
Figure 7.
Annual comparison charts of color nocturnal remote sensing images of Guangzhou and comparison with “NPP-VIIRS-like” nighttime light images. Subfigures (a–d,f–i) show partial results for the years 2013, 2014, 2015, 2016, 2018, 2019, 2020, and 2021, respectively; subfigure (e) displays the complete result for the year 2017.
- (i)
- Continuous Enhancement of Nighttime Lights: Throughout the entire study period, the nighttime light index of Guangzhou shows a significant year-by-year upward trend, intuitively reflecting the situation of urban expansion and the growth of economic activities.
- (ii)
- Distinct Advantages of Color-NTL Imagery. In terms of spatial clarity, compared with the “NPP-VIIRS-like” nighttime light imagery, Color-NTL imagery has obvious advantages in spatial clarity, and the feature information, such as the internal road networks and building outlines of the city, has higher recognizability. In terms of detail presentation capability, Color-NTL imagery is more prominent in detail performance, and can more precisely depict the differences in light intensity and spectral characteristics of different functional areas (such as commercial areas, residential areas, and industrial areas) within the city, as well as the dynamic changes of small-scale urban structures.
3. Experimental Analysis
3.1. Spatiotemporal Analysis of Urban Built-Up Areas Based on Color Nighttime Light Remote Sensing Imagery
Candidate built-up pixels identified via NTL thresholding were refined using a Support Vector Machine (SVM) classifier trained on spectral (Hue, Saturation), spatial (GLCM texture), and topological features. Post-classification morphological operations eliminated residual noise, yielding final urban boundaries—a method that successfully extracted Guangzhou’s built-up areas with high spatiotemporal consistency across all 11 districts annually from 2013 to 2021.
To quantitatively evaluate the performance of the fused color nighttime light (Color-NTL) imagery in built-up area extraction, the accuracy assessment was conducted against a validation dataset derived from high-resolution Google Earth imagery and official urban planning maps. Four widely adopted metrics—Overall Accuracy (OA), Kappa Coefficient (KC), Product Accuracy (PA), and User Accuracy (UA)—were calculated for the classification results obtained from both the Color-NTL data and the traditional NPP-VIIRS-like data.
Overall Accuracy (OA) is defined as the ratio of the number of correctly classified pixels to the total number of pixels in the validation set. Formula (8) for OA:
Kappa Coefficient (KC) is a statistical measure that evaluates the agreement between the classification result and the reference data, accounting for the possibility of agreement by chance. It provides a robust assessment of the overall extraction accuracy beyond simple percent agreement. Formula (9) for KC:
Product Accuracy (PA) refers to the probability that a pixel belonging to the built-up area category is correctly identified, reflecting the omission error from the perspective of the ground truth. Formula (10) for PA:
User Accuracy (UA) indicates the probability that a pixel classified as a built-up area truly represents that category on the ground. Formula (11) for UA:
In the Formulas (8)–(11), k represents the number of classes, represents the number of correctly classified pixels belonging to class i, N represents the total number of validation pixels, represents the total number of reference observations, represents the total number of observations classified.
The results, summarized in Table 1, demonstrate the superior capability of the proposed Color-NTL dataset. The classification based on Color-NTL data achieved an OA of 0.947 and a KC of 0.89, significantly outperforming the results from the NPP-VIIRS-like data (OA = 0.812, KC = 0.62). More importantly, for the built-up area class itself, the Color-NTL data yielded a PA (measure of omission error) of 0.925 and a UA (measure of commission error) of 0.918, compared to the notably lower PA (0.783) and UA (0.746) achieved using the NPP-VIIRS-like data. This comprehensive evaluation confirms that the enhanced spatial and spectral detail in the Color-NTL imagery leads to a substantial improvement in the precision of urban boundary delineation and a significant reduction in both missed detections and false alarms during built-up area extraction.

Table 1.
Accuracy Assessment of Built-up Area Extraction.
From 2013 to 2021, the built-up areas of Guangzhou showed a significant expansion trend (as shown in Figure 8). To clearly display the spatiotemporal pattern of expansion, the extraction results of built-up areas in 2013, 2015, 2017, 2019, and 2021 were selected for full-region and local visualization, and the proportion of the expansion area of each district to the total expansion area of the city was calculated [28,29]. The analysis shows that Nansha District made the largest contribution (21.34%) and was the area with the highest expansion intensity; Yuexiu District made the smallest contribution (0.27%) and had the lowest expansion intensity.
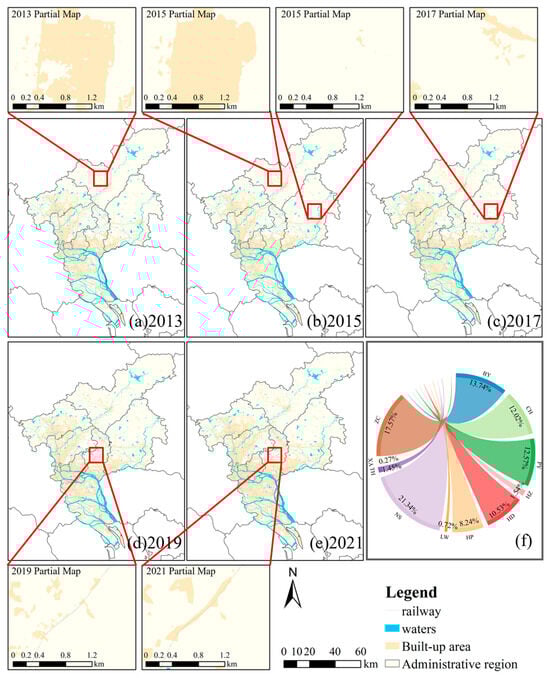
Figure 8.
Full-region and local displays of built-up areas in Guangzhou from 2013 to 2021 (a–e) and a chord diagram of the expansion proportion of each district (f).
To quantitatively characterize the spatiotemporal change characteristics of built-up areas, this study constructs a comprehensive index system including expansion speed, expansion intensity, and expansion dynamic degree (Formulas (12)–(14)). Expansion speed reflects the annual average increment of built-up area and indicates the rate of spatial expansion; expansion intensity represents the proportion of built-up area increment to the total regional land area, reflecting the relative scale of expansion; expansion dynamic degree calculates the net change rate of built-up area and evaluates the expansion activity and development trend. The collaborative analysis of the three can reveal the spatiotemporal heterogeneity of expansion patterns, providing a basis for evaluating the rationality of growth and formulating zonal regulation policies. The specific calculation formulas are as follows:
Formula (12) for calculating expansion speed:
Formula (13) for calculating expansion intensity:
Formula (14) for calculating the expansion dynamic degree:
In the Formulas (12)–(14), represents the expansion speed of the city within the research time period t; represents the expansion intensity of the city within the research time period t; represents the expansion dynamic degree of the city within the research time period t; S represents the total land area of the study area; T represents the interval of the research time period; and represent the areas of the urban built-up areas at the initial and end stages of the research time period, respectively.
Based on the area data of built-up areas in each district of Guangzhou from 2013 to 2021, it can be seen that: In terms of expansion speed, from 2013 to 2021, the built-up areas of Nansha District and Zengcheng District expanded the fastest, with expansion speeds reaching 18.57 km2/year and 18.85 km2/year, respectively. The expansion speeds of Baiyun District, Conghua District, Panyu District, and Huadu District were all greater than 10 km2/year, and they were generally in the high-speed expansion stage, while Liwan District only had an expansion speed of 0.3 km2/year, belonging to the low-speed expansion stage. In terms of expansion intensity, from 2013 to 2021, the built-up areas of Nansha District and Panyu District had the largest expansion intensities, which were 2.3% and 2.4% respectively. Liwan District and Conghua District had the lowest expansion intensities, only 0.5% and 0.6%. In terms of the expansion dynamic degree, Conghua District was far higher than the other 10 regions, reaching an expansion dynamic degree of 21%, indicating that the built-up area of Conghua District expanded most actively during the research period. In sharp contrast, Liwan District only had an expansion dynamic degree of 0.5%. In conclusion, the built-up areas of Guangzhou from 2013 to 2021 generally showed significantly high-speed expansion characteristics, as shown in Figure 9 below.
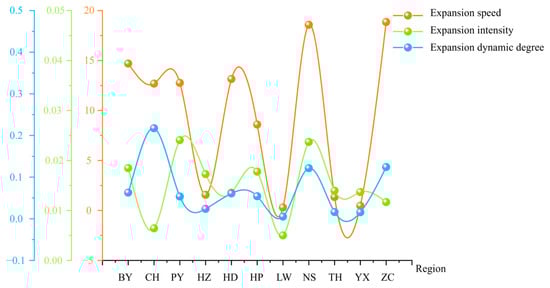
Figure 9.
Expansion speed, expansion intensity, and expansion dynamic degree of built-up areas in various regions of Guangzhou from 2013 to 2021.
3.2. Spatiotemporal Analysis of Urban Carbon Emissions Based on Color Nighttime Light Remote Sensing Imagery
Existing studies have confirmed that nighttime light data (NTL) have a significant correlation with regional carbon emissions and are suitable for carbon emission estimation at the urban scale [30,31,32]. Based on this, this study uses the fused and generated color nighttime light remote sensing imagery (Color-NTL) of Guangzhou, and extracts 1 km × 1 km pixels with stable brightness values greater than the set threshold in the built-up area as effective statistical units to ensure the reliability and stability of the light data [30,31,32].
Given the significant heterogeneity in industrial structure, economic development level, and energy consumption patterns among various districts in Guangzhou, it is difficult to accurately estimate regional carbon emissions using a unified model. To this end, the study constructs a variable-slope panel model with fixed effects (Formula (15)) for district-level carbon emission estimation [33,34]. The advantages of this model lie in: controlling the inherent characteristics of regions that do not change with time (such as geographical environment and historical foundation) through the fixed effect , and simultaneously capturing the dynamic differences in the response of carbon emissions to nighttime light values in different regions through the variable-slope coefficient (reflecting time-sensitive factors such as industrial structure upgrading and policy regulation), so as to more accurately estimate carbon emissions by combining the total nighttime light values of each district from 2013 to 2021. The model is as follows:
In the Formula (15), represents the carbon emissions of the i-th district in the t-th period, represents the fixed effect, represents the variable-slope coefficient, represents the nighttime light value calculated from the color nighttime light data for the i-th district in the t-th period, and represents the random error term.
Based on the model estimation results (Figure 10), the total carbon emissions of the whole city showed a slow growth trend from 2013 to 2021. It is worth noting that there was an overall decline in 2016, which is closely related to the “13th Five-Year Plan for Energy Conservation and Carbon Reduction (2016–2020)” policy launched in Guangzhou during the same period.
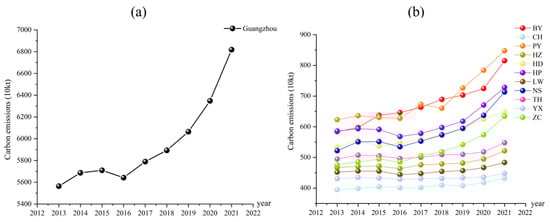
Figure 10.
Temporal Evolution of Total Carbon Emissions in Guangzhou (2013–2021) (a) and Temporal Trends in Carbon Emissions by District and County in Guangzhou (2013–2021) (b).
As shown in Figure 11, the situation of its spatial differentiation is as follows:
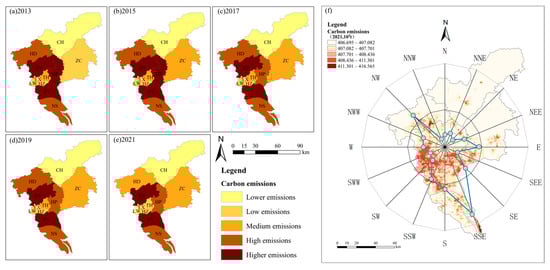
Figure 11.
Comparison of the spatiotemporal distribution and growth patterns of carbon emissions in Guangzhou. Subfigures (a–e) show the spatial distribution of carbon emissions for the years 2013, 2015, 2017, 2019, and 2021, respectively; subfigure (f) presents the wind direction diagram illustrating the directional growth of carbon emissions.
- (i)
- Emission reduction areas: The carbon emissions of Huadu District, Huangpu District, and Tianhe District in 2021 were significantly lower than those in 2013, reflecting the effectiveness of their industrial transformation or energy efficiency improvement.
- (ii)
- High-emission areas: As core industrial agglomeration areas, Baiyun District and Panyu District have continuously maintained high levels of carbon emissions.
- (iii)
- Low-emission areas: Due to the low density of permanent residents, abundant land resources, and limited scale of energy consumption in Conghua District, its carbon emissions have long been at the lowest level in the city; although Yuexiu District is a core urban area, restricted by the narrow geographical space, its overall emissions also remain at a low level.
To further quantify the spatial evolution direction of carbon emissions, the orientation analysis method (taking the geometric center of Guangzhou as the origin and dividing into 16 directions at 22.5° intervals) is used to construct the wind direction diagram of carbon emission growth [35]. The analysis shows (Figure 11):
- (i)
- The growth of carbon emissions from 2013 to 2021 showed significant spatial directionality, mainly concentrating in the NW and SSE directions, which is highly consistent with the industrial-dominated growth of Baiyun District (NW direction) and Panyu District (SSE direction).
- (ii)
- The growth proportion in the N direction was the smallest, confirming the continuous low-carbon status of Conghua District in this direction.
- (iii)
- On the whole, the carbon emission expansion of Guangzhou showed a clear pattern of “Northwest-Southeast axial extension”, which profoundly reflects the core driving role of industrial spatial layout and regional economic growth.
3.3. Construction of a Coupling and Coordination Model Between Nighttime Light and Carbon Emissions
To reveal the interaction mechanism between nighttime light (representing urban development) and carbon emissions (representing environmental pressure), this study constructs a dynamic analysis framework based on coupling coordination degree. This model analyzes the spatiotemporal evolution laws of complex systems by quantifying the interaction intensity (coupling degree C) and coordinated development level (coordination degree D) of the two systems [1,36]. Its scientific value lies in the fact that the coupling degree captures the nonlinear mutual feedback relationship between systems, the coordination degree diagnoses development sustainability, and the spatiotemporal dual dimensions reveal the mechanism of regional differentiation.
Among them, the system coupling degree (C), as a core indicator for measuring the intensity of interaction between systems, achieves quantitative expression through the construction of a symmetric coupling function. Formula (16) for C:
The system coupling degree (C) reflects the degree of nonlinear correlation between the growth rate of the light index and the growth rate of carbon emissions through the ratio relationship between the geometric mean and the arithmetic mean. When the value of C approaches 1, it indicates that there is a highly coupled state between the urban nighttime light and carbon emissions in this region; when the value of C approaches 0, it indicates that the coupling relationship between the urban nighttime light and carbon emissions in this region is relatively weak.
Formula for constructing the coordination index (T):
In the Formula (17), , where and are the weight coefficients of nighttime light and carbon emissions, respectively, determined by the entropy weight method or the analytic hierarchy process, reflecting the relative importance of nighttime light and carbon emissions in the sustainable development of the regional economy.
Calculation formula of coordination degree (D):
In the Formula (18), . The coordination degree (D) comprehensively reflects the benign synergy level in the interaction process between urban nighttime light and carbon emissions in various districts and counties through the geometric mean of the coupling degree C and the coordination index T. The spatiotemporal differentiation characteristics of the coordination degree (D) value can effectively identify the coordinated development stages of urban nighttime light and carbon emissions in various districts and counties, and provide a scientific basis for the formulation of regional low-carbon development policies, as shown in Figure 12.
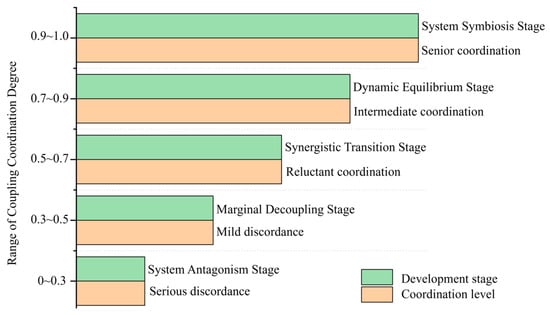
Figure 12.
Classification of Development Stage Levels.
Based on the coupling coordination degree model, this study evaluates the coordination level between the nighttime light index (representing urban development) and carbon emissions in 11 districts of Guangzhou during three stages: 2013–2015, 2016–2018, and 2019–2021 (Figure 13). Figure 13 presents the coupling coordination degree indices of the three stages: 2013–2015, 2016–2018, and 2019–2021. The results show that the coupling coordination degree between the nighttime light index and carbon emissions in various districts and counties of Guangzhou exhibits significant spatiotemporal differentiation characteristics, and its evolution trajectory reveals the complex interaction between urban transformation and upgrading and low-carbon governance.
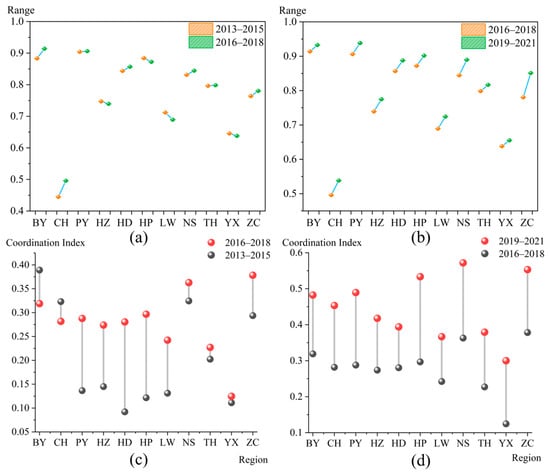
Figure 13.
Comparison chart of changes in the coupling degree index between nighttime light index and carbon emissions in 11 districts and counties of Guangzhou between 2013–2015 and 2016–2018 (a), Comparison chart of changes in the coupling degree index between nighttime light index and carbon emissions in 11 districts and counties of Guangzhou between 2016–2018 and 2019–2021 (b), Comparison chart of changes in the coordination degree index between nighttime light index and carbon emissions in 11 districts and counties of Guangzhou between 2013–2015 and 2016–2018 (c), Comparison chart of changes in the coordination degree index between nighttime light index and carbon emissions in 11 districts and counties of Guangzhou between 2016–2018 and 2019–2021 (d).
Based on the time-series data analysis of the coupling coordination degree between nighttime light and carbon emissions from 2013 to 2021, various districts and counties in Guangzhou show significant spatial differentiation characteristics, which are mainly reflected in the coupling coordination advantages of peripheral regions and the transformation lag of central urban areas.
In terms of coupling and coordination characteristics, Panyu District, Nansha District, and Huangpu District are typical high-coupling and high-coordination regions. The coupling degree of Panyu District has continuously increased from 0.904 in 2013–2015 to 0.938 in 2019–2021, and the coordination degree has significantly risen from 0.137 to 0.489; the coupling degree of Nansha District has grown from 0.831 to 0.889, with the coordination degree surging from 0.324 to 0.572; the coupling degree of Huangpu District has always remained at a high level of 0.884–0.902, and its coordination degree has even soared from 0.122 to 0.533. Baiyun District, Zengcheng District, and Huadu District show the characteristics of high coupling but a medium coordination degree. The coupling degree of Baiyun District has increased from 0.883 to 0.933, and its coordination degree has experienced a fluctuation process, decreasing from 0.389 to 0.319 and then rebounding to 0.482; the coupling degree of Zengcheng District has steadily climbed from 0.764 to 0.851, with the coordination degree rising from 0.294 to 0.553; the coupling degree of Huadu District has grown from 0.843 to 0.888, and its coordination degree has significantly increased from 0.092 to 0.394. Central urban areas generally show medium-high coupling but low coordination. The coupling degree of Tianhe District has increased from 0.796 to 0.817, and its coordination degree has risen from 0.202 to 0.379; the coupling degree of Yuexiu District has slowly increased from 0.645 to 0.655 during the research period, and its coordination degree has also grown from 0.111 to 0.300; the coupling degree of Haizhu District has increased from 0.747 to 0.775, with the coordination degree rising from 0.145 to 0.418; the coupling degree of Liwan District has fluctuated between 0.712 and 0.724, and its coordination degree has increased from 0.131 to 0.367. Conghua District, as a special ecological conservation area in Guangzhou, shows the characteristics of low coupling but a medium coordination degree. Its coupling degree has increased from 0.445 to 0.538, and its coordination degree has risen from 0.323 to 0.453.
The study reveals a significant law of regional differentiation. Among them, peripheral industrial zones/new urban areas (Panyu, Nansha, Huangpu) have achieved high coupling and high coordination relying on industrial upgrading; central urban areas (Tianhe, Yuexiu, etc.) show medium-high coupling but low coordination due to the constraints of spatial carrying capacity; ecological conservation areas (Conghua) have formed a unique low-coupling and medium-coordination model due to low development intensity. This “core-periphery” differentiation pattern profoundly reflects the complex game between economic growth, ecological constraints, and low-carbon governance in the reconstruction of Guangzhou’s urban space.
3.4. Empirical Analysis on the Coupling Mechanism Between Urban Built-Up Area Expansion and Carbon Emissions
The Pearson correlation coefficient can effectively quantify the correlation intensity between urban built-up areas and carbon emissions (such as Formula (19)), providing a basis for analyzing the carbon effect of urban expansion. This coefficient is defined as the ratio of the covariance of two variables to the product of their respective standard deviations, with a value range of [−1, 1]: an absolute value close to 0 indicates a weak correlation, and a value close to 1 or −1 indicates a strong correlation.
Based on Pearson correlation analysis, this study conducted a quantitative test on the correlation between built-up area expansion and carbon emissions in each district of Guangzhou from 2013 to 2021. Figure 14 presents the results of the Pearson correlation analysis between the urban built-up area and carbon emissions in each district. The results show that, except for Tianhe District, the correlation coefficients between built-up area expansion and carbon emissions in all other districts are greater than 0.73. Among them, the correlation coefficients of eight districts (Baiyun District, Conghua District, Panyu District, Haizhu District, Huadu District, Huangpu District, Nansha District, and Zengcheng District) exceed 0.85, indicating a significant positive correlation between the two; that is, built-up area expansion is significantly and positively associated with the growth of carbon emissions. Specifically, the correlation coefficients of Panyu District, Haizhu District, Huangpu District, Nansha District, Huadu District, and Zengcheng District are all higher than 0.9, with a significance level (p-value) of 0.001. This indicates that the impact of built-up area on carbon emissions in the above-mentioned regions is highly significant at the 99% confidence level, and the statistical linkage between urban spatial expansion and carbon emissions is particularly prominent. The correlation coefficients of Conghua District, Baiyun District, Liwan District, and Yuexiu District range from 0.73 to 0.9, maintaining a high positive correlation (p = 0.002). Although their significance is slightly lower than that of the former, they still meet the 99% confidence requirement, confirming that there is also a high correlation between built-up area expansion and carbon emissions in these districts. It is worth noting that the correlation intensity in central urban areas (such as Liwan and Yuexiu) is relatively weaker than that in peripheral areas, which may be related to their high degree of land use intensification and service-oriented industrial structure. The correlation coefficient of Tianhe District is only 0.387, which is significantly lower than the average level. This is mainly due to the fact that the district is dominated by low-carbon emission functions such as business offices and public services, and the proportion of industrial land is low, resulting in a weak correlation between its spatial scale expansion and carbon emission growth. Overall, the spatiotemporal expansion process of built-up areas in Guangzhou shows a significant consistency with the changing trend of carbon emissions. Statistical results confirm that built-up area expansion has a significant positive driving effect on the growth of carbon emissions.
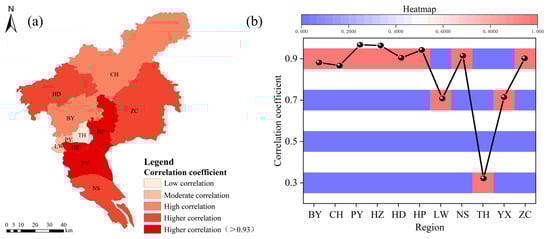
Figure 14.
Distribution Map of Correlation Coefficients between Urban Built-up Areas and Carbon Emissions in Each District of Guangzhou (a), Line Chart and Heat Map of Correlation Coefficients between Urban Built-up Areas and Carbon Emissions in Each District of Guangzhou (b).
Figure 15 intuitively presents the spatial distribution characteristics and evolution trends of built-up area expansion and carbon emissions in each district of Guangzhou from 2013 to 2021 through 3D scatter plots and spatiotemporal comparison analysis. The visualization results show that there is a significant linear distribution relationship between the two in the spatiotemporal dimension. A linear regression model was further used for quantitative analysis of time-series data. The results indicate that there is a significant linear relationship between the spatiotemporal changes of built-up areas and carbon emissions in Guangzhou (p < 0.01), with the regression equation being y = 1.254x + 3579.025 and the coefficient of determination (R2) reaching 0.84. This indicates that during the study period, for each additional 1 square kilometer of built-up area in Guangzhou, carbon emissions increased by an average of approximately 12,540 tons, verifying the long-term driving effect of the spatiotemporal evolution of built-up areas on the growth of carbon emissions. When contextualized against the range of values reported in global studies of cities, this intensity exceeds the typical global average (10,000 tons/km2), highlighting the particular carbon inefficiency of the urban expansion mode in Guangzhou during the study period.
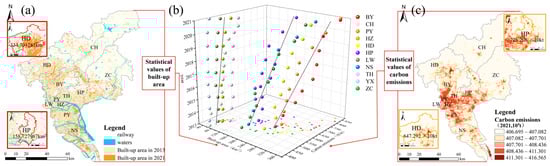
Figure 15.
Comparison Map of Urban Expansion from 2013 to 2021 (a), Comparative Scatter Plot of Linear Regression Analysis between Built-up Areas and Carbon Emissions in Each District (b), and Carbon Emissions Distribution Map in 2021 (c).
Based on the multiple linear regression model, this study conducted a standardized coefficient analysis on the built-up area and carbon emissions of 11 administrative districts in Guangzhou. Combined with the previous comprehensive evaluation of the expansion speed, intensity, and dynamic degree of built-up areas, the regional expansion degree was divided into three levels: high, medium, and low. Figure 16 presents the results of standardized coefficients from the regression analysis between built-up areas and carbon emissions in each district. Panyu District, Nansha District, and Zengcheng District belong to high-expansion areas, with standardized regression coefficients between built-up areas and carbon emissions all greater than 0.9. This indicates that the rapid expansion of urban space has an extremely strong positive driving effect on the growth of carbon emissions. In contrast, Liwan District and Tianhe District are classified as low-expansion areas, with standardized regression coefficients lower than 0.8, indicating that the impact of built-up area expansion on carbon emissions is less significant. The study confirms that there is a significant positive correlation between the expansion degree of urban built-up areas and the response intensity of carbon emissions: high-expansion areas have significantly accelerated energy consumption and carbon emission growth through spatial development models such as infrastructure construction and industrial land expansion; while low-expansion areas have significantly weakened the correlation between built-up area expansion and carbon emissions due to factors such as industrial structure optimization and intensive spatial utilization.
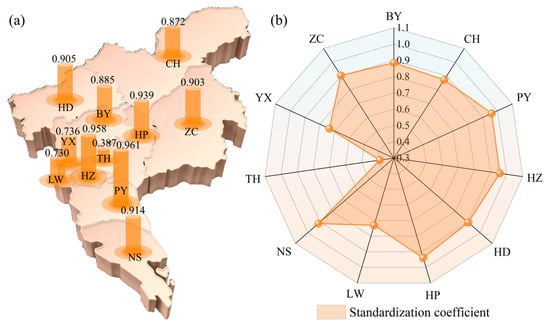
Figure 16.
Visualization Result Map of Standardized Coefficients from Regression Analysis between Built-up Areas and Carbon Emissions in Each District of Guangzhou (a) and Radar Chart of Standardized Coefficients (b).
Given the unbalanced urban scales among various districts in Guangzhou and the significant differences between urban expansion and carbon emissions, this study further explores the heterogeneity of the impact of urban expansion on carbon emissions in regions with different development scales. Based on the registered population data of 11 districts in Guangzhou in 2021, they are divided into three levels: small-scale (registered population < 800,000), medium-scale (800,000 ≤ registered population ≤ 1,100,000), and large-scale (registered population > 1,100,000). The results show that urban expansion in large-scale areas (Baiyun District, Yuexiu District, Panyu District) has a positive impact on carbon emissions, and the impact is significant except in Yuexiu District; Urban expansion in medium-scale areas (Huadu District, Haizhu District, Tianhe District, Zengcheng District) also has a positive impact on carbon emissions, with a significant positive correlation except in Tianhe District; The results for small-scale areas (Huangpu District, Liwan District, Nansha District, Conghua District) are consistent with those of the above-mentioned scale areas, that is, urban expansion has a positive impact on carbon emissions, and the impact is significant except in Liwan District. In general, urban expansion has had a positive impact on regions of different population scales in Guangzhou, but there are differences in the significance of the impact. Specifically, the impact of urban expansion on carbon emissions in small-scale and large-scale areas is greater than that in medium-scale areas, indicating that the positive driving effect of urban expansion on carbon emissions is more significant in regions at both ends of the population scale spectrum. This difference may stem from the agglomeration economy effect in large-scale areas, the extensive expansion mode in small-scale areas, and the transitional characteristics of the development stage of medium-scale areas.
In view of the non-stationary characteristics of built-up area expansion and carbon emissions, there is a cointegration relationship between them. After quantifying the impact of changes in built-up areas on carbon emissions through linear regression, the GTWR model [37,38] is further introduced to analyze the multi-factor action mechanism. Compared with traditional models, GTWR incorporates spatiotemporal non-stationarity simultaneously, significantly improves model fitting degree, reduces specification errors and parameter biases, and more accurately reveals the complex relationship between explanatory variables (built-up area characteristics) and explained variables (carbon emissions) [30].
Given that carbon emissions in Guangzhou exhibit unbalanced spatiotemporal distribution characteristics and that the contributions of different influencing factors to carbon emissions show spatial variability, this study employs the GTWR model to conduct a regression analysis on multiple carbon emission influencing factors in Guangzhou from 2013 to 2021, aiming to reveal the differential contributions of each factor to carbon emissions at different spatiotemporal locations. It should be noted that Population size was used solely for district stratification, not as an independent variable in the GTWR model, to avoid confounding with urbanization rate. Its influence is indirect, mediated via spatial-economic pathways. Before model fitting, the Variance Inflation Factor (VIF) test was used to determine whether there is multicollinearity among the influencing factors. As shown in Table 2, the VIF values of all variables are less than the critical threshold of 10, indicating that there is no significant multicollinearity among the influencing factors. This meets the application prerequisites of the GTWR model and ensures the reliability and validity of the model results.
Table 2.
Model Fitting Results.
It can be seen that the Akaike Information Criterion corrected by the GTWR model (AICC) is 78.229456, and the coefficient of determination (R2) reaches 0.9863, indicating an extremely high spatiotemporal fitting degree between carbon emissions and urban expansion, economic development level (natural logarithm of GDP per capita), rationalization of industrial structure (Theil Index, a sophisticated metric that measures the disparity between the output share and employment share of each sector relative to its productivity.), and urbanization rate. This represents a significant improvement over the conventional STIRPAT model applied to the same dataset, which yielded a substantially lower R2 of 0.824. The considerable increase in explanatory power (R2) provides robust quantitative evidence that the GTWR model significantly enhances the analysis of spatiotemporal heterogeneity by more accurately capturing the locally varying and temporally non-stationary relationships behind the emission drivers. According to the results of standardized coefficients, economic development level, urban expansion, and urbanization rate all show a significant positive driving effect on carbon emissions. Among them, the standardized coefficient of urban expansion is higher than that of economic development level and urbanization rate, reflecting that during the research period, the marginal contribution intensity of urban spatial expansion to carbon emissions is greater, reaching 22.43%, which is much higher than the contribution degree of economic development level (10.34%) and urbanization rate (14.91%). The standardized coefficient of the variable of industrial structure rationalization is negative, indicating that the improvement of industrial structure rationalization has a significant inhibitory effect on carbon emissions. The research results highlight that optimizing the urban industrial structure and promoting the agglomeration development of high-value-added industries can effectively reduce the level of carbon emissions. In contrast, the development model represented by extensive urban expansion, as well as excessively rapid economic growth and urbanization process, will significantly aggravate carbon emissions by increasing infrastructure construction and energy consumption, among other ways.
4. Conclusions and Discussion
4.1. Conclusions
This study elucidates the spatiotemporal coupling between urban expansion and carbon footprint through the integration of NSCT-IHS color nighttime light remote sensing and multi-source data. The principal findings and comparative analyses are as follows:
- (i)
- Color nighttime light data, with its high spatiotemporal resolution, surpasses traditional statistical data and panel models by effectively addressing the issues of lag and coarse spatial granularity found in official data. The GTWR model enhances the analysis of spatiotemporal heterogeneity significantly more than the conventional STIRPAT model.
- (ii)
- Contrary to the “polycentric equilibrium” model of the Yangtze River Delta Urban Agglomeration, Guangzhou demonstrates a polarized “core stagnation-peripheral leap” pattern. Historical protection constraints have slowed growth in the Yuexiu District, underscoring the tension between cultural heritage preservation and low-carbon development. This situation reveals that the marginal carbon emission intensity of Guangzhou’s urban expansion exceeds the global city average. Furthermore, regions with extreme population sizes exhibit a stronger driving effect, supporting the theory of “emission peaks in medium-sized cities.”
- (iii)
- The study elucidates a three-tier transmission pathway of the “expansion-heat island-high emission” cycle, offering a more comprehensive perspective than prior studies focused on singular paths. Peripheral regions should limit industrial land expansion, while central urban areas must overcome spatial lock-in effects, exemplified by the low-carbon service industry model in Tianhe District. This approach contrasts with the conventional “whole-region emission reduction” policy framework.
4.2. Discussion
This study integrates high-resolution nighttime light remote sensing with multi-source data to develop a “light-carbon emission” coupling analysis framework. Unlike traditional carbon emission studies that depend on statistical yearbooks, this approach refines the spatial analysis unit from district and county levels to a 1 km grid scale. It enables dynamic, synchronous monitoring of built-up area expansion and carbon emission changes, addressing the core bottleneck of insufficient spatiotemporal resolution in traditional data. Key findings indicate that:
- (i)
- Urban expansion markedly influences carbon emissions, with highly expanded areas exhibiting standardized coefficients exceeding 0.9, compared to less expanded areas with coefficients below 0.8. This effect stems from construction land encroaching on carbon sinks, industrial agglomeration hindering energy structure optimization, and the perpetuation of the “expansion-heat island-high emission” cycle.
- (ii)
- The evolution of coordination degree reveals a distinct pattern of “core lag-peripheral leap” (average value: 0.21 → 0.46). Technological innovations, such as photovoltaic smart lighting, have the potential to overcome transformation bottlenecks. However, historical urban areas remain constrained by spatial lock-in effects, as evidenced by Yuexiu District’s growth rate lagging by 32%.
This study elucidates the spatiotemporal association between urban expansion and carbon footprints and explores its potential mechanisms through spatial scale, industrial structure, and technological interventions. It underscores the indispensability of nighttime light data in analyzing the dynamic relationship between built-up areas and carbon emissions, offering a 5–8 fold improvement in spatiotemporal resolution over traditional data. The research advocates for tailored policies considering regional heterogeneity. However, the study notes that nighttime light data struggles to differentiate between industrial and commercial sources, potentially underestimating carbon emissions in service-oriented areas. Additionally, the GTWR model does not account for dynamic changes in natural carbon sinks, such as variations in forest carbon sequestration. Future research could integrate social media positioning data and thermal infrared remote sensing to enhance the precision of human activity-related carbon emission analyses. Moreover, AI-driven scenario simulations, such as the LSTM-CA model, could predict carbon emission trajectories under varying land policies.
While the individual methodologies employed in this study, such as NSCT-IHS fusion and GTWR, are established, the novel integration of these techniques into a cohesive analytical framework constitutes a significant contribution. This study moves beyond the application of standalone tools by: (i) creating a high-resolution, spectrally rich color-NLRSI dataset specifically designed for fine-scale urban environmental analysis; (ii) systematically combining dynamic monitoring of urban expansion with a spatiotemporal coupling coordination model to diagnose the evolution of urban development-environment interactions; and (iii) employing a GTWR model on the fused data to precisely quantify the differential impacts of various driving factors across space and time. The value of this work, therefore, lies not in algorithmic innovation but in the holistic synthesis of existing technologies to generate novel empirical evidence and mechanistic insights into the spatiotemporal coupling between urban form and carbon footprint in a rapidly developing megacity, offering a transferable model for future urban sustainability research.
It is important to acknowledge a key limitation of this study. Although the GTWR model reveals strong spatiotemporal correlations and correlation analysis identifies significant relationships between urban form indicators and carbon emissions, the findings primarily demonstrate statistical correlations rather than explicit causal mechanisms. The complex interactions between urban expansion, economic activities, and carbon emissions involve potential reverse causality and unobserved confounding factors. For instance, economic growth drives both expansion and emissions, which makes it difficult to isolate pure causal effects. Future research could employ quasi-experimental designs, instrumental variables, or longitudinal models with longer time series to better establish causal relationships and uncover the potential mechanisms identified in this study.
Author Contributions
Conceptualization, J.L. and X.G.; methodology, X.G.; software, X.G.; validation, X.G. and Y.L.; writing—original draft preparation, X.G.; writing—review and editing, Y.L.; supervision, J.J. and J.L. All authors have read and agreed to the published version of the manuscript.
Funding
This work was supported by the Guangxi Key Laboratory of Spatial Information and Geomatics (the grant #: 21-238-21-23), the Natural Science Foundation of Guangxi under (the grant #: 2025GXNSFBA069341), and Scientific Research Startup Funding at Guilin University of Technology.
Data Availability Statement
The original contributions presented in this study are included in the article. Further inquiries can be directed to the corresponding author.
Acknowledgments
All individuals included in this section have consented to the acknowledgement.
Conflicts of Interest
The authors declare no conflict of interest.
References
- Wu, Y.; Zhang, Q. The Confrontation and Symbiosis of Green and Development: Coupling Coordination Analysis between Carbon Emissions and Spatial Development in Urban Agglomerations of China. Sustain. Cities Soc. 2024, 106, 105391. [Google Scholar] [CrossRef]
- Liu, B.; Tian, C.; Li, Y.; Song, H.; Ma, Z. Research on the Effects of Urbanization on Carbon Emissions Efficiency of Urban Agglomerations in China. J. Clean. Prod. 2018, 197, 1374–1381. [Google Scholar] [CrossRef]
- Xia, C.; Yeh, A.G.-O.; Zhang, A. Analyzing Spatial Relationships between Urban Land Use Intensity and Urban Vitality at Street Block Level: A Case Study of Five Chinese Megacities. Landsc. Urban Plan. 2020, 193, 103669. [Google Scholar] [CrossRef]
- Sun, B.; Han, S.; Li, W. Effects of the Polycentric Spatial Structures of Chinese City Regions on CO2 Concentrations. Transp. Res. Part D Transp. Environ. 2020, 82, 102333. [Google Scholar] [CrossRef]
- Tian, J.; Shan, Y.; Zheng, H.; Lin, X.; Liang, X.; Guan, D. Structural Patterns of City-Level CO2 Emissions in Northwest China. J. Clean. Prod. 2019, 223, 553–563. [Google Scholar] [CrossRef]
- Franco, S.; Mandla, V.R.; Ram Mohan Rao, K. Urbanization, Energy Consumption and Emissions in the Indian Context a Review. Renew. Sustain. Energy Rev. 2017, 71, 898–907. [Google Scholar] [CrossRef]
- Xu, Q.; Dong, Y.; Yang, R. Urbanization Impact on Carbon Emissions in the Pearl River Delta Region: Kuznets Curve Relationships. J. Clean. Prod. 2018, 180, 514–523. [Google Scholar] [CrossRef]
- Xiao, H.; Duan, Z.; Zhou, Y.; Zhang, N.; Shan, Y.; Lin, X.; Liu, G. CO2 Emission Patterns in Shrinking and Growing Cities: A Case Study of Northeast China and the Yangtze River Delta. Appl. Energy 2019, 251, 113384. [Google Scholar] [CrossRef]
- Shan, Y.; Guan, D.; Hubacek, K.; Zheng, B.; Davis, S.J.; Jia, L.; Liu, J.; Liu, Z.; Fromer, N.; Mi, Z.; et al. City-Level Climate Change Mitigation in China. Sci. Adv. 2018, 4, eaaq0390. [Google Scholar] [CrossRef]
- Shan, Y.; Guan, D.; Zheng, H.; Ou, J.; Li, Y.; Meng, J.; Mi, Z.; Liu, Z.; Zhang, Q. China CO2 Emission Accounts 1997–2015. Sci. Data 2018, 5, 170201. [Google Scholar] [CrossRef] [PubMed]
- Yang, S.; Yang, X.; Gao, X.; Zhang, J. Spatial and Temporal Distribution Characteristics of Carbon Emissions and Their Drivers in Shrinking Cities in China: Empirical Evidence Based on the NPP/VIIRS Nighttime Lighting Index. J. Environ. Manag. 2022, 322, 116082. [Google Scholar] [CrossRef] [PubMed]
- Gao, F.; Wu, J.; Xiao, J.; Li, X.; Liao, S.; Chen, W. Spatially Explicit Carbon Emissions by Remote Sensing and Social Sensing. Environ. Res. 2023, 221, 115257. [Google Scholar] [CrossRef]
- Neel Chaminda Withanage; Shi, K.; Shen, J. Extracting and Evaluating Urban Entities in China from 2000 to 2020 Based on SNPP-VIIRS-like Data. Remote Sens. 2023, 15, 4632. [Google Scholar] [CrossRef]
- Chen, Z.; You, X.; Wang, C.; Wu, W.; Wei, Y.; Shi, K.; Yu, B. An Increasing Mutual Promotion of Economic Growth between China and the World Observed from Nighttime Light Remote Sensing. Int. J. Digit. Earth 2024, 17, 2426521. [Google Scholar] [CrossRef]
- Pan, Y.; Jiang, L.; Wang, J.; Ma, J.; Bao, S.; Lin, Y.; Shi, K. Mapping and Evaluating Spatiotemporal Patterns of Urban Expansion in Global Earthquake-Affected Areas: A Nighttime Light Remote Sensing Perspective. Int. J. Digit. Earth 2024, 17, 2419938. [Google Scholar] [CrossRef]
- Xing, P.; Wang, Y.; Ye, T.; Sun, Y.; Li, Q.; Li, X.; Li, M.; Chen, W. Carbon Emission Efficiency of 284 Cities in China Based on Machine Learning Approach: Driving Factors and Regional Heterogeneity. Energy Econ. 2024, 129, 107222. [Google Scholar] [CrossRef]
- Shi, K.; Wu, Y.; Li, D.; Li, X. Population, GDP, and Carbon Emissions as Revealed by SNPP-VIIRS Nighttime Light Data in China with Different Scales. IEEE Geosci. Remote Sens. Lett. 2022, 19, 3008005. [Google Scholar] [CrossRef]
- Zhang, J.; Lu, H.; Peng, W.; Zhang, L. Analyzing Carbon Emissions and Influencing Factors in Chengdu-Chongqing Urban Agglomeration Counties. J. Environ. Sci. 2024, 151, 640–651. [Google Scholar] [CrossRef]
- Cao, H.; Han, L.; Liu, M.; Li, L. Spatial Differentiation of Carbon Emissions from Energy Consumption Based on Machine Learning Algorithm: A Case Study during 2015–2020 in Shaanxi, China. J. Environ. Sci. 2023, 149, 358–373. [Google Scholar] [CrossRef]
- Li, X.; Levin, N.; Xie, J.; Li, D. Monitoring Hourly Night-Time Light by an Unmanned Aerial Vehicle and Its Implications to Satellite Remote Sensing. Remote Sens. Environ. 2020, 247, 111942. [Google Scholar] [CrossRef]
- Lu, Y.; Zhou, G.; Huang, M.; Huang, Y. Color Night Light Remote Sensing Images Generation Using Dual-Transformation. Sensors 2024, 24, 294. [Google Scholar] [CrossRef] [PubMed]
- Li, Y.; Chen, F.; Sui, T.; Ti, R.; Cheng, W.; Hong, J.; Qiu, Z. Interplay between Atmospheric Correction and Fusion Techniques Enhances the Quality of Remote Sensing Image Fusion. Remote Sens. 2024, 16, 3916. [Google Scholar] [CrossRef]
- Du, Y.; Zhang, Y.; Ling, F.; Wang, Q.; Li, W.; Li, X. Water Bodies’ Mapping from Sentinel-2 Imagery with Modified Normalized Difference Water Index at 10-m Spatial Resolution Produced by Sharpening the SWIR Band. Remote Sens. 2016, 8, 354. [Google Scholar] [CrossRef]
- Zhu, H.; Yan, F.; Guo, P.; Li, X.; Hou, B.; Chen, K.; Wang, S.; Jiao, L. High-Low Frequency Progressive Guided Diffusion Model for PAN and MS Classification. IEEE Trans. Geosci. Remote Sens. 2024, 62, 5407214. [Google Scholar] [CrossRef]
- Zhang, X.; Dai, X.; Zhang, X.; Hu, Y.; Kang, Y.; Jin, G. Improved Generalized IHS Based on Total Variation for Pansharpening. Remote Sens. 2023, 15, 2945. [Google Scholar] [CrossRef]
- Ma, W.; Ma, M.; Jiao, L.; Liu, F.; Zhu, H.; Liu, X.; Yang, S.; Hou, B. An Adaptive Migration Collaborative Network for Multimodal Image Classification. IEEE Trans. Neural Netw. Learn. Syst. 2023, 35, 10935–10949. [Google Scholar] [CrossRef]
- Chen, Z.; Yu, B.; Yang, C.; Zhou, Y.; Yao, S.; Qian, X.; Wang, C.; Wu, B.; Wu, J. An Extended Time Series (2000–2018) of Global NPP-VIIRS-like Nighttime Light Data from a Cross-Sensor Calibration. Earth Syst. Sci. Data 2021, 13, 889–906. [Google Scholar] [CrossRef]
- Huang, X.; Hu, T.; Wang, Q.; Benediktsson, J.A. Mapping Urban Areas in China Using Multisource Data with a Novel Ensemble SVM Method. IEEE Trans. Geosci. Remote Sens. 2018, 56, 4258–4273. [Google Scholar] [CrossRef]
- Ma, X.; Li, C.; Tong, X.; Liu, S. A New Fusion Approach for Extracting Urban Built-up Areas from Multisource Remotely Sensed Data. Remote Sens. 2019, 11, 2516. [Google Scholar] [CrossRef]
- Jiang, F.; Chen, B.; Li, P.; Jiang, J.; Zhang, Q.; Wang, J.; Deng, J.S. Spatio-Temporal Evolution and Influencing Factors of Synergizing the Reduction of Pollution and Carbon Emissions—Utilizing Multi-Source Remote Sensing Data and GTWR Model. Environ. Res. 2023, 229, 115775. [Google Scholar] [CrossRef]
- Sun, Y.; Zheng, S.; Wu, Y.; Schlink, U.; Singh, R.P. Spatiotemporal Variations of City-Level Carbon Emissions in China during 2000–2017 Using Nighttime Light Data. Remote Sens. 2020, 12, 2916. [Google Scholar] [CrossRef]
- Sun, L.; Mao, X.; Feng, L.; Zhang, M.; Gui, X.; Wu, X. Investigating the Direct and Spillover Effects of Urbanization on Energy-Related Carbon Dioxide Emissions in China Using Nighttime Light Data. Remote Sens. 2023, 15, 4093. [Google Scholar] [CrossRef]
- Imai, K.; Kim, I.S. On the Use of Two-Way Fixed Effects Regression Models for Causal Inference with Panel Data. Political Anal. 2020, 29, 405–415. [Google Scholar] [CrossRef]
- Song, M.; Wang, Y.; Han, Y.; Ji, Y. Estimation Model and Spatio-Temporal Analysis of Carbon Emissions from Energy Consumption with NPP-VIIRS-like Nighttime Light Images: A Case Study in the Pearl River Delta Urban Agglomeration of China. Remote Sens. 2024, 16, 3407. [Google Scholar] [CrossRef]
- Gao, X.; Xia, N.; Zhuang, S.; Zhao, X.; Liang, J.; Wang, Z.; Li, M. Integrating Multisource Geographic Big Data to Delineate Urban Growth Boundary: A Case Study of Changsha. IEEE J. Sel. Top. Appl. Earth Obs. Remote Sens. 2024, 17, 9018–9036. [Google Scholar] [CrossRef]
- Jiang, J.; Zhu, S.; Wang, W.; Li, Y.; Li, N. Coupling Coordination between New Urbanisation and Carbon Emissions in China. Sci. Total Environ. 2022, 850, 158076. [Google Scholar] [CrossRef] [PubMed]
- Huang, B.; Wu, B.; Barry, M. Geographically and Temporally Weighted Regression for Modeling Spatio-Temporal Variation in House Prices. Int. J. Geogr. Inf. Sci. 2010, 24, 383–401. [Google Scholar] [CrossRef]
- Yang, X.; Jin, K.; Duan, Z.; Gao, Y.; Sun, Y.; Gao, C. Spatial-Temporal Differentiation and Influencing Factors of Carbon Emission Trajectory in Chinese Cities—A Case Study of 247 Prefecture-Level Cities. Sci. Total Environ. 2024, 928, 172325. [Google Scholar] [CrossRef] [PubMed]
Disclaimer/Publisher’s Note: The statements, opinions and data contained in all publications are solely those of the individual author(s) and contributor(s) and not of MDPI and/or the editor(s). MDPI and/or the editor(s) disclaim responsibility for any injury to people or property resulting from any ideas, methods, instructions or products referred to in the content. |
© 2025 by the authors. Licensee MDPI, Basel, Switzerland. This article is an open access article distributed under the terms and conditions of the Creative Commons Attribution (CC BY) license (https://creativecommons.org/licenses/by/4.0/).