Article

Quantifying the Rate and Extent of Urbanization Effects on Vegetation Phenology in Mainland China

1
School of Ecology, Shenzhen Campus of Sun Yat-sen University, Shenzhen 518107, China
2
Centre de Recerca Ecològica i Aplicacions Forestals (CREAF), Cerdanyola del Vallès, 08193 Barcelona, Catalonia, Spain
3
Spanish National Research Council (CSIC), Global Ecology Unit CREAF-CSIC-UAB, 08193 Barcelona, Catalonia, Spain
4
Research Area of Ecology and Biodiversity, School for Biological Sciences, The University of Hong Kong, Hong Kong, China
5
State Key Laboratory of Biocontrol, Sun Yat-sen University, Shenzhen 518107, China
*
Author to whom correspondence should be addressed.
Remote Sens. 2025, 17(16), 2758; https://doi.org/10.3390/rs17162758
Submission received: 12 May 2025 / Revised: 29 July 2025 / Accepted: 2 August 2025 / Published: 8 August 2025
(This article belongs to the Special Issue Remote Sensing Applications in Urban Environment and Climate)

Abstract

Urbanization profoundly alters environmental conditions (e.g., temperature, artificial light at night (ALAN), and precipitation) that strongly influence vegetation phenology. However, the rate and extent of vegetation phenological responses to urbanization, as well as their underlying mechanisms, remain underexplored, particularly the roles of CO2 emissions and PM2.5 concentrations, as well as the interactions among environmental conditions. We first used road network density (RND) to represent urbanization effects and quantified the phenological response rate and extent across 31 cities in China (2014–2022) using slope and range metrics derived from linear regressions of phenostages (start of season (SOS), end of season (EOS), length of season (LOS)) against RND. Partial least squares structural equation modeling was applied to assess the direct and indirect effects of RND on phenology via all five key environmental factors. Our results identified substantial differences in the urban phenological responses across latitudinal, hydrothermal, and land−cover gradients. And the impact of urbanization on phenology was most pronounced during early expansion (at a RND threshold of 2.02 ± 0.41 km/km2) but diminished with continued growth. Environmental factors distinctly affected phenological response rate and extent through RND; temperature, ALAN, and CO2 emissions were the dominant drivers of slope, negatively affecting SOS (β = −0.37 to −0.69) but positively affecting EOS and LOS (β = 0.31 to 0.68). PM2.5 played a crucial role in determining the range of SOS (β = −0.31), and precipitation had the largest impact on the range of EOS (β = −0.37). Our study innovatively uses RND to quantify urbanization intensity and improve understanding of the combined effects of multiple drivers, especially PM2.5 and CO2, on phenological responses, which may offer a useful reference for future urban planning strategies that aim to balance development with ecosystem functioning.

1. Introduction

Vegetation phenology, defined as the timing of recurring events in plant life cycles, has long served as a highly sensitive indicator of climate change [1,2,3] and can also feed back to climatic systems by altering the exchange of energy, water, and carbon between the terrestrial surface and the atmosphere [4,5,6]. Urbanization, driven by rapid population growth and intensified anthropogenic activity, strongly affects climatic and atmospheric conditions (e.g., urban heat islands (UHIs), the expansion of artificial light at night (ALAN), and increases in CO2 emissions), which profoundly affect vegetation phenology [7,8]. Understanding the phenological responses to urbanization is, therefore, of great importance [9,10,11] due to the compounded effects of global climate change and urbanization, which may exacerbate negative consequences on terrestrial ecosystems [12,13]. The complex interactions between urban environmental factors and vegetation phenology, however, remain incompletely understood, hindering our ability to predict future phenological trends under rapid urbanization and climate change.
Numerous studies of urban vegetation phenology have identified a few main climatic factors that influence phenological patterns, such as temperature, precipitation, and ALAN. For example, rising temperatures (i.e., UHI warming) accelerate heat accumulation in early spring and reduce the risk of frost in autumn and winter, which strongly affect vegetation phenology, advancing the start of the growing season (SOS) and extending the length of the growing season (LOS) [14,15,16]. Precipitation, usually correlated with the effect of UHIs (which increase precipitation in urban areas) [17], alters soil moisture, subsequently impacting plant photosynthesis and affecting the timing of both SOS and the end of the growing season (EOS), but with large variability in magnitude and direction across different vegetation types [18,19,20]. Increased precipitation during the growing season also enhances the phenological responses to changes in temperature [21,22]. Although artificial light at night (ALAN) is often considered a proxy for urbanization and, thus, classified as a socioeconomic or anthropogenic factor, recent studies have indicated that ALAN, increasing with urban expansion, strongly affects phenology by advancing bud burst and delaying foliar coloring [7,23,24]. This is because ALAN affects phenology by influencing the circadian rhythms of plants. It has been well known that the direction, duration, and spectral features of light, including ALAN, are used by plants as sources of information about their location and the day of year, regulating the phase and frequency of their endogenous clock [25,26]. Exposure to ALAN after dusk or before dawn can cause phase shifts in the circadian rhythm, either delaying or advancing this cycle [25,26]. Therefore, ALAN may provide misleading cues and cause a false appearance of the lengthened daylight, thus shifting the onset and duration of plant phenology phases [7]. In addition to the well−documented factors, other environmental factors such as CO2 levels and air pollution (e.g., particulate matter (PM) pollution) can also strongly affect phenology but are often overlooked. For example, some studies have found that due to CO2 enrichment affecting plant photosynthesis and respiration, an earlier SOS and peak of the growing season, as well as a delayed EOS, are sensitive to both increased CO2 emissions and rising temperatures [4,8]. PM2.5 (fine PM with a diameter less than 2.5 μm), a key indicator of PM pollution, has been significantly positively correlated with SOS [27], probably because it directly damages leaves by the impact of dry deposition on the photosynthetic rate [28].
Despite considerable advances in current research, two important challenges persist. First, most previous studies focused solely on single or dual influences of specific factors [7,8], leading to the neglect of the compound influences from interactions among multiple factors. Due to the complex interactions among environmental factors, this lack of consideration may lead to the misinterpretation of the effects of one or two factors as the predominant influence(s), obscuring the broader and more complex mechanisms underlying phenological responses. Second, many studies have examined variations in vegetation phenology (e.g., magnitude and direction) under urbanization but have often overlooked the rate and extent of vegetation phenological responses to urbanization. Moreover, the commonly used urban–rural gradient (URG) approach [3,29,30], which created buffers extending from a single urban center, may be efficient for quantifying urbanizations in localized areas but inadequate for systematically identifying the heterogeneous characteristics of urbanization across entire metropolitan areas, especially in cities with multiple centers and rapid urban development. For example, five prosperous new areas have recently been urbanized in the outer suburbs of Shanghai, China. Exploring less−well−studied environmental factors, such as CO2 emissions and PM2.5 concentrations, together with temperature, precipitation, and ALAN and their compound interactions, would be beneficial to address these gaps. Using road network density (RND), i.e., the total length of urban roads per unit area, could be a more appropriate proxy for urbanization intensity and changes in the urban environment, as RND is closely associated with urbanization processes and can be used to characterize urban expansion and land−use intensity [31]. Combined with metrics such as the slope and range of linear regressions of vegetation phenology against RND, this approach provided a continuous numerical measurement to evaluate the rate and extent of vegetation phenological responses to urbanization.
We aimed to address the following questions: (1) What are the spatial patterns in the rate and extent of vegetation phenological responses to urbanization? (2) How and to what extent do various environmental factors affect these patterns? To answer these questions, we quantified the rate and extent of vegetation phenological responses to urbanization across 31 cities in China using the slope and range of linear regressions between vegetation phenology and RND. We then integrated five environmental factors—temperature, precipitation, ALAN, CO2 emissions, and PM2.5 concentrations—and used partial least-squares structural equation modeling (PLS−SEM) to explore the mechanisms underlying the rate of plant phenological responses to urbanization. We hoped to gain a deeper understanding of the complex interactions between climate change and phenology induced by urbanization, informing future strategies of urban ecological conservation.

2. Study Sites and Materials

2.1. Study Sites

We selected 31 major cities in mainland China, including 26 provincial capitals, four directly administered municipalities, and a special economic zone (Shenzhen), each with a population of more than one million (Figure 1; Table S1). Spanning a wide range of latitudes (20.04–45.76°N) and longitudes (87.62–126.64°E), these cities have growing−season monthly mean temperatures ranging from 2.9 to 26.4 °C and total growing−season precipitation ranging from 254 to 2106 mm, cover three climatic zones (tropical, subtropical, and temperate), and encompass 17 land−cover types, such as evergreen forest, grassland, and urban areas. Details of the locations, populations, road network densities, climates, and primary land−cover types are presented in Table S1 and Figure S1. The boundaries of the 31 cities were defined based on official prefecture−level administrative divisions assessed from the GDAM database (http://www.gadm.org/country, accessed on 29 April 2024), which were further used to extract phenological and environmental variables.

2.2. Materials

We used the following four types of data obtained from 2014 to 2022: road networks, vegetation phenology, land−cover types, and environmental variables. This period was chosen because road network data were only available for these years. To ensure spatial consistency across the different types of data, we generated a 1 × 1 km grid raster for each study site within the WGS 1984 UTM coordinate system using the Fishnet Creation tool and retrieved grid−specific values from each dataset using the Extract Multi Values to Points tool in ArcGIS 10.8 (Esri, Redlands, CA, USA). The 1 × 1 km grid size was chosen to match the coarsest spatial resolution among these datasets.

2.2.1. Data for Road Networks

The RND data included data for railways, highways, roads, paths, alleys, and motorways. We accessed RND data from the OpenStreetMap open−source geographic database (https://www.openstreetmap.org/, accessed on 30 April 2024) [32,33]. Previous studies have shown that OSM data exhibit high reliability and accuracy in major cities of China [32,33]. To further verify the effectiveness of using RND as an indicator of urbanization intensity, we conducted a comparative analysis between RND and the impervious surface ratio (ISR)—a widely recognized proxy for built−up land [34]. Across all 31 cities in our study, linear regression analyses showed a strong correlation between RND and ISR, with the coefficient of determination (R2) exceeding 0.8 in 30 cities (Figure S2). The high consistency between RND and ISR suggests that RND is a robust and scalable indicator that can substitute or complement traditional urbanization metrics in land surface phenology and environmental studies. To assess the impact of RND on urban vegetation phenology, we calculated the total road length within each grid and used this value to represent the RND for each grid.

2.2.2. Data for Vegetation Phenology

We used data for vegetation phenology from the MODIS Land Cover Dynamics product, MCD12Q2 Version 6.1, with a resolution of 500 m (https://lpdaac.usgs.gov/products/mcd12q2v061/, accessed on 22 April 2024). This product is derived from a time series of the 2−band Enhanced Vegetation Index calculated from the MODIS Nadir Bidirectional Reflectance Distribution Function−Adjusted Reflectance [35]. It includes phenostage layers (e.g., greenup, peak, and dormancy) and quality−control layers (e.g., QA_Overall) for each derived phenological timing metric. We used the greenup metric to indicate SOS, the dormancy metric to indicate EOS, and the difference between EOS and SOS to indicate LOS. We used the quality−assessment band (QA_Overall) provided by MCD12Q2 to ensure the reliability of the phenological data and retained only the highest quality data with pixel values equal to 0 (0, best; 1, good; 2, fair; 3, poor). Only pixels with the best quality (QA_Overall = 0), which accounted for 98.89% of the total, were used in the analysis.

2.2.3. Data for Land–Cover Type

We used the MCD12Q1 Version 6.1 product for land−cover type with a resolution of 500 m (https://lpdaac.usgs.gov/products/mcd12q1v061/, accessed on 6 May 2024). This product was derived using supervised classifications of MODIS Terra and Aqua reflectance data (https://lpdaac.usgs.gov/documents/1409/MCD12_User_Guide_V61.pdf, accessed on 6 May 2024). It includes multiple layers of land−cover types, such as those from the International Geosphere–Biosphere Programme (IGBP), the University of Maryland, and the leaf area index. We used the first land−cover type layer following the IGBP classification scheme. This layer identifies 17 major land−cover types, as follows: 11 natural vegetation types (e.g., grassland), 3 human−altered types (e.g., urban areas), and 3 non−vegetated types (e.g., barren). Similar to the phenological data, we used the quality assessment band provided by MCD12Q1 and retained only the highest quality classified land data with pixel values equal to 0 (0, best; 1, good; 2, fair; 3, poor).

2.2.4. Environmental Data

(1)
ALAN
We used the annual ALAN radiance data with a resolution of 500 m and data from the National Polar−orbiting Partnership–Visible Infrared Imaging Radiometer Suite (NPP−VIIRS) like nighttime light (NTL) from the Harvard Dataverse (https://dataverse.harvard.edu/dataset.xhtml?persistentId=doi:10.7910/DVN/YGIVCD, accessed on 8 May 2024). These data were derived by cross-sensor calibration from two widely used nighttime light satellite data, namely the Defense Meteorological Satellite Program–Operational Linescan System (DMSP−OLS) stable NTL and Suomi NPP−VIIRS NTL, and have demonstrated high accuracy and good consistency at both the pixel and city levels [36].
(2)
Temperature and precipitation
We used ~1 km data for monthly mean temperature and precipitation from the National Tibetan Plateau Data Center (https://doi.org/10.11888/Meteoro.tpdc.270961; https://data.tpdc.ac.cn/zh-hans/data/faae7605-a0f2-4d18-b28f-5cee413766a2, accessed on 7 May 2024). This dataset was spatially scaled down from the Climatic Research Unit (CRU) time series dataset using the WorldClim climatological dataset and the Delta method for spatial downscaling. The accuracy of the dataset has been rigorously evaluated by Peng et al. using observations from 496 national meteorological stations across China [37].
(3)
PM2.5
We used ~1 km data for monthly PM2.5 concentrations, ChinaHighPM2.5, from the National Tibetan Plateau Data Center (https://doi.org/10.5281/zenodo.3539349, accessed on 7 May 2024). These data were generated from big data (ground−based measurements, satellite data, atmospheric reanalysis, and model simulations) using the proposed Space–Time Extra-Trees (STET) model [38].
(4)
CO2
We used 1 km data for monthly CO2 emissions from the Open−Data Inventory for Anthropogenic Carbon Dioxide (ODIAC) Fossil Fuel Emission Dataset (https://db.cger.nies.go.jp/dataset/ODIAC/DL_odiac2023.html, accessed on 9 May 2024), provided by the National Institute for Environmental Studies in Japan. The ODIAC dataset estimates the high−resolution spatial distributions of fossil fuel CO2 emissions by integrating space−based nighttime light data with emissions from individual power plants and location profiles. With the emission−modeling approach, ODIAC has been shown to provide an accurate and robust representation of global fossil fuel CO2 emissions [39].
To better illustrate the spatial coverage of the datasets, we provided remote sensing phenology imagery for all 31 cities (Figure S3) and all kinds of remote sensing materials using Beijing as a representative example (Figure S4).

3. Methods

3.1. Analyzing the Spatial Patterns in the Rate and Extent of Vegetation Phenological Responses to Urbanization

We analyzed the spatial patterns in the rate and extent of vegetation phenological responses to urbanization based on latitude, temperature, precipitation, and land−cover type. We applied an outlier procedure based on the median absolute deviation (MAD) [40], which helps ensure that the calculated phenological values reflect typical conditions rather than being distorted by anomalous observations.
We conducted linear regression analyses between the three phenostages (SOS, EOS, and LOS) and road network density (RND; the total length of roads per square kilometer). We extracted the intercept and slope of the linear relationships from these analyses (Figure S5). The intercept indicates the vegetation phenological baseline unaffected by urbanization, and the slope indicates the response rate of vegetation phenology to urbanization, as indicated by RND. To ensure comparability across cities and scales, RND was standardized before regression analysis. The slopes used in this study are standardized regression coefficients, a common approach in many phenological studies to quantify the rate of change in phenological timing metrics per unit change in environmental variables [41,42,43]. We also calculated the ranges of the phenostages by subtracting the minima from the maxima for each city (Figure S5). The ranges represent the response extent of phenology under the influence of urbanization. Since we have removed outliers before, the influence of extreme values has been minimized. To validate this choice, we compared the range with the standard deviation for each metric and found strong linear relationships (R2 = 0.77–0.87), indicating that the range is a reliable proxy for response extent in this context (Figure S6). Given its robustness and interpretability, we adopted range as the primary indicator for response extent in our analyses.
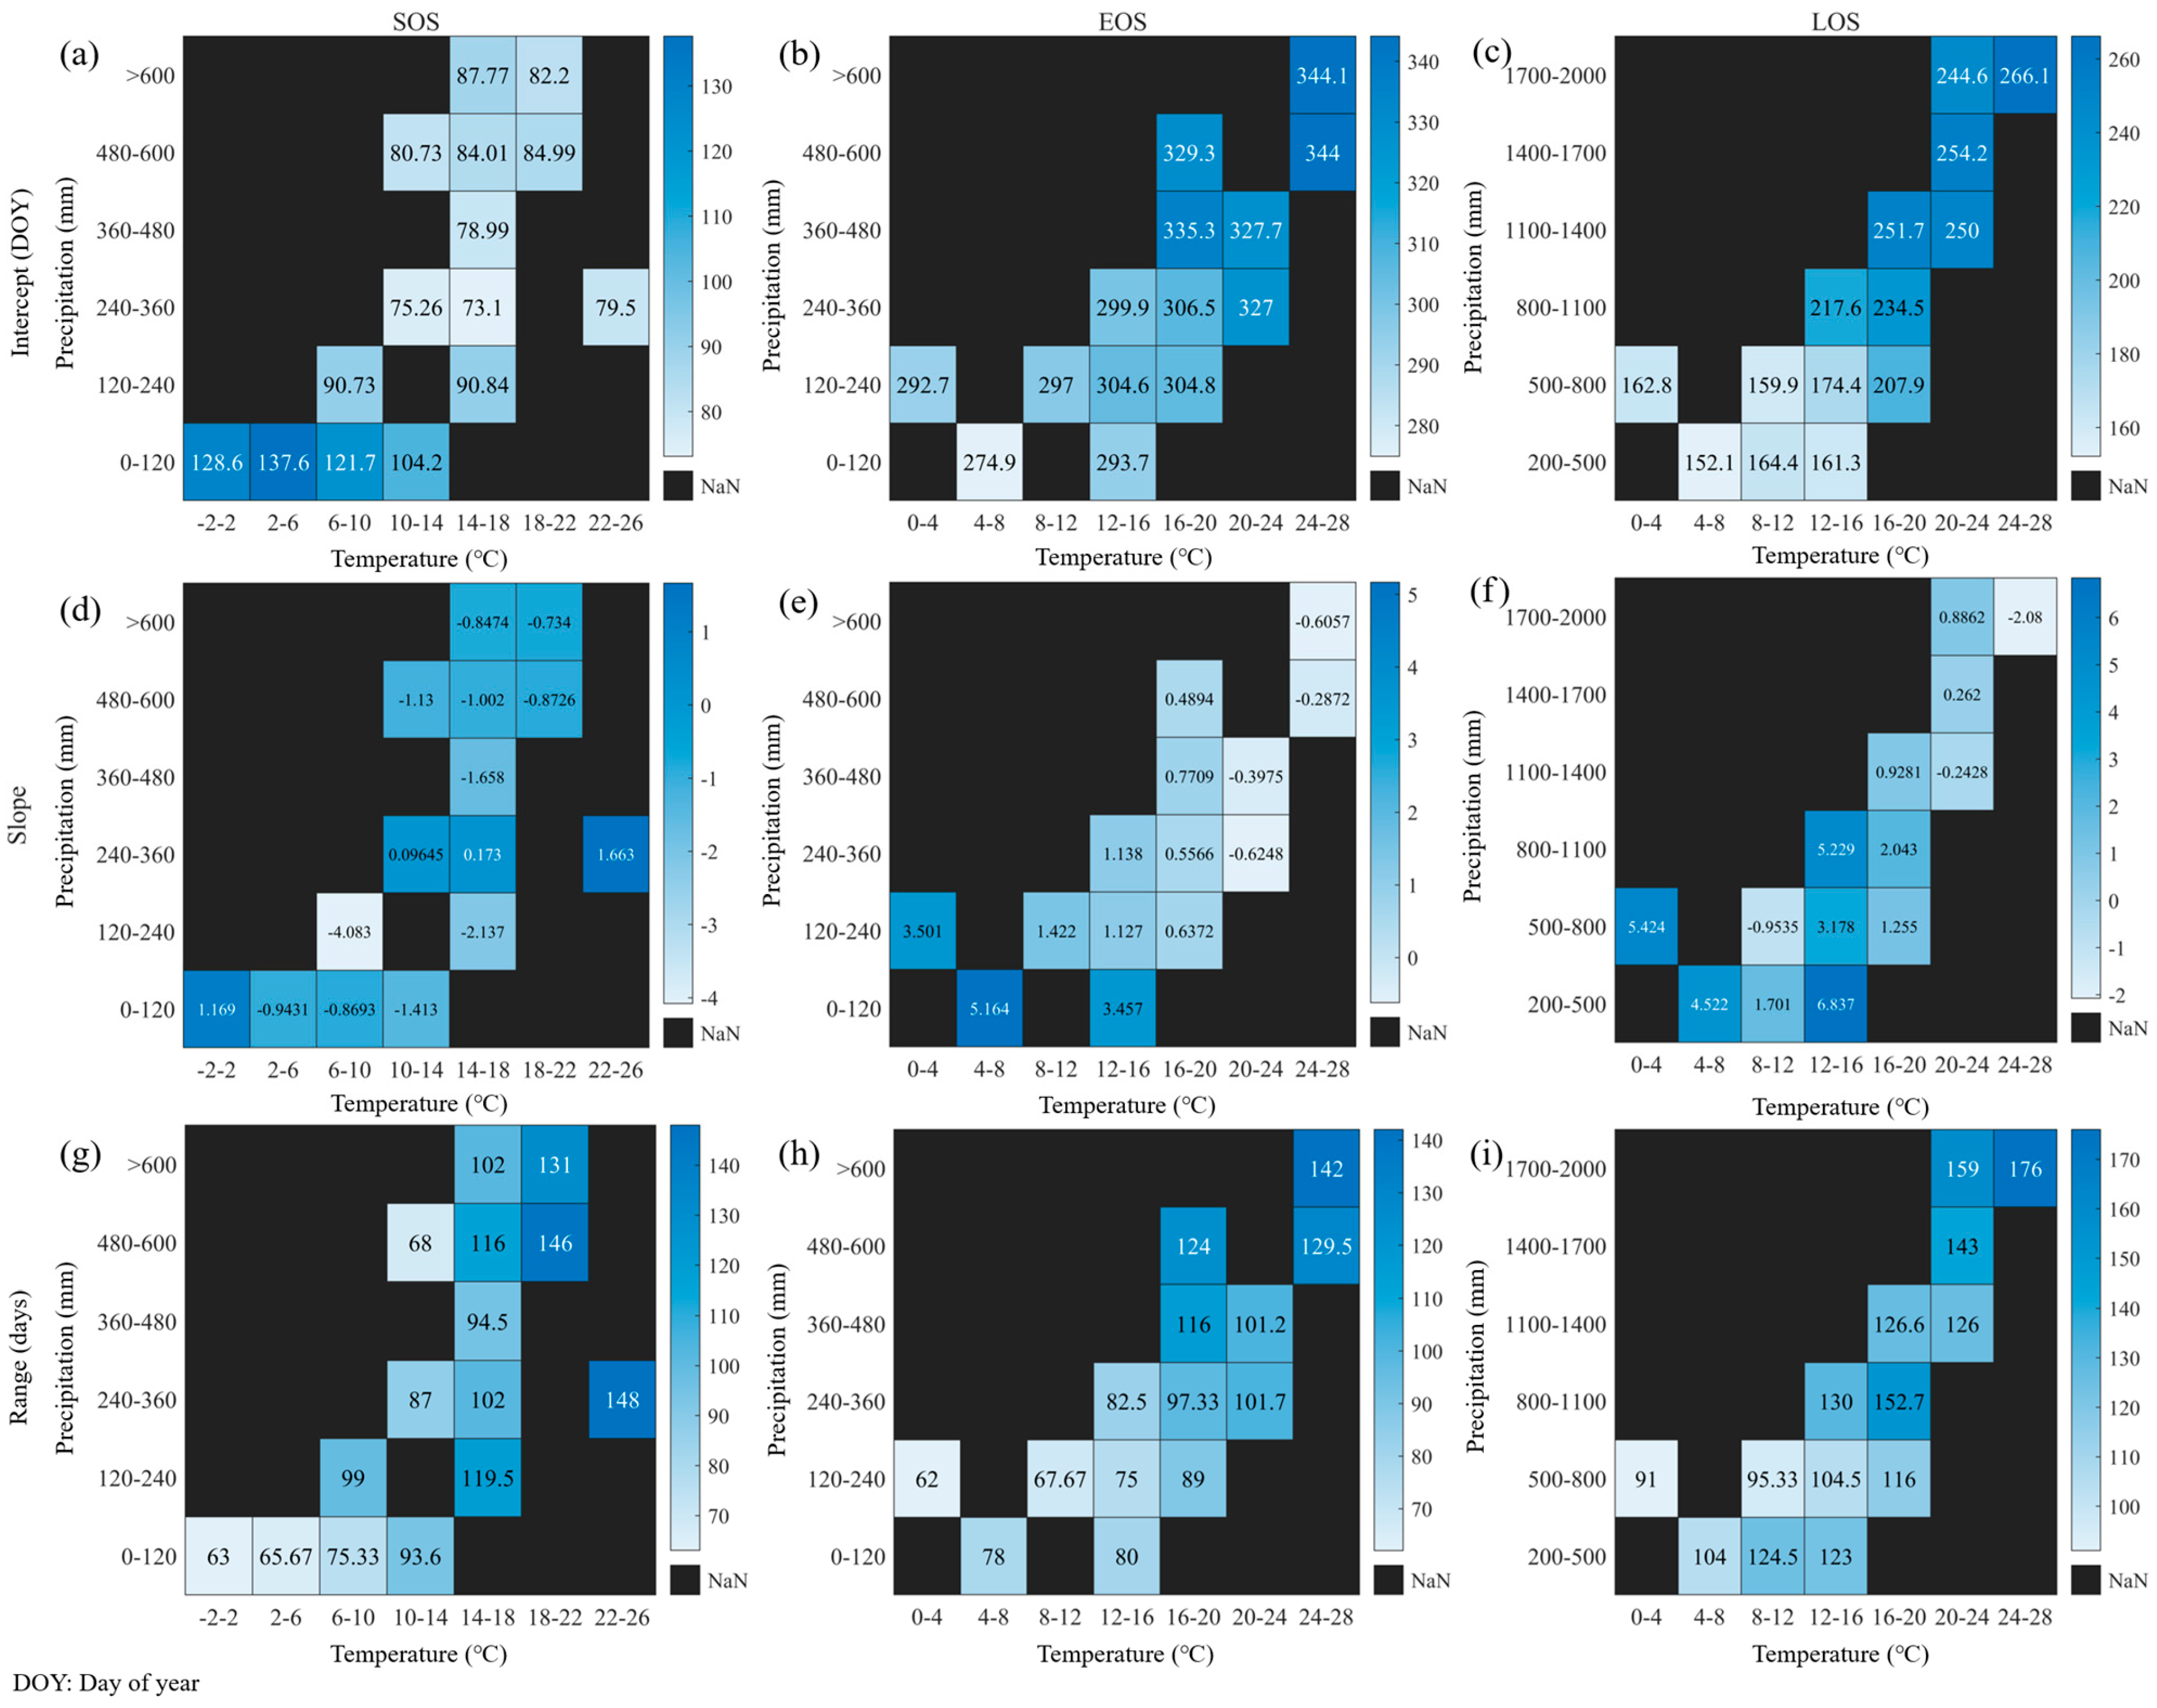
We used the derived intercepts, slopes, and ranges to analyze the latitudinal patterns of change of these metrics using linear regression analysis. We also analyzed the variation of these metrics based on monthly mean temperature and total precipitation during February–May (spring), August–November (autumn), and February–November (growing seasons) for SOS, EOS, and LOS, respectively. Hereafter, we referred to these variables as monthly mean temperature and total precipitation. This analysis was conducted using the “heatmap” function in RStudio 4.2.3 (R Development Core Team, 2023). Monthly mean temperatures were divided into seven levels at equal intervals of 4 °C, and total precipitation was divided into six levels at equal intervals of 120 mm for SOS and EOS and 300 mm for LOS, which served as the horizontal and vertical axes of the heatmaps. We found that the overall spatial trends remained consistent regardless of bin size, indicating the robustness of the patterns (Figure S7). However, using more bins often resulted in sparse categories, with certain rows or columns having insufficient data, leading to visual gaps or instability in statistical summaries. Conversely, fewer bins reduced the granularity of information and masked subtle variations. Therefore, the selected discretization strikes a balance between interpretability and completeness, and we believe it provides the most informative representation of the data. To assess the phenological responses to urbanization across the land−cover types, we focused exclusively on natural vegetation types (n = 11; IGBP classification scheme), grouping them into nine predominant types, as follows: evergreen needleleaf forest (ENF), evergreen broadleaf forest (EBF), deciduous needleleaf forest (DNF), deciduous broadleaf forest (DBF), mixed forest (MF), shrubland (SHL; both open and closed shrubland), savanna (SAV; both savanna and woody savanna), grassland (GRL), and permanent wetland (PWL). We limited our analysis to six types; however, due to the sparse distributions of DNF, SHL, and PWL (<0.1%) at our study sites. The detailed land cover type proportions for each city are provided in Table S2.

3.2. Quantifying Rate and Extent of Vegetation Phenological Responses to Urbanization Using Graded RND

We collected RND data from all study sites and categorized these data using equal-frequency binning to quantitatively analyze the response rate of phenology and minimize the uncertainty of data collection and processing. This method divided RND values into 20 bins, each containing the same number of observations. Lower levels indicate a lower RND and a lower degree of urbanization, and higher levels indicate a higher RND and a higher degree of urbanization.
We used the derived RND levels to conduct two types of linear regression analyses across RND levels and cities. First, we conducted linear regression analyses between the three phenostages (SOS, EOS, and LOS) and RND for each level. From these analyses, we used the Z−score standardization method to standardize RND and extracted the slope and intercept of the linear relationships. We also calculated the ranges of the phenostages by subtracting the minima from the maxima for each RND level. We analyzed the relationship between the mean RND for each level and the derived intercept, slope, and range. Observing a rapid initial increase followed by gradual saturation, we fitted the data using an exponential function. With the fitted curve, we calculated the saturation point as described by [44,45,46]. Specifically, for each phenological response metric (e.g., intercept, slope, range), we performed both linear and nonlinear (exponential) regression fits to the scatterplot of phenology versus RND. The saturation point was defined as the point on the nonlinear regression curve that has the maximum vertical distance from the linear regression line, which lies within the enclosed area formed between the two curves [44,45,46]. This point represents the threshold beyond which increases in urbanization intensity have a diminishing effect on vegetation phenology. We provide a schematic diagram illustrating the definition and identification of the saturation point in the Supplementary File (Figure S8). To assess the robustness of the exponential fitting, we compared it with logarithmic models and piecewise linear models across all phenological response metrics (Figure S9). Generally, exponential and piecewise linear models achieved higher R2 values than logarithmic models. However, piecewise linear models showed substantial deviations in estimated saturation points and lacked consistency across phenological response metrics, indicating poor robustness in identifying saturation thresholds (Figure S9). In contrast, logarithmic functions can capture decelerating trends; they achieved the lowest R2 values across almost all phenological response metrics among all three models (Figure S9). Therefore, the exponential function was ultimately selected as it provided a better balance between smoothness, biological interpretability, and accurate saturation point identification.
Second, we used a linear mixed model (LMM) to determine the relationships between the three phenostages and RND across the cities. LMMs are an extension of simple linear models to include both fixed and random effects, which helps avoid fitting errors caused by the random effects [47]. RND in our analysis was treated as the fixed effect, and city was treated as the random effect. This approach allowed us to derive a specific linear model for each city and a general model applicable to all cities. To systematically assess the performance and spatial consistency of the mixed−effects models across all 31 cities, we conducted a residual analysis [48] based on the difference between observed and predicted values of SOS, EOS, and LOS. Residuals were calculated for each sample as the difference between the observed and modeled phenological values. We then summarized the residual distribution for each city, using descriptive statistics (mean, median, standard deviation) and boxplots, to identify any systematic bias or regional deviations. This analysis allowed us to evaluate model fit consistency across different climatic zones and urban contexts.

3.3. Exploring the Factors Driving the Responses of Vegetation Phenological Sensitivity to Urbanization Using Pearson’s Correlation and Structural Equation Modeling

To analyze the factors driving the rate and extent of vegetation phenological responses to urbanization, as indicated by the intercepts, slopes, and ranges for SOS, EOS, and LOS, we conducted two types of analyses. First, we used Pearson’s correlation coefficient (R) to measure the correlations among the metrics of vegetation phenology (intercept, slope, and range), RND, and various environmental factors such as monthly mean temperature, total precipitation, artificial light at night (ALAN), CO2 emissions, and PM2.5 concentrations. Similar to monthly mean temperature and total precipitation, CO2 emissions, and PM2.5 concentrations were calculated as monthly mean values for February–May (spring), August–November (autumn), and February–November (growing season) for SOS, EOS, and LOS, respectively. ALAN is annual data and, thus, is applicable to all phenostages (SOS, EOS, and LOS). To save space, we referred to these variables as CO2 emissions, PM2.5 concentrations, and ALAN.
To determine the effects of the various factors driving vegetation phenology, we used PLS−SEM [49], a statistical method used to analyze complex causal networks and evaluate hypotheses about cause−effect relationships among predictor and response variables. Unlike traditional SEM, PLS−SEM works well with small sample sizes and effectively handles high multicollinearity [50]. In our model, a latent variable representing urban environmental stressors (ALCO) was constructed using two observed indicators—ALAN and CO2 emissions—and the remaining factors were treated as observed variables. ALAN and CO2 emissions, although directly measurable, are both widely recognized proxies for anthropogenic activities in urban areas. For instance, Castells−Quintana et al. analyzed over 1200 cities globally and demonstrated that ALAN, CO2, and PM2.5 collectively reflect key dimensions of urban expansion and intensity [51]. Specifically, ALAN was highlighted as a proxy for built−up area density and human activity, while CO2 and PM2.5 were recognized as outputs of urban metabolic processes and energy consumption [51]. Temperature, often elevated in urban areas due to the urban heat island effect, also serves as a widely acknowledged indicator of human−induced environmental modification in cities [52,53,54]. Based on this framework, our modeling approach is theoretically grounded and aligned with prior large−scale urban environmental studies. First, we standardized all response and predictor variables using the “scale” function in RStudio 4.2.3 (R Development Core Team, 2023). Second, we specified latent variables based on correlations among the environmental factors. We developed an initial model based on foundational assumptions and then assessed it using six standard evaluation criteria [55] (as listed in Table S2). If the model failed to meet one or more of these criteria, we refined the model by either modifying the structural paths or adjusting the combination of indicators used to construct latent variables. During this iterative process, we tested a total of 13 different latent variable configurations, as documented in Table S2. The final model, which includes the latent variable ALCO, was selected because it met all specified statistical thresholds across the six evaluation criteria, which represent the abstract concept of human activity impact. We have illustrated the above process as a flowchart (Figure S10). We implemented and evaluated the PLS−SEM using the “plspm” package (https://www.gastonsanchez.com/PLSPathModelingwithR.pdf, accessed on 4 February 2025) in RStudio 4.2.3 (R Development Core Team, 2023).

4. Results

4.1. Spatial Patterns of the Rate and Extent of Vegetation Phenological Responses to Urbanization

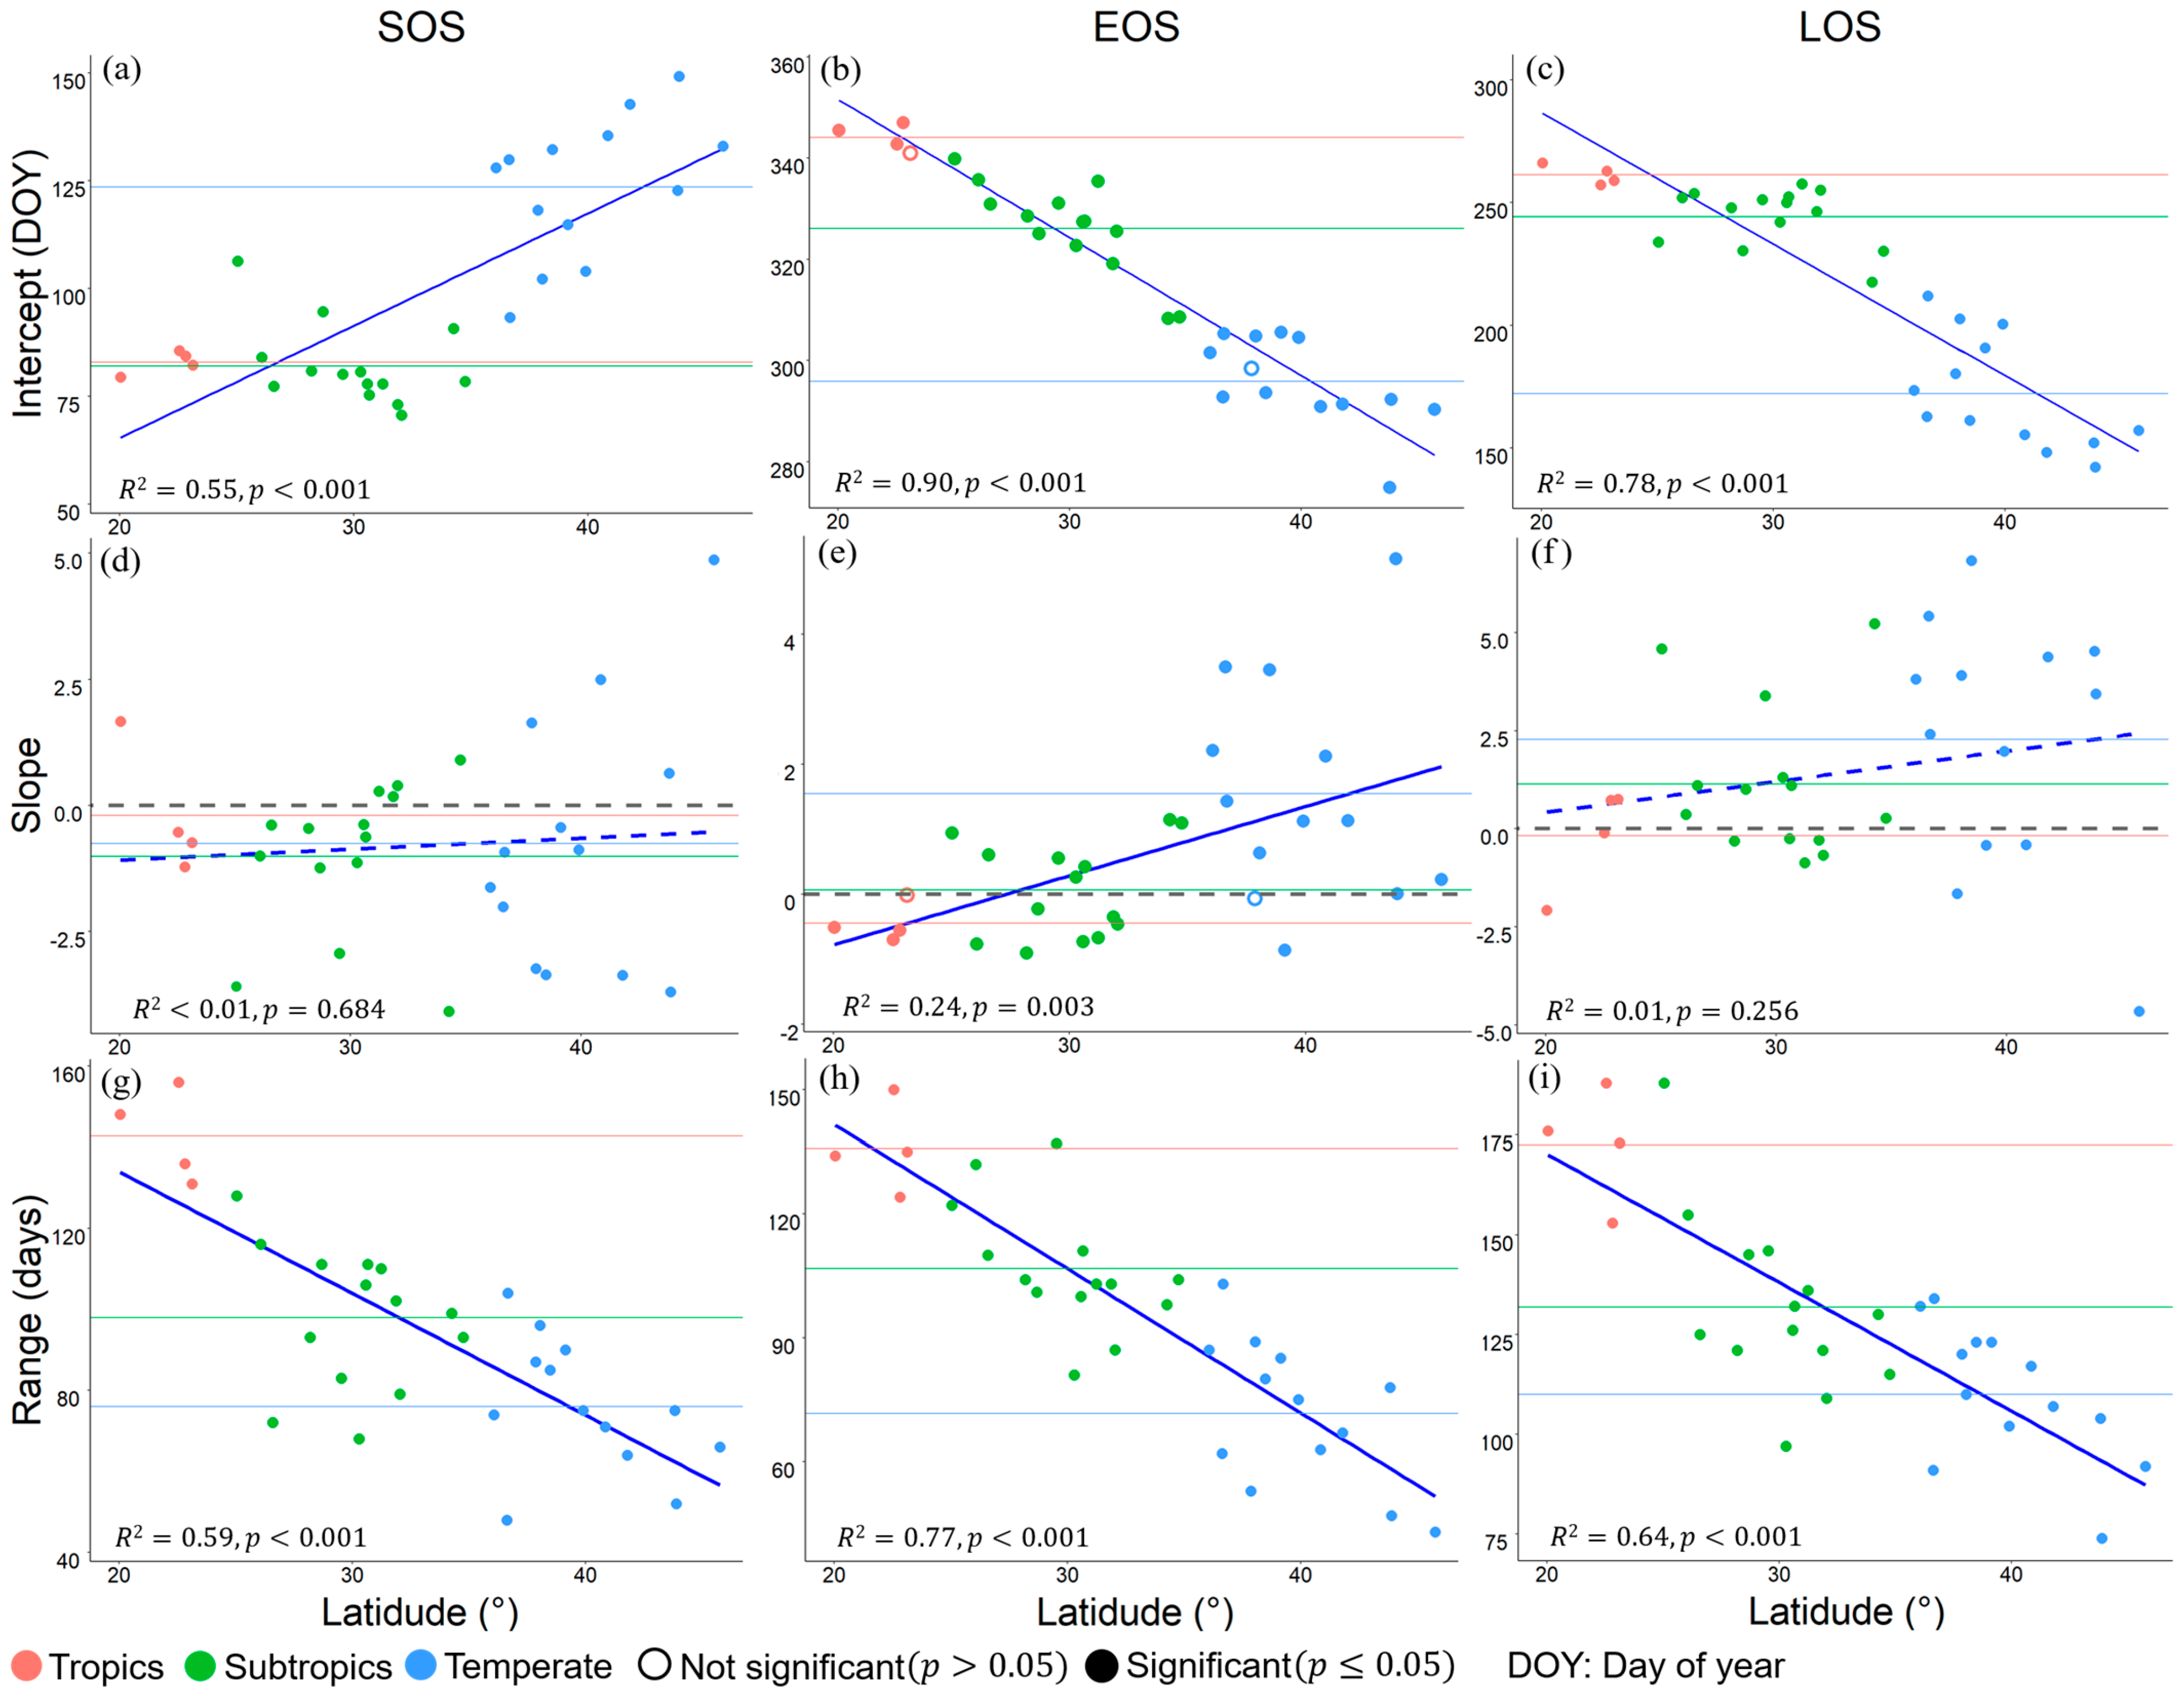
Our analysis of the spatial patterns of the rate and extent of vegetation phenological responses to urbanization identified significant linear relationships with latitude (p < 0.001; Figure 2), except for the slopes for SOS and LOS (p > 0.05; Figure 2d,f). Specifically, the intercepts increased with latitude for SOS but decreased for EOS, leading to a decrease in LOS (Figure 2a−c). The intercepts for SOS in low−latitude cities were more than 2 months (62 days) earlier than in high−latitude cities, while for EOS, they were 2 months (57 days) later, resulting in an extension of 4 months (124 days) in LOS. The slopes generally increased with latitude (Figure 2d−f), although this pattern was weak for SOS and LOS. In addition to the general latitudinal pattern, the slopes were negative for most cities for SOS (71%) but positive for EOS (65%) and LOS (65%). Range significantly decreased across all phenostages (Figure 2g−i). The average intercept, slope, and range for all phenostages generally followed the latitudinal pattern along the climatic gradient from tropical and subtropical to temperate, except for the slope for SOS. The average slope was negative for all three climatic zones, with tropical regions having a lower absolute slope (indicating a lower response rate) compared to the temperate and subtropical regions. These results suggest that SOS is delayed with increasing latitude when vegetation phenology is unaffected by urbanization, whereas EOS advances and LOS shortens. In contrast, the response rate of phenology to urbanization increases with latitude under the effect of urbanization, but its extent decreases.
We observed a general diagonal pattern along the gradients of monthly mean temperature and total precipitation, namely a lower intercept for SOS (Figure 3a), a higher intercept for EOS and LOS (Figure 3b,c), and a lower slope (Figure 3d−f) but a higher range for all phenostages (Figure 3g−i) for cities with higher total precipitation and monthly mean temperatures compared to those with lower values. This pattern suggests that plants in warmer and wetter regions experience an earlier SOS, a later EOS, and a longer LOS in the absence of the effects of urbanization than do those in colder and drier regions. Plants in warmer and wetter urbanized regions, however, tended to be less sensitive to urbanization but more vulnerable to such effects. The slopes in Figure 2d−f and Figure 3d−f varied greatly in direction (positive and negative) across latitudes and hydrothermal conditions. Specifically, the slope for EOS changed from positive to negative as monthly mean temperature and total precipitation increased (Figure 3e), suggesting that hydrothermal conditions may strongly affect the response of vegetation phenology.
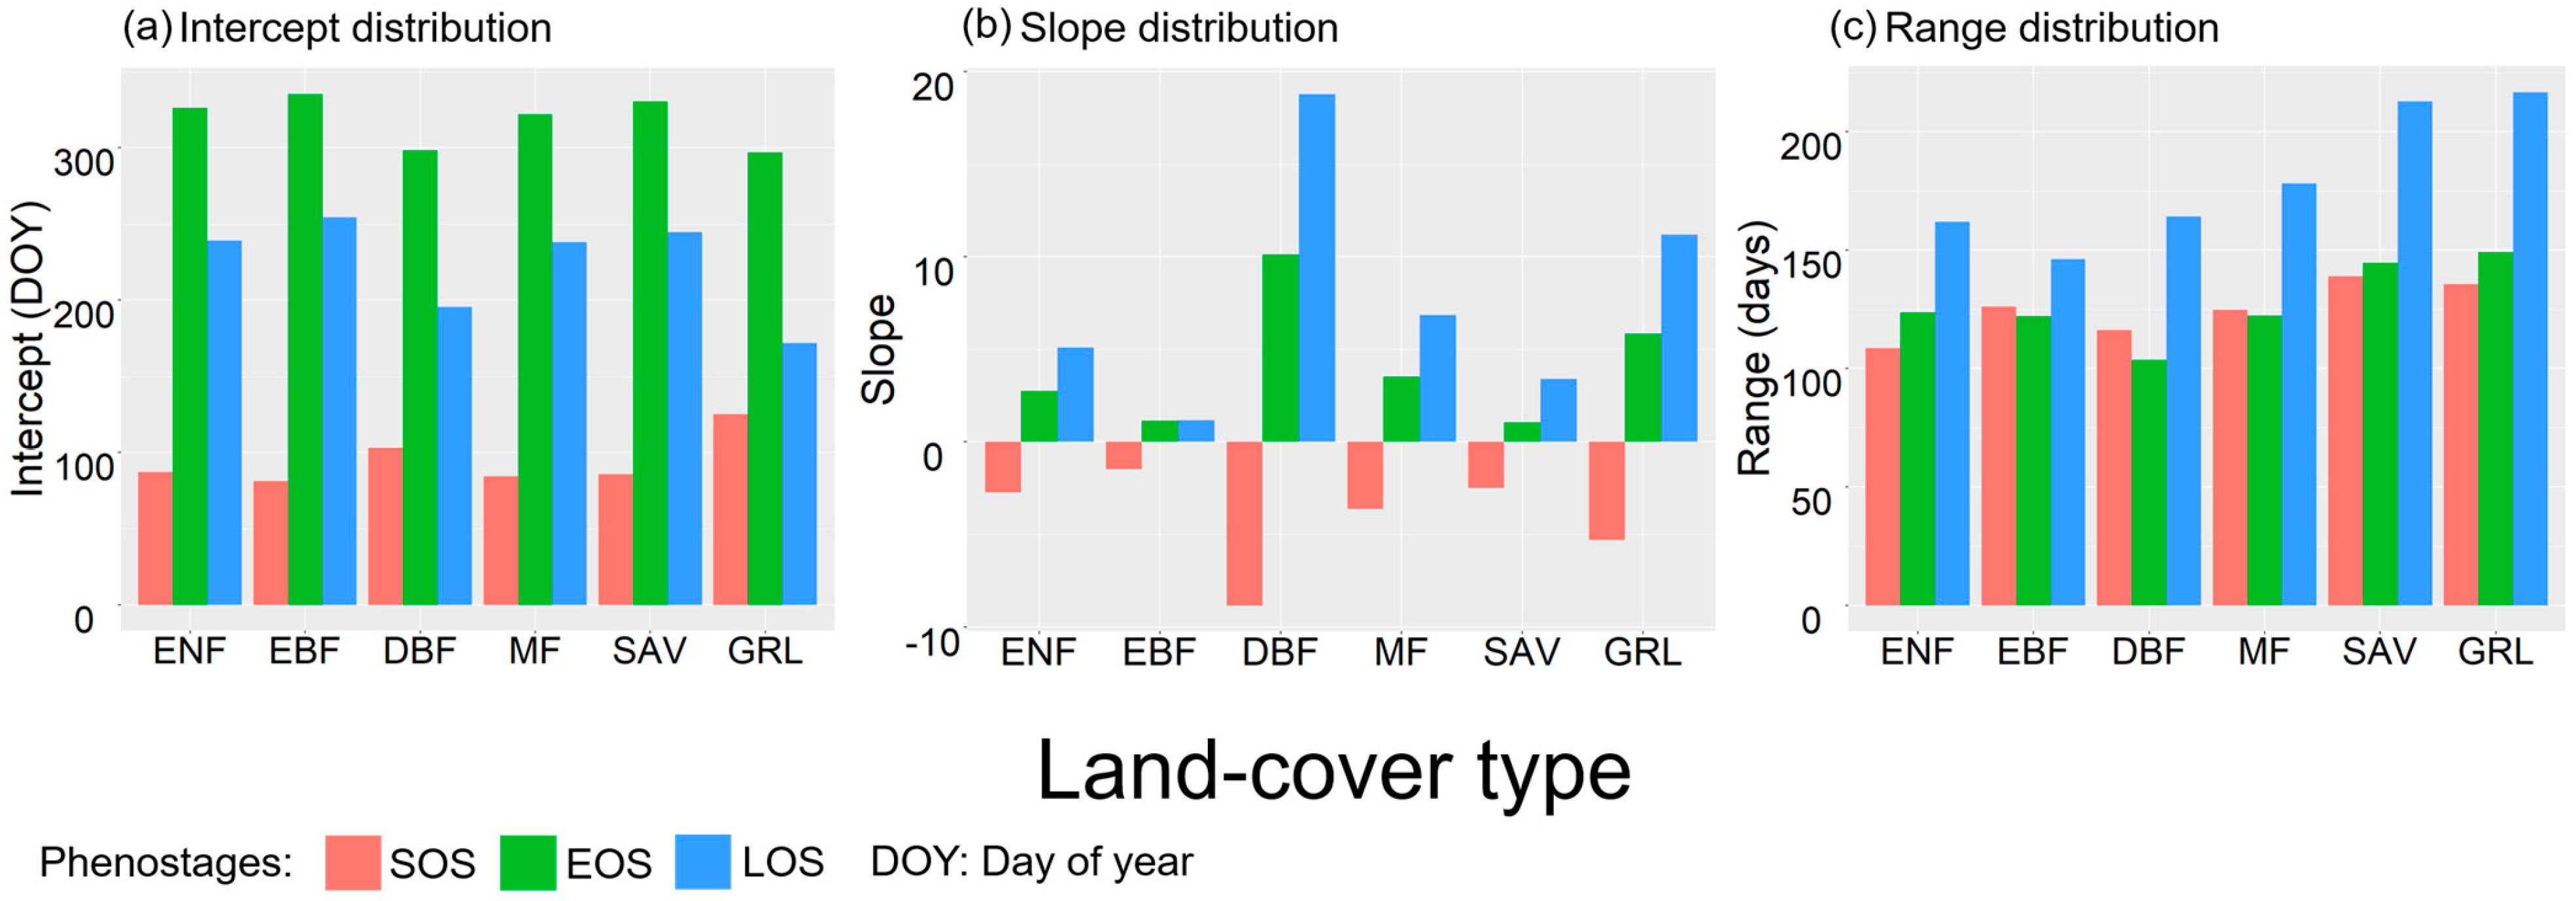
The rate and extent of vegetation phenological responses to urbanization also varied among the land−cover types (Figure 4). The intercept was lowest for SOS and highest for EOS and LOS for the evergreen needle and broadleaf forests, but the pattern was opposite for deciduous forests and grassland. The absolute slope across all three phenostages was highest for deciduous forest and grassland, followed by mixed forest, and was lowest for savanna and evergreen forest. The range was highest for grassland and savanna, followed by mixed forest, deciduous forest, and evergreen forest. In summary, evergreen needleleaf and broadleaf forests, mixed forests, and savannas experienced an earlier SOS and a later EOS without the effect of urbanization, leading to a longer growing season compared to grassland and deciduous forest. Deciduous forest and grassland were more sensitive to urbanization, and evergreen forest was the least sensitive and most stable.

4.2. The Rate and Extent of Vegetation Phenological Responses to Urbanization Based on Graded RND

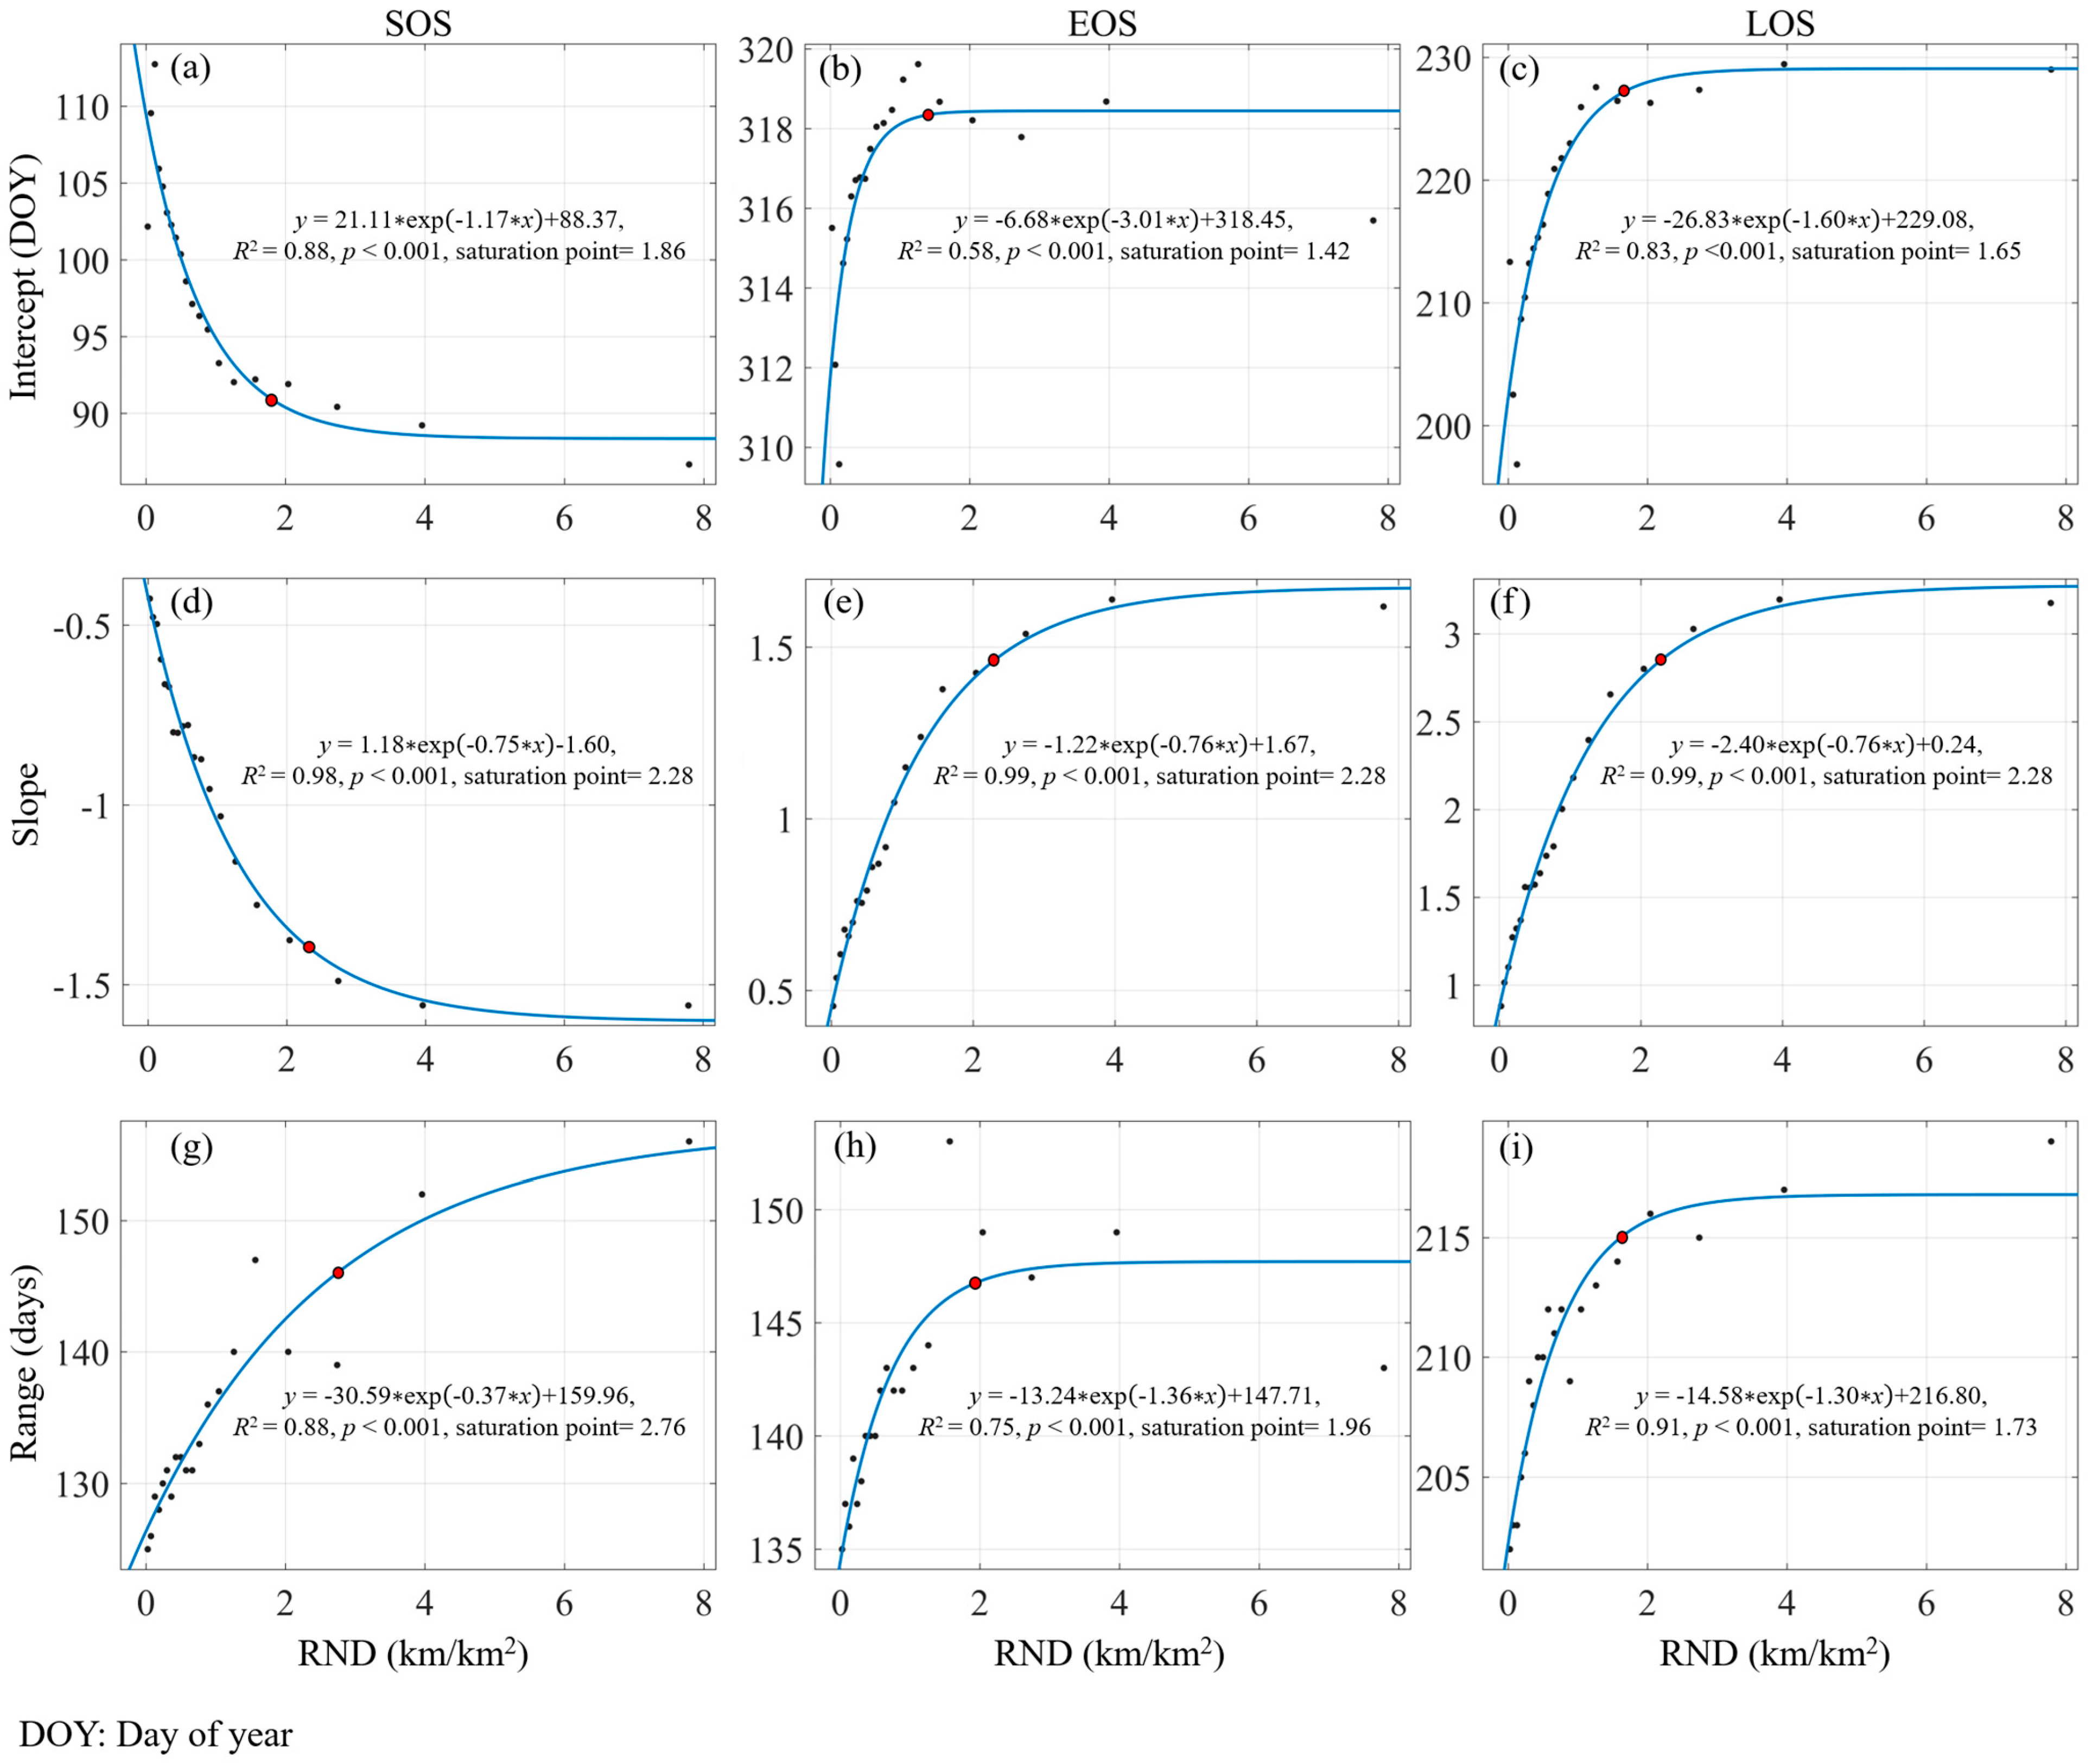
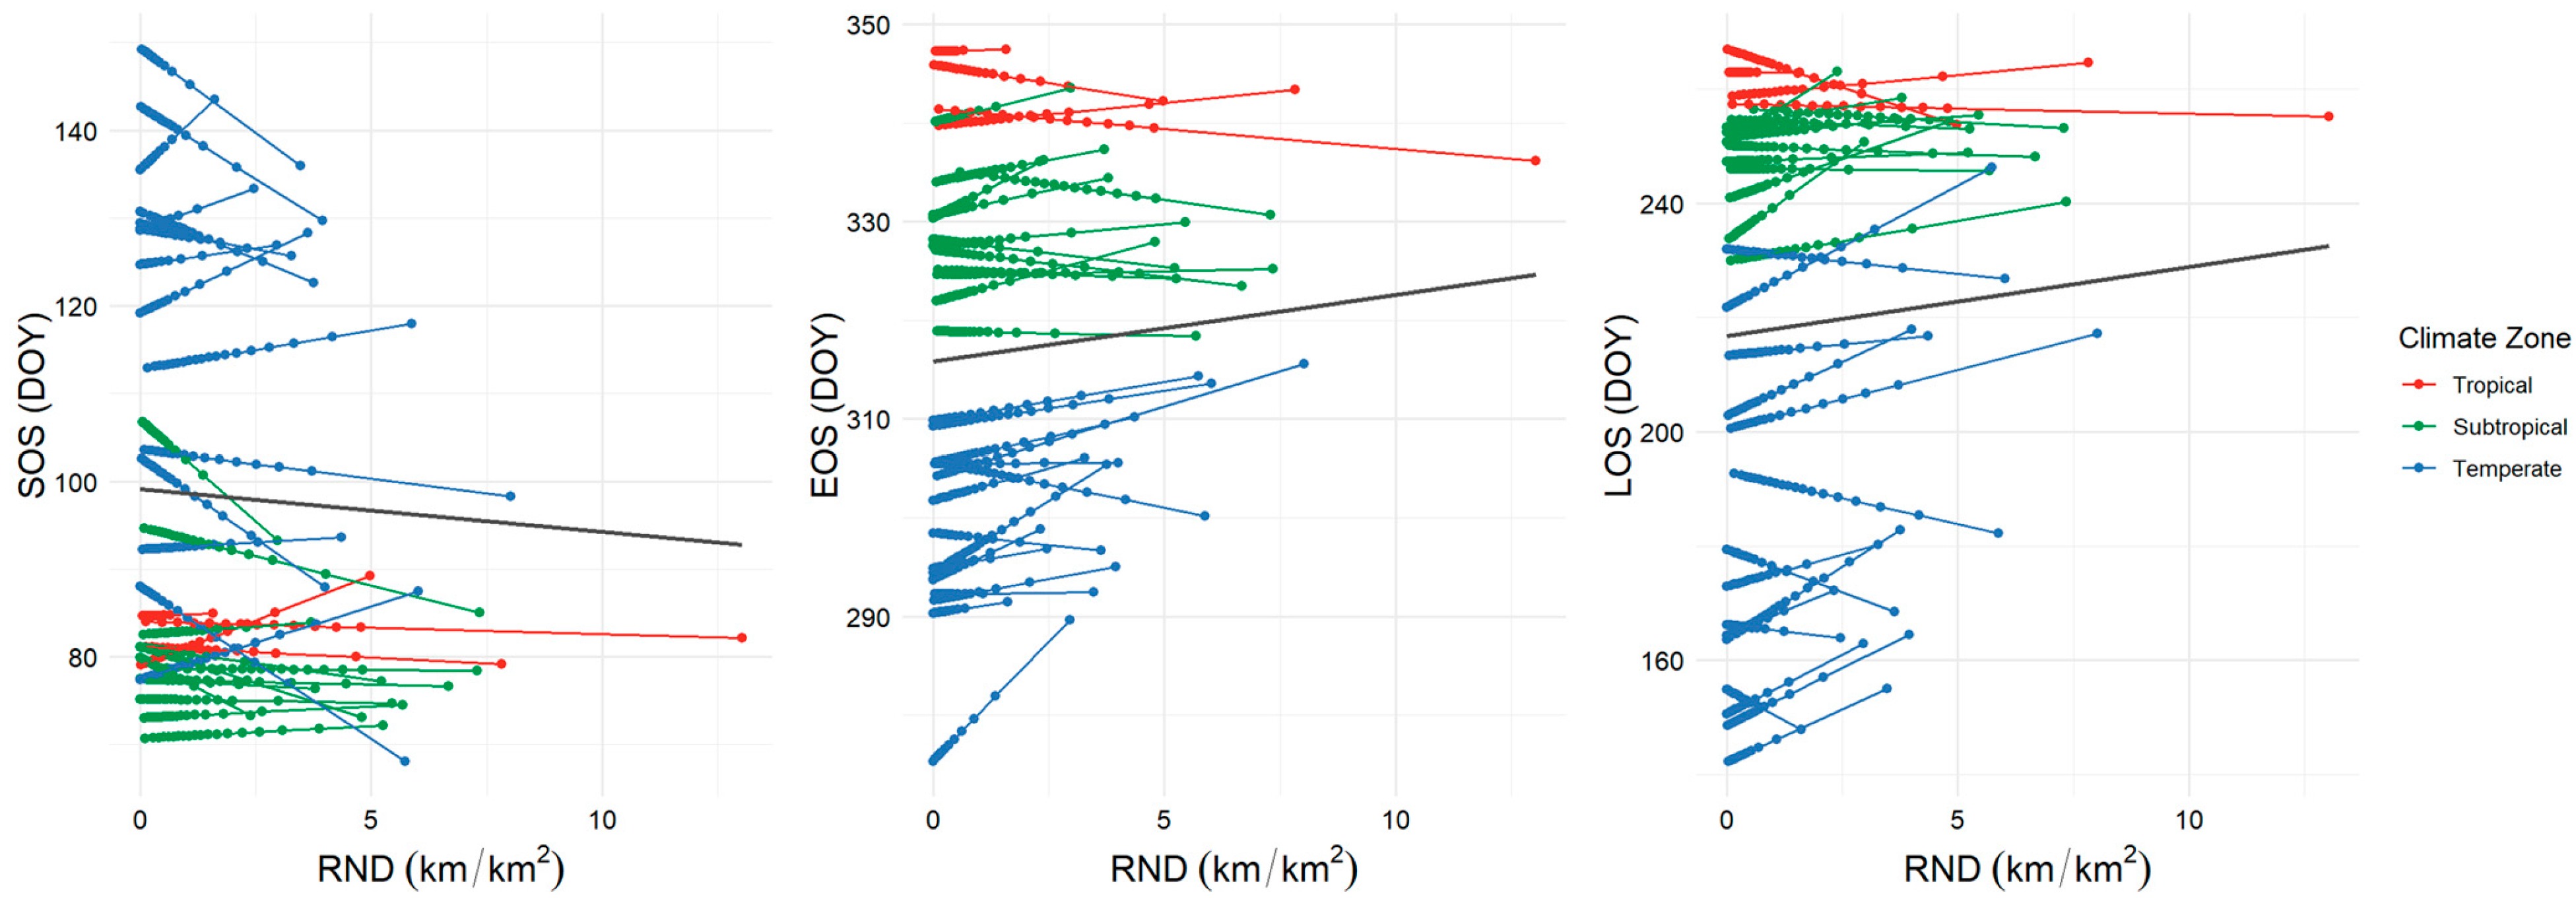
We qualified the rate and extent of vegetation phenological responses to urbanization across RND levels (n = 20) to minimize data collection and processing uncertainty. The results indicated that an exponential function provided a good fit, explaining over 58% of the variation in phenology (p < 0.001; Figure 5). We observed an initial rapid linear increase or decrease with RND, followed by a plateau as the response tended to saturate. Specifically, the decreasing intercept for SOS and increasing intercept for EOS and LOS suggest an earlier SOS, a later EOS, and an extended LOS with increasing urbanization. The intercept for SOS in areas with high RND was ~1 month (26 days) earlier than in areas with low RND, while it was ~0.5 months (10 days) later for EOS and ~1 month (33 days) longer for LOS. The decreasing slope for SOS (with predominantly negative values) and the increasing slopes for EOS and LOS (with predominantly positive values) suggest a higher response rate of phenology to urbanization, and the increasing range for all phenostages suggests a higher response extent under urbanization. The saturation point occurred near an RND of 2.02 ± 0.41 km/km2 (mean ± standard deviation), ranging from 1.42 to 2.76 km/km2 (15–18 levels), indicating that the impact of urbanization on phenology would become stable beyond this density threshold.
We compared the responses of vegetation phenology to urbanization across the 31 cities using the same RND levels (Figure 6). SOS generally tended to decrease, and EOS and LOS tended to increase as RND increased across most cities (by 65%), respectively. Hefei, however, deviated from this pattern for all metrics, likely due to large interannual variations, similar to Haikou, Shanghai, Nanjing, etc. (Figure S11). We examined residuals of the predicted SOS, EOS, and LOS across all cities (Figure S12). The model performs consistently well across regions with different climate zones (tropical, subtropical, temperate), and there is no indication of systematic bias in any particular group of cities, such as Haikou or Shanghai. This suggests that residual−based diagnostics alone may not fully capture anomalous phenological responses and that the interannual response rate in phenology may be a stronger signal of model instability than residual magnitude alone. The intercepts of the fitted lines increased for SOS and decreased for EOS and LOS along the latitudinal gradient from low− to high−latitude cities, and the difference in intercept between low− and high−latitude cities exceeded two months for SOS and EOS and more than four months for LOS.

4.3. Drivers Underlying the Rate and Extent of Vegetation Phenological Responses to Urbanization

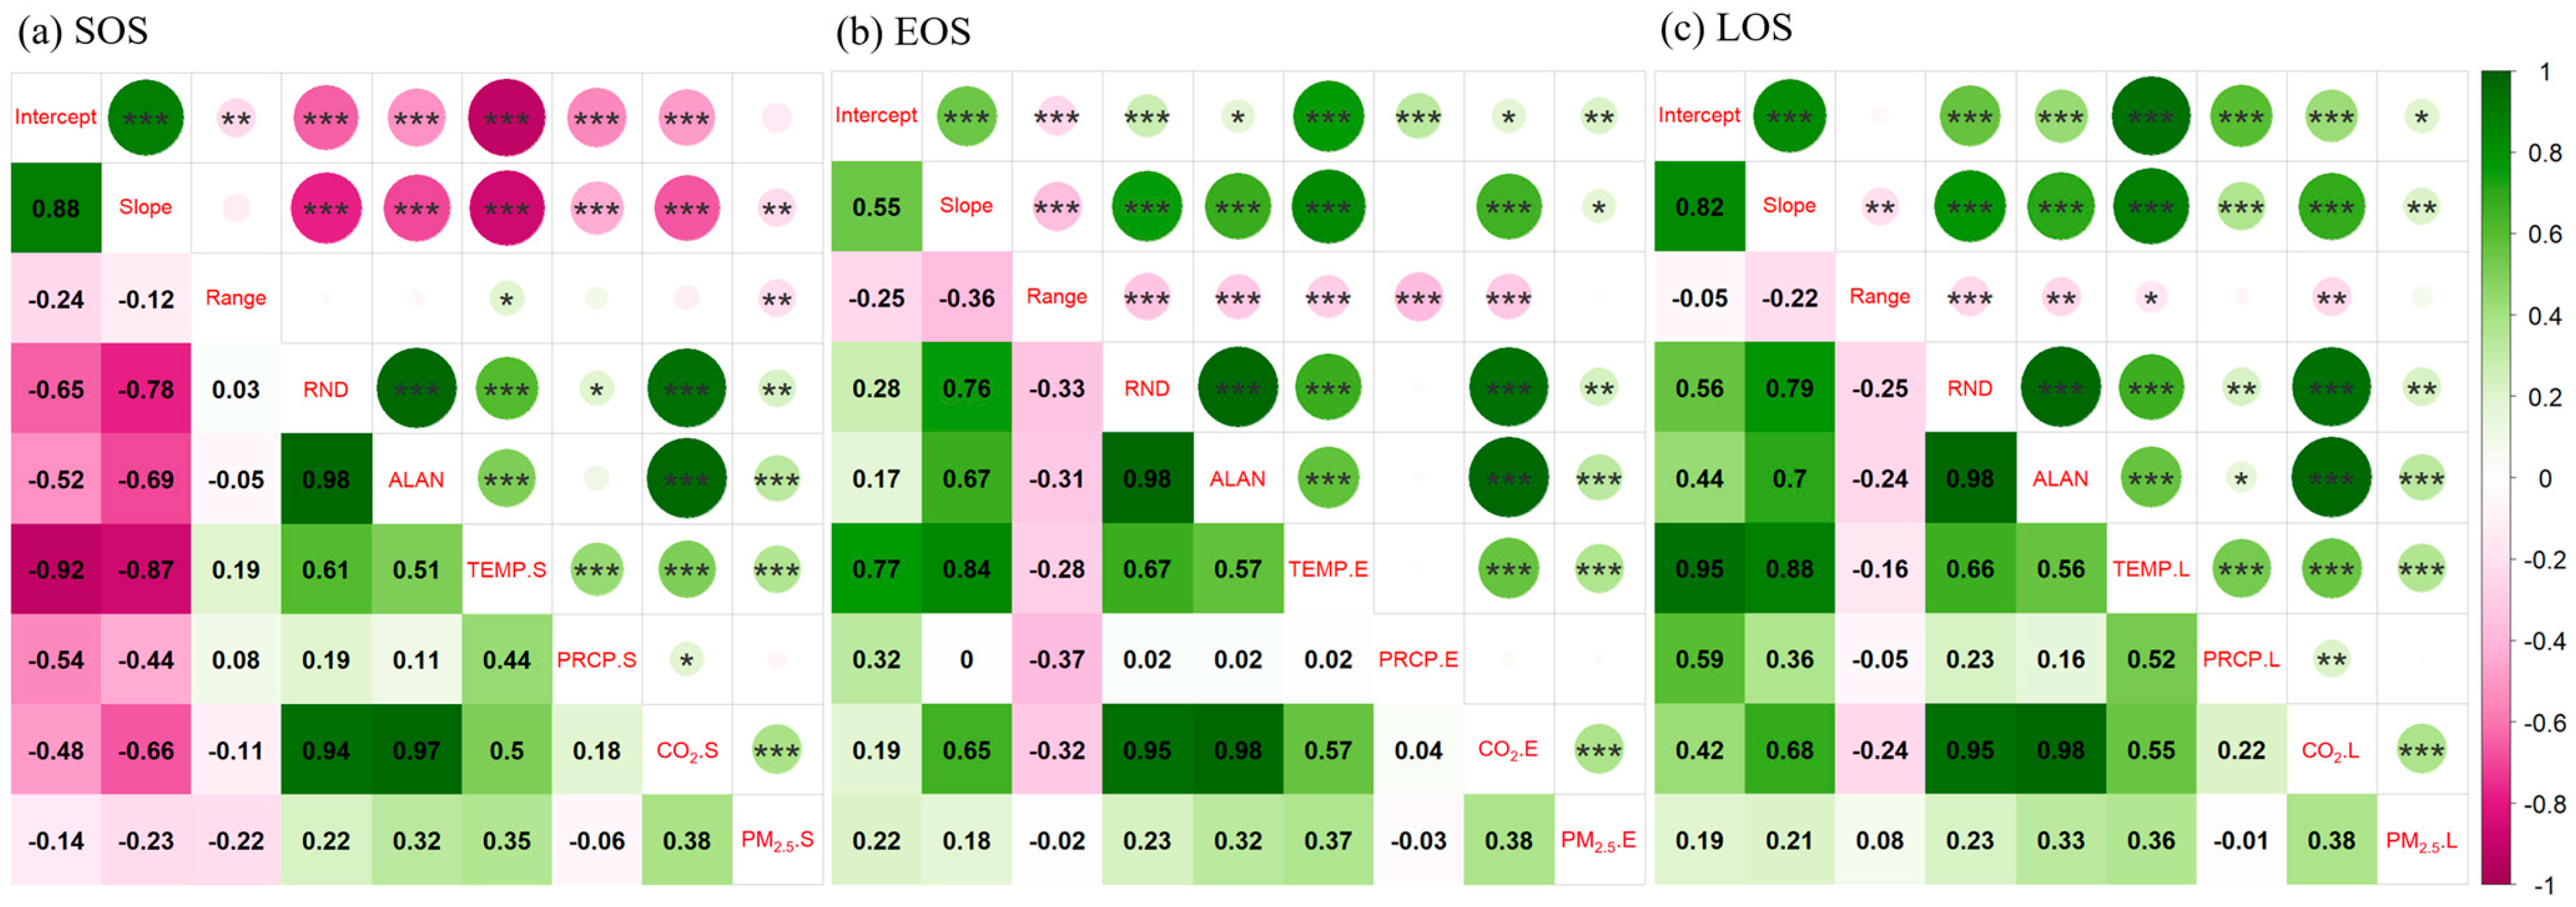
The correlation analysis of the phenological response metrics (intercept, slope, and range), RND, and five environmental factors (monthly mean temperature, total precipitation, ALAN, CO2 emissions, and PM2.5 concentrations) across 20 RND levels from 2014 to 2022 (n = 180) is shown in Figure 7. Most factors were generally significantly correlated with the three phenological response metrics, except SOSintercept with PM2.5.S, SOSrange with PRCP.S and CO2.S, EOSslope with PRCP.E, EOSrange with PRCP.E, and LOSrange with PRCP.L and PM2.5.L. Specifically, RND, monthly mean temperature, ALAN, CO2 emissions, and total precipitation were strongly correlated with the intercepts and slopes (p < 0.05), except that the slope for EOS was weakly correlated with total precipitation (p > 0.05). The range for EOS was strongly correlated with the environmental factors except for PM2.5 concentrations (p > 0.05); the range for SOS was significantly correlated only with PM2.5 concentrations and monthly mean temperature (p < 0.05); and the range for LOS was not significantly correlated with total precipitation and PM2.5 concentrations (p > 0.05). All environmental factors were negatively correlated with the intercept and slope for SOS (R < 0) but positively correlated with those for EOS and LOS (R > 0). Most factors were negatively correlated with range, except monthly mean temperature and total precipitation for the SOS range, and PM2.5 concentrations for the LOS range (R > 0). Most of the environmental factors were significantly correlated with RND, except for total precipitation for EOS. RND was notably strongly correlated with ALAN, CO2 emissions, and monthly mean temperature (R > 0.61, p < 0.001). Both PM2.5 concentrations and total precipitation were significantly correlated with RND, with a slightly stronger correlation for PM2.5 concentrations (R = 0.22−0.23, p < 0.05) than for total precipitation (R = 0.19−0.23, p < 0.05). Of the five environmental factors, ALAN, monthly mean temperature, CO2 emissions, and PM2.5 concentrations exhibited strong pairwise correlations (R = 0.32−0.98; p < 0.05). These results suggest intricate and complex relationships between environmental changes driven by urbanization and the response rate of phenology.
We next used PLS−SEM to evaluate the causal relationships between intercept, slope, and range for all three phenostages and RND, together with four environmental latent variables, as follows: monthly mean temperature, total precipitation, ALCO (i.e., a combined latent variable for ALAN and CO2 emissions), and PM2.5 concentrations (Figure 8). The models indicated that RND had strong direct effects on all environmental variables, especially on ALAN and CO2 emissions (β = 0.97, p < 0.05), and monthly mean temperature (β = 0.61−0.68, p < 0.05). All environmental variables increased as RND increased. Most of the environmental variables significantly directly affected the phenological response metrics, although their influence differed with the specific metric affected, the magnitude of the effect, and its direction. For example, the monthly mean temperature was the most influential driver for SOS, negatively affecting both the intercept and slope (β = −0.87 and −0.69, p < 0.05) but positively affecting the range (β = 0.28, p < 0.05). Total precipitation and PM2.5 concentrations also had substantial effects on the intercept (β = −0.18 and 0.20, p < 0.05), and ALAN, CO2 emissions, and PM2.5 concentrations significantly influenced both the slope (β = −0.37 and 0.15, p < 0.05) and range (β = −0.17 and −0.31, p < 0.05). Monthly mean temperature was the most influential driver of changes to the intercept and slope for EOS (β = 0.99 and 0.65, p < 0.05), and total precipitation was the most influential factor affecting the range (β = −0.37, p < 0.05). ALAN and CO2 emissions also significantly affected all three EOS metrics. Monthly mean temperature, ALAN, and CO2 emissions significantly influenced the intercept and slope for LOS, and ALAN, CO2 emissions, and PM2.5 concentrations played major roles in determining the range. Taken together, among these environmental variables, monthly mean temperature was generally the most influential driver of the intercept (β = −0.87, 0.99, and 0.94, p < 0.05). Monthly mean temperature, ALAN, and CO2 emissions were the strongest drivers of slope across all phenological timing metrics (|β| = 0.31−0.69, p < 0.05). PM2.5 concentrations, ALAN, and CO2 emissions consistently influenced range (|β| = 0.12−0.31), although total precipitation also had the strongest influence on the range for EOS (β = −0.37, p < 0.05). RND had significant indirect effects on phenology via its influence on the environmental variables. In addition to these direct and indirect effects, the environmental variables were strongly correlated, such as between monthly mean temperature and total precipitation, and between monthly mean temperature, total precipitation, and PM2.5 concentrations.

5. Discussion

5.1. Spatial Patterns of the Rate and Extent of Vegetation Phenological Responses to Urbanization

We observed substantial spatial heterogeneity in the rate and extent of vegetation phenological responses to urbanization along latitudinal, hydrothermal, and land−cover gradients using the metrics slope, intercept, and range (Figure 2, Figure 3 and Figure 4). The slope indicated that most cities had negative values for SOS and positive values for EOS and LOS, demonstrating advanced leaf green−up, delayed leaf dormancy, and an extended growing season with urbanization, but some cities had the opposite trend with positive values for SOS (29%) and negative values for EOS (35%) and LOS (35%; Figure 2). This percentage aligns with previous studies [3,56]. For example, Zhou et al. reported opposite trends of 16, 25, and 16% for SOS, EOS, and LOS across 32 cities in China from 2007 to 2013 [3]. Vegetation phenology was more sensitive to the effects of urbanization in colder, drier regions at higher latitudes, consistent with previous findings [57,58]. Moreover, most of these studies focused on temperate regions, with few covering subtropical and tropical areas [59,60,61]. Our results complemented these findings by incorporating data from subtropical and tropical cities. In addition to the response rate of phenology to urbanization, we also found greater phenological variation in warmer, more humid regions at low latitudes, indicated by the range. This variation may have been due to the higher species diversity in subtropical and tropical forests, where interspecific differences in phenology are not negligible [62,63]. Thus, these findings enhance our understanding of the response rate of phenology to urbanization and climate change, particularly in underexplored subtropical and tropical regions.

5.2. Nonlinear Rate and Extent of Vegetation Phenological Responses to Urbanization Using an Analysis of Graded RND

An analysis of graded RND identified a nonlinear phenological response to RND across all phenological response metrics, with exponential−function fitting curves reaching saturation at RND levels of 15–18 (Figure 5). To assess the uncertainty of the saturation points, we employed the bootstrap resampling method (with n = 1000) (Figure S14, Table S3). The resulting bootstrap mean was very close to the original (non−resampled) estimate, and all saturation points fell within the central region of the 95% confidence interval. The standard deviations of the bootstrap results ranged approximately from 9.05% to 24.88% of the mean, indicating moderate uncertainty but overall robustness of the estimation. Moreover, to assess the sensitivity of the saturation point estimation to the number of bins, we tested multiple binning schemes for RND, ranging from 10 to 40 equal−frequency bins (10, 20, 30, and 40) (Figure S15a). The results showed that the saturation points were generally stable across different bin numbers (Figure S15), supporting the robustness of our estimates.
Our findings demonstrate that phenology is highly sensitive to urbanization, consistent with previous studies that attributed this response rate to environmental changes caused by urbanization, such as the effect of UHIs [29,64,65]. Our results also suggest that urbanization has a strong influence on phenology during the early stages of urban expansion, but this effect reaches a plateau as urbanization continues, even though urban areas continue to grow substantially. Based on this pattern, we cautiously suggest that urban planning strategies aimed at minimizing ecological disruption may benefit from paying closer attention to early−stage urban development. Our findings highlight RND as a useful metric for assessing the effect of urbanization on phenology. RND analysis offers two main advantages. First, it provides a continuous numerical measure of urbanization, where higher RND values indicate a stronger effect of urbanization on each grid. Second, RND can avoid the mistakes caused by the irregularity of urban layouts. We used a comparative analysis with commonly used methods for URGs, which used discrete distance intervals from rural areas to the urban boundaries to measure urbanization [3,8,66,67]. The results indicated that using continuous metrics for each grid provided a more precise and continuous gradient of the effects of urbanization (Figure S16), which is particularly beneficial for capturing spatial heterogeneity. Although URGs are widely used to measure urbanization intensity, their major limitation lies in the inability to accurately capture the spatial heterogeneity. In most cities, urban development is spatially asymmetric.

5.3. Mechanism Underlying the Rate and Extent of Vegetation Phenological Responses to Urbanization

To identify the key environmental drivers of the responses of vegetation phenology to urbanization, we used PLS−-SEM to examine the relationships between the three vegetation phenological response metrics (intercept, slope, and range), RND, and five environmental factors (monthly mean temperature, total precipitation, ALAN, CO2 emissions, and PM2.5 concentrations).
To ensure the robustness of the latent variable construction, we tested 13 alternative combinations of environmental indicators (Table S2). Only the pairing of ALAN and CO2 fulfilled all requirements for valid latent constructs (e.g., factor loadings > 0.7, CR > 0.7, AVE > 0.5). When testing the environmental indicators as independent variables, the model failed to generate goodness of fit (GOF) and produced several abnormal path coefficients, indicating that this model was insufficient for capturing the underlying construct in a stable and valid manner. This result supports the integration of these two variables into a unified latent factor (ALCO) in the final model. Despite the statistically significant and interpretable results obtained from the PLS−SEM model, we acknowledge several sources of uncertainty that may affect the robustness of our findings. First, although all data sources were carefully harmonized, the environmental and phenological indicators were derived from multiple years (2014–2022) and may be affected by interannual variability, potentially introducing measurement noise into the model. Second, alternative modeling approaches, such as random forest or other machine learning algorithms, could potentially yield different results due to differences in model structure and sensitivity to variable interactions. To address potential model uncertainty, we tested a random forest (RF) model to validate the consistency of our findings. The results showed similar patterns in the relative importance of environmental predictors, suggesting that our conclusions are not overly dependent on a single modeling framework (Figure S17). These sources of uncertainty highlight the need for cautious interpretation of the model results and underscore the importance of employing complementary modeling approaches, such as random forest, to validate and reinforce the reliability of the findings from the PLS−SEM framework.
Our findings indicated that RND significantly influenced the environmental factors, which in turn significantly affected vegetation phenology (Figure 8). These effects, however, varied in both magnitude and direction. Temperature, induced by UHIs effects, was the most influential environmental factor when urbanization was minimal, demonstrating that phenology was most sensitive to temperature (β = −0.87, 0.99, 0.94 for SOS, EOS, and LOS; indicated by the intercept in Figure 8), with urbanization, monthly mean temperature, ALAN, and CO2 emissions significantly affecting the response rate of phenology (|β| = 0.31–0.69; indicated by the slope in Figure 8). PM2.5 concentrations, total precipitation, and ALAN and CO2 emissions primarily influenced the response for SOS (|β| = −0.31), EOS (|β| = −0.37), and LOS (|β| = −0.25; indicated by the range in Figure 8), respectively.
Our findings are consistent with previous studies in highlighting urban temperature and ALAN as key drivers of urban vegetation phenology. Urban heat islands (UHIs) accelerate heat accumulation, advancing the thermal growing degree days (GDD) threshold required for budburst and leaf expansion, especially in early spring [53]. The stronger EOS delay is likely due to prolonged thermal support for photosynthesis and reduced frost risk in autumn [68]. ALAN tends to advance spring events such as budburst and delay autumnal senescence, thereby extending the length of the growing season [7]. These effects are primarily driven by the inhibition of chlorophyll degradation and altered hormonal signaling in plants [69]. However, our study provides additional insights by incorporating CO2 emissions and PM2.5 concentrations, and total precipitation, along with their interactions, demonstrating their strong influence on urban vegetation phenology, which has been relatively underexplored. For example, previous research has found that vegetation phenology was sensitive to elevated CO2 at the global scale, leading to earlier spring onset and delayed autumnal senescence [8,70], thus enhancing ecosystem carbon uptake [4,5,71,72], but the impact of vegetation phenology in urban regions remains mostly untested. Our results suggest that CO2 emissions interact with ALAN, thereby strongly affecting phenology (|β| = 0.31–0.37; p < 0.05; indicated by the slope in Figure 8). A recent study also reported a positive correlation between PM2.5 concentrations and SOS [25], consistent with our findings. The effects of PM2.5 concentrations on EOS and LOS, however, remain underexplored. PM2.5 concentrations showed a positive effect on the slope of SOS with respect to urbanization intensity (β = 0.15; p < 0.05; Figure 8), indicating that PM2.5 mitigates the advancing effect of urbanization on SOS. Conversely, PM2.5 had a negative effect on the slope of EOS (β = −0.20; p < 0.05; Figure 8), suggesting it reduces the delaying effect of urbanization on EOS. Together, these effects led to a decreased length of the growing season (LOS) slope (β = −0.21; p < 0.05; Figure 8), likely due to its toxic and growth-inhibiting effects on vegetation [28]. These mechanisms do not act in isolation. The delaying effect of ALAN may be weakened by high PM2.5 concentrations that inhibit growth [69,73], while elevated CO2 may partially counterbalance the negative effects of PM2.5 through enhanced carbon assimilation [74]. Thus, our study provides a unique, comprehensive understanding of how multiple environmental factors interact to affect urban vegetation phenology, highlighting the importance of considering both individual and combined effects of environmental changes driven by urbanization.
By creatively introducing three distinct metrics—benchmark phenology (influenced least by urbanization), and the rate and extent of vegetation phenological responses to urbanization—we provide a comprehensive framework for characterizing different aspects of the impact of urbanization on phenology. Our findings indicated that different environmental factors influenced different aspects of the phenological responses. For example, PM2.5 concentrations increased the response rate of SOS, decreased the response rates of EOS and LOS, decreased the response extent of SOS, and increased the response extent of EOS and LOS. Total precipitation slightly decreased the response rate of all phenological timing metrics but strongly decreased the response extent of EOS. Monthly mean temperature, ALAN, and CO2 emissions strongly influenced the response rate but had a relatively low impact on response extent. These differentiated effects emphasize the complexity of environmental changes induced by urbanization and their consequences for the dynamics of vegetation phenology. Understanding such mechanisms underlying the rate and extent of vegetation phenological responses to urbanization could help improve predictions of the responses of urban vegetation to ongoing climate change and urban expansion while informing policies to mitigate the negative impacts of urbanization on ecosystem stability, carbon dynamics, and ecosystem services, ultimately supporting more sustainable and climatically resilient cities.

5.4. Caveats and Future Directions

Our study also identified at least two steps that need to be considered next for future advances. First, while we considered various environmental factors associated with urbanization (e.g., temperature, ALAN, PM2.5), we did not incorporate biotic factors such as species composition or functional types, which are also known to influence phenological activity [62,63]. This omission was primarily due to the highly managed and frequently altered nature of urban vegetation, including ornamental plantings and exotic species invasions, which require fine−scale, species−level observations that were beyond the scope of this study. Future research incorporating such biotic information will be crucial for refining our understanding of phenological patterns in urban ecosystems. Thus, we recommend integrating species−inventory data from field or drone surveys in future studies to more comprehensively evaluate the effects of individuals and species on urban phenology. Second, we used publicly available data with the highest resolution, but the spatial resolution (500–1000 m) remained relatively coarse, which may introduce uncertainty in distinguishing between land−cover types, particularly in highly fragmented or mixed land cover areas, thus affecting the quantitative evaluation of urban phenology. In this study, we addressed this issue by applying quality filters and aggregating data into several levels. Nonetheless, the integration of finer−resolution satellite data, such as PlanetScope data [75,76], together with field meteorological data and species−inventory data, offers great potential for identifying the underlying mechanisms and broader implications of urban phenology. Third, temporal limitations of the road network dataset (2014–2022) may constrain the detection of long−term urbanization effects on vegetation phenology. While this period captures substantial recent urban expansion across China, it may not fully reflect the cumulative or lagged effects of urban development that began earlier. As such, the conclusions drawn from this study should be interpreted in the context of recent and ongoing urbanization, rather than long−term historical trends. Future research incorporating longer time series, if such data become available, would be valuable for assessing legacy effects and temporal shifts in urban–phenology relationships. Although the PLS−SEM model demonstrated relatively strong explanatory power for the intercept and slope of phenological responses, the explained variance for the range component was considerably lower. This indicates that the response extent to urbanization across cities may be influenced by additional factors not included in the current model framework. Potentially relevant variables could include vegetation species composition, soil moisture or fertility [77], or local landscape fragmentation, all of which may affect the stability or fluctuation of phenological stages. These factors are challenging to capture at a national scale but may be critical for explaining the spatial variation in phenological range. Future research could benefit from integrating finer−scale ecological or biophysical variables, which may help account for this unexplained variance and further clarify the mechanisms underlying phenological dynamics in urban environments.

6. Conclusions

We assessed the rate and extent of vegetation phenological responses to urbanization across 31 cities in China using slope and range metrics derived from linear regression models between RND and three phenostages (SOS, EOS, and LOS). To identify the key underlying drivers, we used a PLS−SEM model incorporating five environmental variables, as follows: monthly mean temperature, total precipitation, ALAN, CO2 emissions, and PM2.5 concentrations. Our findings revealed substantial spatial heterogeneity across latitudinal, hydroclimatic, and land cover gradients. Notably, we identified a nonlinear response pattern with a distinct, consistent threshold across all phenological response metrics and phenostages, suggesting that urbanization effects are not uniform but vary with urban development intensity. Additionally, in contrast to previous studies that primarily focused on monthly mean temperature, total precipitation, and ALAN, our results highlight the significant role of CO2 and PM2.5 in shaping the rate and extent of vegetation phenological responses to urbanization. Understanding the patterns and mechanisms underlying the rate and extent of vegetation phenological responses to urbanization can help enhance predictions of vegetation responses to climate change using cities as natural laboratories and inform sustainable urban planning strategies to mitigate the adverse impacts of urbanization on ecosystem services and biodiversity.

Supplementary Materials

The following supporting information can be downloaded at: https://www.mdpi.com/article/10.3390/rs17162758/s1, Figure S1: The boxplots of the absolute values of SOS, EOS, and LOS for 31 cities; Figure S2: Histogram showing the distribution of R2 from linear regressions between road network density (RND) and impervious proportion in 20 RND levels across 31 major cities in China; Figure S3: Raw remote sensing image of the start of season (SOS) across 31 major cities in China; Figure S4: All remote sensing datasets used in the analysis of Beijing were acquired for 2022, while the environmental variables are from May 2022; Figure S5: Example of extracting the intercept, slope, and range from a linear regression analysis of EOS and RND in Beijing; Figure S6: Comparison between range and standard deviation for SOS, EOS, and LOS across the 31 cities; Figure S7: Sensitivity test of binning schemes in the heatmap visualization of SOSintercept. (a) Coarse binning; (b) moderately coarse; (c) the binning scheme used in the main text; and (d) excessive binning. While the overall spatial patterns remain consistent across different discretizations, excessive binning (d) introduces data sparsity and instability, whereas fewer bins (a) obscure finer spatial variation. The selected scheme (c) balances detail and interpretability; Figure S8: Illustration of the saturation point calculation. The blue curve represents the fitted exponential function to the data, the orange line shows the linear regression fit and the red dot indicates the saturation point; Figure S9: Comparison of exponential, logarithmic and piecewise linear fits between RND and phenological response metrics; Figure S10: Schematic illustration of the iterative model development process. An initial structural model was constructed based on theoretical assumptions and evaluated against six standard criteria (listed in Table S2). If criteria were not met, the model was refined by adjusting paths or reconfiguring latent variables. A total of 13 latent variables were tested (see Table S2), and the final model was selected based on optimal statistical performance across all evaluation metrics; Figure S11: Scatter plot showing the rising proportion of RND and the coefficient of variation (CV) of phenostages for SOS (a), EOS (b), and LOS (c) from 2014 to 2022 across 31 major cities in China. The rising proportion of RND was calculated as the difference between RND in 2022 and 2014, divided by the RND in 2014. CV was calculated as the interannual standard deviation divided by the mean of phenostages from 2014 to 2022. Blue points represent cities with a consistent trend in their specific linear model, matching the general trend (same sign of slope) across all cities. Red points, which deviate from the general trend (opposite sign of slope), are concentrated in the red boxes with large CVs; Figure S12: Residual Distribution by City; Figure S13: Intercepts and slopes represent phenological responses to RND estimated using linear mixed−effects models (LMM) across 31 major cities; Figure S14: Bootstrap distribution (n = 1000) of the estimated saturation point for the phenological process metrics; Figure S15: (a) Distribution of saturation points estimated under different binning schemes (10 to 100 bins, in increments of 10). For each scheme, nine saturation points were calculated based on intercept, slope, and range values of SOS, EOS, and LOS. (b) (c) (d) Exponential fitting curves and saturation points for SOS phenology metrics (intercept, slope, and range) under different RND binning schemes (10, 20, 30, and 40 bins); Figure S16: Comparison of R2 values derived from linear regressions of the phenostages (SOS, EOS, and LOS) against the characteristics of urbanization (RND grades vs urban−rural gradients (URGs)) across the 31 major cities in China. The urban–rural gradient was defined based on concentric buffer zones around the urban core [3]. Specifically, we used seven distance−based buffers: 0–1 km, 1–2 km, 2–5 km, 5–10 km, 10–15 km, 15–20 km, and 20–25 km. (a) Boxplots of the R2 values for SOS, EOS, and LOS, where ‘RND’ represents RND grade, ‘URG’ represents the URGs, and ‘.S’, ‘.E’, and ‘.L’ represent SOS, EOS, and LOS, respectively. The line inside each box represents the median, while the box edges indicate the interquartile range (IQR). The whiskers extend to the smallest and largest values within 1.5 times the IQR from the box edges. (b) Histogram of the distribution of the differences in R2 calculated by subtracting R2 for URGs from the RND grades, indicating that 65.9% of the values have a higher R2 for the RND grades than for the URGs; Figure S17: Random Forest (RF) model is used to independently assess the importance of environmental factors on phenological response metrics. The relative variable importance derived from Random Forest were highly consistent with the path coefficients from PLS−SEM, indicating that both models identify similar key drivers. Furthermore, the explained variance (R2 values) obtained from the Random Forest models were comparable to those from PLS−SEM, reinforcing the robustness of our findings from two complementary modeling approaches; Table S1: Detailed population and location information, climates and primary land-cover types information for the 31 major cities in China; Table S2: Proportional coverage of major land cover types (ENF, EBF, MF, DNF, DBF, SHL, SAV, GRL, PWL) in each city and overall proportions across 31 cities; Table S3: Sensitivity analysis of latent variable construction using different combinations of 13 environmental indicators. A=ALAN, B=TEMP, C=PRCP, D=CO2, E=PM2.5; Table S4: Summary statistics of the bootstrap−estimated saturation points (n = 1000) for each phenological process metric. The table reports the mean, standard deviation (STD), and the 95% confidence interval (CI).

Author Contributions

J.W. conceptualized and designed the research. Y.Q. performed the data analysis with the help from Z.Y., X.Z., Y.Z., Y.H. and Y.W. Y.Q. and J.W. participated in the result interpretation and rigorousness evaluation of the method. Y.Q. and J.W. drafted the manuscript. Y.Q., J.P. and J.W. contributed to the manuscript editing and revision. All authors have read and agreed to the published version of the manuscript.

Funding

This work was supported by the National Natural Science Foundation of China (#32301350) and the Shenzhen Science and Technology program (#202206193000001, #20220816162849005).

Data Availability Statement

The original contributions presented in this study are included in the article/Supplementary Materials. Further inquiries can be directed to the corresponding author.

Conflicts of Interest

The authors declare no conflict of interest.

References

  1. Caparros-Santiago, J.A.; Rodriguez-Galiano, V.; Dash, J. Land Surface Phenology as Indicator of Global Terrestrial Ecosystem Dynamics: A Systematic Review. ISPRS J. Photogramm. Remote Sens. 2021, 171, 330–347. [Google Scholar] [CrossRef]
  2. Richardson, A.D.; Keenan, T.F.; Migliavacca, M.; Ryu, Y.; Sonnentag, O.; Toomey, M. Climate Change, Phenology, and Phenological Control of Vegetation Feedbacks to the Climate System. Agric. For. Meteorol. 2013, 169, 156–173. [Google Scholar] [CrossRef]
  3. Zhou, D.; Zhao, S.; Zhang, L.; Liu, S. Remotely Sensed Assessment of Urbanization Effects on Vegetation Phenology in China’s 32 Major Cities. Remote Sens. Environ. 2016, 176, 272–281. [Google Scholar] [CrossRef]
  4. Keenan, T.F.; Gray, J.; Friedl, M.A.; Toomey, M.; Bohrer, G.; Hollinger, D.Y.; Munger, J.W.; O’Keefe, J.; Schmid, H.P.; SueWing, I.; et al. Net Carbon Uptake Has Increased through Warming-Induced Changes in Temperate Forest Phenology. Nat. Clim. Change 2014, 4, 598–604. [Google Scholar] [CrossRef]
  5. Liu, H.; Wang, H.; Li, N.; Shao, J.; Zhou, X.; van Groenigen, K.J.; Thakur, M.P. Phenological Mismatches between Above- and Belowground Plant Responses to Climate Warming. Nat. Clim. Change 2022, 12, 97–102. [Google Scholar] [CrossRef]
  6. Piao, S.; Wang, X.; Park, T.; Chen, C.; Lian, X.; He, Y.; Bjerke, J.W.; Chen, A.; Ciais, P.; Tommervik, H.; et al. Characteristics, Drivers and Feedbacks of Global Greening. Nat. Rev. Earth Environ. 2020, 1, 14–27. [Google Scholar] [CrossRef]
  7. Meng, L.; Zhou, Y.; Román, M.O.; Stokes, E.C.; Wang, Z.; Asrar, G.R.; Mao, J.; Richardson, A.D.; Gu, L.; Wang, Y. Artificial Light at Night: An Underappreciated Effect on Phenology of Deciduous Woody Plants. PNAS Nexus 2022, 1, pgac046. [Google Scholar] [CrossRef]
  8. Wang, S.; Ju, W.; Penuelas, J.; Cescatti, A.; Zhou, Y.; Fu, Y.; Huete, A.; Liu, M.; Zhang, Y. Urban-Rural Gradients Reveal Joint Control of Elevated CO2 and Temperature on Extended Photosynthetic Seasons. Nat. Ecol. Evol. 2019, 3, 1076–1085. [Google Scholar] [CrossRef]
  9. Yao, R.; Wang, L.; Gui, X.; Zheng, Y.; Zhang, H.; Huang, X. Urbanization Effects on Vegetation and Surface Urban Heat Islands in China’s Yangtze River Basin. Remote Sens. 2017, 9, 540. [Google Scholar] [CrossRef]
  10. Zhang, L.; Yang, L.; Zohner, C.M.; Crowther, T.W.; Li, M.; Shen, F.; Guo, M.; Qin, J.; Yao, L.; Zhou, C. Direct and Indirect Impacts of Urbanization on Vegetation Growth across the World’s Cities. Sci. Adv. 2022, 8, eabo0095. [Google Scholar] [CrossRef]
  11. Zhang, Y.; Yin, P.; Li, X.; Niu, Q.; Wang, Y.; Cao, W.; Huang, J.; Chen, H.; Yao, X.; Yu, L.; et al. The Divergent Response of Vegetation Phenology to Urbanization: A Case Study of Beijing City, China. Sci. Total Environ. 2022, 803, 150079. [Google Scholar] [CrossRef] [PubMed]
  12. Liu, Q.; Fu, Y.H.; Zhu, Z.; Liu, Y.; Liu, Z.; Huang, M.; Janssens, I.A.; Piao, S. Delayed Autumn Phenology in the Northern Hemisphere Is Related to Change in Both Climate and Spring Phenology. Glob. Change Biol. 2016, 22, 3702–3711. [Google Scholar] [CrossRef] [PubMed]
  13. Xia, J.; Niu, S.; Ciais, P.; Janssens, I.A.; Chen, J.; Ammann, C.; Arain, A.; Blanken, P.D.; Cescatti, A.; Bonal, D.; et al. Joint Control of Terrestrial Gross Primary Productivity by Plant Phenology and Physiology. Proc. Natl. Acad. Sci. USA 2015, 112, 2788–2793. [Google Scholar] [CrossRef]
  14. Ding, H.; Xu, L.; Elmore, A.J.; Shi, Y. Vegetation Phenology Influenced by Rapid Urbanization of The Yangtze Delta Region. Remote Sens. 2020, 12, 1783. [Google Scholar] [CrossRef]
  15. Ge, W.; Deng, L.; Wang, F.; Han, J. Quantifying the Contributions of Human Activities and Climate Change to Vegetation Net Primary Productivity Dynamics in China from 2001 to 2016. Sci. Total Environ. 2021, 773, 145648. [Google Scholar] [CrossRef]
  16. Jeong, S.-J.; Ho, C.-H.; Gim, H.-J.; Brown, M.E. Phenology Shifts at Start vs. End of Growing Season in Temperate Vegetation over the Northern Hemisphere for the Period 1982–2008. Glob. Change Biol. 2011, 17, 2385–2399. [Google Scholar] [CrossRef]
  17. Luo, Z.; Liu, J.; Zhang, S.; Shao, W.; Zhou, J.; Zhang, L.; Jia, R. Spatiotemporal Evolution of Urban Rain Islands in China under the Conditions of Urbanization and Climate Change. Remote Sens. 2022, 14, 4159. [Google Scholar] [CrossRef]
  18. Guo, E.; Wang, Y.; Wang, C.; Sun, Z.; Bao, Y.; Mandula, N.; Jirigala, B.; Bao, Y.; Li, H. NDVI Indicates Long-Term Dynamics of Vegetation and Its Driving Forces from Climatic and Anthropogenic Factors in Mongolian Plateau. Remote Sens. 2021, 13, 688. [Google Scholar] [CrossRef]
  19. Wu, L.; Ma, X.; Dou, X.; Zhu, J.; Zhao, C. Impacts of Climate Change on Vegetation Phenology and Net Primary Productivity in Arid Central Asia. Sci. Total Environ. 2021, 796, 149055. [Google Scholar] [CrossRef]
  20. Zhang, R.; Qi, J.; Leng, S.; Wang, Q. Long-Term Vegetation Phenology Changes and Responses to Preseason Temperature and Precipitation in Northern China. Remote Sens. 2022, 14, 1396. [Google Scholar] [CrossRef]
  21. Liu, X.; Chen, Y.; Li, Z.; Li, Y.; Zhang, Q.; Zan, M. Driving Forces of the Changes in Vegetation Phenology in the Qinghai-Tibet Plateau. Remote Sens. 2021, 13, 4952. [Google Scholar] [CrossRef]
  22. Tao, Z.; Wang, H.; Liu, Y.; Xu, Y.; Dai, J. Phenological Response of Different Vegetation Types to Temperature and Precipitation Variations in Northern China during 1982–2012. Int. J. Remote Sens. 2017, 38, 3236–3252. [Google Scholar] [CrossRef]
  23. Xia, H.; Qiao, L.; Guo, Y.; Ru, X.; Qin, Y.; Zhou, Y.; Wu, C. Enhancing Phenology Modeling through the Integration of Artificial Light at Night Effects. Remote Sens. Environ. 2024, 303, 113997. [Google Scholar] [CrossRef]
  24. Zheng, Q.; Teo, H.C.; Koh, L.P. Artificial Light at Night Advances Spring Phenology in the United States. Remote Sens. 2021, 13, 399. [Google Scholar] [CrossRef]
  25. Menaker, M. Extraretinal Light Perception in the Sparrow. I. Entrainment of the Biological Clock. Proc. Natl. Acad. Sci. USA 1968, 59, 414–421. [Google Scholar] [CrossRef]
  26. Gaston, K.J.; Bennie, J.; Davies, T.W.; Hopkins, J. The Ecological Impacts of Nighttime Light Pollution: A Mechanistic Appraisal. Biol. Rev. 2013, 88, 912–927. [Google Scholar] [CrossRef]
  27. Zhao, S.; Xie, Y.; Xi, G.; Sun, Y.; Zhang, H. How Does PM2.5 Affect Forest Phenology? Integrating PM2.5 into Phenology Models for Warm-Temperate Forests in China. Environ. Res. 2024, 263, 120044. [Google Scholar] [CrossRef]
  28. Qamar, F.; Sharma, M.S.; Dobler, G. The Impacts of Air Quality on Vegetation Health in Dense Urban Environments: A Ground-Based Hyperspectral Imaging Approach. Remote Sens. 2022, 14, 3854. [Google Scholar] [CrossRef]
  29. Jia, W.; Zhao, S.; Zhang, X.; Liu, S.; Henebry, G.M.; Liu, L. Urbanization Imprint on Land Surface Phenology: The Urban-Rural Gradient Analysis for Chinese Cities. Glob. Change Biol. 2021, 27, 2895–2904. [Google Scholar] [CrossRef]
  30. Li, S.; Li, Q.; Zhang, J.; Zhang, S.; Wang, X.; Yang, S.; Zhang, S. Study on the Spatial and Temporal Distribution of Urban Vegetation Phenology by Local Climate Zone and Urban-Rural Gradient Approach. Remote Sens. 2023, 15, 3957. [Google Scholar] [CrossRef]
  31. Liu, X.; Liang, X.; Li, X.; Xu, X.; Ou, J.; Chen, Y.; Li, S.; Wang, S.; Pei, F. A Future Land Use Simulation Model (FLUS) for Simulating Multiple Land Use Scenarios by Coupling Human and Natural Effects. Landsc. Urban Plan. 2017, 168, 94–116. [Google Scholar] [CrossRef]
  32. Liu, B.; Hu, X.; Zhang, Z.; Yu, M. Characterizing Spatio-Temporal Changes of OpenStreetMap Road Networks Using Kernel Density Estimation in China (2014–2021). J. Geovis. Spat. Anal. 2025, 9, 21. [Google Scholar] [CrossRef]
  33. Han, C.; Lu, B.; Zheng, J.; Yu, D.; Zheng, S. Research on Multiscale OpenStreetMap in China: Data Quality Assessment with EWM-TOPSIS and GDP Modeling. Geo-Spat. Inf. Sci. 2024, 1–25. [Google Scholar] [CrossRef]
  34. Schneider, A.; Friedl, M.A.; Potere, D. A New Map of Global Urban Extent from MODIS Satellite Data. Environ. Res. Lett. 2009, 4, 044003. [Google Scholar] [CrossRef]
  35. Friedl, M.; Gray, J.; Sulla-Menashe, D. MODIS/Terra+Aqua Land Cover Dynamics Yearly L3 Global 500m SIN Grid V061 [Data set]. NASA Land Process. Distrib. Act. Arch. Cent. 2022. [Google Scholar] [CrossRef]
  36. Chen, Z.; Yu, B.; Yang, C.; Zhou, Y.; Yao, S.; Qian, X.; Wang, C.; Wu, B.; Wu, J. An Extended Time Series (2000–2018) of Global NPP-VIIRS-like Nighttime Light Data from a Cross-Sensor Calibration. Earth Syst. Sci. Data 2021, 13, 889–906. [Google Scholar] [CrossRef]
  37. Peng, S.; Ding, Y.; Liu, W.; Li, Z. 1 Km Monthly Temperature and Precipitation Dataset for China from 1901 to 2017. Earth Syst. Sci. Data 2019, 11, 1931–1946. [Google Scholar] [CrossRef]
  38. Wei, J.; Li, Z.; Lyapustin, A.; Sun, L.; Peng, Y.; Xue, W.; Su, T.; Cribb, M. Reconstructing 1-Km-Resolution High-Quality PM2.5 Data Records from 2000 to 2018 in China: Spatiotemporal Variations and Policy Implications. Remote Sens. Environ. 2021, 252, 112136. [Google Scholar] [CrossRef]
  39. Oda, T.; Maksyutov, S.; Andres, R.J. The Open-Source Data Inventory for Anthropogenic CO2, Version 2016 (ODIAC2016): A Global Monthly Fossil Fuel CO2 Gridded Emissions Data Product for Tracer Transport Simulations and Surface Flux Inversions. Earth Syst. Sci. Data 2018, 10, 87–107. [Google Scholar] [CrossRef]
  40. Leys, C.; Ley, C.; Klein, O.; Bernard, P.; Licata, L. Detecting Outliers: Do Not Use Standard Deviation around the Mean, Use Absolute Deviation around the Median. J. Exp. Soc. Psychol. 2013, 49, 764–766. [Google Scholar] [CrossRef]
  41. Wang, L.; De Boeck, H.J.; Chen, L.; Song, C.; Chen, Z.; McNulty, S.; Zhang, Z. Urban Warming Increases the Temperature Sensitivity of Spring Vegetation Phenology at 292 Cities across China. Sci. Total Environ. 2022, 834, 155154. [Google Scholar] [CrossRef] [PubMed]
  42. Qu, W.; Hua, H.; Yang, T.; Zohner, C.M.; Penuelas, J.; Wei, J.; Yu, L.; Wu, C. Delayed Leaf Green-up Is Associated with Fine Particulate Air Pollution in China. Nat. Commun. 2025, 16, 3406. [Google Scholar] [CrossRef] [PubMed]
  43. Wu, Z.; Zohner, C.M.; Zhou, Y.; Crowther, T.W.; Wang, H.; Wang, Y.; Peñuelas, J.; Gong, Y.; Zhang, J.; Zou, Y.; et al. Tree Species Composition Governs Urban Phenological Responses to Warming. Nat. Commun. 2025, 16, 3696. [Google Scholar] [CrossRef] [PubMed]
  44. Bradley, B.A.; Jacob, R.W.; Hermance, J.F.; Mustard, J.F. A Curve Fitting Procedure to Derive Inter-Annual Phenologies from Time Series of Noisy Satellite NDVI Data. Remote Sens. Environ. 2007, 106, 137–145. [Google Scholar] [CrossRef]
  45. Liu, R.; Liu, Y. Generation of New Cloud Masks from MODIS Land Surface Reflectance Products. Remote Sens. Environ. 2013, 133, 21–37. [Google Scholar] [CrossRef]
  46. Mateo-Garcia, G.; Gomez-Chova, L.; Amoros-Lopez, J.; Munoz-Mari, J.; Camps-Valls, G. Multitemporal Cloud Masking in the Google Earth Engine. Remote Sens. 2018, 10, 1079. [Google Scholar] [CrossRef]
  47. Bates, D.; Maechler, M.; Bolker, B.M.; Walker, S.C. Fitting Linear Mixed-Effects Models Using Lme4. J. Stat. Softw. 2015, 67, 1–48. [Google Scholar] [CrossRef]
  48. Dormann, C.F.; McPherson, J.M.; Araujo, M.B.; Bivand, R.; Bolliger, J.; Carl, G.; Davies, R.G.; Hirzel, A.; Jetz, W.; Kissling, W.D.; et al. Methods to Account for Spatial Autocorrelation in the Analysis of Species Distributional Data: A Review. Ecography 2007, 30, 609–628. [Google Scholar] [CrossRef]
  49. Henseler, J.; Ringle, C.M.; Sarstedt, M. A New Criterion for Assessing Discriminant Validity in Variance-Based Structural Equation Modeling. J. Acad. Mark. Sci. 2015, 43, 115–135. [Google Scholar] [CrossRef]
  50. Hair, J.F.; Risher, J.J.; Sarstedt, M.; Ringle, C.M. When to Use and How to Report the Results of PLS-SEM. Eur. Bus. Rev. 2019, 31, 2–24. [Google Scholar] [CrossRef]
  51. Castells-Quintana, D.; Dienesch, E.; Krause, M. Air Pollution in an Urban World: A Global View on Density, Cities and Emissions. Ecol. Econ. 2021, 189, 107153. [Google Scholar] [CrossRef]
  52. Imhoff, M.L.; Zhang, P.; Wolfe, R.E.; Bounoua, L. Remote Sensing of the Urban Heat Island Effect across Biomes in the Continental USA. Remote Sens. Environ. 2010, 114, 504–513. [Google Scholar] [CrossRef]
  53. Voogt, J.A.; Oke, T.R. Thermal Remote Sensing of Urban Climates. Remote Sens. Environ. 2003, 86, 370–384. [Google Scholar] [CrossRef]
  54. Zhai, S.; Jacob, D.J.; Wang, X.; Shen, L.; Li, K.; Zhang, Y.; Gui, K.; Zhao, T.; Liao, H. Fine Particulate Matter (PM2.5) Trends in China, 2013-2018: Separating Contributions from Anthropogenic Emissions and Meteorology. Atmos. Chem. Phys. 2019, 19, 11031–11041. [Google Scholar] [CrossRef]
  55. Hair, J.F.; Hult, G.T.M.; Ringle, C.M.; Sarstedt, M. A Primer on Partial Least Squares Structural Equation Modeling (PLS-SEM); Sage: Thousand Oaks, CA, USA, 2022. [Google Scholar]
  56. Ren, Q.; He, C.; Huang, Q.; Zhou, Y. Urbanization Impacts on Vegetation Phenology in China. Remote Sens. 2018, 10, 1905. [Google Scholar] [CrossRef]
  57. Piao, S.; Liu, Q.; Chen, A.; Janssens, I.A.; Fu, Y.; Dai, J.; Liu, L.; Lian, X.; Shen, M.; Zhu, X. Plant Phenology and Global Climate Change: Current Progresses and Challenges. Glob. Change Biol. 2019, 25, 1922–1940. [Google Scholar] [CrossRef] [PubMed]
  58. Zhang, X.Y.; Friedl, M.A.; Schaaf, C.B.; Strahler, A.H. Climate Controls on Vegetation Phenological Patterns in Northern Mid- and High Latitudes Inferred from MODIS Data. Glob. Change Biol. 2004, 10, 1133–1145. [Google Scholar] [CrossRef]
  59. Güsewell, S.; Furrer, R.; Gehrig, R.; Pietragalla, B. Changes in Temperature Sensitivity of Spring Phenology with Recent Climate Warming in Switzerland Are Related to Shifts of the Preseason. Glob. Change Biol. 2017, 23, 5189–5202. [Google Scholar] [CrossRef]
  60. Kabano, P.; Lindley, S.; Harris, A. Evidence of Urban Heat Island Impacts on the Vegetation Growing Season Length in a Tropical City. Landsc. Urban Plan. 2021, 206, 103989. [Google Scholar] [CrossRef]
  61. Poulter, B.; Pederson, N.; Liu, H.; Zhu, Z.; D’Arrigo, R.; Ciais, P.; Davi, N.; Frank, D.; Leland, C.; Myneni, R.; et al. Recent Trends in Inner Asian Forest Dynamics to Temperature and Precipitation Indicate High Sensitivity to Climate Change. Agric. For. Meteorol. 2013, 178–179, 31–45. [Google Scholar] [CrossRef]
  62. Chen, L.; Huang, J.-G.; Ma, Q.; Hanninen, H.; Rossi, S.; Piao, S.; Bergeron, Y. Spring Phenology at Different Altitudes Is Becoming More Uniform under Global Warming in Europe. Glob. Change Biol. 2018, 24, 3969–3975. [Google Scholar] [CrossRef] [PubMed]
  63. Dai, J.; Wang, H.; Ge, Q. Multiple Phenological Responses to Climate Change among 42 Plant Species in Xi’an, China. Int. J. Biometeorol. 2013, 57, 749–758. [Google Scholar] [CrossRef]
  64. Galán Díaz, J.; Gutiérrez-Bustillo, A.M.; Rojo, J. Influence of Urbanization on the Phenology of Evergreen Coniferous and Deciduous Broadleaf Trees in Madrid (Spain). Landsc. Urban Plan. 2023, 235, 104760. [Google Scholar] [CrossRef]
  65. Kalnay, E.; Cai, M. Impact of Urbanization and Land-Use Change on Climate. Nature 2003, 423, 528–531. [Google Scholar] [CrossRef] [PubMed]
  66. Yao, R.; Wang, L.; Huang, X.; Niu, Z.; Liu, F.; Wang, Q. Temporal Trends of Surface Urban Heat Islands and Associated Determinants in Major Chinese Cities. Sci. Total Environ. 2017, 609, 742–754. [Google Scholar] [CrossRef]
  67. Zipper, S.C.; Schatz, J.; Singh, A.; Kucharik, C.J.; Townsend, P.A.; Loheide, S.P. Urban Heat Island Impacts on Plant Phenology: Intra-Urban Variability and Response to Land Cover. Environ. Res. Lett. 2016, 11, 054023. [Google Scholar] [CrossRef]
  68. Zhang, X.; Friedl, M.A.; Schaaf, C.B. Global Vegetation Phenology from Moderate Resolution Imaging Spectroradiometer (MODIS): Evaluation of Global Patterns and Comparison with in Situ Measurements. J. Geophys. Res. Biogeosci. 2006, 111, G04017. [Google Scholar] [CrossRef]
  69. Bennie, J.; Davies, T.W.; Cruse, D.; Gaston, K.J. Ecological Effects of Artificial Light at Night on Wild Plants. J. Ecol. 2016, 104, 611–620. [Google Scholar] [CrossRef]
  70. Wu, C.; Peng, J.; Ciais, P.; Peñuelas, J.; Wang, H.; Beguería, S.; Andrew Black, T.; Jassal, R.S.; Zhang, X.; Yuan, W.; et al. Increased Drought Effects on the Phenology of Autumn Leaf Senescence. Nat. Clim. Change 2022, 12, 943–949. [Google Scholar] [CrossRef]
  71. Sitch, S.; Smith, B.; Prentice, I.C.; Arneth, A.; Bondeau, A.; Cramer, W.; Kaplan, J.O.; Levis, S.; Lucht, W.; Sykes, M.T.; et al. Evaluation of Ecosystem Dynamics, Plant Geography and Terrestrial Carbon Cycling in the LPJ Dynamic Global Vegetation Model. Glob. Change Biol. 2003, 9, 161–185. [Google Scholar] [CrossRef]
  72. Zhang, X.; Friedl, M.A.; Schaaf, C.B.; Strahler, A.H.; Hodges, J.C.F.; Gao, F.; Reed, B.C.; Huete, A. Monitoring Vegetation Phenology Using MODIS. Remote Sens. Environ. 2003, 84, 471–475. [Google Scholar] [CrossRef]
  73. Li, Y.; Wang, Y.; Wang, B.; Wang, Y.; Yu, W. The Response of Plant Photosynthesis and Stomatal Conductance to Fine Particulate Matter (PM2.5) Based on Leaf Factors Analyzing. J. Plant Biol. 2019, 62, 120–128. [Google Scholar] [CrossRef]
  74. Yu, W.; Wang, Y.; Wang, Y.; Li, B.; Liu, Y.; Liu, X. Application of a Coupled Model of Photosynthesis and Stomatal Conductance for Estimating Plant Physiological Response to Pollution by Fine Particulate Matter (PM2.5). Environ. Sci. Pollut. Res. 2018, 25, 19826–19835. [Google Scholar] [CrossRef]
  75. Wang, J.; Li, Y.; Rahman, M.M.; Li, B.; Yan, Z.; Song, G.; Zhao, Y.; Wu, J.; Chu, C. Unraveling the Drivers and Impacts of Leaf Phenological Diversity in a Subtropical Forest: A Fine-Scale Analysis Using PlanetScope CubeSats. New Phytol. 2024, 243, 607–619. [Google Scholar] [CrossRef] [PubMed]
  76. Wang, J.; Yang, D.; Chen, S.; Zhu, X.; Wu, S.; Bogonovich, M.; Guo, Z.; Zhu, Z.; Wu, J. Automatic Cloud and Cloud Shadow Detection in Tropical Areas for PlanetScope Satellite Images. Remote Sens. Environ. 2021, 264, 112604. [Google Scholar] [CrossRef]
  77. Zhang, K.; Chen, H.; Ma, N.; Shang, S.; Wang, Y.; Xu, Q.; Zhu, G. A global dataset of terrestrial evapotranspiration and soil moisture dynamics from 1982 to 2020. Sci. Data 2024, 11, 445. [Google Scholar] [CrossRef]
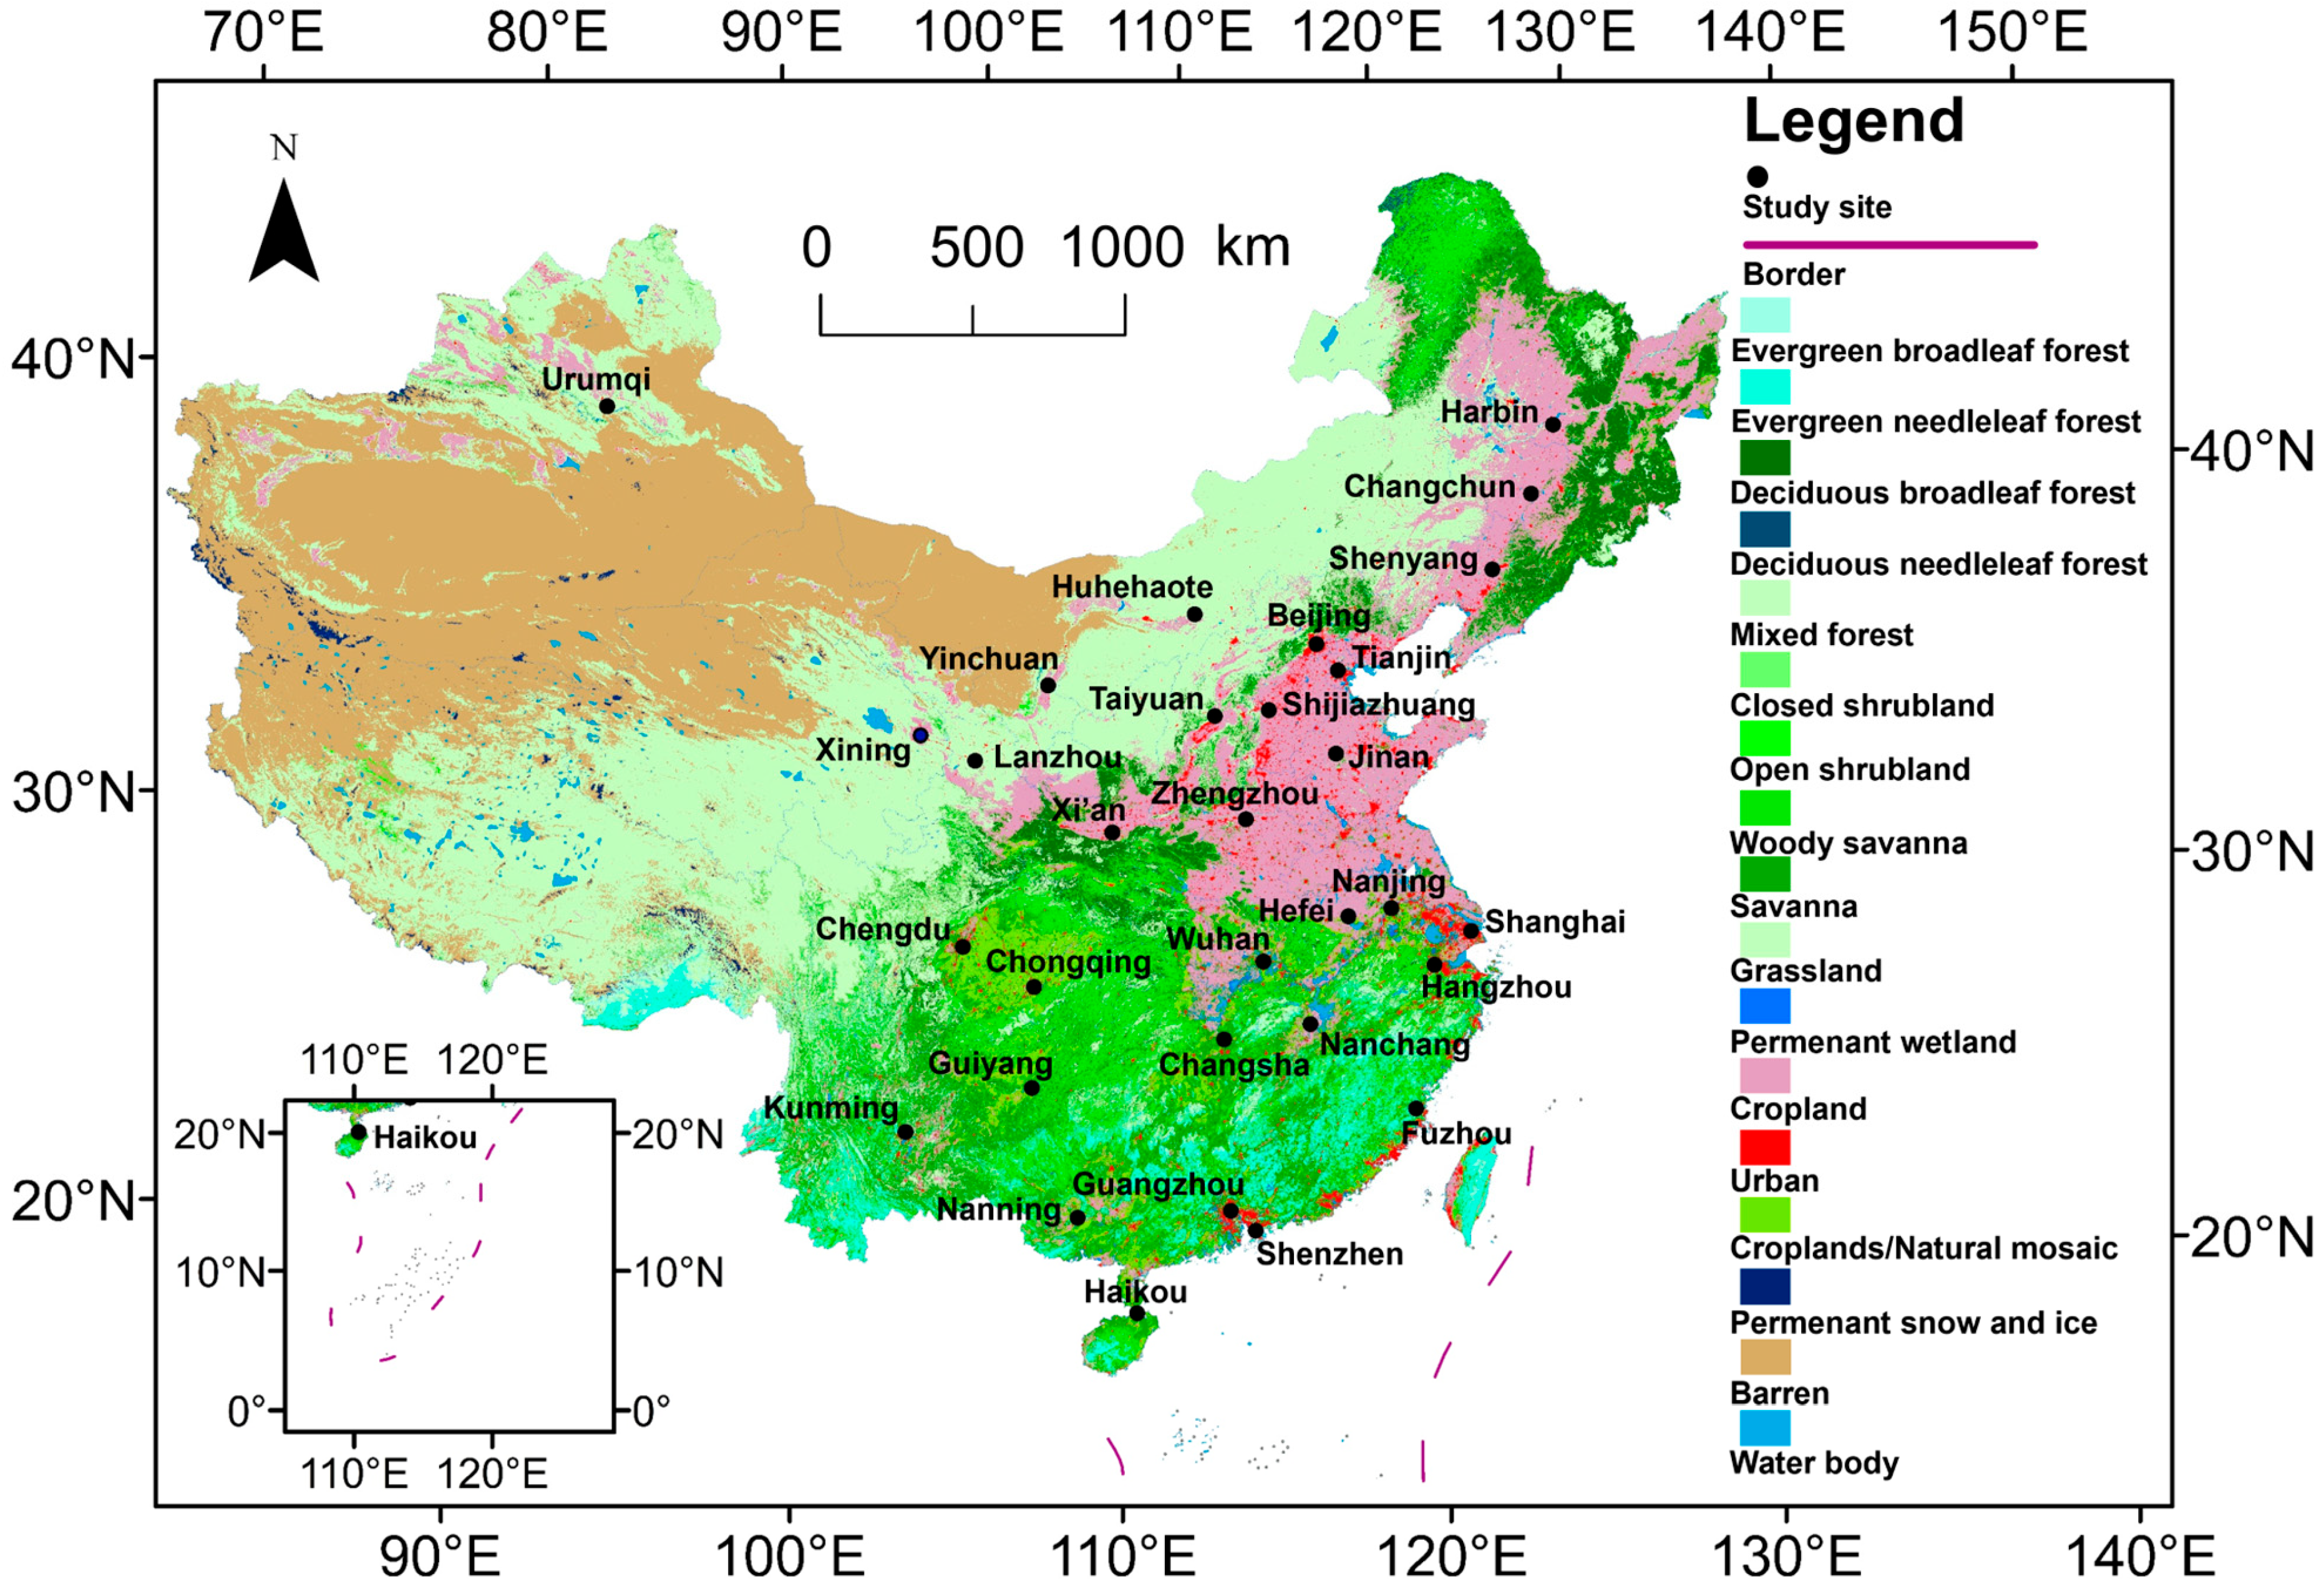
Figure 1. Locations of the 31 major cities in China. The background map, derived from the MCD12Q1 MODIS product for land−cover type, is adapted from National Geographic, Esri.
Remotesensing 17 02758 g001
Figure 2. Results of linear fitting of the phenological response metrics (intercept, slope, and range) against latitude for start of season (SOS; (a,d,g)), end of season (EOS; (b,e,h)), and length of season (LOS; (c,f,i)). Each point represents the latitude and corresponding phenological response metrics for a city. Cities are classified as belonging to tropical (<23.5°N), subtropical (23.5−35°N), and temperate (>35°N) zones. The solid horizontal lines represent the average phenological values for each climatic zone, represented by the corresponding colors in the legend. The gray dashed lines in (df) represent the zero lines.
Remotesensing 17 02758 g002
Figure 3. Heatmaps of the phenological response metrics (intercept, slope, and range) for monthly mean temperature and total precipitation during February-May (spring) for SOS (a,d,g), August−November (autumn) for EOS (b,e,h), and February−November (growing season) for LOS (c,f,i).
Remotesensing 17 02758 g003
Figure 4. Comparisons of the phenological response metrics, intercept (a), slope (b), and range (c), for the three phenostages (SOS, EOS, and LOS) across the six land−cover types: evergreen needleleaf forest (ENF), evergreen broadleaf forest (EBF), deciduous broadleaf forest (DBF), mixed forest (MF), savanna (SAV), and grassland (GRL).
Remotesensing 17 02758 g004
Figure 5. Results of nonlinear fitting for the phenological response metrics (intercept, slope, and range) against road network density (RND) using an exponential function for SOS (a,d,g), EOS (b,e,h), and LOS (c,f,i). Each red point indicates the saturation point for its corresponding fitting.
Remotesensing 17 02758 g005
Figure 6. Results of linear fitting for the phenostages (SOS, EOS, and LOS) against road network density (RND) using a linear mixed model across the 31 cities, with the phenological timing metrics as the dependent variables, RND as the fixed effect, and city as the random effect. The red, green, and blue points and lines represent tropical, subtropical, and temperate regions, respectively, and the black lines indicate the general model for all cities. Detailed regression parameters, including slope and intercept for each city, are provided in Figure S13 in the Supplementary File.
Remotesensing 17 02758 g006
Figure 7. Correlation analysis of the phenological response metrics (intercept, slope, and range), road network density (RND), and five key environmental factors (TEMP, monthly mean temperature; PRCP, total precipitation; ALAN; CO2 emissions; and PM2.5 concentrations) for SOS (a), EOS (b), and LOS (c). ***, p < 0.001; **, p < 0.01; *, p < 0.05. Note: monthly mean temperature, CO2 emissions, PM2.5 concentrations, and total precipitation were calculated for February−May (spring) for SOS (a), August−November (autumn) for EOS (b), and February−November (growing season) for LOS (c).
Remotesensing 17 02758 g007
Figure 8. Partial least−squares structural equation models for understanding the associations of the phenological response metrics (intercept, slope, and range) with road network density (RND) and five key environmental factors (TEMP, monthly mean temperature; PRCP, total precipitation; ALCO, a combined latent variable for ALAN and CO2 emissions; and PM2.5 concentrations) for SOS (a), EOS (b), and LOS (c). The magenta and green lines represent positive and negative effects, respectively. The values beside the paths are the standardized path coefficients (β), with solid and dashed lines shown for significant (p < 0.05) and nonsignificant effects (p > 0.05). Note: Monthly mean temperature, CO2 emissions, PM2.5 concentrations, and total precipitation were calculated for February−May (spring) for SOS (a), August−November (autumn) for EOS (b), and February−November (growing season) for LOS (c).
Remotesensing 17 02758 g008
Disclaimer/Publisher’s Note: The statements, opinions and data contained in all publications are solely those of the individual author(s) and contributor(s) and not of MDPI and/or the editor(s). MDPI and/or the editor(s) disclaim responsibility for any injury to people or property resulting from any ideas, methods, instructions or products referred to in the content.