Article

The Role of Ocean Penetrative Solar Radiation in the Evolution of Mediterranean Storm Daniel

Section of Environmental Physics & Meteorology, Department of Physics, National and Kapodistrian University of Athens, 15784 Athens, Greece
*
Author to whom correspondence should be addressed.
Remote Sens. 2025, 17(15), 2684; https://doi.org/10.3390/rs17152684 (registering DOI)
Submission received: 29 May 2025 / Revised: 22 July 2025 / Accepted: 1 August 2025 / Published: 3 August 2025

Abstract

Air–sea interactions play a pivotal role in shaping cyclone development and evolution. In this context, this study investigates the role of ocean optical properties and solar radiation penetration in modulating subsurface heat content and their subsequent influence on the intensity of Mediterranean cyclones. Using a regional coupled ocean–wave–atmosphere model, we conducted sensitivity experiments for Storm Daniel (2023) comparing two solar radiation penetration schemes in the ocean model component: one with a constant light attenuation depth and another with chlorophyll-dependent attenuation based on satellite estimates. Results show that the chlorophyll-driven radiative heating scheme consistently produces warmer sea surface temperatures (SSTs) prior to cyclone onset, leading to stronger cyclones characterized by deeper minimum mean sea-level pressure, intensified convective activity, and increased rainfall. However, post-storm SST cooling is also amplified due to stronger wind stress and vertical mixing, potentially influencing subsequent local atmospheric conditions. Overall, this work demonstrates that ocean bio-optical processes can meaningfully impact Mediterranean cyclone behavior, highlighting the importance of using appropriate underwater light attenuation schemes and ocean color remote sensing data in coupled models.

1. Introduction

The Mediterranean region is increasingly affected by high-impact weather phenomena, including cyclones that combine tropical and extratropical features known as Medicanes (a portmanteau of MEDIterranean HurriCANES; [1]). Although less frequent than their tropical counterparts, these mesoscale storm systems pose significant threats, as they are responsible for many hazards affecting the region—including storm surges, extreme waves, heavy rainfall and flash floods, landslides, windstorms, and even compound events [2,3,4,5,6,7,8,9]. Gaining a deeper understanding of the complex processes that drive their evolution is a key scientific objective [5], especially in the context of climate change and the challenges of accurately predicting such events within coupled Earth system models.
Among the key factors influencing the formation and intensification of Mediterranean cyclones is the thermal state of the upper ocean, particularly the sea surface temperature (SST), which governs the air–sea interaction and the heat and momentum exchanges at the ocean–atmosphere interface. Previous studies have demonstrated the sensitivity of cyclone development to underlying SST feedback mechanisms (e.g., [10,11,12,13,14,15,16,17]), emphasizing the necessity of a reliable SST representation in numerical models. As a result, identifying upper ocean processes that can drive SST variability is of growing scientific interest in the context of coupled ocean–atmosphere modeling efforts.
Bio-optical processes in the ocean significantly influence SST by controlling how solar radiation penetrates into the water column. In particular, in-water constituents such as chlorophyll-a (Chl-a), colored dissolved organic matter (CDOM), and suspended particles affect water clarity and light attenuation, thereby regulating the vertical solar heating in the ocean [18]. This mechanism directly affects upper-ocean stratification and mixed-layer depth, ultimately shaping SSTs’ and the ocean’s capacity to fuel storm intensification. Ocean and climate models often rely on simplified schemes to parameterize oceanic solar radiation penetration, commonly assuming constant light attenuation with depth (e.g., [19]). However, such approaches neglect the spatiotemporal variability of ocean optical properties, which is particularly relevant for regions like the Mediterranean, where controlling factors of ocean color such as Chl-a concentration exhibit significant heterogeneity. Recent studies in the Mediterranean [20,21,22] have highlighted that even modest variations in chlorophyll-dependent ocean optical properties can alter mixed-layer dynamics, influencing SST evolution with direct implications for air–sea heat exchange processes. While the role of optical effects has been documented for the intensity of tropical cyclones (e.g., [23,24,25]), their impact on Mediterranean storm systems remains largely unexplored.
This study investigates how different parameterization of solar penetration in the ocean model affects the simulation of Storm Daniel, a powerful and destructive weather event that struck the eastern Mediterranean in September 2023 [26,27]. Using a fully coupled ocean–wave–atmosphere model for the Mediterranean region, we compare two sensitivity experiments that differ solely in the shortwave radiation penetration scheme implemented in the ocean model component. The key difference between the two approaches lies in the incorporation of remotely sensed Chl-a concentrations to capture spatiotemporal variations of upper-ocean radiative absorption, along with the number of visible light wavebands considered. Section 2 provides an overview of the coupled modelling system and experimental design, Section 3 presents the results for both atmospheric and oceanic simulations, and finally, Section 4 discusses the broader implications and future directions of this work.

2. Materials and Methods

2.1. Coupled Model Description

This study employs a regional fully coupled ocean–wave–atmosphere system covering the Mediterranean region, as detailed by [15]. The system consists of the ocean model NEMO v4.2.0 (Nucleus for European Modelling of the Ocean; [28]), the atmospheric model WRF-ARW v4.3.3 (Weather Research and Forecasting; [29]), the wave model Wavewatch III v6.07 [30], and the coupler OASIS3-MCT v4.0 [31]. NEMO and WRF exchange variables every 6 min, while WW3 communicates at a 12 min interval, allowing for wave–atmosphere and wave–current interaction (Figure 1). For more details on the exchanged variables, as well as model implementation and setup, readers are referred to [15]. The key physical schemes employed in each component of the coupled system can be found in Appendix A.
The atmospheric initial and lateral boundary conditions were derived from the hourly ERA5 reanalysis dataset [32] at a 0.25°spatial resolution. For the ocean component, initial and boundary conditions were taken from daily fields of the GLORYS12 global reanalysis product [33], which matches the horizontal resolution and vertical discretization used in our configuration. Wave initialization was carried out using restart files from a one-day spin-up run of the WW3 model, driven by 10 m wind fields from ERA5. In regions outside the atmosphere–ocean coupling domain, WRF was forced with sea surface temperatures from ERA5, while ocean surface currents were assumed to be zero.

2.2. Penetrative Solar Radiation in the Ocean Model

The solar radiation penetration within the water column is typically parameterized in ocean models using an exponential decay function based on a 2-waveband light penetration scheme [19]:
I ( z )   =   I 0   R e   z ξ 0 + ( 1 R ) e   z ξ 1
where I(z) is the irradiance at depth z, I0 is the shortwave radiation at the surface, and R is the fraction of non-penetrative radiation. The first and second right-hand terms represent the penetration of infrared wavelengths longer than 700 nm and the visible-wavelength bands across 400:700 nm, respectively, with ξ0 and ξ1 as their respective attenuation lengths.
The 2-waveband approach offers only a simplified representation of light penetration in the ocean [34], as it does not account for the spectrally selective nature of light absorption, which varies with the particle load of seawater and especially the chlorophyll concentration. To address this, [34] proposed a detailed 61-waveband model to capture the light penetration more accurately, though its computational demands limit its practical use in large-scale ocean modelling. As a more efficient alternative, [35] introduced a simplified version of this model in which visible light is divided into the following three wavebands: blue (400:500 nm), green (500:600 nm), and red (600:700 nm). This formulation, called RGB (Red–Green–Blue), assumes the following expression:
I ( z )   =   I 0   R e   z ξ 0   +   1     R 3 e   z ξ r   +   e   z ξ g   +   e   z ξ b
For each waveband, the corresponding attenuation lengths ξr, ξg, and ξb expressed in lookup tables within NEMO code and depend on chlorophyll concentration across 61 nonuniform classes ranging from 0.01 to 10 mg m−3, fitted to values derived from the full spectral model of [34]. A key advantage of the RGB method lies in its incorporation of surface Chl-a data to estimate solar radiation penetration, offering a more realistic representation of ocean turbidity, since Chl-a serves as a proxy for phytoplankton biomass and is a dominant factor influencing light absorption in open ocean waters.

2.3. Datasets

Satellite-derived gridded products were used to evaluate the realism of the coupled model simulations. Sea surface temperature (SST) was assessed using the daily global OSTIA Level 4 (L4) dataset [36] with a 0.05° × 0.05° resolution and the high-resolution daily Mediterranean L4 SST product (MED HR) [37] at 0.0625° × 0.0625° spatial resolution. Precipitation was evaluated using 30 min rainfall estimates from the GPM IMERG v7B Final Run Level 3 (L3) product at a 0.1° spatial resolution [38]. Earth’s natural color images were sourced from EUMETSAT’s Meteosat Second Generation (MSG) Natural Colour RGB product, capturing the full disc at 0° every 15 min [39]. Surface Chl-a data used as input for the ocean model was derived from the daily L4 Copernicus GlobColour product [40] at a 4 km × 4 km resolution. For evaluating simulated cyclone tracks, we used hourly ERA5 reanalysis data at a 0.25° × 0.25° resolution, along with the 3-hourly operational ensemble forecasts from the European Centre for Medium-Range Weather Forecasts (ECMWF) Ensemble Prediction System (EPS), which has a spatial resolution of approximately 9 km.

2.4. Case Study and Model Experiments

Storm Daniel (4–12 September 2023) was a high-impact Mediterranean cyclone that caused catastrophic damage in both Greece and Libya, standing out for its extreme precipitation and severe flooding. It was initially developed due to upper tropospheric forcing followed by Rossby wave breaking [27]. In Greece, Cyclone Daniel triggered widespread hydrometeorological hazards across Thessaly plain, leading to 17 fatalities, the devastation of critical transport infrastructure, and a significant impact on the country’s annual agricultural production [41]. In financial terms the losses were estimated in billions of euros, driving the European Union to respond with EUR 2.25 billion in recovery aid [42]. Neighboring Bulgaria and Türkiye were also affected, with at least 10 deaths reported. As it evolved, Daniel transitioned into a tropical-like system that further intensified and struck Libya. There, the storm caused catastrophic flooding, exacerbated by the collapse of aging dams in the city of Derna, leading to over 5,000 deaths and thousands of people displaced [43]. This extreme weather system serves as an excellent case for examining the links between cyclone dynamics and air–sea interactions, not only because of its severe consequences but also due to its long residence time over the ocean. Its analysis can offer valuable insights into the complex processes that govern extreme weather events in the Mediterranean basin.
To this end, and in an effort to assess the impact of ocean optical properties on the simulation of Storm Daniel, we performed twin experiments using the coupled model configuration incorporating two different solar radiation penetration schemes in the ocean model component:
  • Control run (CTL): This simulation employed a fixed Jerlov-type attenuation, uniform in both time and space. The attenuation parameters (R, ξ0, ξ1) in Equation (1) were set to (0.58, 0.35, 23), representing Type I water in Jerlov’s [44] classification, which corresponds to oligotrophic conditions.
  • Chlorophyll-based run (RGB): In this simulation, solar radiation penetration was calculated using the RGB formulation (Equation (2)), which varies as a function of surface Chl-a concentration. The Chl-a data were obtained from the daily Copernicus GlobColour satellite-based dataset.
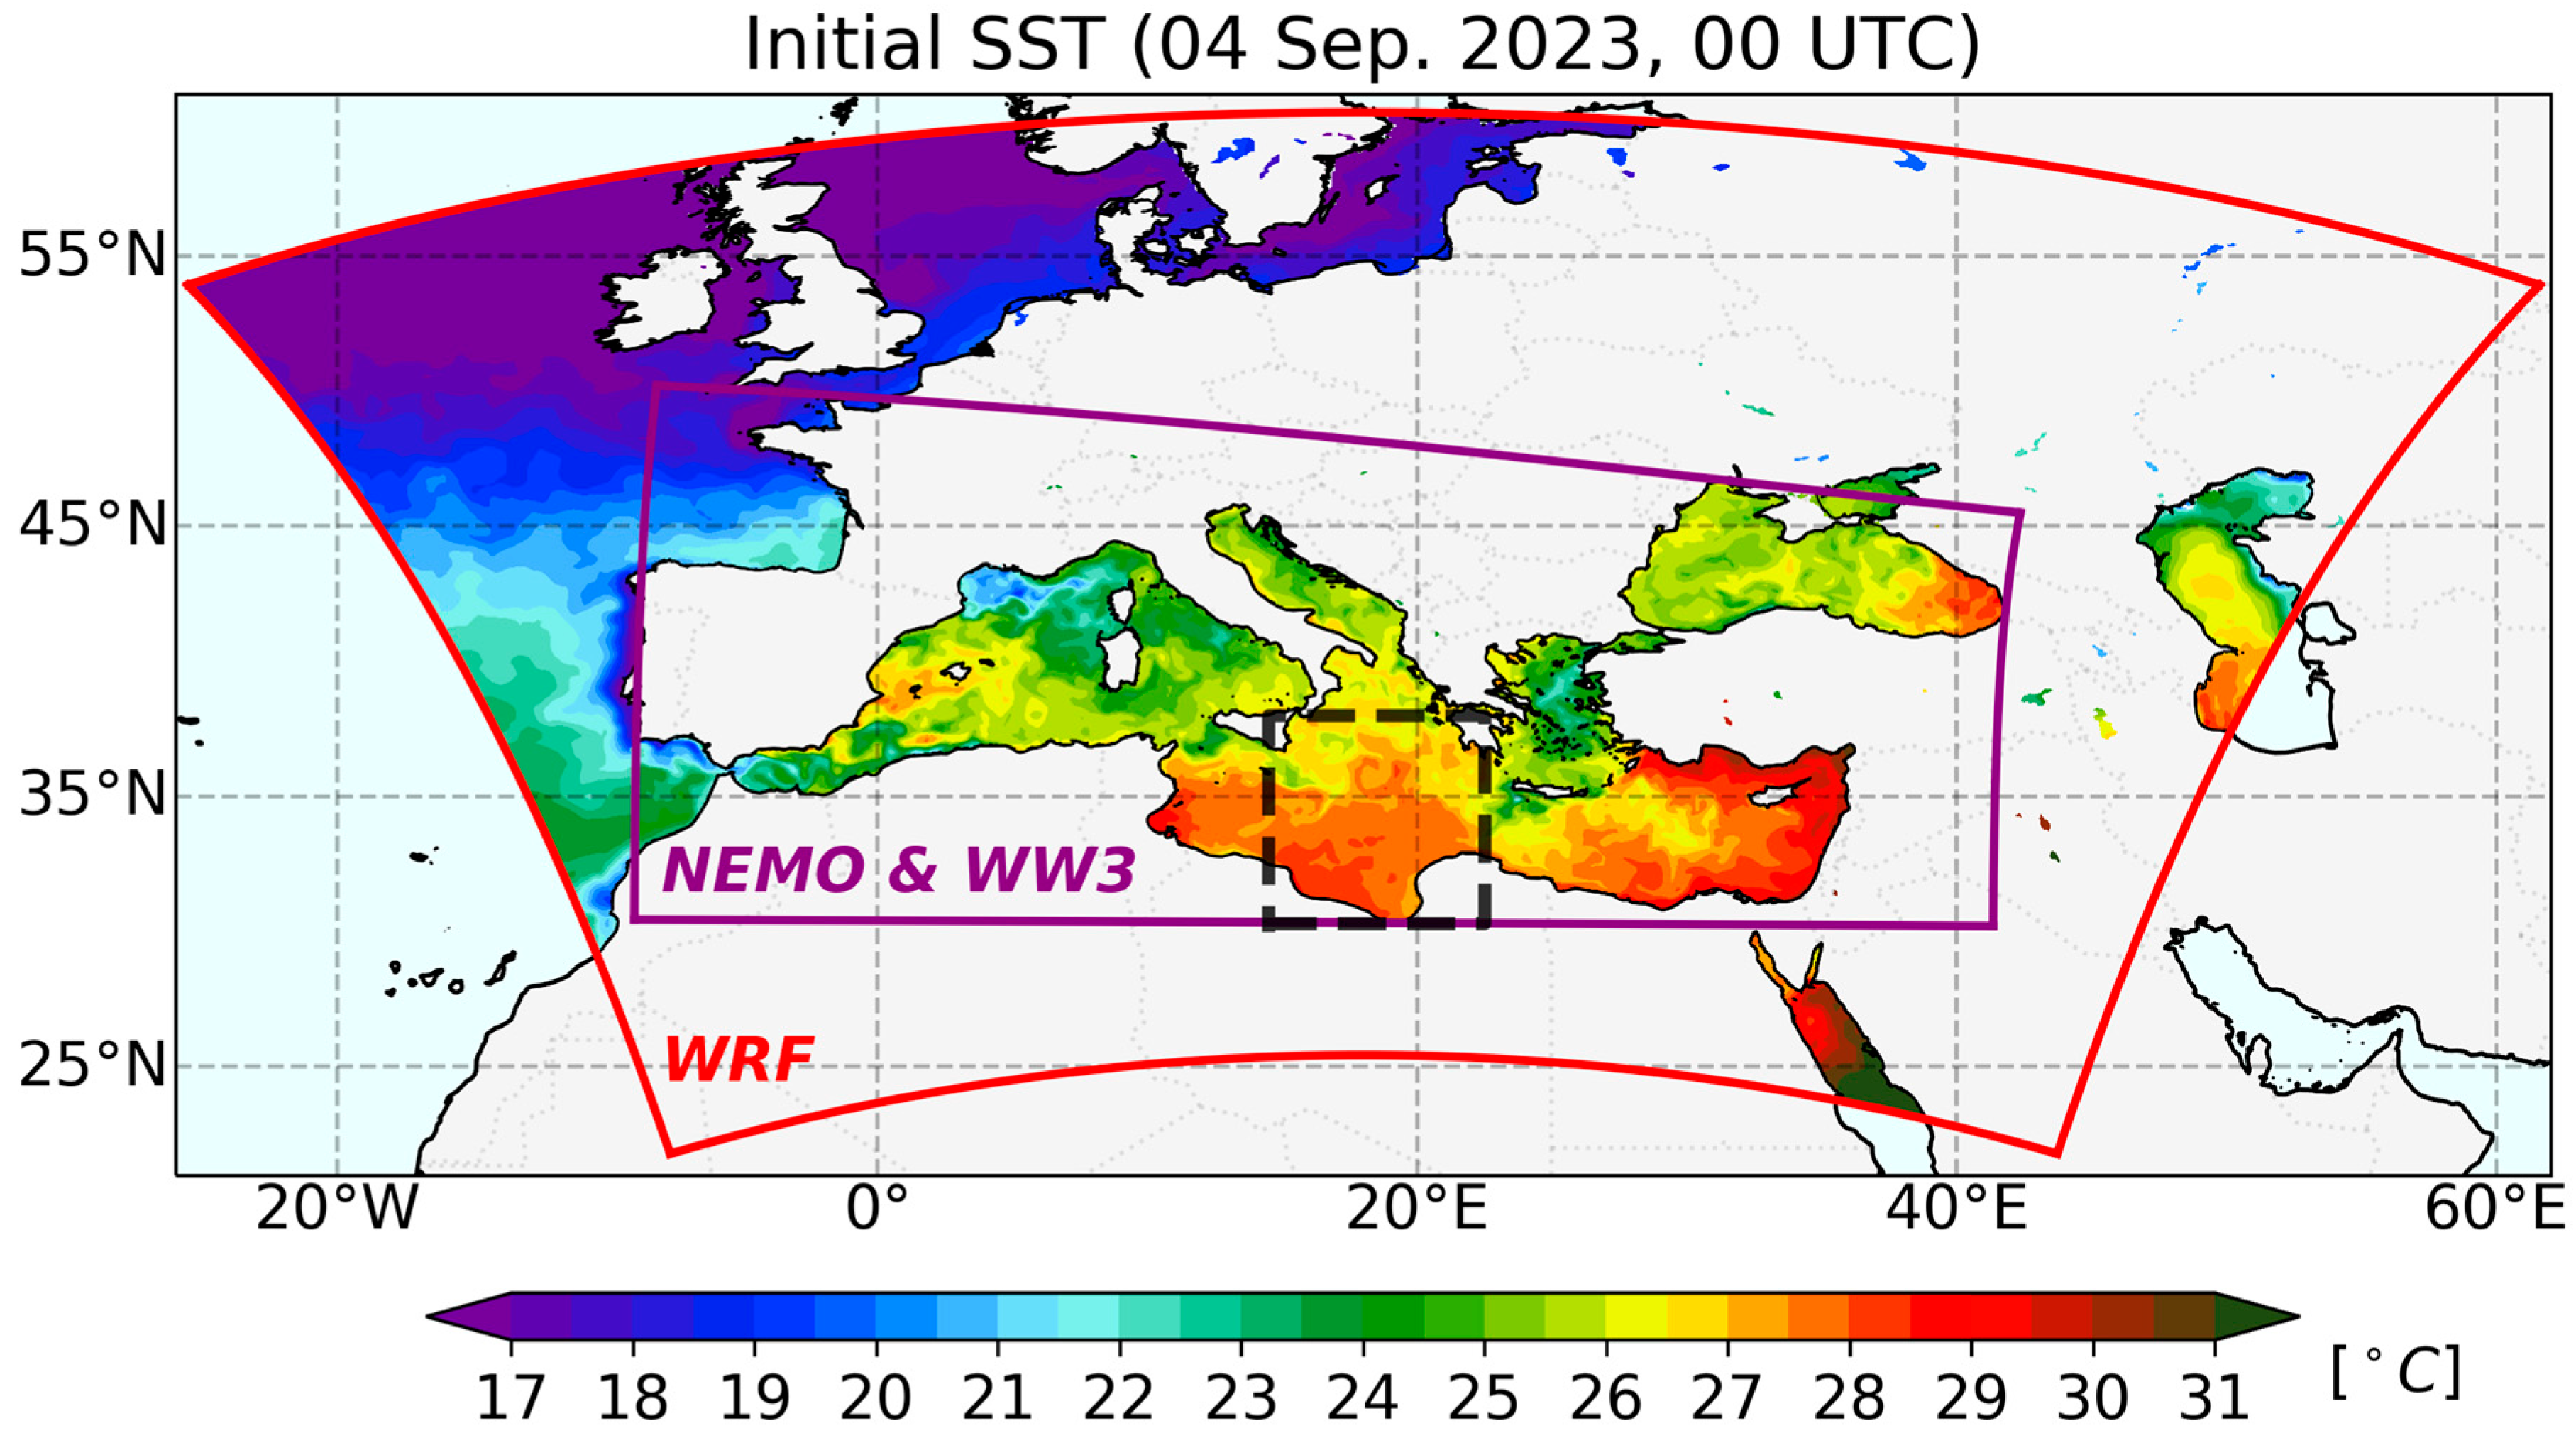
A one-day spin-up of the fully coupled model was performed using the CTL configuration, from 3 September to 4 September at 00 UTC, to allow the ocean model to develop dynamically consistent circulation patterns. Following this spin-up, the resulting ocean and wave conditions, along with cold-start initialization of the atmospheric component based on ERA5 data, were used to run the CTL and RGB experiments. Both simulations started from identical initial conditions and were run until 12 September at 00 UTC. Figure 2 shows the SST field used in the coupled model initialization. A latitudinal SST gradient is evident in the central Mediterranean—where Storm Daniel developed—with values ranging from about 26 °C in the northern Ionian Sea to 28 °C near the African coast. Additionally, smaller-scale SST variations associated with mesoscale oceanic features are visible, such as those near 35°N within the black square region in Figure 2.

3. Results

3.1. Storm Track and Intensity Evolution

Storm Daniel initially developed over the Ionian Sea. Within 24 h of model initialization (i.e., 5 September 2023), the cyclone had already acquired a well-defined structure and began moving southward while gradually intensifying (Figure 3). In the following days, it remained nearly stationary over the central Mediterranean (around 34–35°N), creating favorable conditions for further development, as reflected in the deepening central pressure and enhanced surface fluxes observed in both simulations. Around 9 September, the system resumed a south-southeasterly trajectory and eventually made landfall along the northeastern coast of Libya.
Comparing the two experiments, both display similar track evolution, while the RGB experiment consistently simulates a stronger storm, with minimum sea level pressure (MSLP) values approximately 1 to 2 hPa lower than those in the CTL run (Figure 3b). Their paths are also broadly aligned with the ECMWF EPS control simulation in terms of general evolution (Figure 3a). The main difference among the three forecasts lies in the initial formation area. However, all of them deviate from the “true” track as represented by ERA5 reanalysis, underscoring the challenges in accurately predicting such events—particularly given the extended 8-day forecast horizon. Interestingly, the mean ensemble track performed better than the deterministic runs, highlighting the value of probabilistic approaches in operational forecasting. Although ensemble prediction is beyond the scope of this study, this result further emphasizes the inherent complexity and low predictability of Mediterranean cyclones.

3.2. Shortwave Radiation Penetration

The differences between the two coupled experiments initially stem from variations in the fraction of downwelling shortwave radiation absorbed in the upper ocean layer, which directly affects SST and, consequently, modulates air–sea feedback processes. Figure 4a presents the vertical profiles of solar radiation flux derived from two distinct shortwave penetration schemes, averaged over the black square region in Figure 2 for the entire simulation period. In the RGB experiment, a significant reduction in solar radiation penetration flux is evident within the upper 60 m of the ocean, with differences reaching up to 27 W m−2 in the top 20 m depth. This reduction is attributed to the presence of chlorophyll, which absorbs more solar energy in the near-surface layers, enhancing radiative heating rate by up to 0.2 °C day−1 while simultaneously reducing heat transfer to subsurface waters (Figure 4b). This thermodynamic response generally leads to surface ocean warming (e.g., [35,45,46]), thereby increasing the oceanic heat content available to support storm development and intensification.

3.3. Sea Surface Temperature Sensitivity

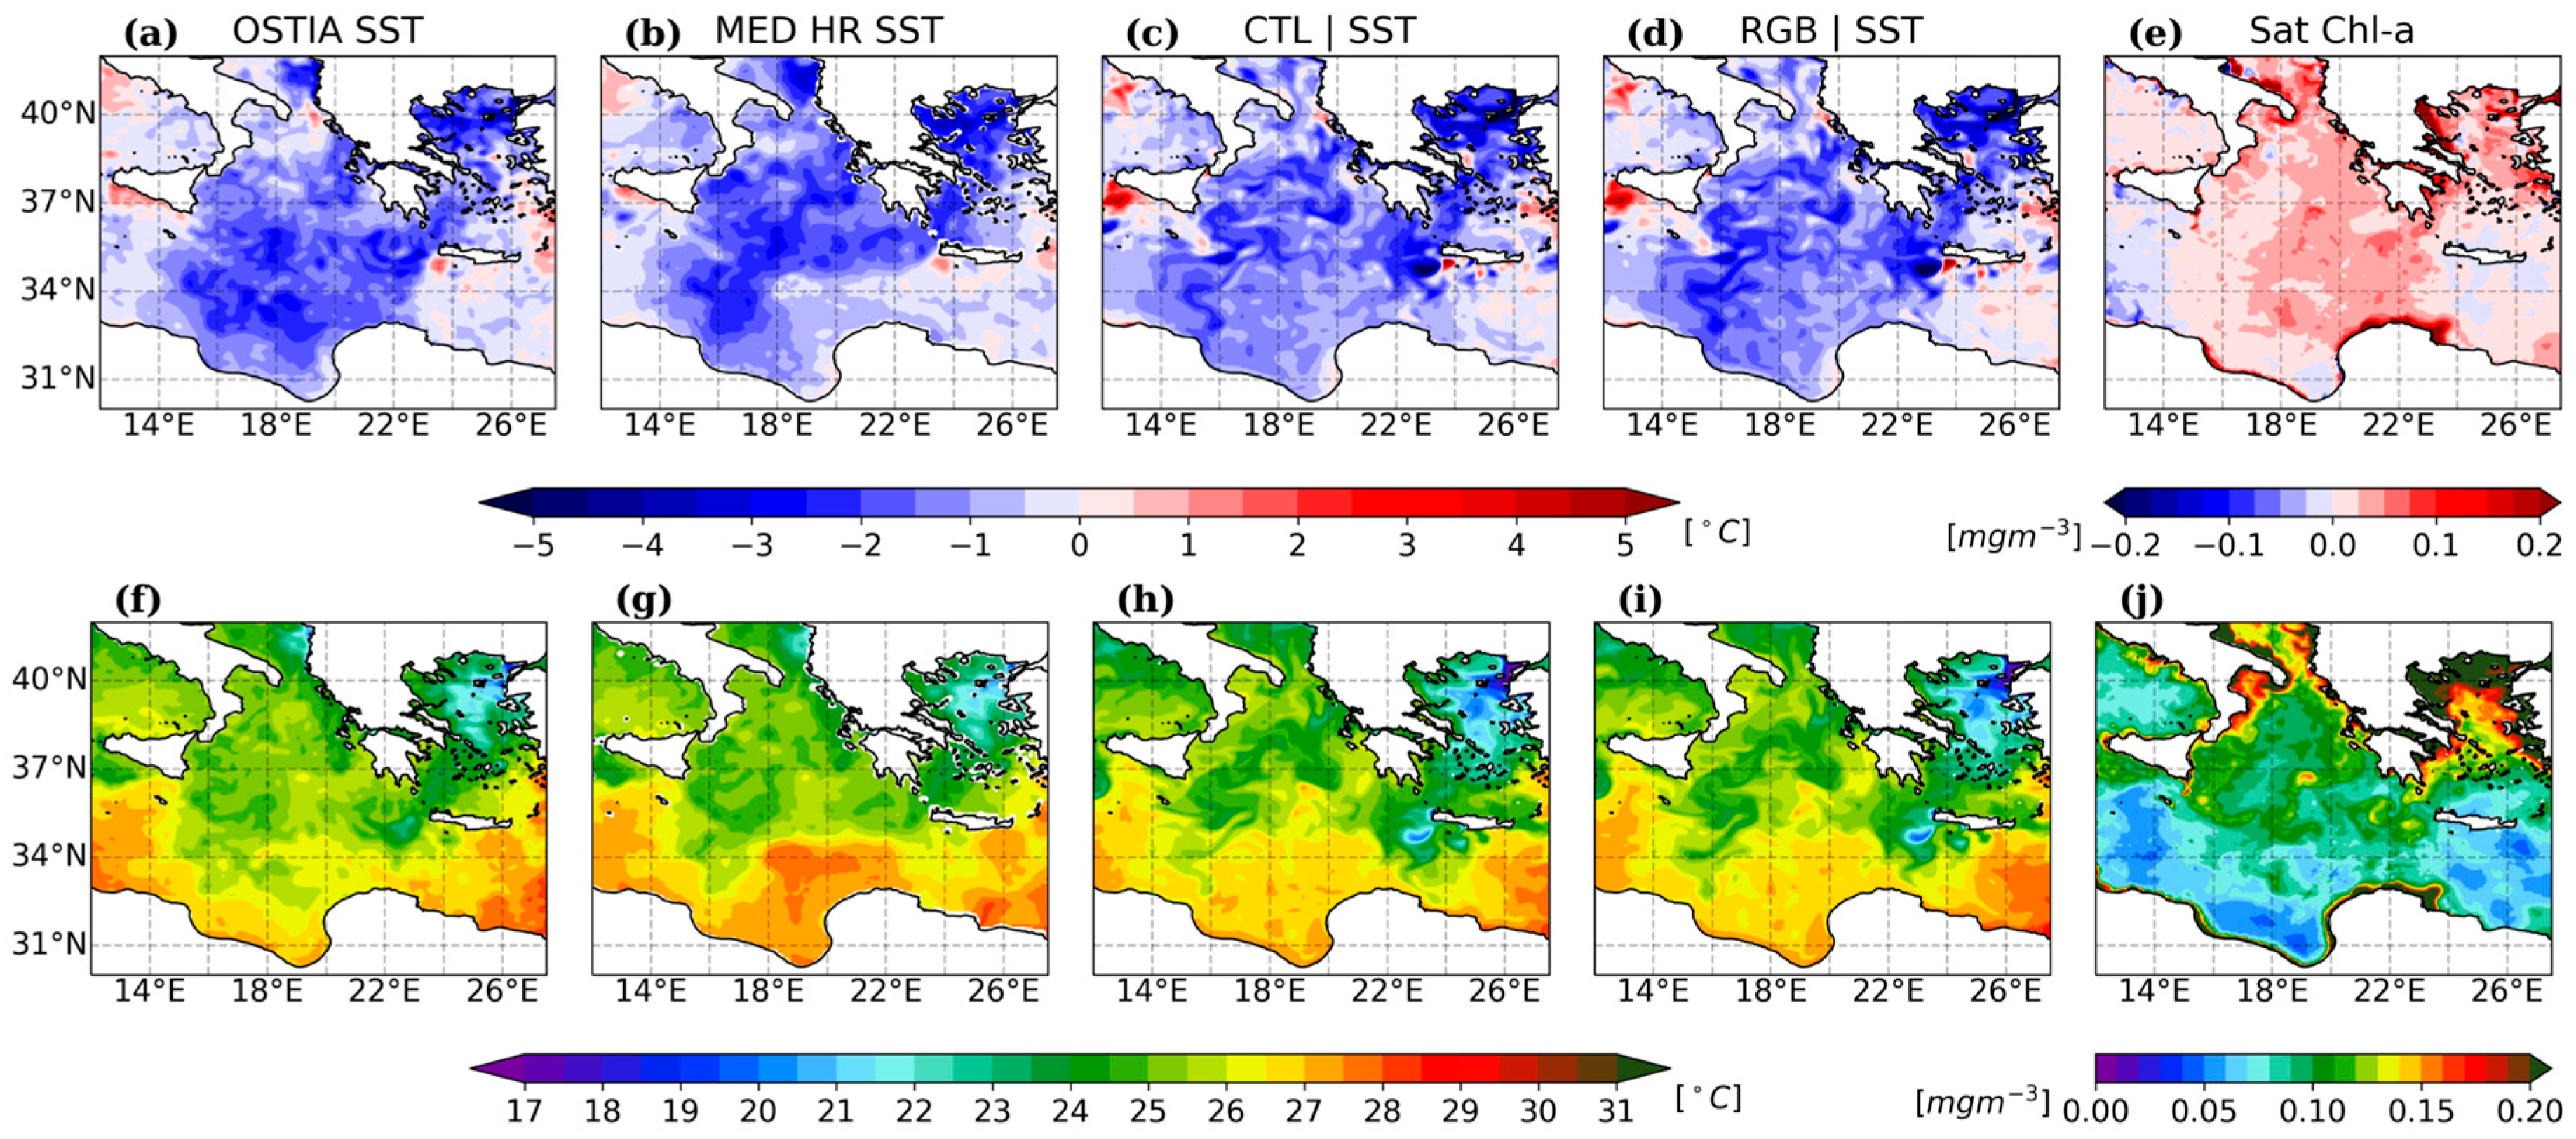
In Figure 5a–d, we compare the SST anomalies between the 4th and 11th of September 2023 from model experiments and two satellite-based gridded products (global OSTIA SST and regional MED HR SST) over the storm-affected area in the central Mediterranean. The impact of Storm Daniel is evident in both model simulations, showing a sea surface cooling of up to 3.5 °C compared to the initial conditions (Figure 5c,d). When compared to both global and regional satellite products, similar patterns of SST anomalies are observed, although the simulated cooling effect is somewhat underestimated near 33–34°N, 17–18°E (cf. Figure 5a–d and Figure S1). This discrepancy can be attributed to biases in the simulated storm track arising from atmospheric initial conditions and the long simulation period (i.e., 8 days), as well as uncertainties in the gridded satellite products, particularly due to cloud cover during the storm (Figure S2). Notably, the satellite data also reveal differing surface cooling patterns in the offshore region of northeastern Libya (see Figure 5a,b,f,g), indicating challenges in accurately capturing SST changes during such an extreme event.
Overall, the RGB experiment consistently reduces both the model-data bias and root mean square error (RMSE) in this region compared to the control (CTL) experiment. Specifically, the mean bias (RMSE) with respect to the global OSTIA SST product decreases from about 0.23 °C (0.70 °C) to 0.16 °C (0.66 °C), and from 0.12 °C (0.67 °C) to 0.05 °C (0.64 °C) relative to the regional MED HR dataset. While these reductions are modest in absolute terms, they are statistically significant according to a one-tailed Student’s t-test at the 99% confidence level. Furthermore, the spatial distribution of SST anomalies associated with storm development closely matched Chl-a anomalies at the surface (cf. Figure 5a–e). This alignment supports the relevance of incorporating ocean color remote sensing data and bio-optical schemes to represent oceanic shortwave radiation penetration and its impact on air–sea interaction.
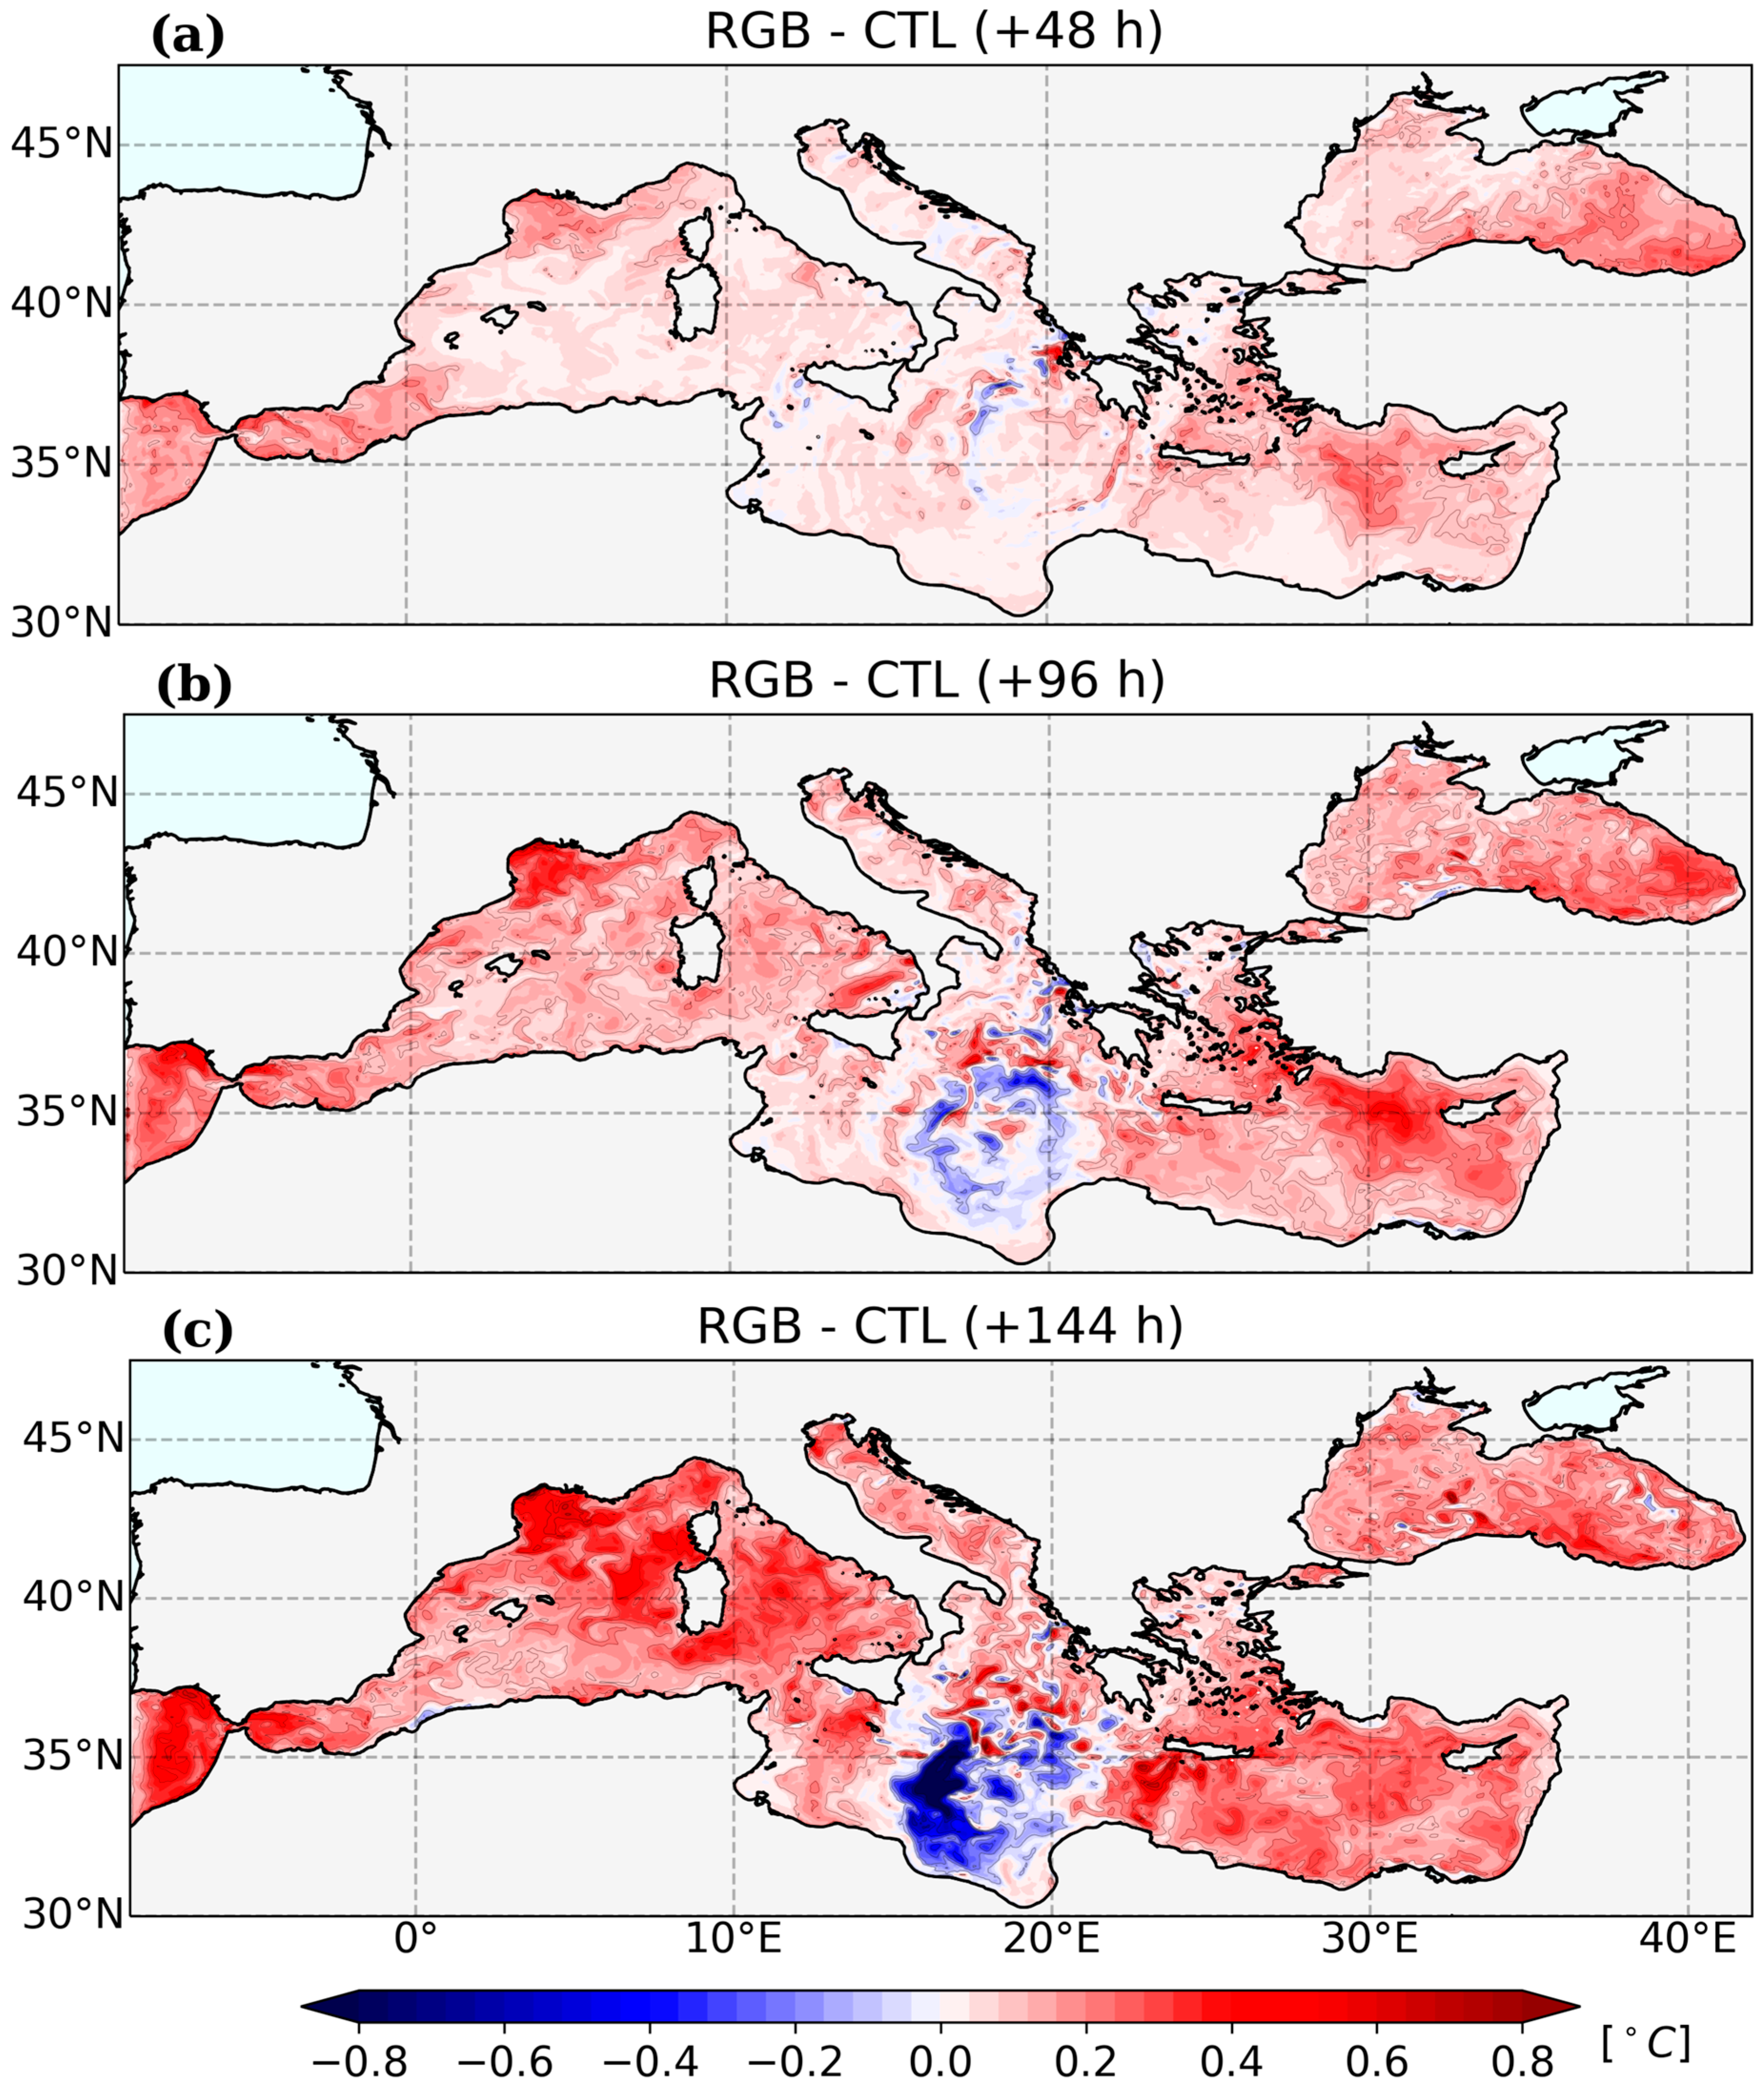
Figure 6 shows the evolution of SST differences between the two experiments after 2, 4, and 6 simulated days, respectively. Integrating satellite-derived Chl-a estimates into the light attenuation parameterization of NEMO (i.e., RGB experiment) generally leads to warmer SSTs throughout the domain, reaching up to 0.5 °C in local areas after 6 days. This warming is primarily attributed to enhanced radiative heating of the upper ocean layer due to chlorophyll absorption (cf. also Figure 4). However, after 4 simulated days and during the intensification phase of Storm Daniel (Figure 6b,c), the RGB experiment exhibits greater SST cooling relative to the control experiment (CTL), particularly in the central Mediterranean region affected by the storm. The most pronounced cooling occurs south of 35°N, with localized temperature drops reaching up to 1.5 °C. This cooling is mainly attributed to stronger oceanic vertical mixing induced by storm-driven winds, which are further amplified by the higher initial surface heating that occurred in RGB simulation during the early development stage of the storm (cf. Figure 6a).

3.4. Upper Ocean and Surface Waves Response

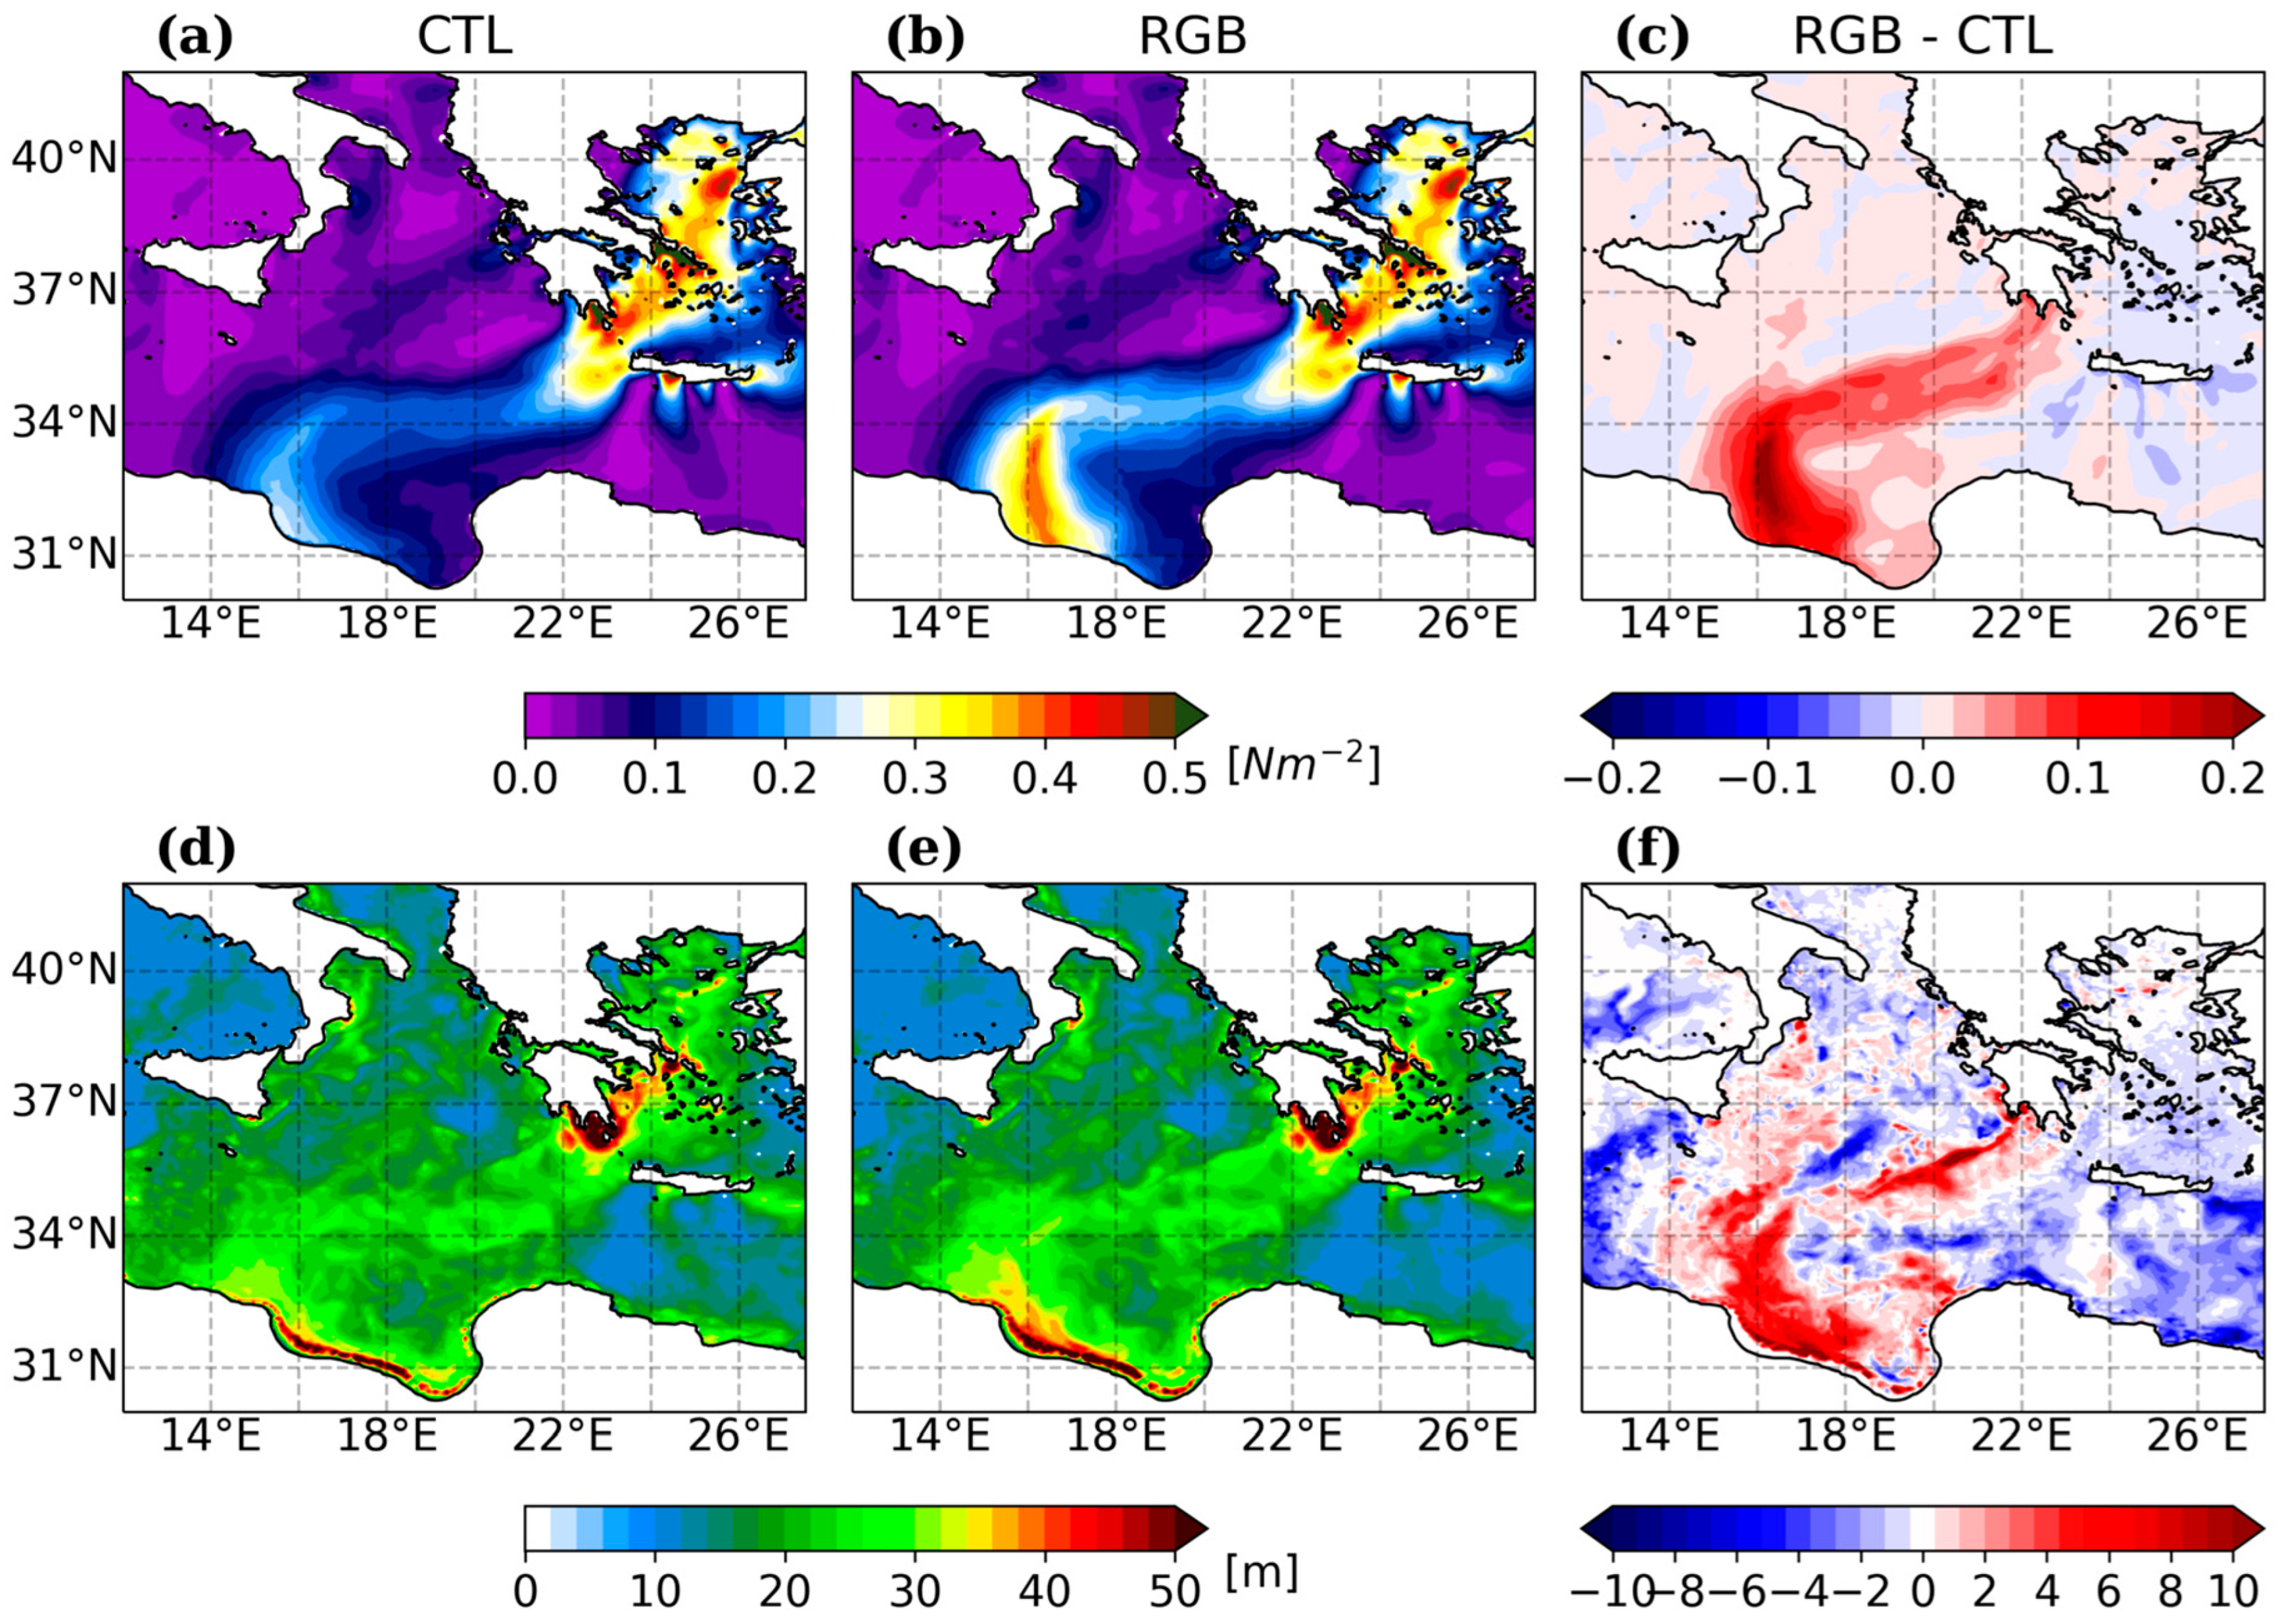
In this subsection, we further compare the experiments to assess the upper ocean dynamical response and associated SST cooling during the storm’s passage. Figure 7 presents the differences in wind stress and mixed layer depth (MLD) between the two experiments on the 9 of September 2023, before the cyclone’s landfall. Although both experiments display a similar southwesterly wind stress pattern extending from the Aegean Sea to Libya (Figure 7a,b), the RGB experiment exhibits significantly higher wind stress, with peak values exceeding 0.2 N m−2 north of Libya (Figure 7c). In contrast, wind stress differences in the Aegean Sea (i.e., outside the primary cyclone-affected area) are minimal. This stronger wind forcing leads to increased Ekman pumping and turbulent vertical mixing, resulting in a deeper MLD (locally exceeding 10 m) in the RGB run compared to the CTL in the central Mediterranean (Figure 7f). The enhanced mixing brings colder subsurface waters into the mixed layer, which accounts for the greater SST cooling observed during the storm’s passage (see Figure 5 and Figure 6). It is also important to note that outside the region of highest wind stress differences, the MLD is slightly shallower in the RGB experiment relative to the CTL (cf. Figure 7c,f), owing to enhanced stratification driven by increased ocean surface heating in the presence of chlorophyll.
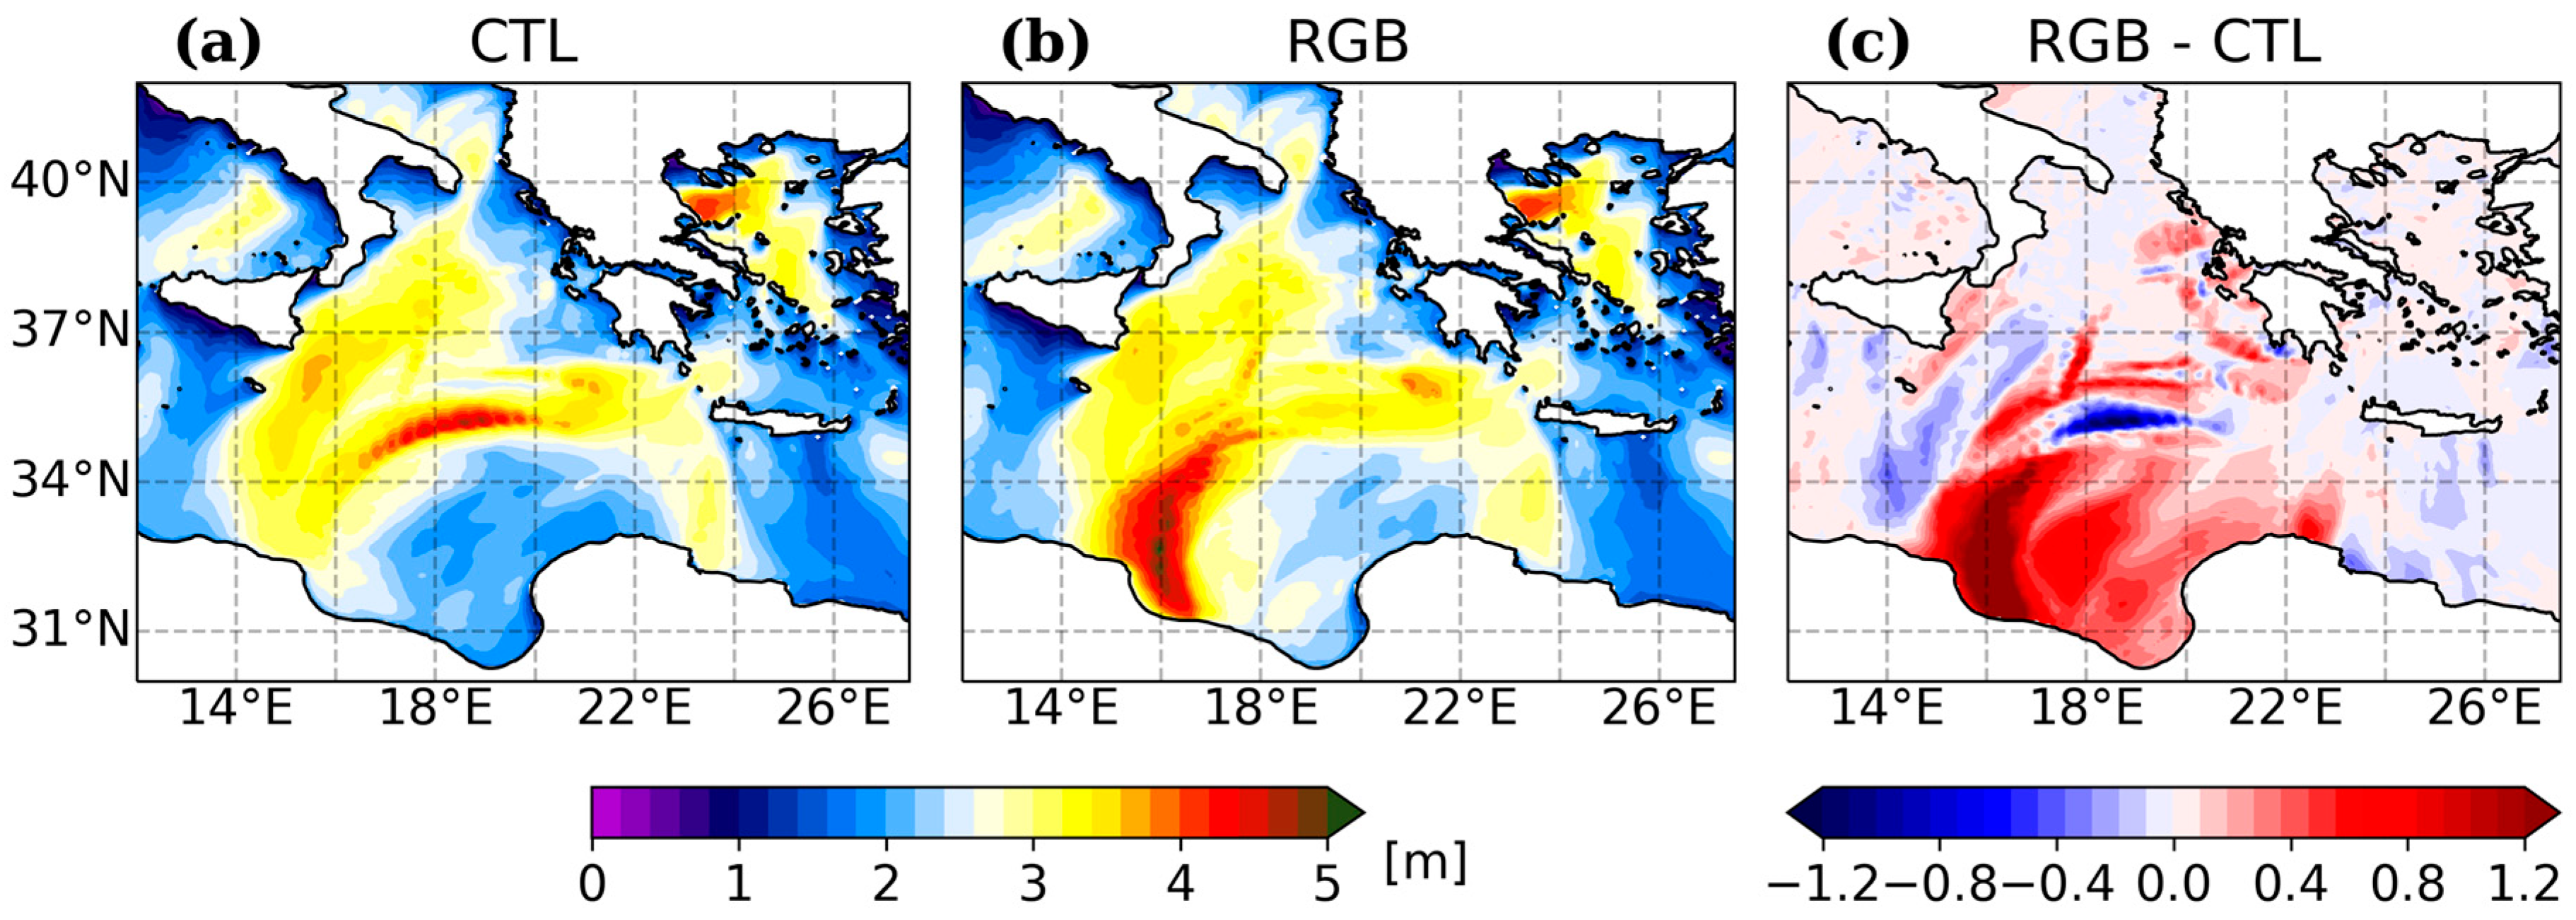
The persistent strong winds over the central Mediterranean, driven by the passage of Storm Daniel, sustained a severe sea state throughout the region. Figure 8 shows the maximum significant wave height (SWH) values from both experiments, computed over the entire simulation period. Peak SWH values are observed over the northern Aegean and the central Mediterranean basin in both simulations (Figure 8a,b), while the RGB experiment exhibits notably increased SWH values exceeding 1 m in the Gulf of Sidra (Figure 8c). These enhanced wave conditions contribute to increased upper-ocean mixing and SST cooling, as wave–ocean feedback is explicitly included in our experimental setup (see [15]).

3.5. Impact on Air–Sea Fluxes and Precipitation

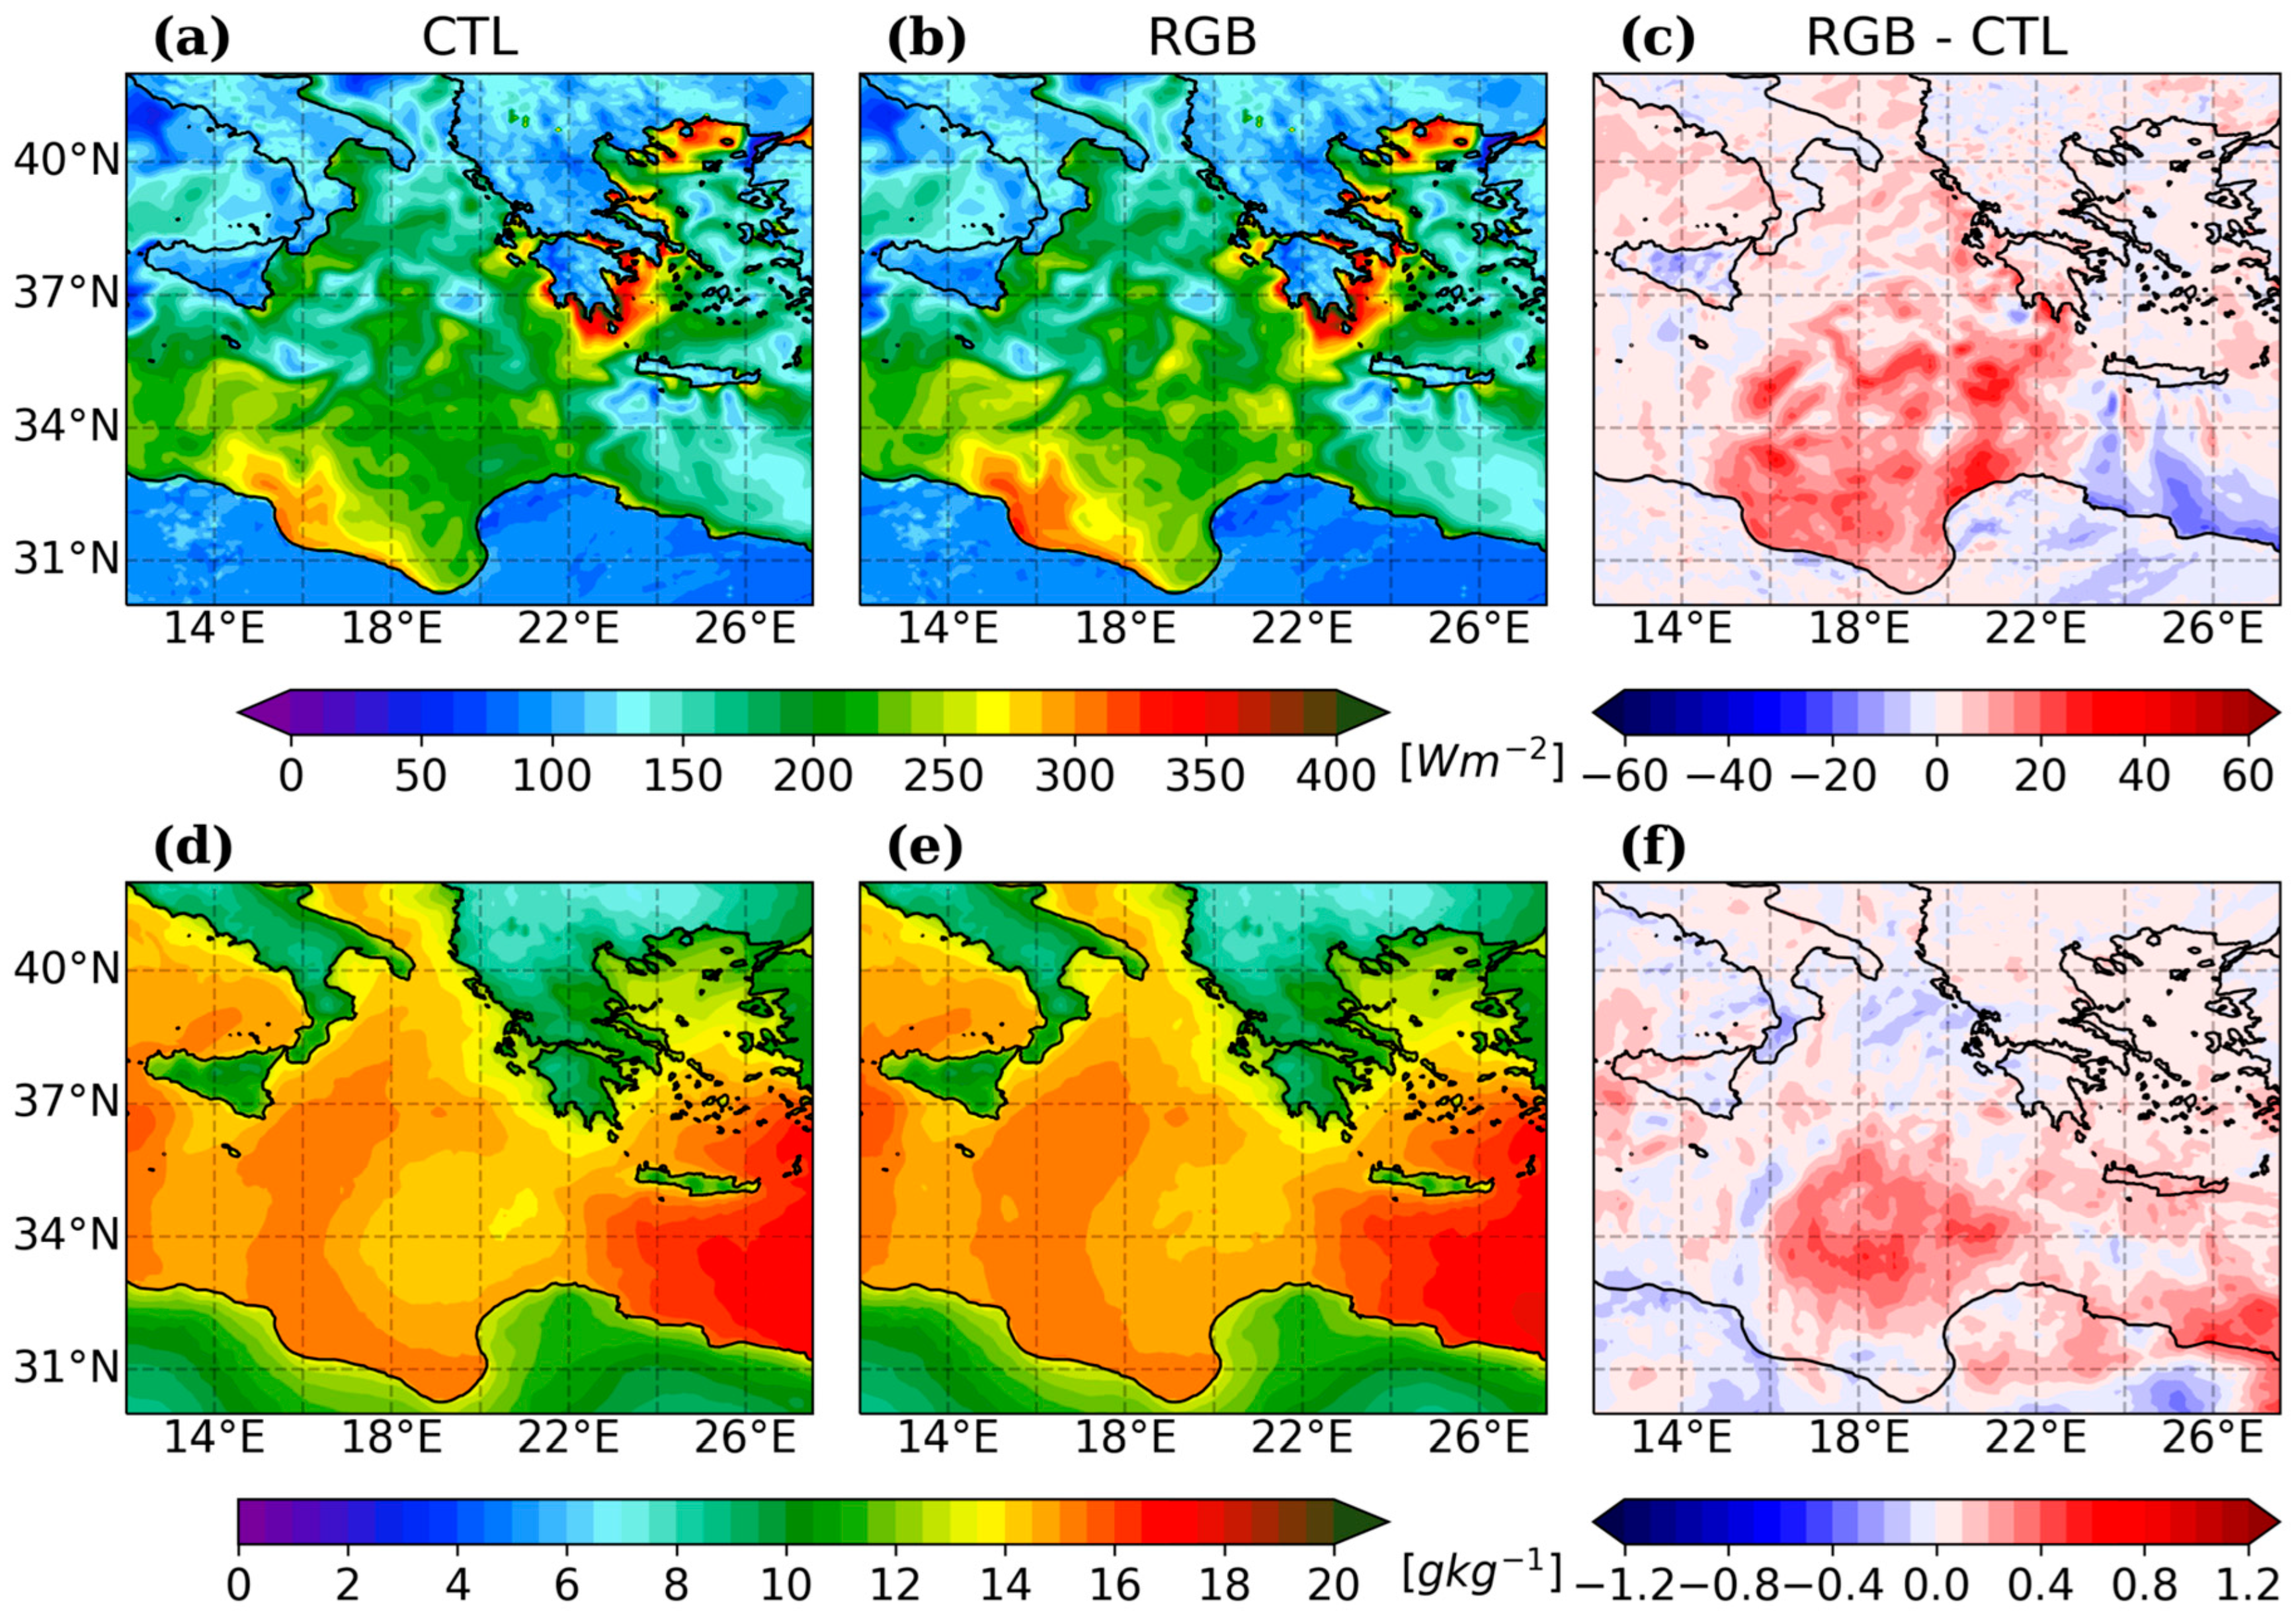
In an effort to further explore the interplay of these processes in the boundary layer, an additional analysis was carried out, focusing on the mean surface enthalpy fluxes (i.e., the sum of sensible and latent heat flux) and near-surface moisture conditions. Starting with the former, the comparison between the CTL and RGB experiments (Figure 9a,b) shows generally similar large-scale patterns. However, the RGB simulation is characterized by consistently higher fluxes (Figure 9c), with local differences exceeding 40 W m−2 along the cyclone’s path. These positive anomalies are in line with the warmer SSTs during the early stages of the simulation (Figure 6a), likely supporting enhanced convective activity and contributing to the lower central pressures observed in the RGB experiment.
Regarding the near-surface moisture fields (Figure 9d–f), the RGB run also shows increased values, reflecting a more humid boundary layer. Such conditions generally favor convection and latent heat release. The spatial distribution of the positive anomalies in both enthalpy flux and moisture suggests that the higher SSTs in the RGB experiment likely led to increased atmospheric instability, thus affecting the cyclone’s evolution and associated impacts.
As previously discussed, changes in boundary layer conditions played a crucial role in modulating the cyclone’s evolution and its hydrometeorological impacts. Both CTL and RGB simulations successfully capture the main spatial features of the intense rainfall over central Greece (Figure 10). While a detailed validation against satellite-based precipitation datasets is beyond the scope of this study, the total accumulated precipitation was compared against IMERG estimates (Figure 10a), revealing notable differences over the central Mediterranean and along the Libyan coast. These discrepancies are largely attributed to the extended forecasting horizon, as deviations tend to increase with lead time, something also evident in the simulated cyclone track. It is important to note that no data assimilation or nudging techniques were applied in either component, in order to fully isolate the impact of the different oceanic solar radiation penetration schemes.
When comparing the two experiments, the RGB simulation shows systematically higher precipitation along the cyclone’s trajectory, with local increases exceeding 50 mm in some regions (Figure 10d). These differences align well with the enhanced surface enthalpy fluxes and increased boundary layer moisture discussed earlier (cf. Figure 9), suggesting that the warmer SSTs in RGB supported stronger convective processes and ultimately led to more intense rainfall.

4. Summary and Discussion

Air–sea interaction is among the key factors affecting the development and evolution of cyclones in the Mediterranean. In an effort to further understand this interplay, we assessed the impact of oceanic penetrative ssolar radiation on a characteristic weather event using a regional coupled ocean–wave–atmosphere model. Our study centers on cyclone Daniel (2023), which occurred in the central-eastern Mediterranean and posed an ideal case due to its long residence time over the ocean, prolonged interaction with the upper-ocean state, and high socioeconomic impact. For the needs of the study, we conducted twin coupled model experiments: a control run (CTL) employing a simplified two-band shortwave attenuation scheme with a fixed light extinction coefficient representative of clear, oligotrophic waters; and a run (RGB) implementing a more advanced three-band, chlorophyll-dependent parameterization of solar irradiance based on ocean color remote sensing data.
The results show that incorporating surface Chl-a concentration data into the shortwave radiation penetration scheme, used here as a proxy for open-ocean color, significantly alters the upper-ocean thermal structure and, in turn, influences storm intensity. The chlorophyll-sensitive parameterization (RGB) increases solar radiation absorption in the uppermost ocean layers due to reduced light penetration, resulting in warmer SSTs than the control run (CTL), which assumes a constant light attenuation. This localized surface heating before the storm onset creates a more favorable thermodynamic environment for storm intensification. As a result, the RGB experiment consistently simulates stronger storms, with minimum central pressures approximately 1–2 hPa lower than in the CTL run. Moreover, the RGB experiment exhibits greater atmospheric instability and elevated surface enthalpy and moisture fluxes, contributing to intensified convective activity and enhanced precipitation within storm-affected regions, with local increases exceeding 50 mm.
However, the stronger cyclone in the RGB experiment also induces greater wind stress and wave heights, which amplify upper-ocean mixing, Ekman pumping, and entrainment of cooler subsurface waters. This leads to a more pronounced post-storm SST cooling (up to 1.5 °C), commonly known as the “cold wake”, which can suppress further storm development through negative thermodynamic feedback. The intensified cold wake may also influence the feedback effects on the local atmosphere, as observed in the case of tropical cyclones (e.g., [47,48,49,50,51]). While storm intensity appears to be sensitive to ocean bio-optical processes, storm tracks remain largely consistent between the RGB and CTL simulations. Though minor trajectory differences are observed, both experiments show similar spatial biases relative to ERA5 reanalysis. This, however, is to be expected, given that cyclone predictability falls dramatically at extended lead times, such as the 8-day forecast window used here (e.g., [52]), and is strongly influenced by factors like model initialization timing and spatial resolution (e.g., [15,53]). Beyond short-term forecasting, the choice of shortwave absorption parameterization may have a significant impact on predicted cyclogenesis and cyclone activity on seasonal or multi-annual timescales. For instance, [23] found that light-absorbing materials can steer Pacific tropical cyclones toward higher latitudes, though similar effects in the Mediterranean have yet to be investigated.
This paper provides new insights into the influence of ocean bio-optical processes on Mediterranean cyclone intensity, emphasizing the importance of integrating ocean color products into light attenuation parameterizations. Although our investigation focuses on a single case study, extending the analysis to a broader range of events—with varying storm intensities, translation speeds, and ocean color regimes (e.g., western vs. central Mediterranean)—would be a valuable next step toward generalizing these findings and improving the predictive skill of coupled forecast systems. Future research may also explore the role of additional light-absorbing constituents, such as colored dissolved organic matter (CDOM) (e.g., [54]), as well as their impact on skin SST diurnal variations (e.g., [55,56]). Moreover, incorporating an interactive biogeochemical component into the coupled system would be particularly valuable for capturing the two-way feedback between chlorophyll distribution and ocean physics. This approach would also allow the representation of vertical chlorophyll profiles, including subsurface features like the deep chlorophyll maximum, which are not captured by surface-only satellite estimates. Finally, the sensitivity of the simulated cold wake intensity identified in this study may have important implications for predicting post-storm primary productivity (e.g., [57,58,59]), warranting further research to clarify the complex interplay between cyclone intensity and marine ecosystem responses.

Supplementary Materials

The following supporting information can be downloaded at: https://www.mdpi.com/article/10.3390/rs17152684/s1. Figure S1: (ad) Sea surface temperature anomaly (°C) between 11/09 and 04/09, comparing CTL and RGB coupled model experiments with satellite-derived SSTs from the global OSTIA and Mediterranean high-resolution (MED HR) datasets; Figure S2: (ah) Evolution of Storm Daniel from 04 to 11 September 2023 at 12 UTC, shown via MSG Natural Colour RGB satellite images (source: EUMETSAT, [39]).

Author Contributions

Conceptualization, J.K. and P.P.; methodology, J.K. and P.P.; software, J.K. and V.V.; validation, J.K.; formal analysis, J.K.; investigation, J.K.; resources, S.S.; data curation, J.K. and P.P.; writing—original draft preparation, J.K. and P.P.; writing—review and editing, V.V. and S.S.; visualization, J.K.; supervision, S.S.; funding acquisition, J.K. and S.S. All authors have read and agreed to the published version of the manuscript.

Funding

The research work was supported by the Hellenic Foundation for Research and Innovation (HFRI) under the 4th Call for HFRI PhD Fellowships (Fellowship Number: 10793).

Data Availability Statement

Most datasets used in this study are freely available upon registration via the Copernicus Marine Service (CMEMS) portal, including OSTIA SST [60], Mediterranean high-resolution SST [61], GlobColour Chlorophyll-a [62], and GLORYS12 reanalysis [63] products. ERA5 reanalysis [64] is also freely available from the Copernicus Climate Data Store (CDS) with registration. Precipitation data were obtained from the GPM IMERG Final Run product, freely available upon registration via NASA’s GES DISC archive [38]. The satellite images for Earth’s natural color are freely distributed from EUMETSAT’s Natural Colour RGB product [39]. ECMWF EPS forecasts were accessed via the MARS Catalogue (https://www.ecmwf.int/en/forecasts/dataset/operational-archive; accessed on 2 August 2025) with permission. Model outputs are available from the corresponding author upon request.

Acknowledgments

This work was supported by computational time granted by the National Infrastructures for Research and Technology S.A. (GRNET S.A.) in the National HPC facility-ARIS-under project ID pr017024 (CrESM). We thank the two anonymous reviewers for their constructive comments and suggestions that improved the quality of this paper.

Conflicts of Interest

The authors declare no conflicts of interest.

Appendix A

Table A1. Physical configurations of the coupled system.
ComponentPhysics ParameterConfiguration
Atmosphere (WRF)MicrophysicsThompson (mp_physics = 8)
CumulusTiedke (cu_physics = 6)
Longwave radiationRRTMG (ra_lw_physics = 4)
Shortwave radiationRRTMG (ra_sw_physics = 4)
Planetary boundary layerYSU (bl_pbl_physics = 1)
Land surfaceUnified Noah (sf_surface_physics = 2)
Surface layerRevised MM5 (sf_sfclay_physics = 1)
Ocean (NEMO)Vertical mixingGLS scheme
Horiz. viscosity & diffusivityBi-Laplacian
Free-surface formulationSplit-explicit free surface scheme
Tracer advectionQUICKEST scheme
Momentum advectionVector form (energy & enstrophy cons. scheme)
Lateral frictionPartial slip; Strong slip in Gibraltar & Black Sea Straits
Bottom frictionLog-layer
Runoff11 rivers from GRDC database
Tidal forcing11 cons. from TPXO7.2 tidal model
Surface waves (WW3)GSE alleviation methodSpatial averaging (PR3)
Propagation schemeThird-order scheme (UQ)
Wind-wave source termST4 package, TEST405 params.
Nonlinear wave–wave interactionsDiscrete Interaction Approximation (NL1)
Linear inputCavaleri and Malanotte-Rizzoli with filter (LN1)
Bottom frictionJONSWAP formulation (BT1)
Depth-induced breakingBattjes-Janssen formulation (DB1)
Energy reflectionShoreline reflections (REF1)

References

  1. Emanuel, K. Genesis and maintenance of “Mediterranean hurricanes”. Adv. Geosci. 2005, 2, 217–220. [Google Scholar] [CrossRef]
  2. Lionello, P.; Cavaleri, L.; Nissen, K.M.; Pino, C.; Raicich, F.; Ulbrich, U. Severe marine storms in the Northern Adriatic: Characteristics and trends. Phys. Chem. Earth 2012, 40–41, 93–105. [Google Scholar] [CrossRef]
  3. Lionello, P.; Conte, D.; Reale, M. The effect of cyclones crossing the Mediterranean region on sea level anomalies on the Mediterranean Sea coast. Nat. Hazards Earth Syst. Sci. 2019, 19, 1541–1564. [Google Scholar] [CrossRef]
  4. Patlakas, P.; Stathopoulos, C.; Tsalis, C.; Kallos, G. Wind and wave extremes associated with tropical-like cyclones in the Mediterranean basin. Int. J. Climatol. 2021, 41 (Suppl. S1), E1623–E1644. [Google Scholar] [CrossRef]
  5. Flaounas, E.; Davolio, S.; Raveh-Rubin, S.; Pantillon, F.; Miglietta, M.M.; Gaertner, M.A.; Hatzaki, M.; Homar, V.; Khodayar, S.; Korres, G.; et al. Mediterranean cyclones: Current knowledge and open questions on dynamics, prediction, climatology and impacts. Weather Clim. Dynam. 2022, 3, 173–208. [Google Scholar] [CrossRef]
  6. Ferrarin, C.; Pantillon, F.; Davolio, S.; Bajo, M.; Miglietta, M.M.; Avolio, E.; Carrió, D.S.; Pytharoulis, I.; Sanchez, C.; Patlakas, P.; et al. Assessing the coastal hazard of Medicane Ianos through ensemble modelling. Nat. Hazards Earth Syst. Sci. 2023, 23, 2273–2287. [Google Scholar] [CrossRef]
  7. Portal, A.; Raveh-Rubin, S.; Catto, J.L.; Givon, Y.; Martius, O. Linking compound weather extremes to Mediterranean cyclones, fronts, and airstreams. Weather Clim. Dynam. 2024, 5, 1043–1060. [Google Scholar] [CrossRef]
  8. Rousseau-Rizzi, R.; Raveh-Rubin, S.; Catto, J.L.; Portal, A.; Givon, Y.; Martius, O. A storm-relative climatology of compound hazards in Mediterranean cyclones. Weather Clim. Dynam. 2024, 5, 1079–1101. [Google Scholar] [CrossRef]
  9. Khodayar, S.; Kushta, J.; Catto, J.L.; Dafis, S.; Davolio, S.; Ferrarin, C.; Flaounas, E.; Groenemeijer, P.; Hatzaki, M.; Hochman, A.; et al. Mediterranean cyclones in a changing climate: A review on their socio-economic impacts. Rev. Geophys. 2025, 63, e2024RG000853. [Google Scholar] [CrossRef]
  10. Pytharoulis, I. Analysis of a Mediterranean tropical-like cyclone and its sensitivity to the sea surface temperatures. Atmos. Res. 2018, 208, 167–179. [Google Scholar] [CrossRef]
  11. Stathopoulos, C.; Patlakas, P.; Tsalis, C.; Kallos, G. The Role of Sea Surface Temperature Forcing in the Life-Cycle of Mediterranean Cyclones. Remote Sens. 2020, 12, 825. [Google Scholar] [CrossRef]
  12. Varlas, G.; Pytharoulis, I.; Steeneveld, G.-J.; Katsafados, P.; Papadopoulos, A. Investigating the impact of sea surface temperature on the development of the Mediterranean tropical-like cyclone “Ianos” in 2020. Atmos. Res. 2023, 291, 106827. [Google Scholar] [CrossRef]
  13. Argüeso, D.; Marcos, M.; Amores, A. Storm Daniel fueled by anomalously high sea surface temperatures in the Mediterranean. NPJ Clim. Atmos. Sci. 2024, 7, 307. [Google Scholar] [CrossRef]
  14. Avolio, E.; Fanelli, C.; Pisano, A.; Miglietta, M.M. Unveiling the relationship between Mediterranean tropical-like cyclones and rising Sea Surface Temperature. Geophys. Res. Lett. 2024, 51, e2024GL109921. [Google Scholar] [CrossRef]
  15. Karagiorgos, J.; Vervatis, V.; Samos, I.; Flocas, H.; Sofianos, S. Ocean-wave-atmosphere coupling effect in Medicane forecasting. Atmos. Res. 2024, 304, 107418. [Google Scholar] [CrossRef]
  16. Sánchez, C.; Gray, S.; Volonté, A.; Pantillon, F.; Berthou, S.; Davolio, S. The impact of preceding convection on the development of Medicane Ianos and the sensitivity to sea surface temperature. Weather Clim. Dynam. 2024, 5, 1429–1455. [Google Scholar] [CrossRef]
  17. Patlakas, P.; Chaniotis, I.; Hatzaki, M.; Kouroutzoglou, J.; Flocas, H.A. The eastern Mediterranean extreme snowfall of January 2022: Synoptic analysis and impact of sea-surface temperature. Weather 2024, 79, 25–33. [Google Scholar] [CrossRef]
  18. Morel, A.; Antoine, D. Heating rate within the upper ocean in relation to its bio–optical state. J. Phys. Oceanogr. 1994, 24, 1652–1665. [Google Scholar] [CrossRef]
  19. Paulson, C.A.; Simpson, J.J. Irradiance measurements in the upper ocean. J. Phys. Oceanogr. 1977, 7, 952–956. [Google Scholar] [CrossRef]
  20. Karagiorgos, J.; Vervatis, V.; Sofianos, S. Ocean chlorophyll feedback in a coupled ocean-atmosphere model for the Mediterranean and Black Seas. J. Geophys. Res. Ocean. 2025, 130, e2024JC021985. [Google Scholar] [CrossRef]
  21. Metheniti, V.; Vervatis, V.; Kampanis, N.; Sofianos, S. Turbidity effects on the Aegean sea surface properties using numerical simulations. Ocean Dyn. 2024, 75, 4. [Google Scholar] [CrossRef]
  22. Zhang, Y.; Sevault, F.; Pennel, R.; Baklouti, M. Analysis of the impact of vertical variation and temporal frequency of the chlorophyll forcing field on modelled temperature in the Mediterranean Sea and potential implications for regional climate projections. Ocean Model. 2025, 194, 102490. [Google Scholar] [CrossRef]
  23. Gnanadesikan, A.; Emanuel, K.; Vecchi, G.A.; Anderson, W.G.; Hallberg, R. How ocean color can steer Pacific tropical cyclones. Geophys. Res. Lett. 2010, 37, L18802. [Google Scholar] [CrossRef]
  24. Newinger, C.; Toumi, R. Potential impact of the colored Amazon and Orinoco plume on tropical cyclone intensity. J. Geophys. Res. Ocean. 2015, 120, 1296–1317. [Google Scholar] [CrossRef]
  25. Liu, Y.; He, R.; Lee, Z. Effects of ocean optical properties and solar attenuation on the northwestern Atlantic Ocean heat content and hurricane intensity. Geophys. Res. Lett. 2021, 48, e2021GL094171. [Google Scholar] [CrossRef]
  26. Hewson, T.; Ashoor, A.; Boussetta, S.; Emanuel, K.; Lagouvardos, K.; Lavers, D.; Magnusson, L.; Pillosu, F.; Zsoter, E. Medicane Daniel: An extraordinary cyclone with devastating impacts. In ECMWF Newsletter; European Centre for Medium-Range Weather Forecasts: Reading, UK, 2024; pp. 33–47. [Google Scholar] [CrossRef]
  27. Flaounas, E.; Dafis, S.; Davolio, S.; Faranda, D.; Ferrarin, C.; Hartmuth, K.; Hochman, A.; Koutroulis, A.; Khodayar, S.; Miglietta, M.M.; et al. Dynamics, predictability, impacts, and climate change considerations of the catastrophic Mediterranean Storm Daniel (2023). EGUsphere 2024. [Google Scholar] [CrossRef]
  28. Gurvan, M.; Bourdallé-Badie, R.; Bricaud, C.; Bruciaferri, D.; Calvert, D.; Chanut, J.; Clementi, E.; Coward, A.; Delrosso, D.; Ethé, C.; et al. Nemo ocean engine. Zenodo 2022. [Google Scholar] [CrossRef]
  29. Skamarock, W.C.; Klemp, J.B.; Dudhia, J.; Gill, D.O.; Liu, Z.; Berner, J.; Wang, W.; Powers, J.G.; Duda, M.G.; Barker, D.M.; et al. A Description of the Advanced Research WRF Model Version 4.3; No. NCAR/TN-556+STR; NCAR: Boulder, CO, USA, 2021. [Google Scholar] [CrossRef]
  30. The WAVEWATCH III® Development Group. User Manual and System Documentation of WAVEWATCH III® Version 6.07; Tech. Note 333; NOAA/NWS/NCEP/MMAB: College Park, MD, USA, 2019; 465p+Appendices. [Google Scholar]
  31. Craig, A.; Valcke, S.; Coquart, L. Development and performance of a new version of the OASIS coupler, OASIS3-MCT_3.0. Geosci. Model Dev. 2017, 10, 3297–3308. [Google Scholar] [CrossRef]
  32. Hersbach, H.; Bell, B.; Berrisford, P.; Hirahara, S.; Horányi, A.; Muñoz-Sabater, J.; Nicolas, J.; Peubey, C.; Radu, R.; Schepers, D.; et al. The ERA5 global reanalysis. Q. J. R. Meteorol. Soc. 2020, 146, 1999–2049. [Google Scholar] [CrossRef]
  33. Lellouche, J.-M.; Greiner, E.; Bourdallé-Badie, R.; Garric, G.; Melet, A.; Drévillon, M.; Clément, B.; Mathieu, H.; Olivier, L.G.; Charly, R.; et al. The Copernicus global 1/12° oceanic and sea ice GLORYS12 reanalysis. Front. Earth Sci. 2021, 9, 698876. [Google Scholar] [CrossRef]
  34. Morel, A. Optical modeling of the upper ocean in relation to its biogenous matter content (case I waters). J. Geophys. Res. 1988, 93, 10749–10768. [Google Scholar] [CrossRef]
  35. Lengaigne, M.; Menkes, C.; Aumont, O.; Gorgues, T.; Bopp, L.; André, J.-M.; Madec, G. Influence of the oceanic biology on the tropical Pacific climate in a coupled general circulation model. Clim. Dyn. 2007, 28, 503–516. [Google Scholar] [CrossRef]
  36. Good, S.; Fiedler, E.; Mao, C.; Martin, M.J.; Maycock, A.; Reid, R.; Roberts-Jones, J.; Searle, T.; Waters, J.; While, J.; et al. The current configuration of the OSTIA system for operational production of foundation sea surface temperature and ice concentration analyses. Remote Sens. 2020, 12, 720. [Google Scholar] [CrossRef]
  37. Buongiorno Nardelli, B.; Tronconi, C.; Pisano, A.; Santoleri, R. High and Ultra-High resolution processing of satellite Sea Surface Temperature data over Southern European Seas in the framework of MyOcean project. Remote Sens. Environ. 2013, 129, 1–16. [Google Scholar] [CrossRef]
  38. Huffman, G.J.; Stocker, E.F.; Bolvin, D.T.; Nelkin, E.J.; Tan, J. GPM IMERG Final Precipitation L3 Half Hourly 0.1 Degree × 0.1 Degree V07; Goddard Earth Sciences Data and Information Services Center (GES DISC): Greenbelt, MD, USA, 2023. [Google Scholar] [CrossRef]
  39. Natural Colour RGB—MSG—0 Degree. Available online: https://data.eumetsat.int/product/EO:EUM:DAT:MSG:NCL# (accessed on 26 May 2025).
  40. Garnesson, P.; Mangin, A.; Fanton d’Andon, O.; Demaria, J.; Bretagnon, M. The CMEMS GlobColour chlorophyll a product based on satellite observation: Multi-sensor merging and flagging strategies. Ocean Sci. 2019, 15, 819–830. [Google Scholar] [CrossRef]
  41. He, K.; Yang, Q.; Shen, X.; Dimitriou, E.; Mentzafou, A.; Papadaki, C.; Stoumboudi, M.; Anagnostou, E.N. Brief communication: Storm Daniel flood impact in Greece in 2023: Mapping crop and livestock exposure from synthetic-aperture radar (SAR). Nat. Hazards Earth Syst. Sci. 2024, 24, 2375–2382. [Google Scholar] [CrossRef]
  42. GreekReporter: The EU Offers Greece € 2.25 Billion to Recover from Deadly Floods. Available online: https://greekreporter.com/2023/09/13/greece-2-25-billion-eu-recover-floods/ (accessed on 21 July 2025).
  43. AP News: Searchers Race to Recover Bodies in Libyan City Where 5,100 Died in Flooding After 2 Dams Collapsed. Available online: https://apnews.com/article/libya-floods-derna-storm-daniel-39081eb32e4fd426119f4b486c9c2ade#:~:text=At%20least%2030%2C000%20people%20in,International%20Organization%20for%20Migration%20said.&text=The%20storm%20hit%20other%20areas,of%20Bayda%2C%20Susa%20and%20Marj (accessed on 21 July 2025).
  44. Jerlov, N. Index. In Marine Optics; Elsevier: Amsterdam, The Netherlands, 1976; Volume 14, pp. 227–231. [Google Scholar] [CrossRef]
  45. Manizza, M.; Le Quéré, C.; Watson, A.J.; Buitenhuis, E.T. Bio-optical feedbacks among phytoplankton, upper ocean physics and sea-ice in a global model. Geophys. Res. Lett. 2005, 32, L05603. [Google Scholar] [CrossRef]
  46. Sweeney, C.; Gnanadesikan, A.; Griffies, S.M.; Harrison, M.J.; Rosati, A.J.; Samuels, B.L. Impacts of Shortwave Penetration Depth on Large-Scale Ocean Circulation and Heat Transport. J. Phys. Oceanogr. 2005, 35, 1103–1119. [Google Scholar] [CrossRef]
  47. Ma, Z.; Fei, J.; Lin, Y.; Huang, X. Modulation of clouds and rainfall by tropical cyclone’s cold wakes. Geophys. Res. Lett. 2020, 47, e2020GL088873. [Google Scholar] [CrossRef]
  48. Karnauskas, K.B.; Zhang, L.; Emanuel, K.A. The feedback of cold wakes on tropical cyclones. Geophys. Res. Lett. 2021, 48, e2020GL091676. [Google Scholar] [CrossRef]
  49. Pasquero, C.; Desbiolles, F.; Meroni, A.N. Air-sea interactions in the cold wakes of tropical cyclones. Geophys. Res. Lett. 2021, 48, e2020GL091185. [Google Scholar] [CrossRef]
  50. Zhang, J.; Lin, Y.; Ma, Z. Footprint of tropical cyclone cold wakes on top-of-atmosphere radiation. Geophys. Res. Lett. 2021, 48, e2021GL094705. [Google Scholar] [CrossRef]
  51. Ma, Z.; Lin, Y.; Fei, J.; Zheng, Y.; Chu, W.; Ye, H. Strengthening cold wakes lead to decreasing trend of tropical cyclone rainfall rates relative to background environmental rainfall rates. NPJ Clim. Atmos. Sci. 2023, 6, 131. [Google Scholar] [CrossRef]
  52. Di Muzio, E.; Riemer, M.; Fink, A.H.; Maier-Gerber, M. Assessing the predictability of Medicanes in ECMWF ensemble forecasts using an object-based approach. Q. J. R. Meteorol. Soc. 2019, 145, 1202–1217. [Google Scholar] [CrossRef]
  53. Pantillon, F.; Davolio, S.; Avolio, E.; Calvo-Sancho, C.; Carrió, D.S.; Dafis, S.; Gentile, E.S.; Gonzalez-Aleman, J.J.; Gray, S.; Miglietta, M.M.; et al. The crucial representation of deep convection for the cyclogenesis of Medicane Ianos. Weather Clim. Dynam. 2024, 5, 1187–1205. [Google Scholar] [CrossRef]
  54. Gnanadesikan, A.; Kim, G.E.; Pradal, M.A.S. Impact of colored dissolved materials on the annual cycle of sea surface temperature: Potential implications for extreme ocean temperatures. Geophys. Res. Lett. 2019, 46, 861–869. [Google Scholar] [CrossRef]
  55. de Toma, V.; Ciani, D.; Hesham Essa, Y.; Yang, C.; Artale, V.; Pisano, A.; Cavaliere, D.; Santoleri, R.; Storto, A. Skin sea surface temperature schemes in coupled ocean–atmosphere modelling: The impact of chlorophyll-interactive e-folding depth. Geosci. Model Dev. 2024, 17, 5145–5165. [Google Scholar] [CrossRef]
  56. Witte, C.R.; Subramaniam, A.; Zappa, C.J. An improved bio-physical parameterization for ocean radiant heating in conditions of near-surface stratification. J. Geophys. Res. Ocean. 2024, 129, e2024JC021049. [Google Scholar] [CrossRef] [PubMed]
  57. Menkes, C.E.; Lengaigne, M.; Lévy, M.; Ethé, C.; Bopp, L.; Aumont, O.; Vincent, E.; Vialard, J.; Jullien, S. Global impact of tropical cyclones on primary production. Glob. Biogeochem. Cycles 2016, 30, 767–786. [Google Scholar] [CrossRef]
  58. Zang, Z.; Xue, Z.G.; Xu, K.; Bentley, S.J.; Chen, Q.; D’Sa, E.J.; Zhang, L.; Ou, Y. The role of sediment-induced light attenuation on primary production during Hurricane Gustav (2008). Biogeosciences 2020, 17, 5043–5055. [Google Scholar] [CrossRef]
  59. Da, N.D.; Foltz, G.R.; Balaguru, K. Observed global increases in tropical cyclone-induced ocean cooling and primary production. Geophys. Res. Lett. 2021, 48, e2021GL092574. [Google Scholar] [CrossRef]
  60. CMEMS. SST_GLO_SST_L4_NRT_OBSERVATIONS_010_001: Global Ocean OSTIA Sea Surface Temperature and Sea Ice Analysis; [Dataset]; E.U. Copernicus Marine Service Information (CMEMS), Marine Data Store (MDS): Toulouse, France, 2025. [Google Scholar] [CrossRef]
  61. CMEMS. SST_MED_SST_L4_NRT_OBSERVATIONS_010_004: Mediterranean Sea High Resolution and Ultra High Resolution Sea Surface Temperature Analysis; [Dataset]; E.U. Copernicus Marine Service Information (CMEMS), Marine Data Store (MDS): Toulouse, France, 2025. [Google Scholar] [CrossRef]
  62. CMEMS. OCEANCOLOUR_GLO_BGC_L4_MY_009_104: Global Ocean Colour (Copernicus-GlobColour), Bio-Geo-Chemical, L4 (Monthly and Interpolated) from Satellite Observations (1997–Ongoing); [Dataset]; E.U. Copernicus Marine Service Information (CMEMS), Marine Data Store (MDS): Toulouse, France, 2025. [Google Scholar] [CrossRef]
  63. CMEMS. GLOBAL_MULTIYEAR_PHY_001_030: Global Ocean Physics Reanalysis; [Dataset]; E.U. Copernicus Marine Service Information (CMEMS), Marine Data Store (MDS): Toulouse, France, 2025. [Google Scholar] [CrossRef]
  64. C3S. ERA5 Hourly Data on Single Levels from 1940 to Present; [Dataset]; Copernicus Climate Change Service (C3S) Climate Data Store (CDS): Reading, UK, 2023. [Google Scholar] [CrossRef]
Figure 1. Schematic diagram of the coupling strategy. The WRF and NEMO components exchange variables every 6 m, while WW3 interacts with both NEMO and WRF every 12 m.
Remotesensing 17 02684 g001
Figure 2. Initial sea surface temperature (SST) field on 4 September at 00 UTC, used in the coupled simulations. The red and purple lines represent the WRF and NEMO/WW3 domains, respectively. The black square highlights the area affected by Storm Daniel, which is the focus of the analysis.
Remotesensing 17 02684 g002
Figure 3. (a) Simulated tracks of Cyclone Daniel from ERA5 reanalysis (black), ECMWF EPS control run (blue), ensemble mean (red), CTL experiment (magenta), and RGB experiment (green), initialized at 00 UTC on 4 September (tracks shown from 5 September onward). (b) Time series of minimum mean sea-level pressure (MSLP; hPa) within a 100 km radius of the cyclone center, extracted at 6 h intervals.
Remotesensing 17 02684 g003
Figure 4. (a) Vertical profiles of shortwave radiation flux (W m−2) for the control CTL (magenta) and RGB (green) experiments. (b) Heating rate difference (°C day−1) between RGB and CTL. Values are averaged for the entire simulation period over the black square region shown in Figure 1.
Remotesensing 17 02684 g004
Figure 5. Sea surface temperature anomaly (°C) between 4 and 11 September 2023 derived from (a) global OSTIA SST product, (b) Mediterranean high-resolution SST product (MED HR), (c) CTL, and (d) RGB coupled model simulations. (e) Surface Chl-a anomaly for the same period, derived from the Copernicus GlobColour product. Panels (fj) show the corresponding SST and Chl-a fields on 11 September 2023.
Remotesensing 17 02684 g005
Figure 6. Evolution of the SST difference (°C) between RGB and CTL runs after (a) 2 days, (b) 4 days, and (c) 6 days of simulation.
Remotesensing 17 02684 g006
Figure 7. (ac) Daily averaged ocean-side wind stress modulus (N m−2) and (df) mixed layer depth (m) on 9 September 2023 for the (from left to right) CTL run, RGB run, and their difference.
Remotesensing 17 02684 g007
Figure 8. Maximum significant wave height (m) from (a) CTL run, (b) RGB run, and (c) their difference, computed over the entire simulation period.
Remotesensing 17 02684 g008
Figure 9. (ac) Mean surface enthalpy fluxes (W m−2; positive values indicate energy gain by the atmosphere) and (df) 2 m water vapor mixing ratio (g kg−1) for the (a,d) CTL and (b,e) RGB experiments, and (c,f) their differences (RGB minus CTL), averaged over the period from 00 UTC 5 September 2023 to 00 UTC 12 September 2023.
Remotesensing 17 02684 g009
Figure 10. Total accumulated precipitation (mm) from 00 UTC 4 Sep to 00 UTC 12 Sep 2023 for (a) IMERG gridded dataset, (b) CTL, (c) RGB, and (d) their difference (RGB minus CTL).
Remotesensing 17 02684 g010
Disclaimer/Publisher’s Note: The statements, opinions and data contained in all publications are solely those of the individual author(s) and contributor(s) and not of MDPI and/or the editor(s). MDPI and/or the editor(s) disclaim responsibility for any injury to people or property resulting from any ideas, methods, instructions or products referred to in the content.