Next Article in Journal
Extraction of Suaeda salsa from UAV Imagery Assisted by Adaptive Capture of Contextual Information
Previous Article in Journal
High-Fidelity 3D Gaussian Splatting for Exposure-Bracketing Space Target Reconstruction: OBB-Guided Regional Densification with Sobel Edge Regularization
Previous Article in Special Issue
Analysis and Validation of the Signal-to-Noise Ratio for an Atmospheric Humidity Profiling Spectrometer Based on 1D-Imaging Spatial Heterodyne Spectroscopy
 
 
Due to scheduled maintenance work on our database systems, there may be short service disruptions on this website between 10:00 and 11:00 CEST on June 14th.
Article

Study on Exposure Time Difference Compensation Method for DMD-Based Dual-Path Multi-Target Imaging Spectrometer

1
Changchun Institute of Optics, Fine Mechanics and Physics, Chinese Academy of Sciences, Changchun 130033, China
2
University of Chinese Academy of Sciences, Beijing 100049, China
3
Department of Precision Instrument, Tsinghua University, Beijing 100084, China
4
State Key Laboratory of Precision Measurement Technology and Instrument, Tsinghua University, Beijing 100084, China
5
Research Center of the Satellite Technology, Harbin Institute of Technology, Harbin 150001, China
*
Author to whom correspondence should be addressed.
These authors contributed equally to this work.
Remote Sens. 2025, 17(12), 2021; https://doi.org/10.3390/rs17122021
Submission received: 31 March 2025 / Revised: 28 May 2025 / Accepted: 3 June 2025 / Published: 11 June 2025
(This article belongs to the Special Issue Optical Remote Sensing Payloads, from Design to Flight Test)

Abstract

:
This paper presents the design of an airborne DMD-based dual-path multi-target imaging spectrometer that is capable of achieving instantaneous imaging over a two-dimensional large field of view and the simultaneous spectral analysis of thousands of targets. It also offers advantages such as high spatial resolution, high spectral resolution, high timeliness, and low platform requirements. However, its working mechanism inherently causes misalignment errors in the dual-path images that it obtains due to exposure time differences. To address this issue, we propose a dual-path exposure time difference compensation method based on a velocity vector field model, enabling dynamic and precise matching of the dual paths. For target image points that move beyond the field of view, we propose an attitude compensation method based on optimal angular velocity coordination. Monte Carlo simulation results show that the maximum root mean square error of the compensation method across the entire field of view is 0.9792 pixels in the x-direction and 0.7130 pixels in the y-direction. Experimental results demonstrate the effectiveness of the method, which meets the requirements for practical applications and provides a reliable foundation for the real-world implementation of dual-path multi-target imaging spectrometers.

1. Introduction

Hyperspectral remote sensing has become a pivotal technology in modern Earth observation. It utilizes hyperspectral remote sensing spectrometers and plays an irreplaceable role in fields such as mineral identification, regional vegetation mapping, resource exploration, and environmental monitoring [1,2,3,4]. Among these, airborne hyperspectral imaging spectrometers have become the primary means for airborne and spaceborne hyperspectral remote sensing due to their advantages of high timeliness, high resolution, mobility, and ease of maintenance [5,6,7,8,9].
In recent years, with the rapid development of the global economy and technology, the pressure on fields such as geological exploration, resource surveys, and environmental monitoring has been increasing. Moreover, the objective limitations of airborne remote sensing platforms in terms of their power, their size, and the weight of the instruments they carry have made the demand for small, high-spectral-resolution imaging spectrometers with a large field of view and real-time detection capabilities even more urgent [10]. However, although traditional grating-based imaging spectrometers are known for their high resolution, the narrow slit of these spectrometers limits the system’s field of view. These instruments can only detect targets within a narrow field of view and require push-broom scanning to complete target detection, which leads to low imaging efficiency [11,12,13]. As a result, such systems place high demands on the stability of the platform and cannot meet the need for the simultaneous detection of multiple targets.
The multi-target imaging spectrometer originated in the 1980s from astronomical application research. The early multi-target imaging spectrometers primarily relied on traditional laser-engraved slit templates for multi-target selection [14]. Subsequently, multi-target selection technologies based on fiber bundles (such as LAMOST) [15,16,17] and configurable slits that used large mechanical structures (such as the Keck Observatory’s MOSFIRE) emerged [18]. However, these technologies undoubtedly made the multi-target imaging spectrometers that they were applied to quite large and bulky. In 2002, NASA developed a multi-target imaging spectrometer based on micro-shutter array technology for the James Webb Space Telescope (JWST) [19,20,21], which not only addressed the issue of the system’s large volume but also enabled automatic configuration of the slit module, improving the system’s detection efficiency. However, the micro-shutter array that was custom-built for the JWST was expensive and difficult to obtain. With the continuous development of optoelectronic technology, digital micro-mirror devices (DMDs) have demonstrated their advantages. In July 2017, a team from the University of Rochester and Johns Hopkins University published test results of a prototype for a dual-path multi-target imaging spectrometer based on DMDs, which confirmed its accuracy and reliability [22].
The DMD-based dual-path multi-target imaging spectrometer is capable of instantaneously capturing clear images of a two-dimensional field of view, which reduces the stability requirements for the airborne platform. Utilizing the pixel-level light modulation feature of the micro-optical-electrical device (DMD) enables the spectral analysis of multiple target regions (hundreds or even thousands of targets) within the two-dimensional field of view simultaneously, without the need for scanning [23,24,25,26,27]. This instrument not only inherits all the advantages of traditional grating spectrometers but also addresses their shortcomings, such as their high platform requirements and poor timeliness. It enhances the real-time capability and flexibility of airborne imaging spectrometers, avoids information redundancy, and effectively resolves the issue of low spatial resolution in traditional imaging spectrometers through the application of dual-optical-path imaging matching technology.
However, since the instrument relies on DMDs for pixel-level light modulation between the two optical paths, the same target point is not imaged simultaneously in both paths [28]. During the time between the exposure of the first and second paths, platform movement and changes in orientation can cause the corresponding image points of the target to shift. If the DMD micro-mirror corresponding to the image point in the imaging branch is flipped directly, the target’s image point may fail to enter the spectral branch, leading to a failure in the spectral analysis of the target.
This paper designs an airborne DMD-based dual-path multi-target imaging spectrometer. To address the issue of cross-exposure between the two optical paths, a compensation method based on a velocity vector field for exposure time differences is proposed. By using the velocity vector field model, the displacement vector of any target point on the DMD within the exposure time difference is predicted in advance, and attitude compensation is applied to target points outside the field of view. This ultimately achieves dynamic and precise matching of the dual-optical-path images.

2. Design and Analysis of the DMD-Based Dual-Path Multi-Target Imaging Spectrometer

2.1. Optical Design

The main technical parameters of the airborne DMD-based dual-path multi-objective imaging spectrometer are shown in Table 1. The spectral range and resolution are determined based on the detection requirements. For example, monitoring the growth status of vegetation and crops typically requires spectral information from the visible light band [29]. Higher spectral resolutions yield finer spectral characteristics, yet, in practical applications, there exists an inherent trade-off between broad spectral coverage and high spectral resolution due to the finite pixel count along the spectral dimension of detectors. Taking the system studied in this paper, which is primarily used for vegetation and water quality monitoring, as an example, the final spectral range is set at 400 nm~800 nm, with a spectral resolution of 2 nm.
The airborne DMD-based dual-path multi-target imaging spectrometer consists of three main components: the telescope, the imaging branch, and the spectral branch. The telescope is designed based on a retrofocus system to ensure a large back focal length that can accommodate the total internal reflection (TIR) prism. To ensure energy transfer efficiency, the pupils of the front and rear groups must be strictly matched during the process of splicing the telescope objective lens and the rear group. Since the DMD can be regarded as a plane mirror, we adopt an image-space telecentric structure for the telescope objective, as it allows for easier pupil matching with the subsequent optical path.
Both the imaging and spectral branches use an object-side telecentric structure to achieve optical pupil matching with the telescope. Additionally, the first surface of both branches is cylindrical to correct the astigmatism introduced by the TIR prism. The dispersive element of the spectral branch is a PGP (prism–grating–prism) assembly. Within this PGP configuration, the primary dispersion function is achieved through a transmission-type volume holographic grating, which offers distinct advantages including high spectral resolution and high diffraction efficiency. The prism adjusts the incident light angle to ensure that the central wavelength of the on-axis point satisfies the Bragg condition, thereby achieving optimal diffraction efficiency. Additionally, the introduction of the prism converts the spectral branch into a coaxial system, facilitating alignment and assembly. The focal length of the spectral branch’s focusing lens is f = 40   m m . Based on the specified spectral resolution requirements and prior design experience, the grating groove density is set at 225 lp/mm, while the prism material is H-K9L with an apex angle of 7.407°.
The three components are interconnected through the TIR prism and DMD. The DMD is located at the focal plane of the telescope’s objective lens. Each micro-mirror on the DMD corresponds strictly to a target point in the two-dimensional field of view, a pixel on the high-resolution imaging branch detector, and a spectral line on the high-spectral collection branch. By controlling the flipping of the micro-mirrors, the light from any object can be directed into either the high-resolution imaging branch or the high-spectral collection branch. The TIR prism serves to redirect the light path, preventing spatial interference between the different branches.
Except for the DMD, the entire system is a transmissive optical system that is compact and lightweight, which makes it suitable for airborne applications. The overall design is shown in Figure 1a.
As seen in Figure 1b, the MTF (modulation transfer function) of the imaging branch across the full field of view reaches above 0.3 at 67 lp/mm. The energy concentration of the spectral branch across the full field of view remains above 90% within a 2 × 2 pixel range. This indicates that the overall image quality of the instrument is good and meets the requirements for practical applications.

2.2. Analysis of the Exposure Time Difference

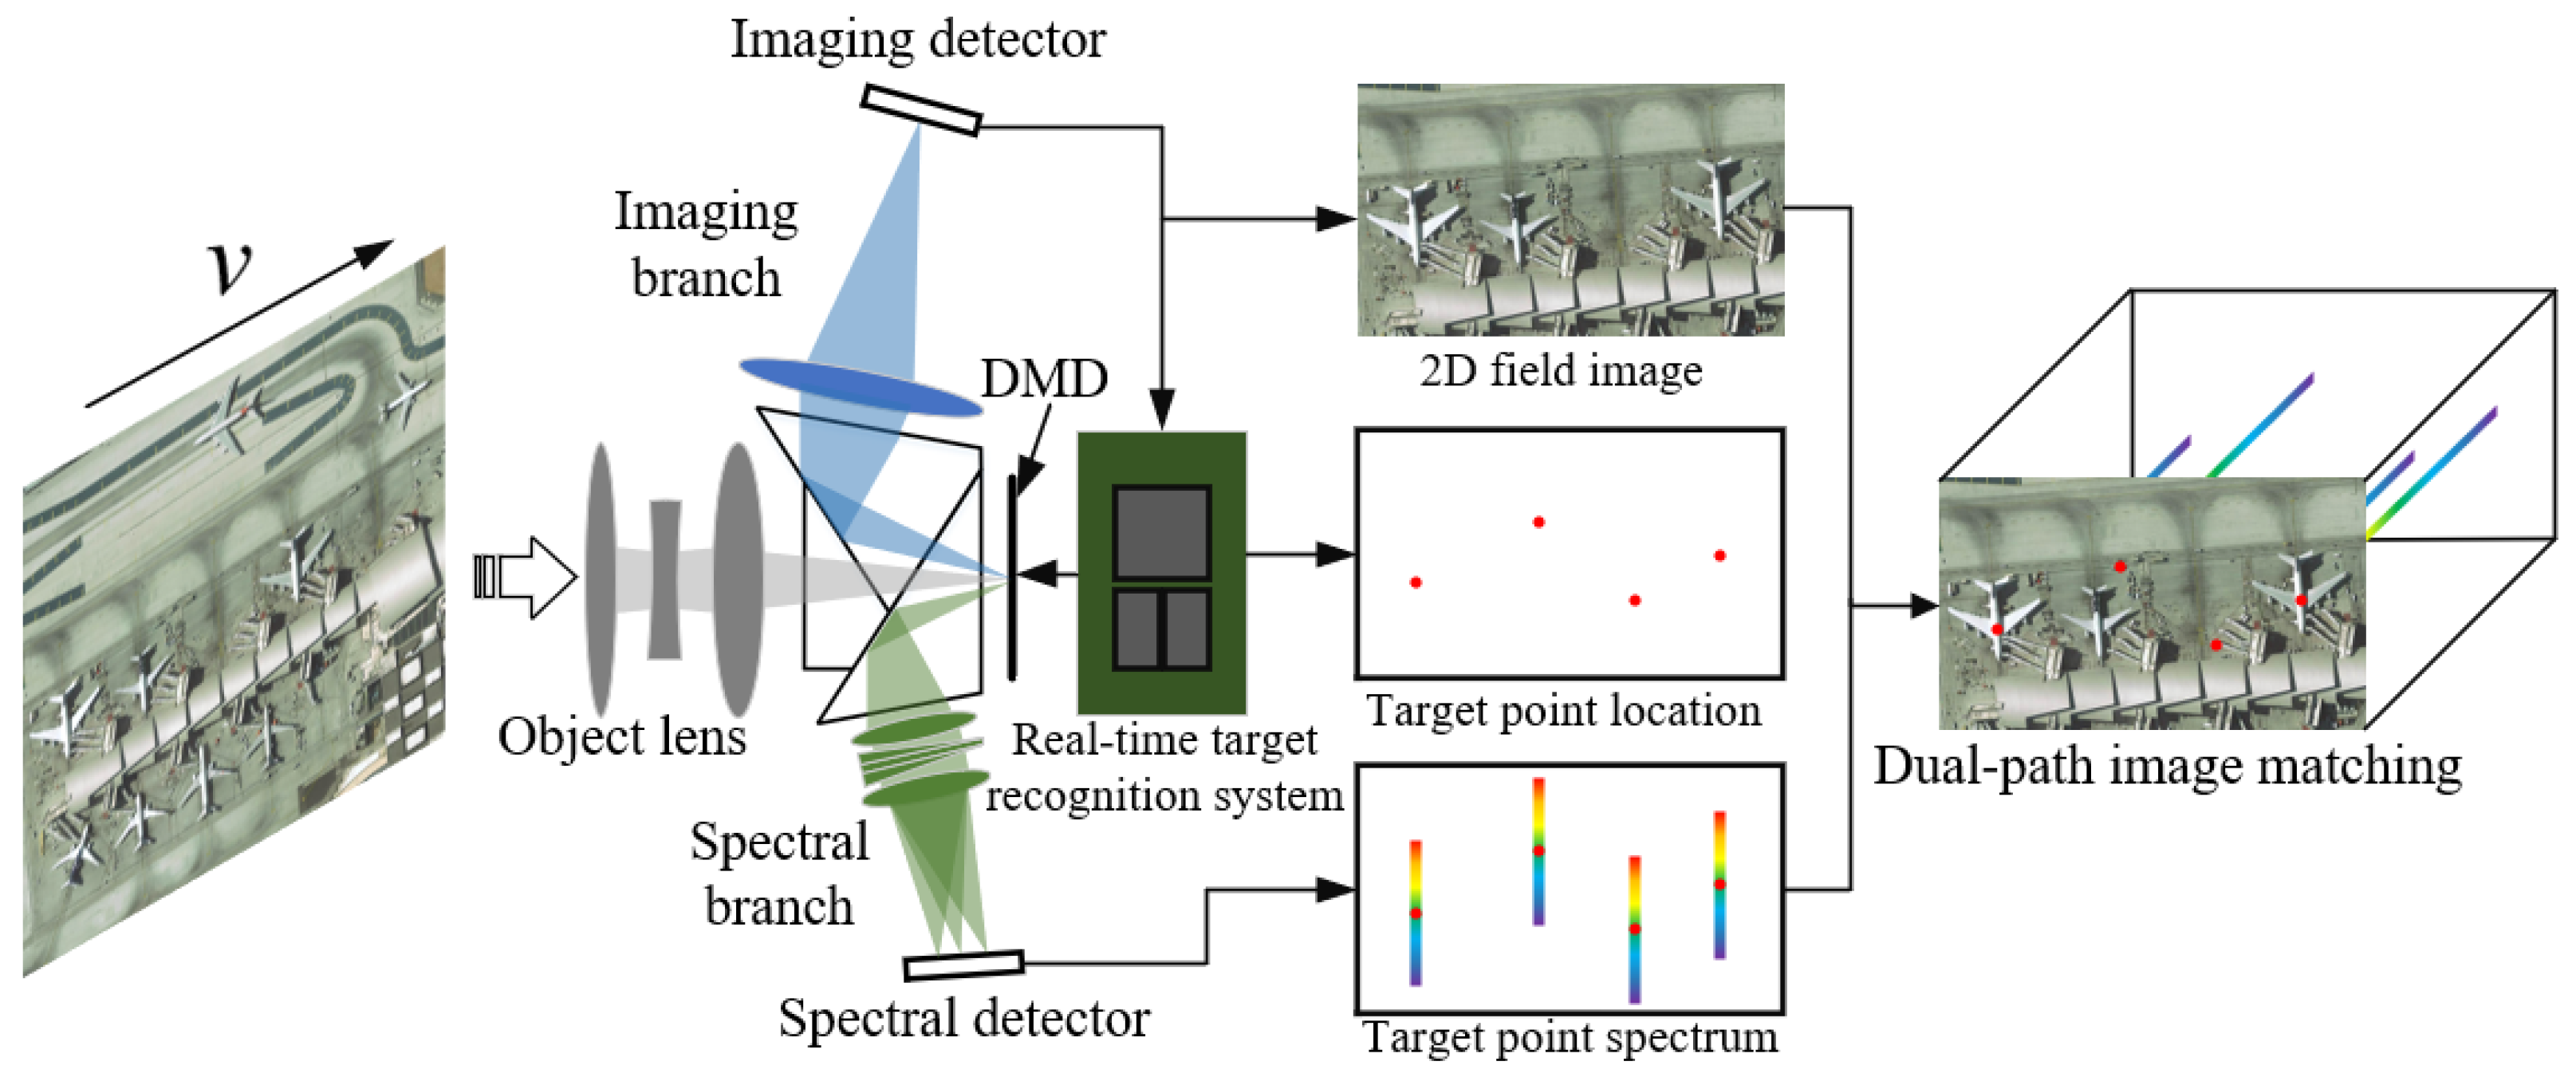
The working principle of the DMD-based dual-path multi-target imaging spectrometer is shown in Figure 2. In the default state during operation, all micro-mirrors on the DMD are tilted towards the imaging branch, enabling instantaneous observation of the two-dimensional field of view. When the real-time image processing system detects targets that require spectral analysis, the coordinates of the target points in the image and the mapping relationship between the DMD and the imaging detector are used to determine the position of the corresponding image point on the DMD at the time of imaging. The corresponding micro-mirror on the DMD is then flipped to direct the target point into the high-spectral collection branch for spectral analysis.
Taking water ecological monitoring as an example, when the imaging branch detects abnormal water areas, it can tilt the corresponding DMD micro-mirrors towards the spectral branch. This enables the inversion of the chlorophyll-a concentration obtained through spectral imaging, and thereby allows the effective monitoring of water eutrophication and algal blooms [30].
It is important to note that the high-resolution imaging path and the hyperspectral acquisition path are not exposed simultaneously; there are exposure time differences between the dual-path imaging processes (including high-resolution image acquisition, image analysis, DMD micro-mirror control, etc.). The DMD serves as the critical link for image matching between the imaging and spectral branches. However, during remote sensing reconnaissance, the continuous motion of the carrier aircraft combined with the existence of exposure time differences causes displacement of the target’s image on the DMD during hyperspectral acquisition. This results in calculation errors of the corresponding DMD micro-mirror positions for the target points, ultimately affecting the accuracy of the spectral analysis. This also introduces difficulties in matching the dual-path images later. Therefore, it is necessary to study the movement of the target image points on the DMD and compensate for the exposure time difference in order to establish a strict coupling relationship between the imaging detector, the DMD, and the spectral detector for subsequent image processing and data analysis.

3. Velocity Vector Field Model in Complex Motion States

3.1. Ground Target-Dmd Instantaneous Mapping Model

During reconnaissance missions, the aircraft adjusts its flight speed, attitude angles (pitch, roll, and yaw), and pod attitude angles (pitch and yaw) to observe the target [31]. The relative motion speed between the target and the aircraft is also influenced by the aircraft’s flight speed, the angular velocities of the aircraft’s attitude, and the angular velocities of the pod’s attitude [32,33,34]. Due to the high flexibility of the aircraft’s reconnaissance capabilities and its variable posture, the relative motion between the target and the aircraft differs under various attitude conditions. Therefore, to establish a velocity vector field model for the movement of image points on the DMD during the reconnaissance process, it is necessary to first determine the mapping relationship between the target and the DMD micro-mirrors under any given attitude angle.
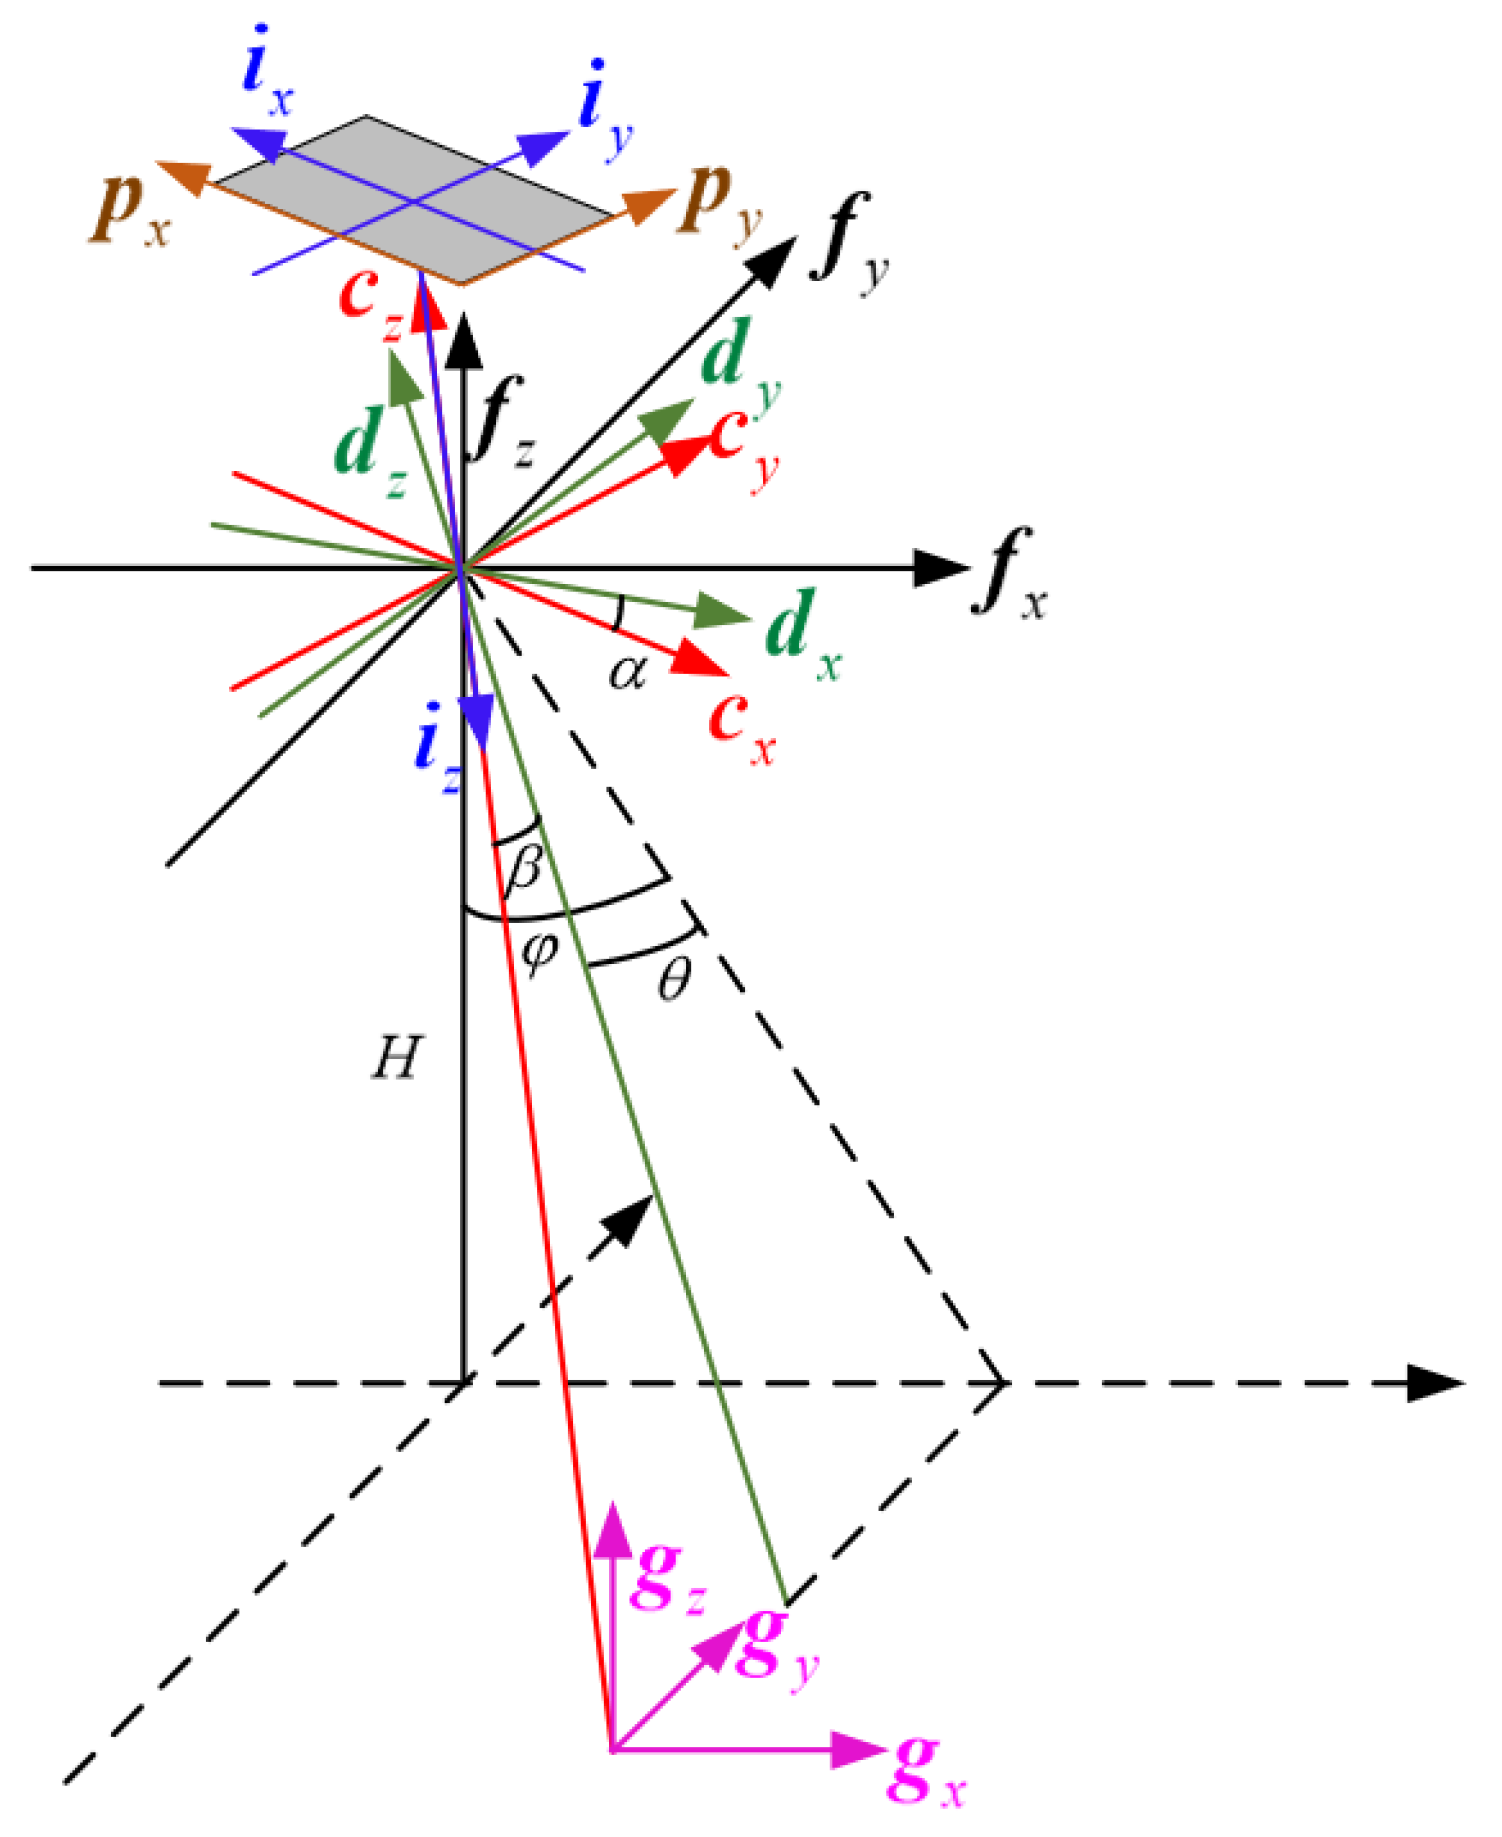
In this paper, the mapping relationship between the target and the DMD micro-mirrors is determined using ray tracing and coordinate transformation methods. Multiple right-handed coordinate systems are defined as needed, and vectors are represented by bold symbols, while scalars are represented by regular symbols. The coordinate systems are outlined as follows:
(1)
Aircraft flight trajectory coordinate system F ( f x , f y , f z ) : The coordinate origin is located at the aircraft’s center of mass, with the f y pointing in the direction of flight, the f z pointing vertically toward the sky, and the f x completing the right-handed coordinate system. Unless otherwise specified, the vectors and coordinates in this paper are all expressed in this coordinate system;
(2)
Aircraft coordinate system D ( d x , d y , d z ) : The coordinate origin is located at the aircraft’s center of mass. When the aircraft’s attitude angles change (pitch angle is θ , roll angle is φ , and yaw angle is ψ ), the aircraft flight trajectory coordinate system F ( f x , f y , f z ) is rotated around the f z by ψ , around the f x by θ , and around the f y by φ to obtain the aircraft coordinate system D ( d x , d y , d z ) ;
(3)
Camera coordinate system C ( c x , c y , c z ) : The camera is fixed to the aircraft via a pod. Ignoring installation errors, it is assumed that the origin of the camera coordinate system is located at the aircraft’s center of mass. The camera coordinate system C ( c x , c y , c z ) is obtained by rotating the aircraft coordinate system D ( d x , d y , d z ) around the d z by angle α , and then around the c x by angle β ;
(4)
Ground coordinate system G ( g x , g y , g z ) : The coordinate origin is the intersection of the c z and the ground at time t = 0, the g x and the f x have the same direction, the g y and the f y have the same direction, and the g z is perpendicular to the ground, pointing upwards;
(5)
Image plane coordinate system I ( i x , i y , i z ) : The origin of the image plane coordinate system is located at the center of the DMD. When the aircraft and camera have no attitude change, the i y lies in the plane of the detector and points in the direction of the aircraft’s flight, while the i z points toward the terrain target along the optical axis;
(6)
DMD coordinate system P ( p x , p y ) : The origin of the DMD coordinate system is located at the lower-right corner of the DMD. The p x is aligned with the i x of the image plane coordinate system, and the p y is aligned with the i y of the image plane coordinate system.
The positional relationships between the coordinate systems used in this paper are shown in Figure 3.
In the process of mapping the ground target to the DMD mirror coordinates, the direction of the camera’s optical axis is very important. Therefore, the first step is to determine the direction vector of the camera’s optical axis under various conditions. The direction vector of the camera’s optical axis A x i s 0 when only considering the aircraft’s attitude angles, and the optical axis vector A x i s when both the aircraft and pod’s attitude angles are considered, are as follows:
A x i s 0 = R y φ R x θ R z ψ 0 0 1
A x i s = R y φ R x θ R z ψ + α R x β 0 0 1 = x a f y a f z a f
where R x ( θ ) represents the rotation angle θ around the f x , R y ( φ ) represents the rotation angle φ around the f y , and R z ( ψ ) represents the rotation angle ψ around the f z .
R x θ = 1 0 0 0 c o s θ s i n θ 0 s i n θ c o s θ
R y φ = c o s φ 0 s i n φ 0 1 0 s i n φ 0 c o s φ
R z ψ = c o s ψ s i n ψ 0 s i n ψ c o s ψ 0 0 0 1
The aircraft’s flight altitude is H, and the intersection point of the camera’s optical axis with the ground is ( H x a f ) / z a f ( H y a f ) / z a f H . In the ground coordinate system, the target point with the coordinates x t g y t g 0 corresponds to the coordinates x t g ( H x a f ) / z a f y t g ( H y a f ) / z a f H in the aircraft flight trajectory coordinate system. The direction vector from the target point to the coordinate origin is A t f . The coordinate of the target point in the camera coordinate system is x t c y t c z t c , and the corresponding image point in the image plane coordinate system has the coordinates x t i y t i 0 .
x t c y t c z t c = c x c y c z H x a f z a f + x t g H y a f z a f + y t g H
x t i = x t c f z t c y t i = y t c f z t c
where f is the focal length of the camera.
Assume that the DMD has 2 M × 2 N micro-mirrors, with 2 N pixels in the p y -direction. The DMD micro-mirror coordinates j , k corresponding to the image point with the coordinates x t i , y t i , 0 in the image plane coordinate system can be obtained using the following equation:
j = M + x t i a k = N + y t i a
where a is the side length of the DMD micro-mirror and x represents the rounding up of x .

3.2. Velocity Vector Field Model

After determining the mapping relationship between the ground object and the DMD micro-mirrors under any given state, the velocity vector of any image point on the DMD can be determined through the imaging relationship and the attitude changes of the airborne platform.
For ground objects, their velocity relative to the camera is composed of five components, as shown in Figure 4a.
V t f = V θ f + V φ f + V ψ f + V β f + V d f
where V θ f is the object’s movement speed caused by the aircraft’s pitch angle variation, V φ f is the object’s movement speed caused by the aircraft’s roll angle variation, V ψ f is the object’s movement speed caused by the aircraft’s equivalent yaw angle variation, V β f is the object’s movement speed caused by the camera’s pitch angle variation, and V d f is the object’s relative movement speed caused by the aircraft’s flight.
According to the geometric relationships and vector operation rules, the direction and magnitude of each component’s speed are as follows:
A θ f = g z × ( A t f × ( f x × A t f ) ) g z × ( A t f × ( f x × A t f ) ) v θ = ω θ H f x × A t f 2 A t f 3 f x × A t f · A θ f
A φ f = g z × A t f × ( f y × A t f ) g z × A t f × ( f y × A t f ) v φ = ω φ H f y × A t f 2 A t f 3 f y × A t f · A φ f
A ψ f = g z × A t f × ( A t f × A x i s 0 ) g z × A t f × ( A t f × A x i s 0 ) v ψ = ω ψ H A t f × A x i s 0 2 A t f 3 A t f × A x i s 0 · A ψ f
A β f = g z × A t f × ( c x × A t f ) g z × A t f × ( c x × A t f ) v β = ω β H c x × A t f 2 A t f 3 c x × A t f · A β f
A d f = 0 1 0 v d = v 1
where v 1 is the magnitude of the aircraft’s flight speed. It is important to note that, if A t f and A x i s 0 are parallel, then A ψ f = [ 0 0 0 ] } and v ψ = 0 .
By transforming the velocity vectors of the ground object in each direction to the camera coordinate system, the following can be obtained:
V θ c V φ c V ψ c V β c V d c = c x c y c z V θ f V φ f V ψ f V β f V d f
As shown in Figure 4b, the movement of the object is converted to the corresponding image point movement using the imaging relationship and the principle that the object speed and image point speed lie in the same plane. Taking V d c = v d · A d c as an example, its projection speed on the image plane is:
A d c = A t c × A d c × c z A t c × A d c × c z v d c = v d f A t c × A d c z t c A t c × A d c
By converting it to the image plane coordinate system, the result can be obtained as follows:
A d i = A d c 1 A d c 2 0 v d i = v d c
The remaining velocity components are similar. By summing all the individual velocity components, the total velocity of the target point on the DMD can be obtained.

4. Exposure Time Difference Compensation

According to the velocity vector field model, the motion speed of the image on the DMD is related to the changes in the aircraft’s attitude, the pod’s attitude, and the aircraft’s speed, and varies with the position of the image point. At the same time, the principle of the multi-target imaging spectrometer determines that any point on the DMD may flip to the spectral branch. Target image points near the edges are more likely to exceed the field of view and cannot be subjected to spectral analysis. To address the above-mentioned issues, an exposure time difference compensation method is proposed, as illustrated in Figure 5. By using the velocity vector field model, the displacement vector of any image point during the exposure time difference can be obtained, which allows for an estimation of the target image point’s position after the exposure time difference. There are typically two scenarios: one where the image point remains within the field of view of the DMD and another where the image point falls outside the DMD. For the latter case, an attitude compensation method based on the optimal angular velocity coordination is proposed.

4.1. When the Image Points Are Still Within the Field of View

For image points that remain within the field of view after the exposure time difference their final positions need to be determined in order to control the corresponding DMD flip for spectral analysis.
By integrating the velocity vectors of the image points during the time between exposures Δ t , the total displacement vector of the target point during this period can be obtained as follows:
L = t 0 t 0 + Δ t V d t
where t 0 represents the time at which the imaging branch captures the image, and where the exposure time difference Δ t mainly depends on the system’s image acquisition process, real-time target recognition, and control of the DMD deflection.
The image acquisition process is primarily affected by factors such as the type of detector, data volume, and data transmission interface. For example, in the experiment presented in this paper, the GSENSE2020 detector (manufactured by Gpixel, Changchun, China) that was used has a real-time frame rate of approximately 40 fps in the high-resolution and high-dynamic-range mode, meaning that the image acquisition time for a single frame is less than 25 ms. The speed of the real-time target recognition algorithm is influenced by various factors, including the hardware performance, algorithm complexity, data volume, and task requirements. Most target recognition algorithms operate in the range of 1–30 fps. For some complex networks that process high-resolution images, the processing speed is typically within 1–10 fps. By reducing the input image resolution and sacrificing some recognition accuracy, the recognition speed can be significantly improved, and can even exceed 100 fps [35,36,37]. However, this is not applicable in practical use. The time required for controlling the DMD flip is on the microsecond scale and can typically be ignored during actual use.
In practical applications, the exposure time difference for each imaging event can be determined by using the internal clock of the aircraft platform to record the imaging start time, the image processing start time, and the image processing end time. Additionally, to facilitate mission planning, a value slightly larger than the actual exposure time difference can be selected as the expected exposure time difference, based on the performance of the detector and the target recognition algorithm.
Since the acquisition of aircraft attitude information is discrete, in practical applications, discrete sampling integration is required. The exposure time difference Δ t is divided into n segments (where n depends on the frequency at which the aircraft attitude information is obtained), and the displacement for each segment is calculated separately. Since the time differences between consecutive attitude data points are very short, the trapezoidal integration method is used here. It is important to note that, during the time between exposures Δ t , the image on the DMD is moving in real-time, so the coordinates of the target point need to be updated during the integration process.
L = i = 1 n V i 1 x i 1 , y i 1 + V i x i 1 , y i 1 Δ t 2 n
In Equation (19), V i ( x i 1 , y i 1 ) represents the velocity vector of the image point at the i -th time segment, and the coordinates of the image point can be obtained by the following formula:
x i y i = V i 1 x i 1 , y i 1 + V i x i 1 , y i 1 Δ t 2 n + x i 1 y i 1 i = 1 , 2 n

4.2. When the Image Points Are Outside the Field of View

For image points that fall outside the DMD, this paper proposes a compensation scheme based on optimal angular velocity coordination of the pod. By using the velocity vector field model to determine the current state of the target image point, the pod’s attitude angle can be adjusted to control its movement back into the field of view for spectral analysis.
Since the attitude changes of the carrier aircraft can alter the actual observation range of the spectrometer, it is necessary to determine whether all points outside the DMD can be fully covered by a single imaging before performing attitude compensation. For the set of N target points outside the field of view, denoted as P = p 1 , p 2 , , p N , we calculate the convex hull. If the DMD’s field of view cannot fully cover the convex hull of the target points, the target points need to be grouped and analyzed separately for spectral analysis.
Although the movement speeds of different points on the DMD vary, they follow a similar trend. Therefore, the dispersion of points outside the DMD is usually not significant, and it is only necessary to divide the set P into two subsets, C 1 and C 2 , which satisfy Equation (21).
c 1 c 2 2 m a x p C 1 p c 1 2 + p C 2 p c 2 2 m i n
Here c 1 and c 2 are the geometric centers of sets C 1 and C 2 , respectively.
First, calculate the Euclidean distances between all points using Equation (22), and select the two points with the largest separation as the initial centers c 1 and c 2 for sets C 1 and C 2 , respectively. Next, compute the distances from each remaining point to c 1 and c 2 , assigning each point to the closer set. After each assignment, update the center positions of the sets using Equation (23). Repeat this process until all target points are grouped.
d i j = p i p j 2 = ( x i x j ) 2 + ( y i y j ) 2
c 1 = 1 C 1 p C 1 p ,   c 2 = 1 C 2 p C 2 p
After completing the grouping of the target points (or when all target points can be covered by the DMD’s field of view), attitude compensation is performed. In this study, we use the geometric center of the points outside the DMD to represent all image points and perform attitude compensation on this collective. Assuming the geometric center coordinates are ( x b i , y b i ) , to ensure all target image points return within the field of view, the required displacement vector of the geometric center should be:
L b i = x b i y b i
At this point, there is no intervention in the aircraft’s flight speed, attitude angles, or attitude angular velocity. Instead, by coordinating the pod’s pitch and yaw angular velocities, the total velocity vector of the image point is optimized to maximize its component in the L b i direction, which enables all target image points to return to the field of view as quickly as possible. The constraints for solving the pod’s angular velocity during the compensation phase are as follows:
ω b α i < ω α m a x ω b β i < ω β m a x V b i = V b θ i + V b φ i + V b ψ i + V b β i + V b d i V b i · L b i m a x
In the equation, ω α m a x represents the maximum yaw angular velocity allowed by the pod hardware and ω β m a x represents the maximum pitch angular velocity allowed by the pod hardware.
In order to improve the compensation speed while ensuring observation quality, the attitude compensation can be terminated once all image points have entered a specified region within the field of view (as defined by actual requirements). At this point, the corresponding DMD micro-mirrors can be flipped to perform spectral analysis.
It is important to note that, during the attitude compensation process, the attitude angular velocity of the pod for the next moment is calculated based on the current attitude information. This calculation inevitably introduces some errors (since the movement speed of the image points due to the pod’s attitude angular velocity is much greater than the movement speed caused by other factors, this error is usually very small). In practical applications, the position of the image points after attitude compensation still needs to be obtained through displacement vector calculation.

5. Simulation

To verify the accuracy and reliability of the exposure time difference compensation method, a performance simulation analysis is conducted. First, the entire process of the exposure time difference compensation method is simulated and verified through imaging to demonstrate its functionality. Then, the reliability and efficiency of the attitude compensation method are validated using the Monte Carlo method. Finally, an error analysis of the entire algorithm is performed, laying the foundation for subsequent practical applications.

5.1. Exposure Time Difference Compensation Method

Imaging simulations of complex scenes are performed in MATLAB 2023a to fully demonstrate the effect of the exposure time difference compensation method. In the imaging process, the initial values of the aircraft’s attitude parameters are non-zero and change at a constant speed. Simulations are conducted to evaluate the imaging effects on the DMD plane at different moments under this condition. The motion parameters of the aircraft during this process are shown in Table 2.
To better demonstrate the robustness of the exposure time difference compensation method and ensure its applicability in practical scenarios, the exposure time difference Δ t is set to 1 s in our simulations. It should be noted that the proposed compensation method remains equally effective for exposure time differences shorter than 1 s.
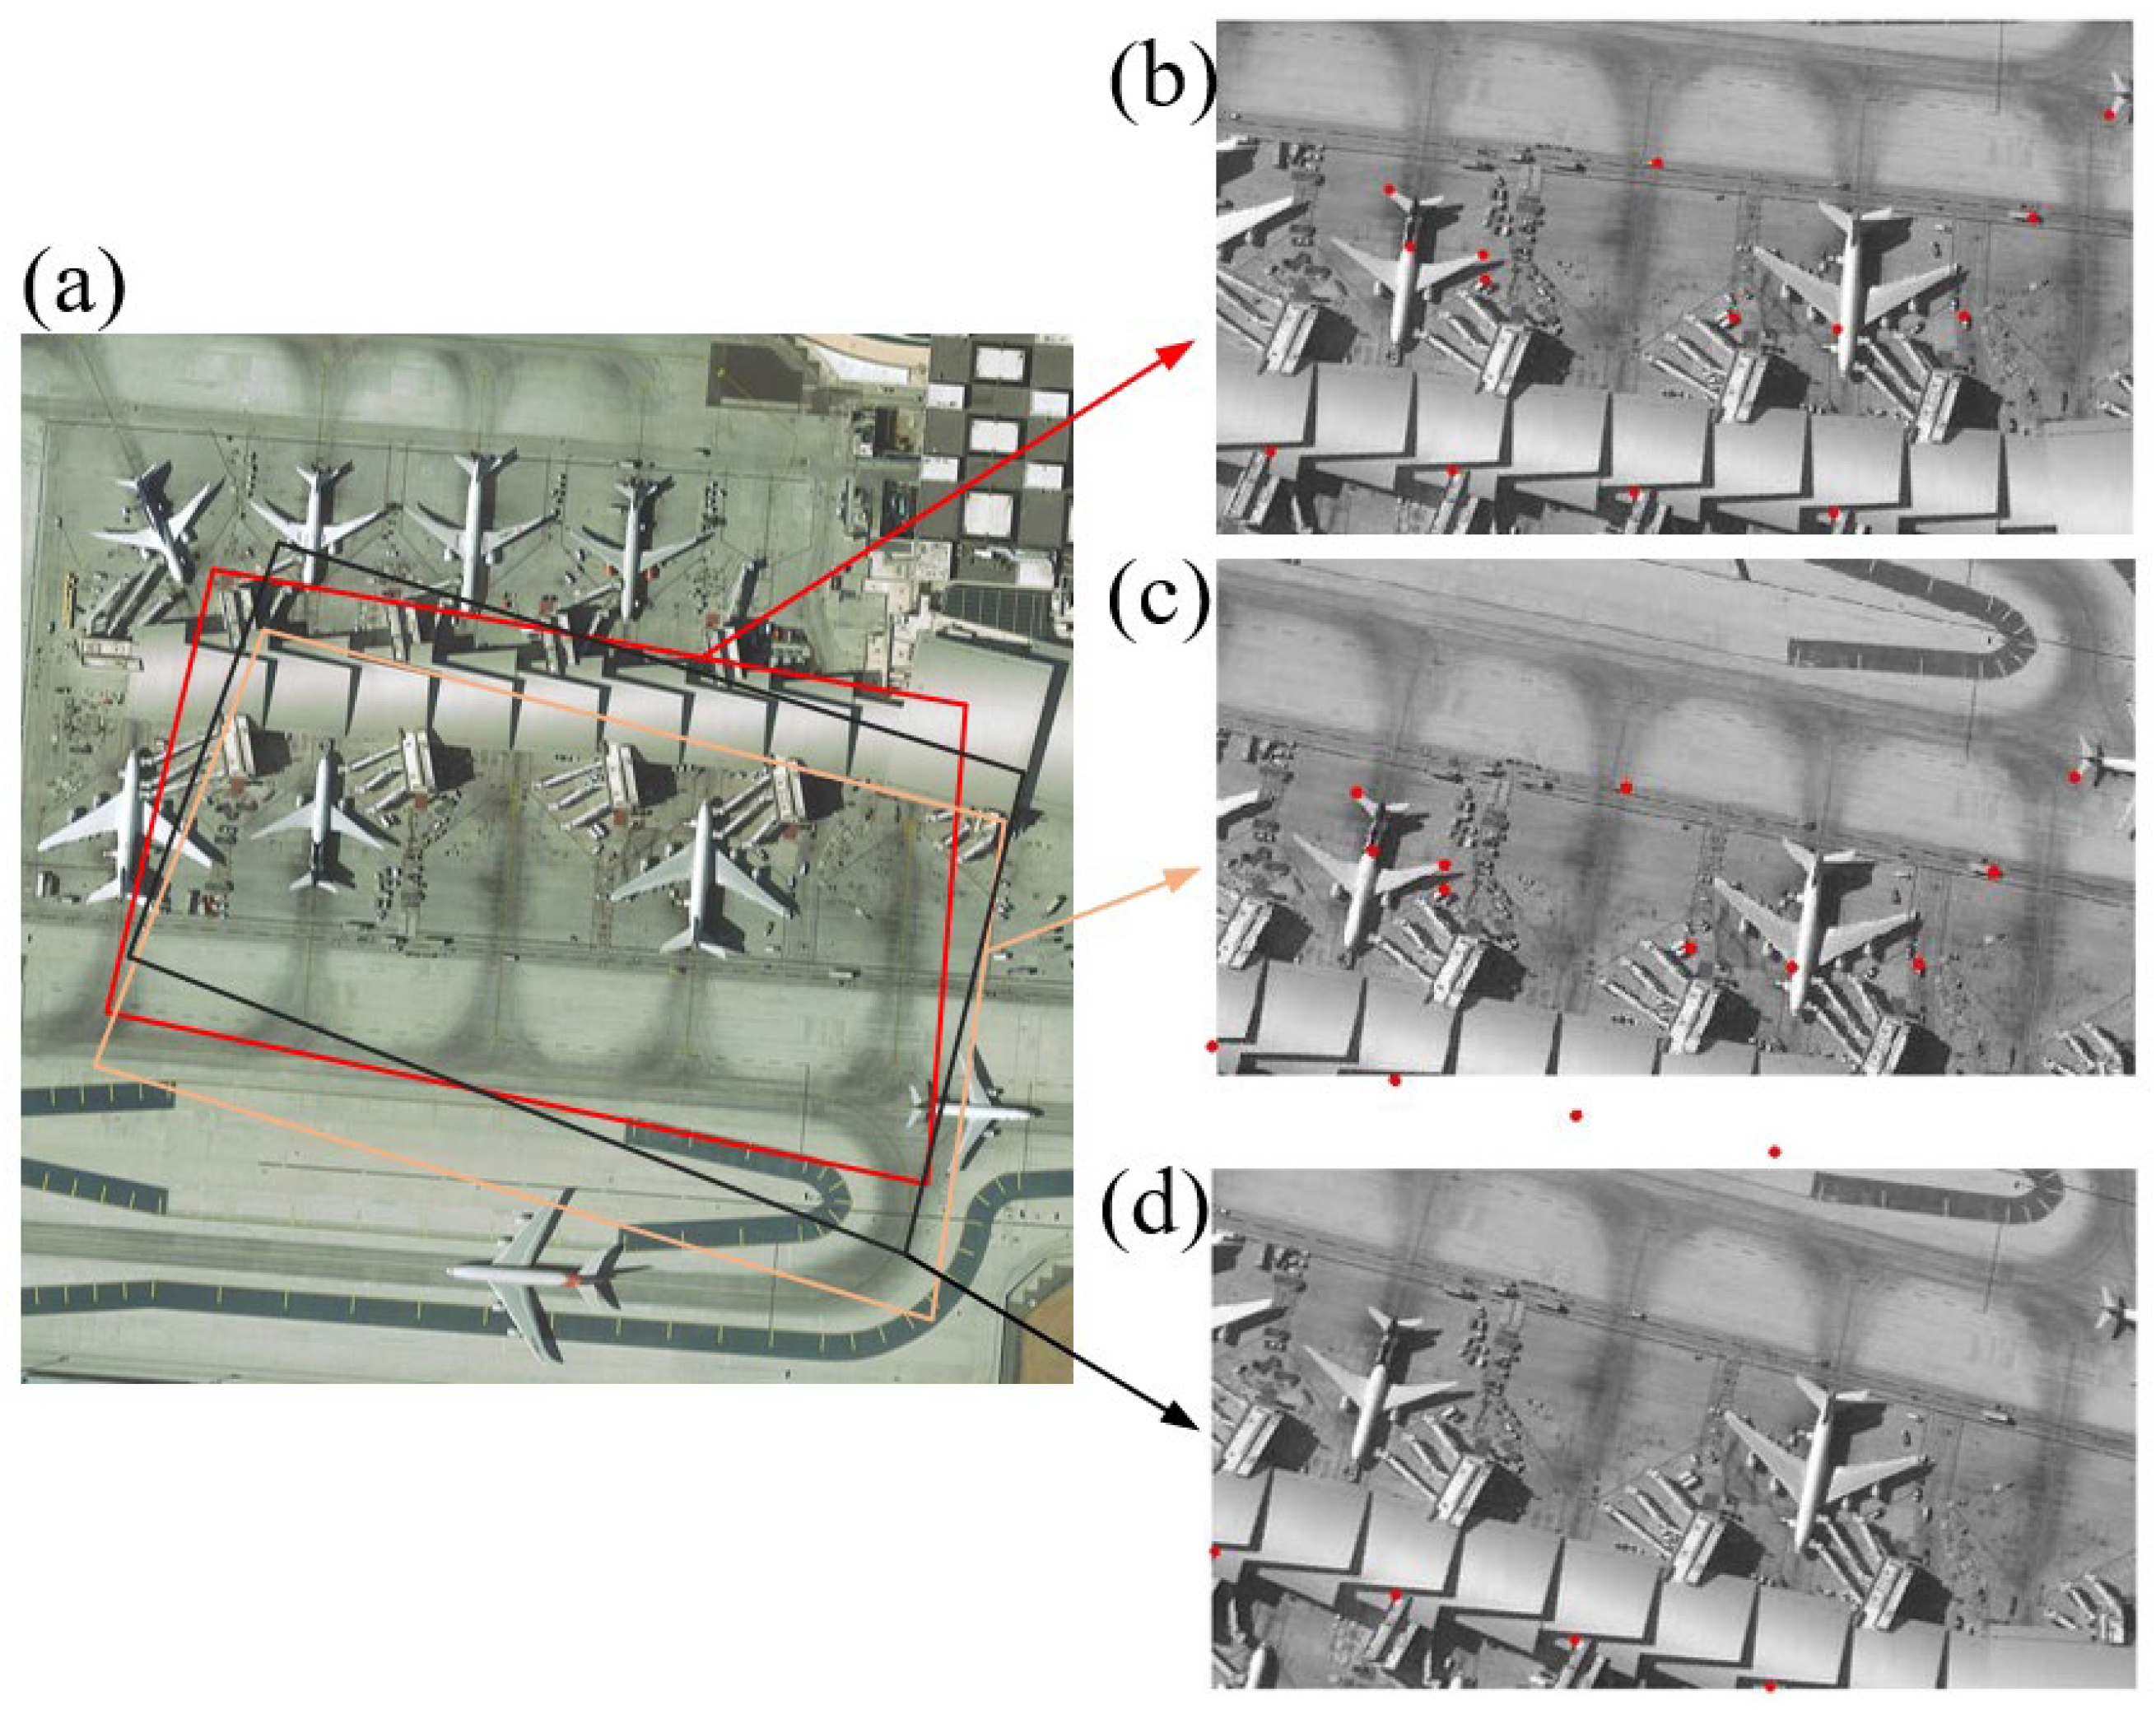
The ground scene at time t = 0 is shown in Figure 6a, where the center of the image corresponds to the coordinate origin of the ground coordinate system at this moment (this image is from the dataset DIOR published by Northwestern Polytechnical University [38], and the same image is used in Figure 2 and Figure 5 of this paper). Imaging simulations are conducted for the system in this state, and 14 target points are selected on the DMD image, as shown in Figure 6b. The target points are tracked in real-time using the velocity vector field model, with a sampling interval of 0.1 s being chosen for the velocity vector field (shorter sampling intervals would yield more accurate displacement vector calculations but would require more computational time, which affects real-time performance). The image on the DMD and the positions of the target points at time t = 1   s are shown in Figure 6c. The calculation results yield a root mean square error (RMSE) of 0.1878 pixels in the x-direction and 0.2355 pixels in the y-direction. The side length of a single pixel is 7.56 μm. For target points beyond the DMD field of view, attitude compensation is applied, and the compensation results are shown in Figure 6d. A compensation time of 0.03 s was achieved.

5.2. Attitude Compensation Method

Monte Carlo methods are used to estimate expected values or optimal solutions through extensive random sampling. To verify the correctness and efficiency of the attitude angular velocity coordination compensation scheme, a Monte Carlo method is used to simulate the attitude compensation for target points beyond the field of view in Figure 6c.
According to the calculations, target points outside the field of view in Figure 6c can achieve full coverage with a single compensation. The pose information corresponding to Figure 6c was used as the initial values in the Monte Carlo simulations. The aircraft’s attitude angular velocities followed the specifications in Table 2, while the pod’s pitch and yaw angular velocities were randomly generated within their allowable ranges. The simulation results—evaluated based on whether all four target points were successfully brought into the field of view—that were obtained with an angular velocity control interval of 0.01 s and 10,000 Monte Carlo runs being performed are summarized in Table 3 for different compensation durations.
For the target points beyond the field of view shown in Figure 6c, the attitude compensation method with the optimal angular velocity coordination proposed in this paper takes 0.03 s for compensation. As shown in Table 3, the Monte Carlo simulation did not find any compensation scheme with a time shorter than 0.03 s.
Using the distance from the compensated edge image point to its corresponding DMD field-of-view boundary as the evaluation criterion, the best angular velocity coordination schemes corresponding to the compensation times of 0.03 s and 0.04 s from Table 3 are selected. These are compared with the compensation method proposed in this paper. The compensation trajectories of the edge image points are shown in Figure 7, and the distances from the compensated image points to the DMD field-of-view boundary are shown in Table 4.
A comprehensive analysis of Table 3 and Table 4 reveals that the proposed method offers faster compensation speed. Furthermore, after compensation, the target points are positioned farther from the edge of the DMD’s field of view, resulting in better correction performance for edge image points. With higher stability in practical applications, this method effectively meets real-world requirements.
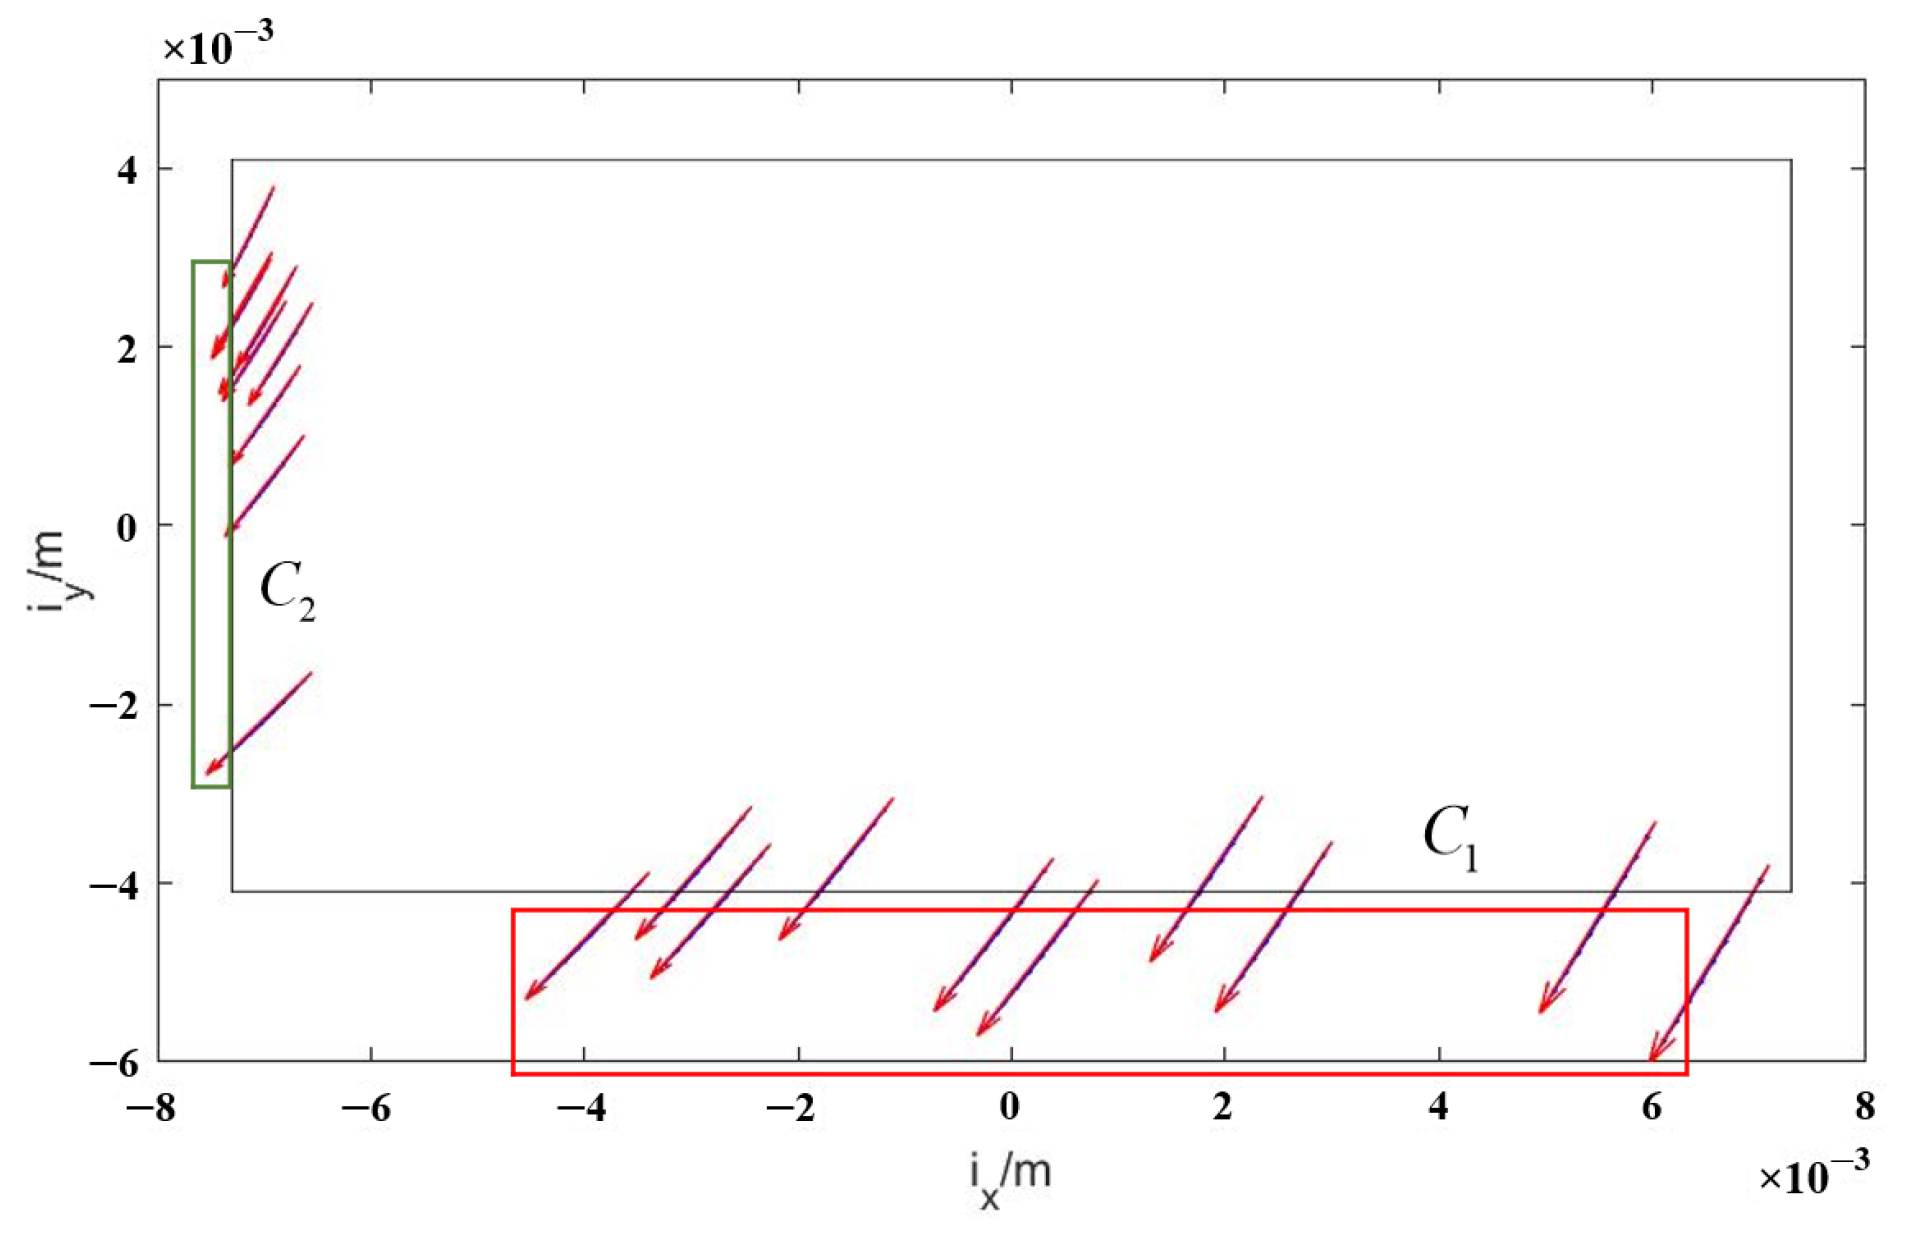
Target points were randomly selected near the field-of-view (FOV) edges along two adjacent directions of the DMD. Using the system parameters listed in Table 2, the velocity vector field model was employed to achieve real-time tracking of these targets. With the exposure time difference being maintained at 1 s, the resulting motion trajectories are shown in Figure 8.
At this point, a single compensation cannot fully cover all target points, necessitating grouping and separate compensation. For group C 1 , since its intended motion direction is approximately aligned with V β f , the pod’s pitch angle is set to the maximum value and coordinated with the yaw angle to quickly reach the target position. The compensation result is shown in Figure 9a, for which a completion time of 0.03 s was achieved.
During the attitude compensation for group C 2 , since the intended motion direction is approximately perpendicular to V β f , V α f dominates the compensation process. However, when the angular velocities are equal in magnitude, V α f is significantly smaller than V β f . Consequently, this compensation requires more time (0.1 s), yet remains within the acceptable range for practical applications. The compensation trajectory is shown in Figure 9b.
Using the system parameters listed in Table 2, 20 target points were randomly selected near the edges of the field of view in two adjacent directions of the DMD. A Monte Carlo simulation with 10,000 trials was conducted. The results showed that, in 4323 cases, all target points could be restored to the FOV through single-step compensation, with an average time of 0.0329 s. The remaining 5677 cases required grouped compensation, taking an average of 0.115 s. Thus, the compensation speed meets practical requirements.

5.3. Error Analysis

Ignoring the misalignment errors caused by equipment installation, the errors in the exposure time difference compensation process mainly come from three aspects:
  • Displacement vector calculation errors caused by discrete integration;
  • Velocity vector calculation errors caused by measurement errors in the aircraft’s state parameters;
  • Target positioning errors caused by errors in the aircraft’s state parameters.
The displacement vector calculation errors due to discrete integration were already simulated and analyzed in Section 5.1. In practical applications, this error can be reduced by increasing the sampling interval.
According to the velocity vector field model, measurement errors in the aircraft’s state parameters will affect the results of the velocity vector field calculation, and will thus impact the displacement vector calculation for the target image points. Additionally, when determining the final position of the image point and controlling the corresponding DMD flip to enter the spectral branch, due to measurement errors in the aircraft’s attitude and elevation, the actual imaging position of the ground object on the DMD may differ from the calculated value. This, in turn, will affect the accuracy of the DMD micro-mirror flip.
In practical applications, information such as the aircraft’s speed, altitude, attitude angles, and angular velocities can be obtained through a GPS/INS integrated navigation and positioning system. The error ranges for these parameters are shown in Table 5.
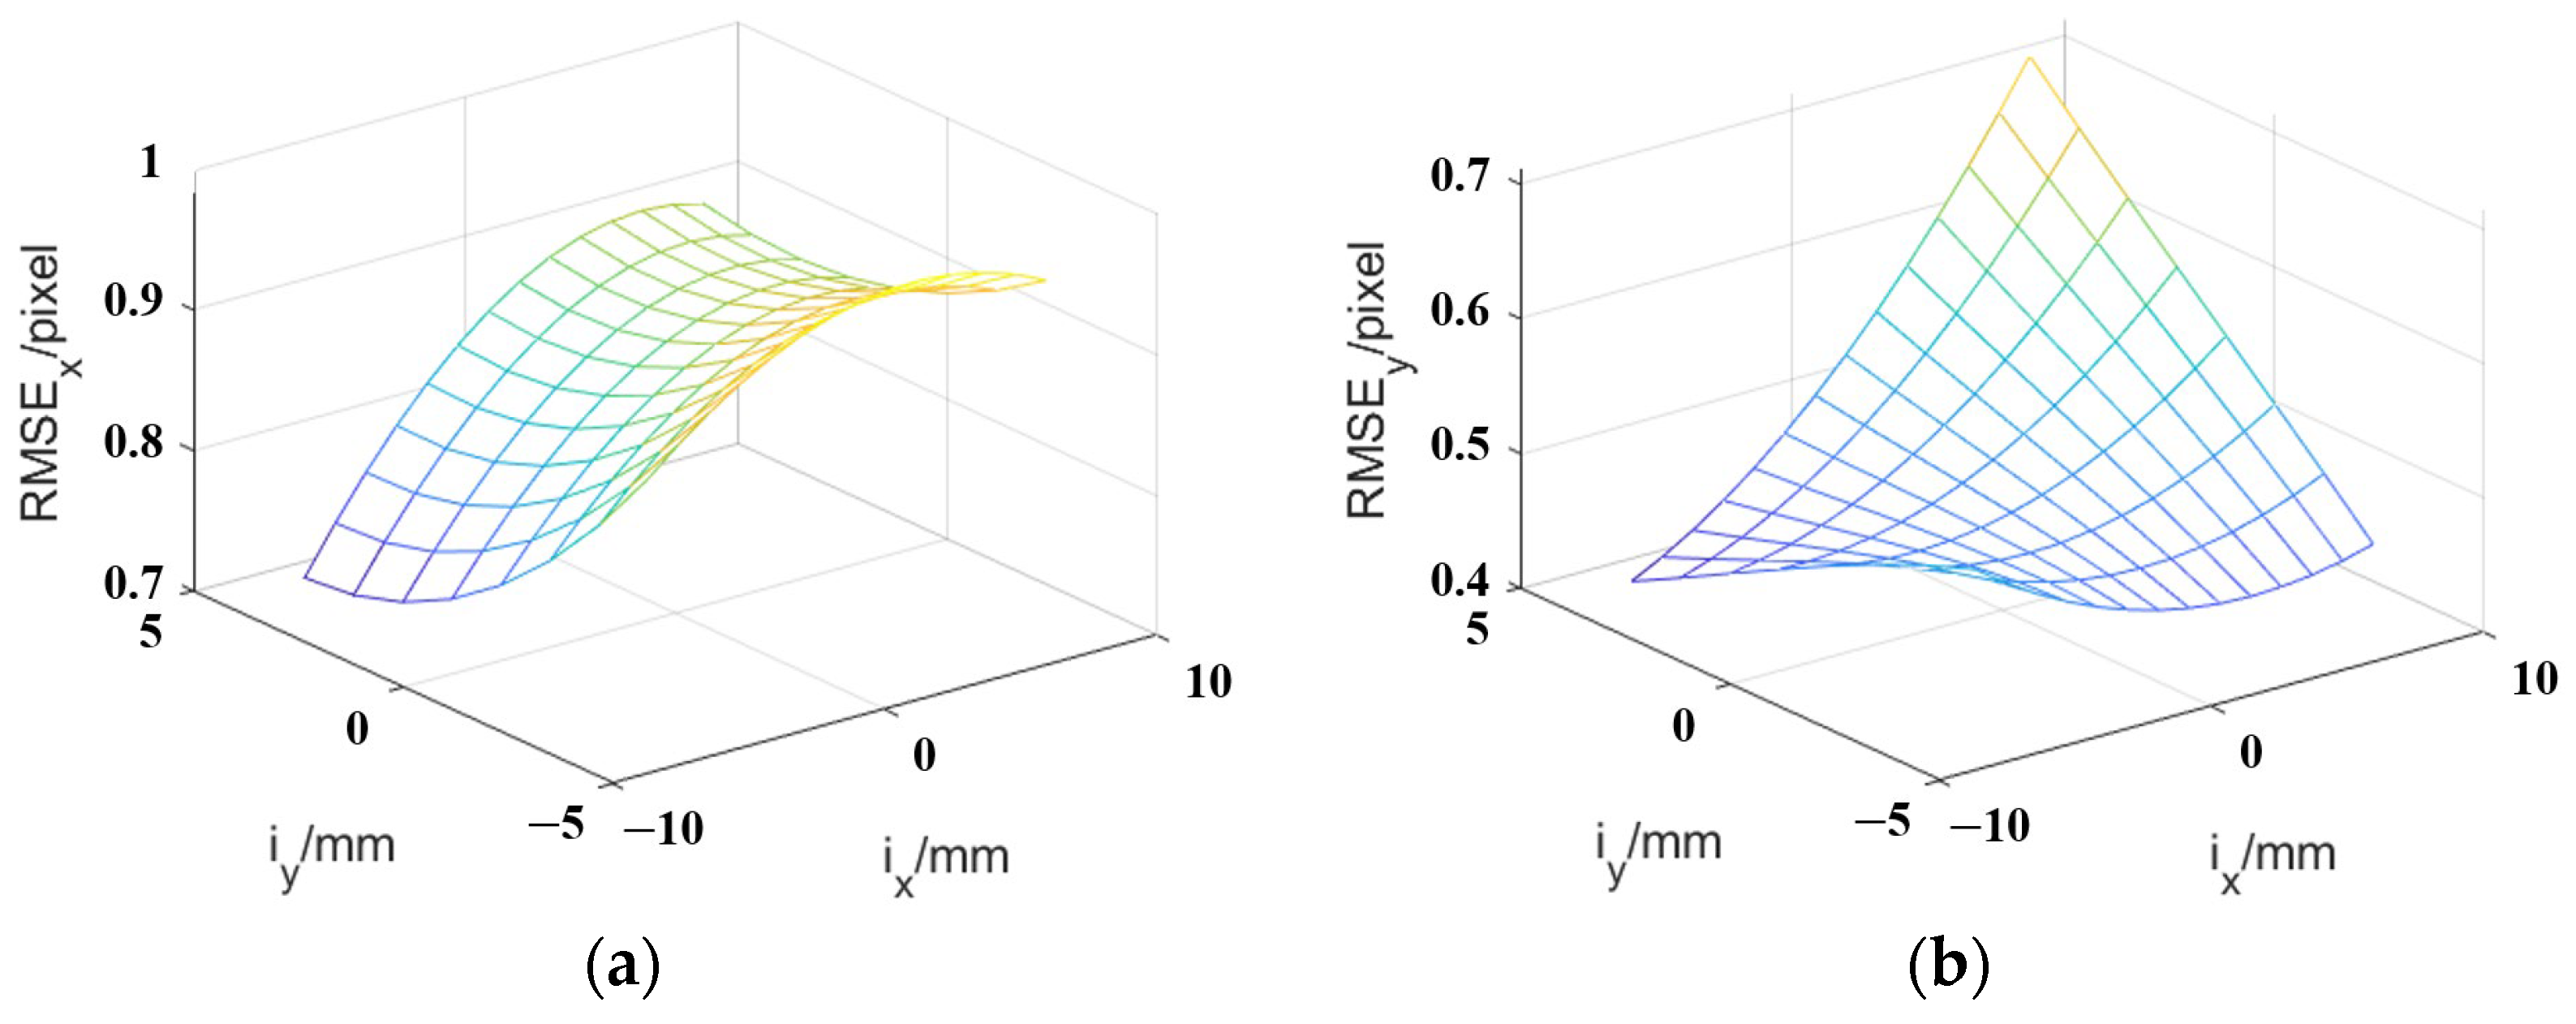
The aircraft’s state parameters are shown in Table 2. A Monte Carlo analysis of 10,000 iterations was conducted on the total error in the full field of view that was observed when using the exposure time difference compensation method, which was within the error ranges shown in Table 5. The analysis results show that the maximum RMSE in the x-direction is 0.9792 pixels and the maximum RMSE in the y-direction is 0.7130 pixels. The analysis results are shown in Figure 10. In practical applications, the targets for spectral analysis are determined by the target recognition algorithm, and they will have certain shapes and sizes on the image. Therefore, the error range shown in the Monte Carlo analysis results is acceptable and can meet the requirements of practical applications.
To further understand the main sources of error, simulations were conducted separately for the second and third sources of error. Combined with the simulation results in Section 5.1, the analysis results are shown in Table 6.
It can be observed that the target positioning errors caused by the aircraft’s state parameter errors contribute the most to the final error. In practical applications, the accuracy of the aircraft’s attitude and altitude measurements can be improved using RTK technology or multi-source fusion navigation and positioning techniques [42,43], which will reduce the errors in the exposure time difference compensation method.

6. Experiment

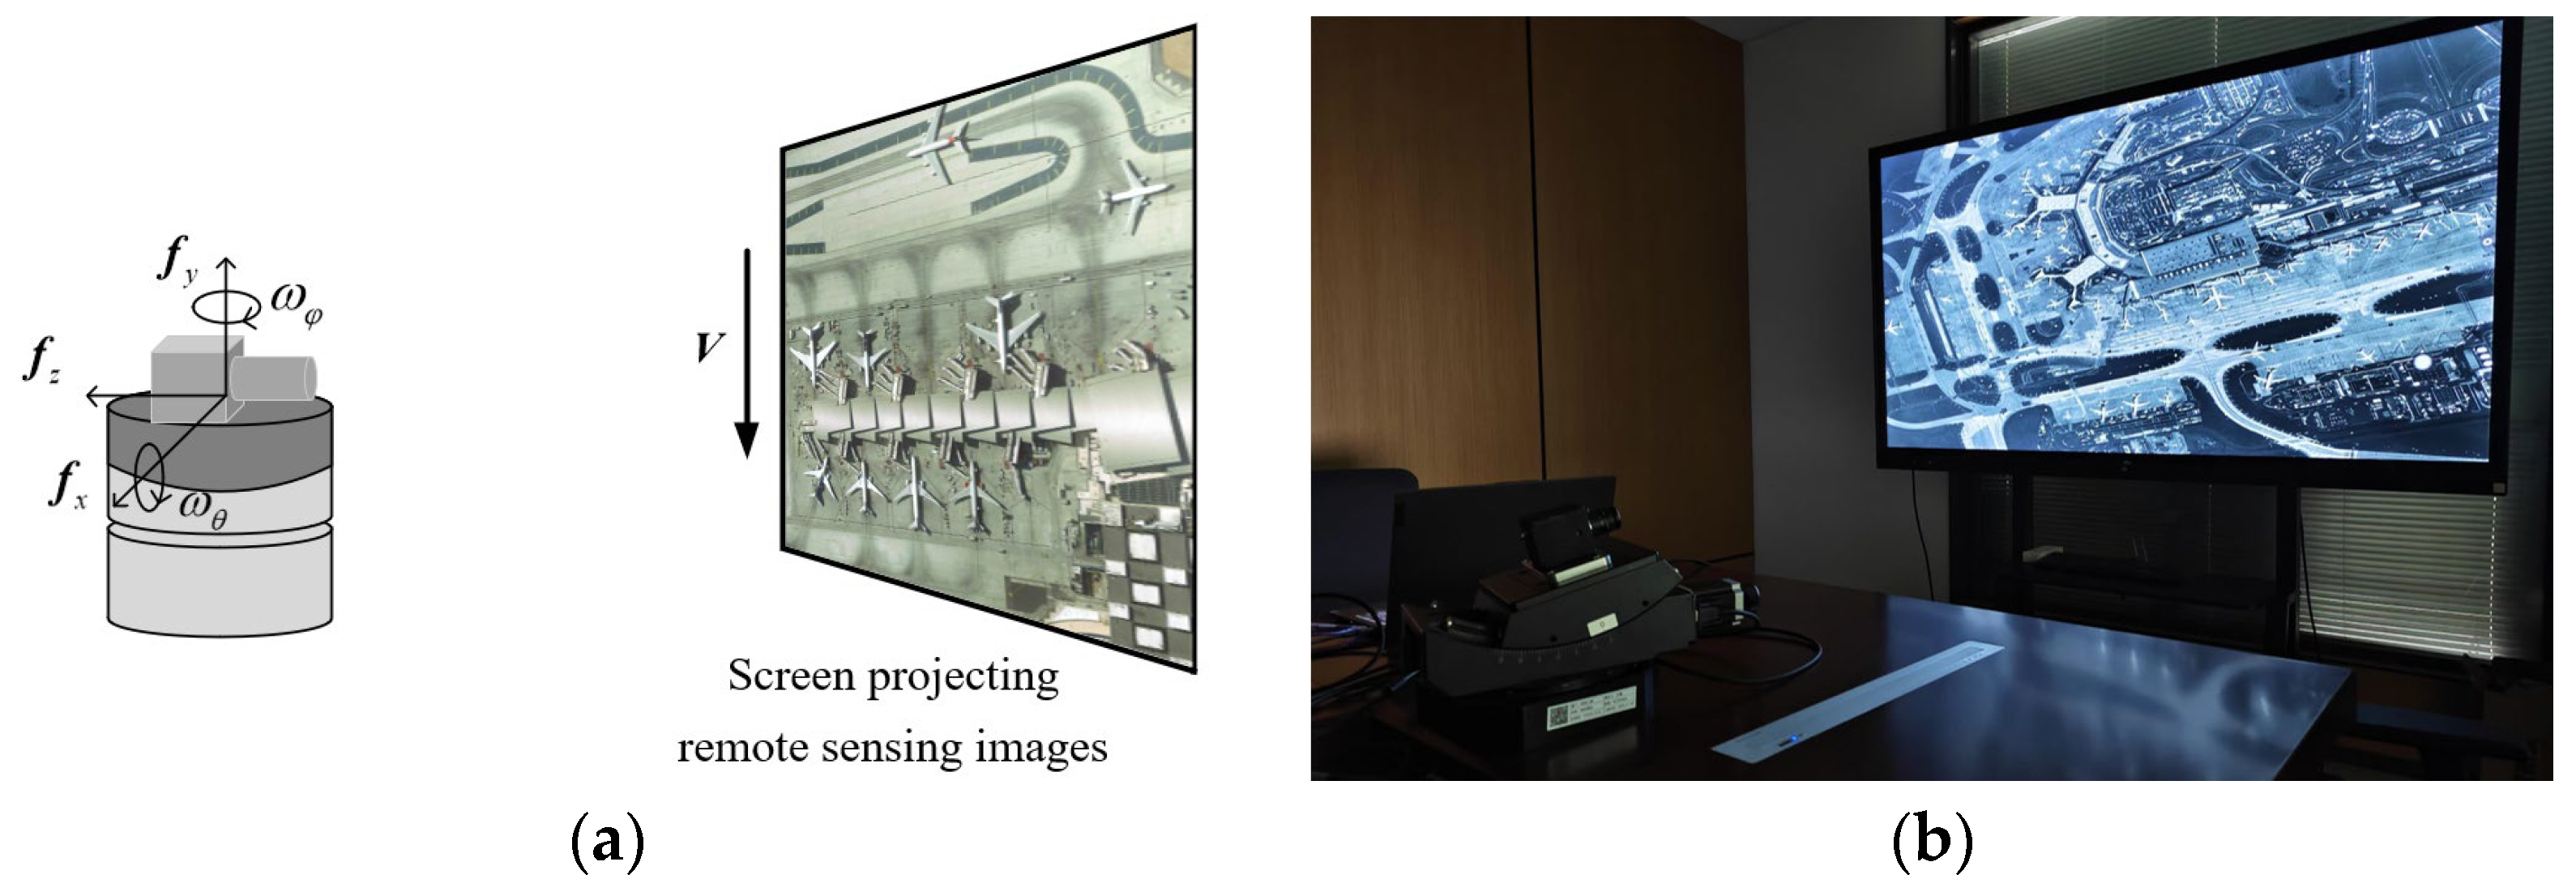
To further verify the reliability of the exposure time difference compensation method, a validation experiment was designed, as shown in Figure 11. The experimental system consisted of a large display screen, low-distortion lens, imaging detector, imaging controller, two-axis rotating platform, and platform controller. The movement of ground objects was simulated through a large screen projection video, while a two-dimensional turntable simulated the aircraft’s pitch and yaw. The DMD was replaced with the detector, and the image obtained by the detector was used to analyze the displacement vector of the target points. This was then compared and verified with the results obtained from the exposure time difference compensation method.
After the turntable starts rotating and stabilizes, the camera begins taking continuous photos. The image obtained by the camera at time t 0 is shown in Figure 12a (the remote sensing image used in the experiment is from the France Seine River Satellite Jilin-1, with a 0.5 m resolution image dataset: https://www.jl1mall.com/resrepo/?fromUrl=https://www.jl1mall.com/resrepo, accessed on 24 January 2025). The five white bright spots outlined in the image are fixed points with known coordinates on the screen. By analyzing the positional coordinates of these fixed points both on the display screen and the imaging detector, the camera’s attitude angles at time t 0 can be calculated. The various parameters measured and calculated in the experiment are listed in Table 7.
The velocity vector field distribution in this state for the full field of view at time t 0 is shown in Figure 12c. Ten target points are selected within the field of view (the red dots shown in Figure 12a,b), and their displacement vectors during the exposure time difference are calculated. Their motion trajectories are shown in Figure 12d. The image obtained by the camera at time t 1 is shown in Figure 12b. The coordinates of the target points are extracted and compared with the results obtained from the exposure time difference compensation method. The maximum RMSE across the entire field of view is 1.6962 pixels in the x-direction and 1.5677 pixels in the y-direction. The turret’s angular velocity accuracy is 0.05°/s, and its angular control accuracy is 0.02°. Using the Monte Carlo method to simulate the errors, the maximum RMSE in the x-direction is 1.8342 pixels and the maximum RMSE in the y-direction is 2.1231 pixels. The experimental results fall within this range, confirming the correctness of the exposure time difference compensation algorithm. After the assembly and alignment of the dual-path multi-target imaging spectrometer are completed, further experiments will be conducted to validate the algorithm designed in this study.

7. Conclusions

This paper designs an airborne DMD-based dual-path multi-target imaging spectrometer which achieves the instantaneous observation of a large field of view of 27.2° × 15.5° and can simultaneously perform spectral analysis of over a thousand targets within its field of view. To address the misalignment errors caused by the dual-path cross exposure, a compensation algorithm for the exposure time difference is proposed. First, a strict mapping relationship model for the relationship between the ground objects and the DMD is established under any orientation using a coordinate transformation method. The motion of ground objects in this model is analyzed, and a velocity vector field model is built on the DMD plane. Then, based on the velocity vector field model, the image positions are predicted and the displacement vector of any image point is obtained, which allows for the determination of the target point’s position after the exposure time difference has ended, based on the initial position of the target image point. Finally, the corresponding DMD micro-mirror is controlled to flip according to the image point position. For target points that fall outside the DMD’s field of view, posture compensation is applied using the pod’s attitude angle to bring them back within the field of view. The simulation results indicate that the maximum RMSE of the compensation method across the entire field of view is 0.9792 pixels in the x-direction and 0.7130 pixels in the y-direction, which meets the requirements for practical applications. Experimental results show that the maximum RMSE across the entire field of view is 1.6962 pixels in the x-direction and 1.5677 pixels in the y-direction, which falls within the range of positional errors caused by the experimental instrument’s inaccuracies. This validates the correctness of the exposure time difference compensation method.

Author Contributions

Conceptualization, Y.Z., J.Y. and C.L.; methodology, Y.Z. and J.Y.; writing—original draft preparation, Y.Z. and J.Y.; writing—review and editing, Y.Z., J.Y., C.L., C.W., G.Z. and Y.D.; funding acquisition, C.L. All authors have read and agreed to the published version of the manuscript.

Funding

This research was funded in part by the Major Projects of the Ministry of Science and Technology under Grant 2023YFB3906302, and in part by the National Natural Science Foundation of China under Grant 41974210 and Grand 62175236.

Data Availability Statement

The original contributions presented in the study are included in the article, further inquiries can be directed to the corresponding author.

Acknowledgments

The authors would like to thank the anonymous reviewers for their valuable comments.

Conflicts of Interest

The authors declare no conflicts of interest.

References

  1. Goetz, A.F.H. Three Decades of Hyperspectral Remote Sensing of the Earth: A Personal View. Remote Sens. Environ. 2009, 113, S5–S16. [Google Scholar] [CrossRef]
  2. Khan, M.J.; Khan, H.S.; Yousaf, A.; Khurshid, K.; Abbas, A. Modern Trends in Hyperspectral Image Analysis: A Review. IEEE Access 2018, 6, 14118–14129. [Google Scholar] [CrossRef]
  3. Wang, H.; Wang, J.; Ma, R.; Zhou, W. Soil Nutrients Inversion in Open-pit Coal Mine Reclamation Area of Loess Plateau, China: A Study Based on ZhuHai-1 Hyperspectral Remote Sensing. Land Degrad. Dev. 2024, 35, 5210–5223. [Google Scholar] [CrossRef]
  4. Jagpal, R.K.; Quine, B.M.; Chesser, H.; Abrarov, S.M.; Lee, R. Calibration and In-Orbit Performance of the Argus 1000 Spectrometer-the Canadian Pollution Monitor. J. Appl. Remote Sens 2010, 4, 049501. [Google Scholar] [CrossRef]
  5. Guo, X.; Liu, H.; Zhong, P.; Hu, Z.; Cao, Z.; Shen, M.; Tan, Z.; Liu, W.; Liu, C.; Li, D.; et al. Remote Retrieval of Dissolved Organic Carbon in Rivers Using a Hyperspectral Drone System. Int. J. Digit. Earth 2024, 17, 2358863. [Google Scholar] [CrossRef]
  6. Möckel, T.; Dalmayne, J.; Schmid, B.; Prentice, H.; Hall, K. Airborne Hyperspectral Data Predict Fine-Scale Plant Species Diversity in Grazed Dry Grasslands. Remote Sens. 2016, 8, 133. [Google Scholar] [CrossRef]
  7. Xiang, T.-Z.; Xia, G.-S.; Zhang, L. Mini-Unmanned Aerial Vehicle-Based Remote Sensing: Techniques, Applications, and Prospects. IEEE Geosci. Remote Sens. Mag. 2019, 7, 29–63. [Google Scholar] [CrossRef]
  8. Näsi, R.; Honkavaara, E.; Lyytikäinen-Saarenmaa, P.; Blomqvist, M.; Litkey, P.; Hakala, T.; Viljanen, N.; Kantola, T.; Tanhuanpää, T.; Holopainen, M. Using UAV-Based Photogrammetry and Hyperspectral Imaging for Mapping Bark Beetle Damage at Tree-Level. Remote Sens. 2015, 7, 15467–15493. [Google Scholar] [CrossRef]
  9. Uto, K.; Seki, H.; Saito, G.; Kosugi, Y. Characterization of Rice Paddies by a UAV-Mounted Miniature Hyperspectral Sensor System. IEEE J. Sel. Top. Appl. Earth Obs. Remote Sens. 2013, 6, 851–860. [Google Scholar] [CrossRef]
  10. Jia, J.; Chen, J.; Zheng, X.; Wang, Y.; Guo, S.; Sun, H.; Jiang, C.; Karjalainen, M.; Karila, K.; Duan, Z.; et al. Tradeoffs in the Spatial and Spectral Resolution of Airborne Hyperspectral Imaging Systems: A Crop Identification Case Study. IEEE Trans. Geosci. Remote Sens. 2022, 60, 5510918. [Google Scholar] [CrossRef]
  11. Yuan, L.; Xie, J.; He, Z.; Wang, Y.; Wang, J. Optical Design and Evaluation of Airborne Prism-Grating Imaging Spectrometer. Opt. Express 2019, 27, 17686. [Google Scholar] [CrossRef]
  12. Wang, B.; Ruan, N.; Guo, C.; Wang, Y.; Wang, Z.; Zhong, X. Optical System Design of Airborne Light and Compact High Resolution Imaging Spectrometer. Acta Opt. Sin. 2015, 35, 1022001. [Google Scholar] [CrossRef]
  13. Luo, G.-Y.; Wang, B.-D.; Chen, Y.-Q.; Zhao, Y.-L. Design of Visible Near Infrared Imaging Spectrometer on Unmanned Aerial Vehicle. Acta Photonica Sin. 2017, 46, 0930001. [Google Scholar] [CrossRef]
  14. Eikenberry, S.; Elston, R.; Raines, S.N.; Julian, J.; Hanna, K.; Hon, D.; Julian, R.; Bandyopadhyay, R.; Bennett, J.G.; Bessoff, A.; et al. FLAMINGOS-2: The Facility near-Infrared Wide-Field Imager & Multi-Object Spectrograph for Gemini. In Proceedings of the Conference on Ground-Based and Airborne Instrumentation for Astronomy, Orlando, FL, USA, 25 May 2006. [Google Scholar]
  15. Zhu, Y.; Hu, Z.; Wang, L.; Wang, J.; Hou, Y.; Tang, Z.; Dai, S.; Wu, Z.; Chen, Y. Construction and commissioning of LAMOST low resolution spectrographs. Sci. Sin. Phys. Mech. Astron. 2011, 41, 1337–1341. (In Chinese) [Google Scholar] [CrossRef]
  16. Sun, W.; Wang, J.; Yan, Q.; Geng, T.; Ma, Z.; Liu, Y.; Cui, X. Influence of Misalignment on Output of Astronomical Large-Core Fibers of Multi-Object Fiber Spectroscopic Telescopes. In Proceedings of the Conference on Advances in Optical and Mechanical Technologies for Telescopes and Instrumentation II, Edinburgh, UK, 26 June–1 July 2016. [Google Scholar]
  17. Shan, Y.; Zhu, Z.; Tan, H.; Ji, H.; Ma, D. Optical Design of a Multi-Object Fiber-Fed Spectrograph System for Southern Spectroscopic Survey Telescope. Opt. Commun. 2021, 499, 127188. [Google Scholar] [CrossRef]
  18. McLean, I.S.; Steidel, C.C.; Epps, H.; Matthews, K.; Adkins, S.; Konidaris, N.; Weber, B.; Aliado, T.; Brims, G.; Canfield, J.; et al. Design and Development of MOSFIRE: The Multi-Object Spectrometer for Infrared Exploration at the Keck Observatory. In Proceedings of the Conference on Ground-based and Airborne Instrumentation for Astronomy III, San Diego, CA, USA, 27 June–2 July 2010. [Google Scholar]
  19. Moon, D.-S.; Sivanandam, S.; Kutyrev, A.S.; Moseley, S.H.; Graham, J.R.; Roy, A. The Development of Ground-Based Infrared Multi-Object Spectrograph Based on the Microshutter Array. In Proceedings of the 5th Conference on Ground-Based and Airborne Instrumentation for Astronomy, Montréal, QC, Canada, 22 June 2014. [Google Scholar]
  20. Burns, D.E.; Oh, L.H.; Li, M.J.; Kelly, D.P.; Kutyrev, A.S.; Moseley, S.H. 2-D Electrostatic Actuation of Microshutter Arrays. J. Microelectromech. Syst. 2016, 25, 101–107. [Google Scholar] [CrossRef]
  21. Li, M.J.; Brown, A.-D.; Burns, D.E.; Kelly, D.P.; Kim, K.; Kutyrev, A.S.; Moseley, S.H.; Mikula, V.; Oh, L. James Webb Space Telescope Microshutter Arrays and Beyond. J. Micro/Nanolith. Mems Moems 2017, 16, 025501. [Google Scholar] [CrossRef]
  22. Travinskya, A.; Vorobiev, D.; Ninkov, Z.; Raisanen, A.; Quijada, M.A.; Smee, S.A.; Pellish, J.A.; Schwartz, T.; Robberto, M.; Heap, S.; et al. Evaluation of Digital Micromirror Devices for Use in Space-Based Multi-Object Spectrometer Application. J. Astron. Telesc. Instrum. Syst. 2017, 3, 035003. [Google Scholar] [CrossRef]
  23. Yang, J.; Liu, X.; Zhang, L.; Zhang, L.; Yan, T.; Fu, S.; Sun, T.; Zhan, H.; Xing, F.; You, Z. Real-Time Localization and Classification of the Fast-Moving Target Based on Complementary Single-Pixel Detection. Opt. Express 2025, 33, 11301–11316. [Google Scholar] [CrossRef]
  24. Spanò, P.; Zamkotsian, F.; Content, R.; Grange, R.; Robberto, M.; Valenziano, L.; Zerbi, F.M.; Sharples, R.M.; Bortoletto, F.; De Caprio, V.; et al. DMD Multi-Object Spectroscopy in Space: The EUCLID Study. In Proceedings of the UV/Optical/IR Space Telescopes: Innovative Technologies and Concepts IV, San Diego, CA, USA, 2 August 2009. [Google Scholar]
  25. Fourspring, K.D.; Ninkov, Z.; Kerekes, J.P. Scattered Light in a DMD Based Multi-Object Spectrometer. In Proceedings of the Conference on Modern Technologies in Space- and Ground-Based Telescopes and Instrumentation, San Diego, CA, USA, 27 June 2010. [Google Scholar]
  26. Robberto, M.; Donahue, M.; Ninkov, Z.; Smee, S.A.; Barkhouser, R.H.; Gennaro, M.; Tokovinin, A. SAMOS: A Versatile Multi-Object-Spectrograph for the GLAO System SAM at SOAR. In Proceedings of the Conference on Ground-Based and Airborne Instrumentation for Astronomy VI, Edinburgh, UK, 26–30 June 2016. [Google Scholar]
  27. Gibson, G.M.; Dienerowitz, M.; Kelleher, P.A.; Harvey, A.R.; Padgett, M.J. A Multi-Object Spectral Imaging Instrument. J. Opt. 2013, 15, 085302. [Google Scholar] [CrossRef]
  28. Zhao, Y.; Liu, C.; Fan, X.; Li, L.; Xia, J.; Ding, Y.; Liu, H. Optical System Design Based on DMD and Triple-Pass TIR Prism for Asteroid Exploration. Opt. Express 2023, 31, 43198. [Google Scholar] [CrossRef]
  29. Tan, Y.; Li, X.; Zhang, L. Application and Development Trend of Hyperspectral Remote Sensing in Crop Research. Chin. Agric. Sci. Bull. 2024, 40, 141–148. [Google Scholar]
  30. El-Alem, A.; Chokmani, K.; Laurion, I.; El-Adlouni, S.E. Comparative Analysis of Four Models to Estimate Chlorophyll-a Concentration in Case-2 Waters Using MODerate Resolution Imaging Spectroradiometer (MODIS) Imagery. Remote Sens. 2012, 4, 2373–2400. [Google Scholar] [CrossRef]
  31. Wang, Z. Research on High Precision LOS Stabilization and Image Motion Compensation Control Technology of Aeronautical Photoelectric Stabilization Platform. Ph.D. Dissertation, University of Chinese Academy of Sciences, Beijing, China, 2019. [Google Scholar]
  32. Xu, T.; Yang, X.; Wang, S.; Han, J.; Chang, L.; Yue, W. Imaging Velocity Fields Analysis of Space Camera for Dynamic Circular Scanning. IEEE Access 2020, 8, 191574–191585. [Google Scholar] [CrossRef]
  33. Zhang, G.; Xu, Y.; Liu, C.; Xie, P.; Ma, W.; Lu, Y.; Kong, X. Study of the Image Motion Compensation Method for a Vertical Orbit Dynamic Scanning TDICCD Space Camera. Opt. Express 2023, 31, 41740. [Google Scholar] [CrossRef]
  34. Du, J.; Yang, X.; Zhou, M.; Tu, Z.; Wang, S.; Tang, X.; Cao, L.; Zhao, X. Fast Multispectral Fusion and High-Precision Interdetector Image Stitching of Agile Satellites Based on Velocity Vector Field. IEEE Sens. J. 2022, 22, 22134–22147. [Google Scholar] [CrossRef]
  35. Cao, Z.; Kooistra, L.; Wang, W.; Guo, L.; Valente, J. Real-Time Object Detection Based on UAV Remote Sensing: A Systematic Literature Review. Drones 2023, 7, 620. [Google Scholar] [CrossRef]
  36. Zhang, Z.; Liu, Y.; Liu, T.; Lin, Z.; Wang, S. DAGN: A Real-Time UAV Remote Sensing Image Vehicle Detection Framework. IEEE Geosci. Remote Sens. Lett. 2020, 17, 1884–1888. [Google Scholar] [CrossRef]
  37. Li, Z.; Wang, L.; Yu, J.; Cheng, B.; Hao, L. Remote Sensing Ship Target Detection and Recognition Method. Remote Sens. Inf. 2020, 35, 64–72. [Google Scholar]
  38. Li, K.; Wan, G.; Cheng, G.; Meng, L.; Han, J. Object Detection in Optical Remote Sensing Images: A Survey and a New Benchmark. ISPRS J. Photogramm. Remote Sens. 2020, 159, 296–307. [Google Scholar] [CrossRef]
  39. Jin, G.; Yang, X.; Zhang, X.; Jiang, L.; Wang, M. Error Analysis and Integration of Aircraft-Based Electro-Optical Imaging Tracking Measurement Equipment. In Analysis of Error and Image Motion in Airborne Electro-Optical Imaging and Tracking Measurement System, 1st ed.; National Defense Industry Press: Beijing, China, 2018; pp. 26–30. [Google Scholar]
  40. Xiong, T. Design of High-Precision Multi-Mems Gyroscope and Research on Filter Algorithm. Master’s Thesis, University of Chinese Academy of Sciences, Beijing, China, 2021. [Google Scholar]
  41. Zeng, X.; Xian, S.; Wang, K.; Si, P.; Wu, Z. A Random Error Compensation Method for MEMS Gyroscope Based on Improved EMD and ARMA. Acta Armamentarii 2024, 45, 3287–3306. [Google Scholar]
  42. Hu, T. Precision Checking Method and Example of Long Distance GPS RTK Measurement. GNSS World China 2018, 43, 67–69. [Google Scholar]
  43. Li, X.; Huang, J.; Li, X.; Yuan, Y.; Zhang, K.; Zheng, H.; Zhang, W. GREAT: A Scientific Software Platform for Satellite Geodesy and Multi-Source Fusion Navigation. Adv. Space Res. 2024, 74, 1751–1769. [Google Scholar] [CrossRef]
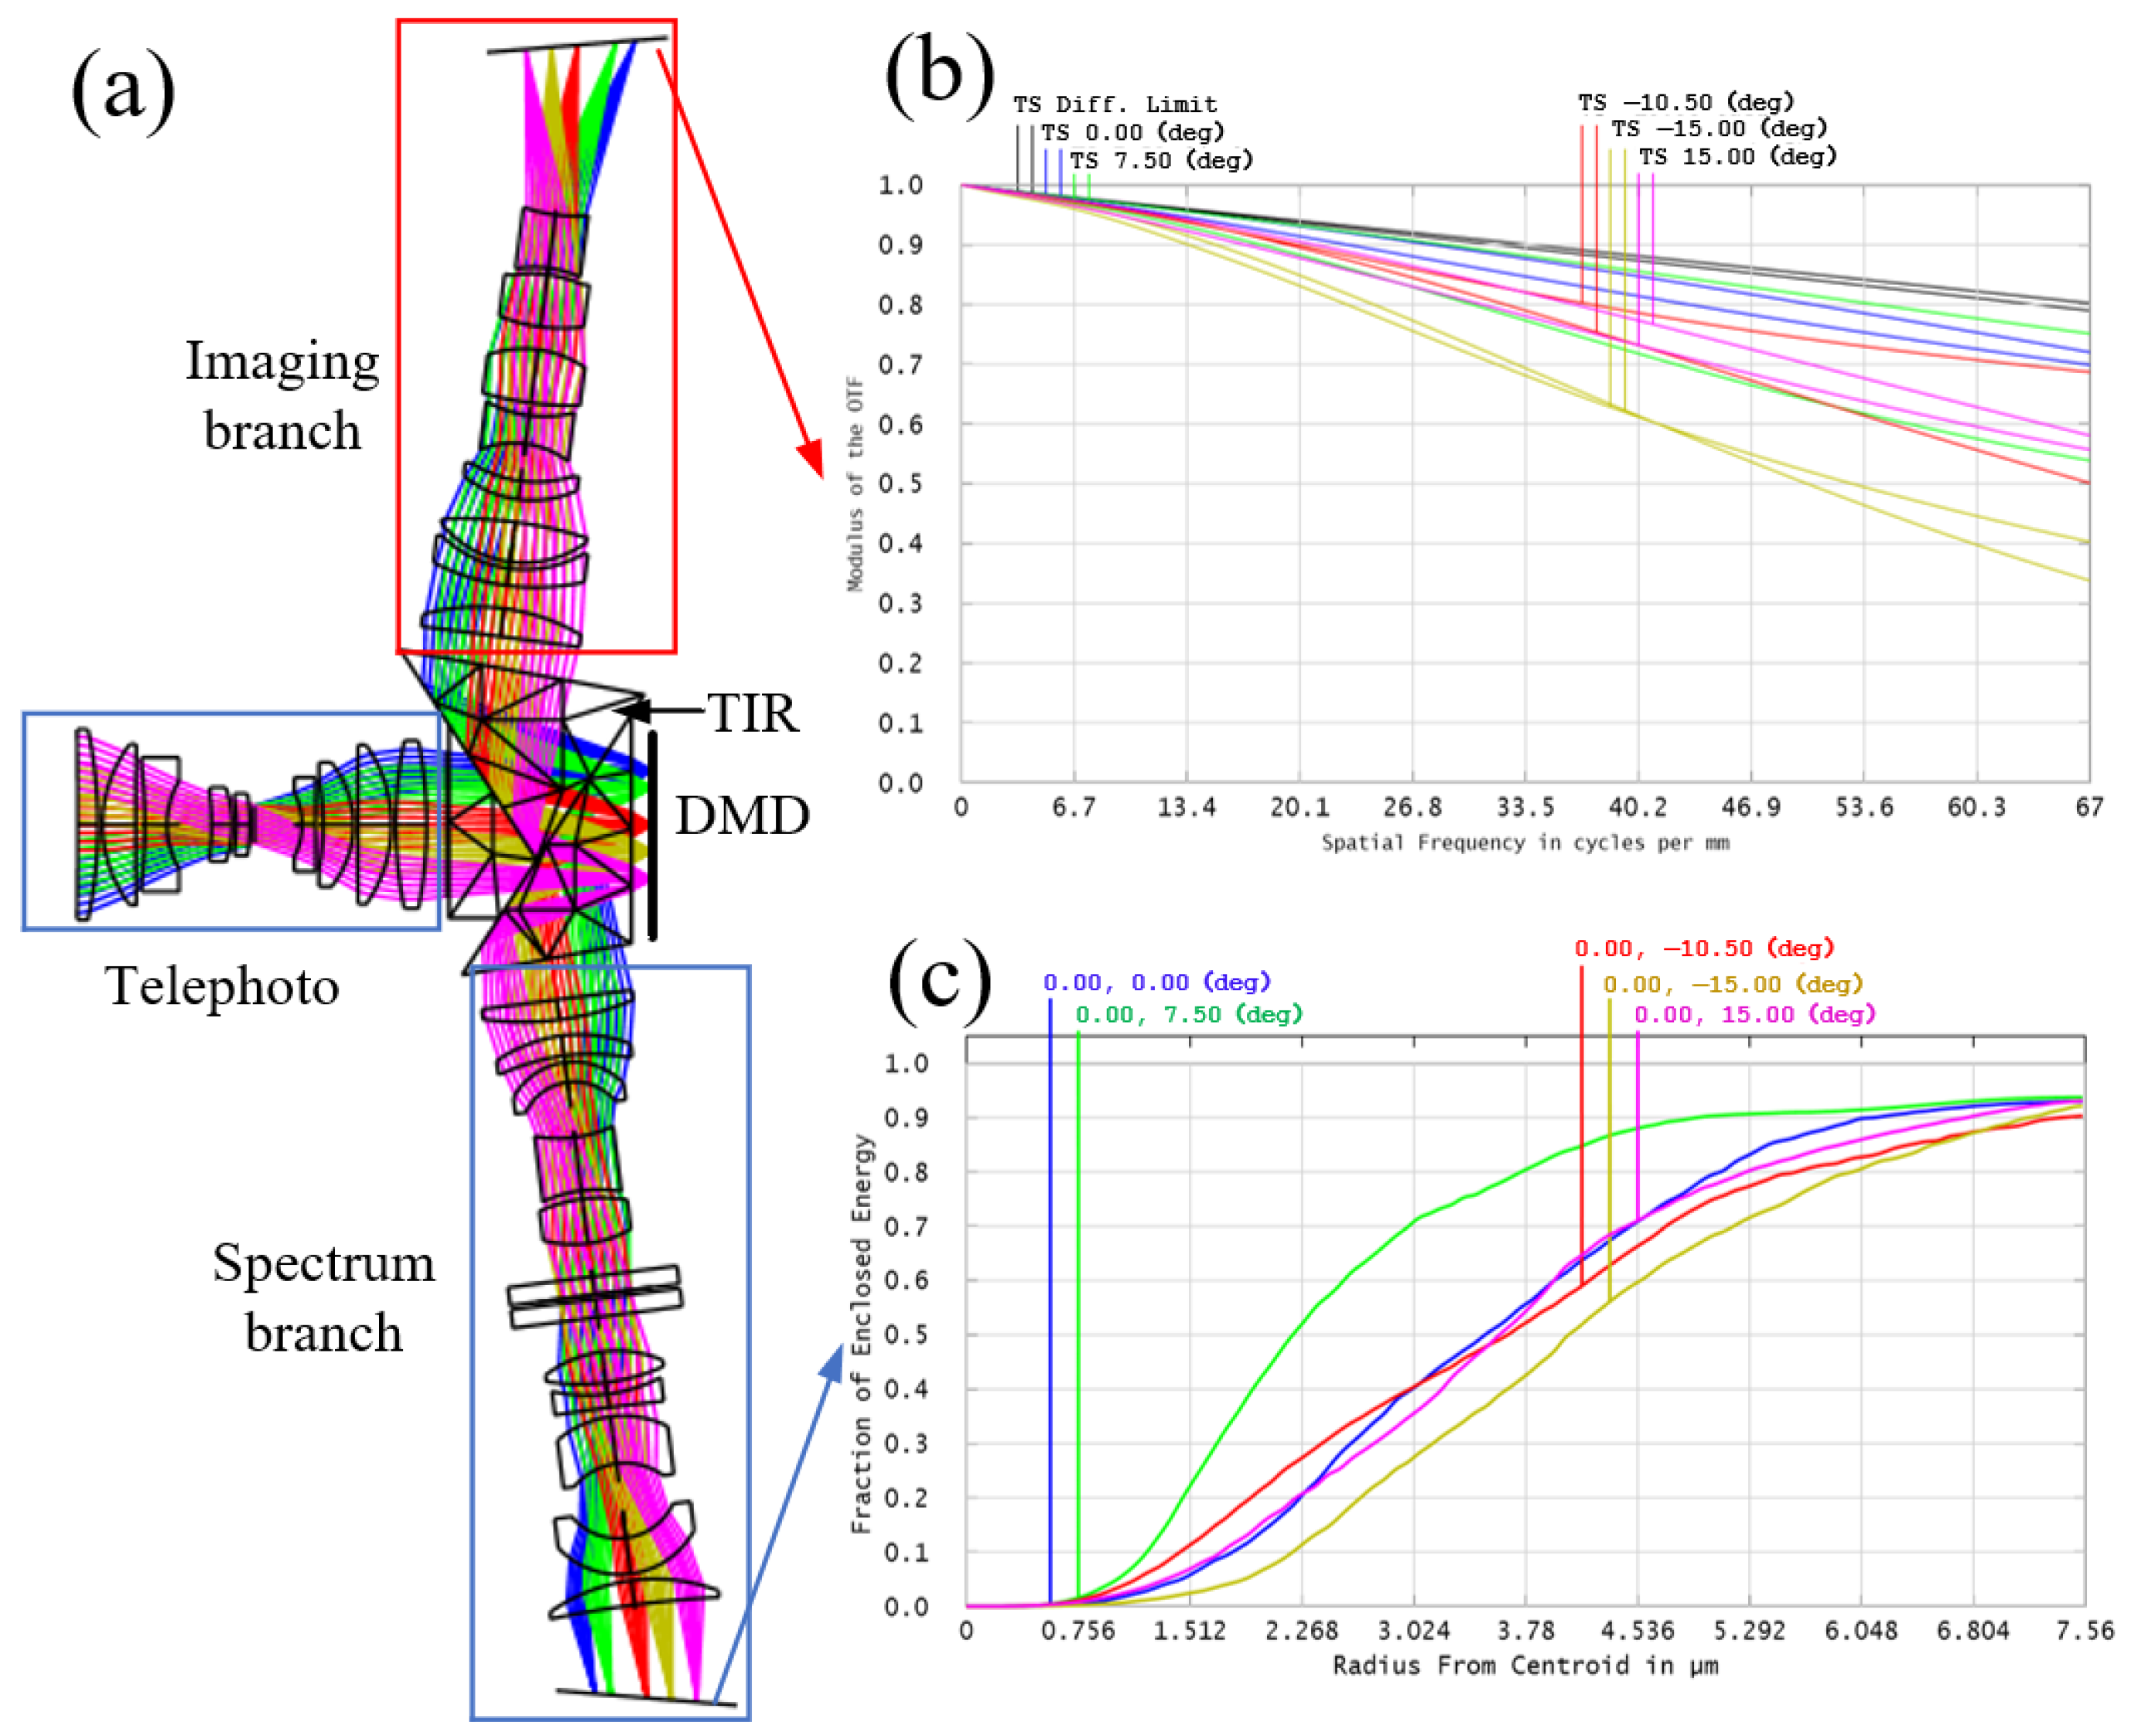
Figure 1. Design results and image quality evaluation of the DMD-based dual-path multi-target imaging spectrometer. (a) Optical path diagram. (b) MTF of the imaging branch. (c) Energy concentration of the spectral branch (example at 600 nm).
Remotesensing 17 02021 g001
Figure 2. Schematic diagram of the DMD-based dual-path multi-target imaging spectrometer.
Remotesensing 17 02021 g002
Figure 3. Positional relationship between the main coordinate systems.
Remotesensing 17 02021 g003
Figure 4. Decomposition of object speed and its conversion to image point speed: (a) component speeds of the object; (b) relationship between object speed and image point speed.
Remotesensing 17 02021 g004
Figure 5. Schematic of the exposure time difference compensation method.
Remotesensing 17 02021 g005
Figure 6. Imaging simulation of a complex scenario: (a) ground scene image; (b) image and target points at t = 0; (c) image and target point displacement at t = 1; (d) attitude compensation result.
Remotesensing 17 02021 g006
Figure 7. Compensation paths and results for different schemes: (a) compensation method in this paper; (b) best result of the Monte Carlo method with a compensation time of 0.03 s; (c) best result of the Monte Carlo method with a compensation time of 0.04 s.
Remotesensing 17 02021 g007
Figure 8. Schematic diagram when a single compensation cannot cover all target points.
Remotesensing 17 02021 g008
Figure 9. Attitude compensation results: (a) first compensation result; (b) second compensation result.
Remotesensing 17 02021 g009
Figure 10. Error analysis results of the exposure time difference compensation method: (a) RMSE in the x-direction; (b) RMSE in the y-direction.
Remotesensing 17 02021 g010
Figure 11. Schematic diagram of the experiment principle and photos of the experiment site. (a) Schematic diagram of the experiment. (b) On-site photograph of the experiment.
Remotesensing 17 02021 g011
Figure 12. Actual image and analysis. (a) Image at time t 0 . (b) Image at time t 1 . (c) Full field of view velocity vector at time t 0 . (d) Displacement vectors of the target points.
Remotesensing 17 02021 g012
Table 1. Main performance specifications of the airborne DMD-based dual-optical-path multi-target imaging spectrometer.
Optical System ParameterNumerical Value
Spectral range400–800 nm
F-number4
Telescope focal length30 mm
Field of view27.2° × 15.5°
Instantaneous field of view0.252 mrad
Spectral resolution2 nm
Table 2. Motion parameters of the airborne platform under complex motion conditions.
ParameterNumerical ValueParameterNumerical Value
Flight altitude5000 mFlight speed30 m/s
Airborne platform pitch angleAirborne platform pitch angular velocity2°/s
Airborne platform roll angleAirborne platform roll angular velocity2°/s
Airborne platform yaw angleAirborne platform yaw angular velocity2°/s
Pod yaw anglePod yaw angular velocity2°/s
Pod pitch angle10°Pod pitch angular velocity2°/s
Telescope focal length0.03 mDMD pixel size7.56 μm × 7.56 μm
Table 3. Monte Carlo simulation results.
Attitude Compensation TimeMonte Carlo Simulation IterationsNumber of Successes
0.02 s10,0000
0.03 s10,0002
0.04 s10,0006
Table 4. Distance of the edge pixel points of different schemes entering the field of view.
Compensation MethodDistance
In this paper66.7735 pixel
The optimal scheme corresponding to 0.03 s8.0373 pixel
The optimal scheme corresponding to 0.04 s31.9742 pixel
Table 5. Error ranges of aircraft information [39,40,41].
Aircraft InformationError Range
Flight altitudeBetter than 0.15 m
Flight speedBetter than 0.04 m/s
Attitude angleHorizontal Accuracy: Better than 0.02°
Direction Localization Accuracy: Better than 0.1°
Attitude angular velocityBetter than 0.01°/s
Table 6. Impact of different error sources.
Error SourcesRMSE in the x-Direction (Pixel)RMSE in the y-Direction (Pixel)
Displacement vector calculation errors0.18780.2355
Velocity vector calculation errors0.14160.1875
Target positioning errors0.87441.1821
Table 7. Experimental parameters.
ParameterNumerical ValueParameterNumerical Value
Initial pitch angle−11.9146°Flight altitude1.615 m
Initial roll angle−6.3269°Flight speed0.0258 m/s
Roll angular velocity2°/sTelescope focal length0.025 m
Pitch angular velocity0.2°/s
Disclaimer/Publisher’s Note: The statements, opinions and data contained in all publications are solely those of the individual author(s) and contributor(s) and not of MDPI and/or the editor(s). MDPI and/or the editor(s) disclaim responsibility for any injury to people or property resulting from any ideas, methods, instructions or products referred to in the content.