Abstract
UAV transmission tower inspection is the use of UAV technology for regular inspection and troubleshooting of towers on transmission lines, which helps to improve the safety and reliability of transmission lines and ensures the stability of the power supply. From the traditional manual tower boarding to the current way of manually selecting target camera shooting points from 3D point clouds to plan the inspection path of the UAV, operational efficiency has drastically improved. However, indoor planning work is still labor-consuming and expensive. In this paper, a deep learning-based point cloud transmission tower segmentation (PCTTS) model combined with the corresponding target point localization algorithm is proposed for automatic segmentation of transmission tower point cloud data and automatically localizing the key inspection component as the target point for UAV inspection. First, we utilize octree sampling with unit ball normalization to simplify the data and ensure translation invariance before putting the data into the model. In the feature extraction stage, we encode the point set information and combine Euclidean distance and cosine similarity features to ensure rotational invariance. On this basis, we adopt multi-scale feature extraction, construct a local coordinate system, and introduce the offset-attention mechanism to enhance model performance further. Then, after the feature propagation module, gradual up-sampling is used to obtain the features of each point to complete the point cloud segmentation. Finally, combining the segmentation results with the target point localization algorithm completes the automatic extraction of UAV inspection target points. The method has been applied to six kinds of transmission tower point cloud data of part segmentation results and three kinds of transmission tower point cloud data of instance segmentation results. The experimental results show that the model achieves mIOU of 94.1% on the self-built part segmentation dataset and 86.9% on the self-built instance segmentation dataset, and the segmentation accuracy outperforms that of the methods for point cloud segmentation, such as PointNet++, DGCNN, Point Transformer, and PointMLP. Meanwhile, the experimental results of UAV inspection target point localization also verify the method’s effectiveness in this paper.
1. Introduction
The transmission tower is one of the essential components of the power transmission system [1]. It is vital for carrying transmission lines, regulating line tension, and safeguarding power safety. The structure of various transmission towers varies based on their designs and intended purposes [2]. However, it typically comprises many vital components, including the tower body, cross arms, insulator strings, lightning lines, and additional auxiliary equipment [3,4,5]. The transmission tower is a complex system; the structures complement each other to undertake the function of power transportation jointly, and some parts are easily affected by internal and external environmental impact and aging damage, thus causing power accidents resulting in economic losses [6]. Therefore, it is necessary to regularly inspect transmission towers to protect the normal operation of the power transmission system [7].
Manual inspection requires workers to use telescopes for visual inspection, or they have to climb up for inspections, and there are problems such as high labor intensity, low work efficiency, and high impact of human factors, and the inspection status cannot be recorded in real time [8]. Therefore, inspection robots have gradually emerged to replace manual inspection efficiently. Ground inspection robots are generally suitable for performing inspection tasks in simple power scenarios such as small substations; flying robots (e.g., UAVs) and hybrid robots are more suitable for performing inspection tasks in complex power scenarios such as large-area substations and transmission corridors [9,10].
With the increasing maturity of UAV technology, there is a growing trend among electric power companies and maintenance firms to adopt novel technologies, including UAVs, to enhance the efficiency and precision of inspections [11,12,13]. UAV electricity inspection is generally divided into transmission corridor inspection and transmission tower component inspection. This paper focuses on the methods applied to the latter. Current commonly used transmission tower UAV inspection technology heavily depends on the process of prepared in-door UAV route planning, in which the precise 3D coordinates of the key tower components of the tower need to be identified and collected from transmission tower point cloud data point by point in advance and then manually input to produce the UAV waypoints and camera shooting events [13,14]. After the flight path has been planned, the electricity inspection multi-rotor UAV uses the planned routes to complete autonomous flights and take the component photos at the planned waypoint [15], i.e., normally 3–5 m away from the target on the tower. The route planning work is usually a key, cumbersome, and labor-intensive process. It also increases the UAV safety risk due to manual ignorance and fault. Therefore, the automatic identification and locating of the inspection target point coordinates have been a means of improving the efficiency of route planning.
To automatically extract the UAV inspection target points, the corresponding locations need to be found first, and then the segmentation is accomplished by using a deep learning point cloud segmentation algorithm with specific dataset training. In the field of deep learning, there are various public datasets adapted to different needs, among which the ShapeNet dataset [16] is widely used for testing part segmentation [17,18,19]. For research on using point cloud data for segmentation tasks, there are three main types of segmentation: projected image-based segmentation, voxel-based segmentation, and direct point-based segmentation [20,21]. Both projected image-based segmentation and voxel-based segmentation essentially involve converting the point cloud data into other forms first. The core idea of the former is to use 2D-CNN [22] to extract features from the projected image in 3D and then fuse these features for label prediction. In the latter, the point cloud is first converted into voxels, similar to pixels in a 2D image, and then processed using a 3D convolutional network. SqueezeSeg is a 3D point cloud real-time segmentation network proposed by Wu et al. [23] after getting inspiration from SqueezeNet [24], where the 3D point cloud is subjected to spherical projection for feature extraction and segmentation, and then conditional random field (CRF) [25] is used as a recurrent layer to refine the results. Similar to the 2D semantic segmentation network, Liu et al. introduced a network called 3DCNN-DQN-RNN [26], which fuses 3D-CNN and DQN to control the eye window to achieve fast localization and segmentation and then further refine the parsing accuracy of the point cloud by 3D-CNN and Residual RNN. Since the point cloud data presents irregular distribution in three-dimensional space, the applicability of traditional two-dimensional and three-dimensional convolutional neural networks is limited, and the segmentation methods directly based on the points, at present, mainly contain three categories based on multilayer perceptron [27], point convolution, and graph convolution. PointNet [28] pioneered the direct processing of point clouds and subsequently improved and upgraded the process; the original authors released PointNet++ [29], which uses a shared MLP to extract features, completes the segmentation of the point cloud after capturing and learning global and local features, and also provides the basic framework for many subsequent methods. The Point Transformer model [30,31,32,33] is proposed based on the transformer [34] architecture, which has been used in a large number of natural language processing and image processing tasks and has made essential breakthroughs; the attention mechanism is applied to the processing of a three-dimensional point cloud, and each point in the point cloud is regarded as an element in the sequence, which is coded to capture inter-point relationships and neighborhood information, and finally decoded to obtain the results, with this mechanism also achieving excellent results. The DGCNN model [35] combines the ideas of the graph convolutional neural network (DCN) and dynamic graph construction, and the EdgeConv module is designed to incorporate the relationship between points into the point cloud processing and recalculate the domain of the sampled points in each layer of the feature space and update the graph model, which can better allow the information to propagate among the similar structures and accelerate the learning of local semantic information.
Despite the commendable performance of current deep learning models on public datasets, they encounter certain challenges when applied in the practical application of power inspection. For example, the data quality of the training samples is uneven, and the number is small [36]; the number of points in different point cloud data varies considerably, and the coordinates of the point cloud data with factual geographic information are very different from each other, and the direction is variable, and so on. Hu et al. [37] combined PointNet++ [29] with a self-attention mechanism [38] and then utilized positional coding to somewhat alleviate the challenges posed by sparse point clouds and the issue of the disproportionately small proportion of insulator string point clouds. Huang et al. [39] improved the PointNet++ [29] model by adjusting the model feeling field and extracting point cloud features using core point convolution [40], which improved segmentation accuracy slightly compared to the classical PointNet++ model [29].
Considering the advantages and shortcomings of the existing methods, in order to better solve the above problems, this paper proposes a new point cloud transmission tower segmentation (PCTTS) model for accomplishing the automatic segmentation task of transmission towers. The method employs specific preprocessing for the original point cloud data to make the point cloud distribution more reasonable and uniform, while the unit ball normalization ensures the translation invariance. Utilizing rotationally invariant features to fuse multi-scale feature extraction with the offset-attention mechanism can solve the problem of variable orientation of transmission towers while improving the feature extraction capability of the model, which ensures rotational invariance. Finally, the segmented results are used to extract the location coordinates of the UAV inspection target points using a specific target point localization algorithm to help improve the efficiency of UAV route planning. The method has the advantages of low cost, high efficiency, and strong generalizability. It can greatly reduce the manual, repetitive, and cumbersome operation steps, effectively shorten the operation time of route planning in UAV electric power inspection, enhance the operational efficiency of the staff, and have high practical application value.
2. Data Preparation
2.1. Data Acquisition Area
The original transmission corridor point cloud data from several high-voltage transmission lines are located in multiple provinces in China, including dozens of lines such as the Yangu Line. The location of the measurement area is shown in Figure 1. The transmission voltage level ranges from 220 kV to 1000 kV. There are various types of transmission towers; six of the most widely used tower types are adopted to carry out this study, and each subsequent tower type that is different is indicated by a different capital letter.
Figure 1.
Schematic location of the survey area.
2.2. Datasets Preparation
Since transmission route planning mainly focuses on the transmission tower components, which are almost always located in the upper part of the transmission towers, only the point cloud data of the upper part of each transmission tower, the so-called “upper half-tower”, is used, which is also beneficial for the improvement of segmentation accuracy.
After obtaining the “upper half-tower” point cloud data of individual transmission towers, it is necessary to carry out the denoising process according to the actual situation of the data and then calculate the normal vector information. A search radius of 0.75 m is used to calculate the normal vector for each “half-tower” point cloud data so that each point feature changes from (x, y, x) to (x, y, z, nx, ny, nz).
Two types of datasets containing a total of 316 “half-tower” point cloud data are produced; one of the “upper half-tower” point cloud data is used to do part segmentation, which is divided into four categories, i.e., the tower body, transmission lines, lightning lines, and insulator strings, respectively. A total of six types of towers are categorized, denoted as A–F, as shown in Figure 2, where blue is the tower body, green is the transmission lines, yellow is the lightning lines, and red is the insulator strings. If subsequent target point localization experiments use the results of part segmentation, separating different individuals within the same class is necessary first. In order to streamline the process to achieve a more efficient one-step approach, the other “upper half-tower” point cloud data are used to do instance segmentation, which splits the tower head and insulator strings one by one and categorizes the remaining parts into other classes. Since the shape of transmission towers is mostly a left–right symmetrical structure, this kind of segmentation is more delicate. Referring to the results of part segmentation, the data quality would have a greater impact on the final segmentation accuracy, so we chose three tower types, A–C, with higher data quality, in which the color of each part is different, as shown in Figure 3.
Figure 2.
Example diagram of the part segmentation dataset, with the tower body represented in blue, transmission lines in green, lightning lines in yellow, and insulator strings in red. (a) Tower A. (b) Tower B. (c) Tower C. (d) Tower D. (e) Tower E. (f) Tower F.
Figure 3.
Example diagram of the instance segmentation dataset, where the color of each part is different. (a) Tower A. (b) Tower B. (c) Tower C.
3. Methodology
In the UAV automatic refinement inspection process of transmission tower, one important task is to find the locations of the camera shooting target point and then plan the UAV flight route based on this information. At present, route planning relies heavily on human visual interaction to find the tower target point in the transmission tower point cloud data. The target points are mainly distributed on the tower head, insulator string, and each structural connection. Generally, there is one target point at each end of the tower head, and each insulator string corresponds to 2–3 target points depending on the length.
In this paper, an automatic target point localization method is proposed, which is carried out in three steps: the first step is data preprocessing; in the second step, segmentation of each structure of the transmission tower is completed based on the PCTTS; and in the third step, the target point localization of the UAV’s automatic inspection is carried out. The technical flow of the method is shown in Figure 4.
Figure 4.
Flowchart of transmission tower UAV inspection target point localization technology.
The first step is to carry out some basic processing of the transmission channel point cloud data, such as removing redundant information and standardizing the format to facilitate subsequent operations according to the specific needs of the actual completion of the denoising, cropping, calculation of normal vectors, and other operations. Subsequently, the preprocessed data are input into the PCTTS network to acquire segmented results. We have carried out experiments with two different segmentation methods, which are divided into part segmentation and instance segmentation, and there will be different effects in different situations. At this point, we have obtained individual point cloud data for each structure, and in the case of obvious errors, post-processing corrections or even manual intervention are required. Finally, the center point fitting is carried out on the point cloud data of each component individually, the center point coordinates are obtained, and then the corresponding processing is carried out to obtain the final UAV inspection target point coordinates, and the result inspection is completed by superimposing the obtained target point with the corresponding transmission tower point cloud data.
3.1. General Architecture of the PCTTS Network
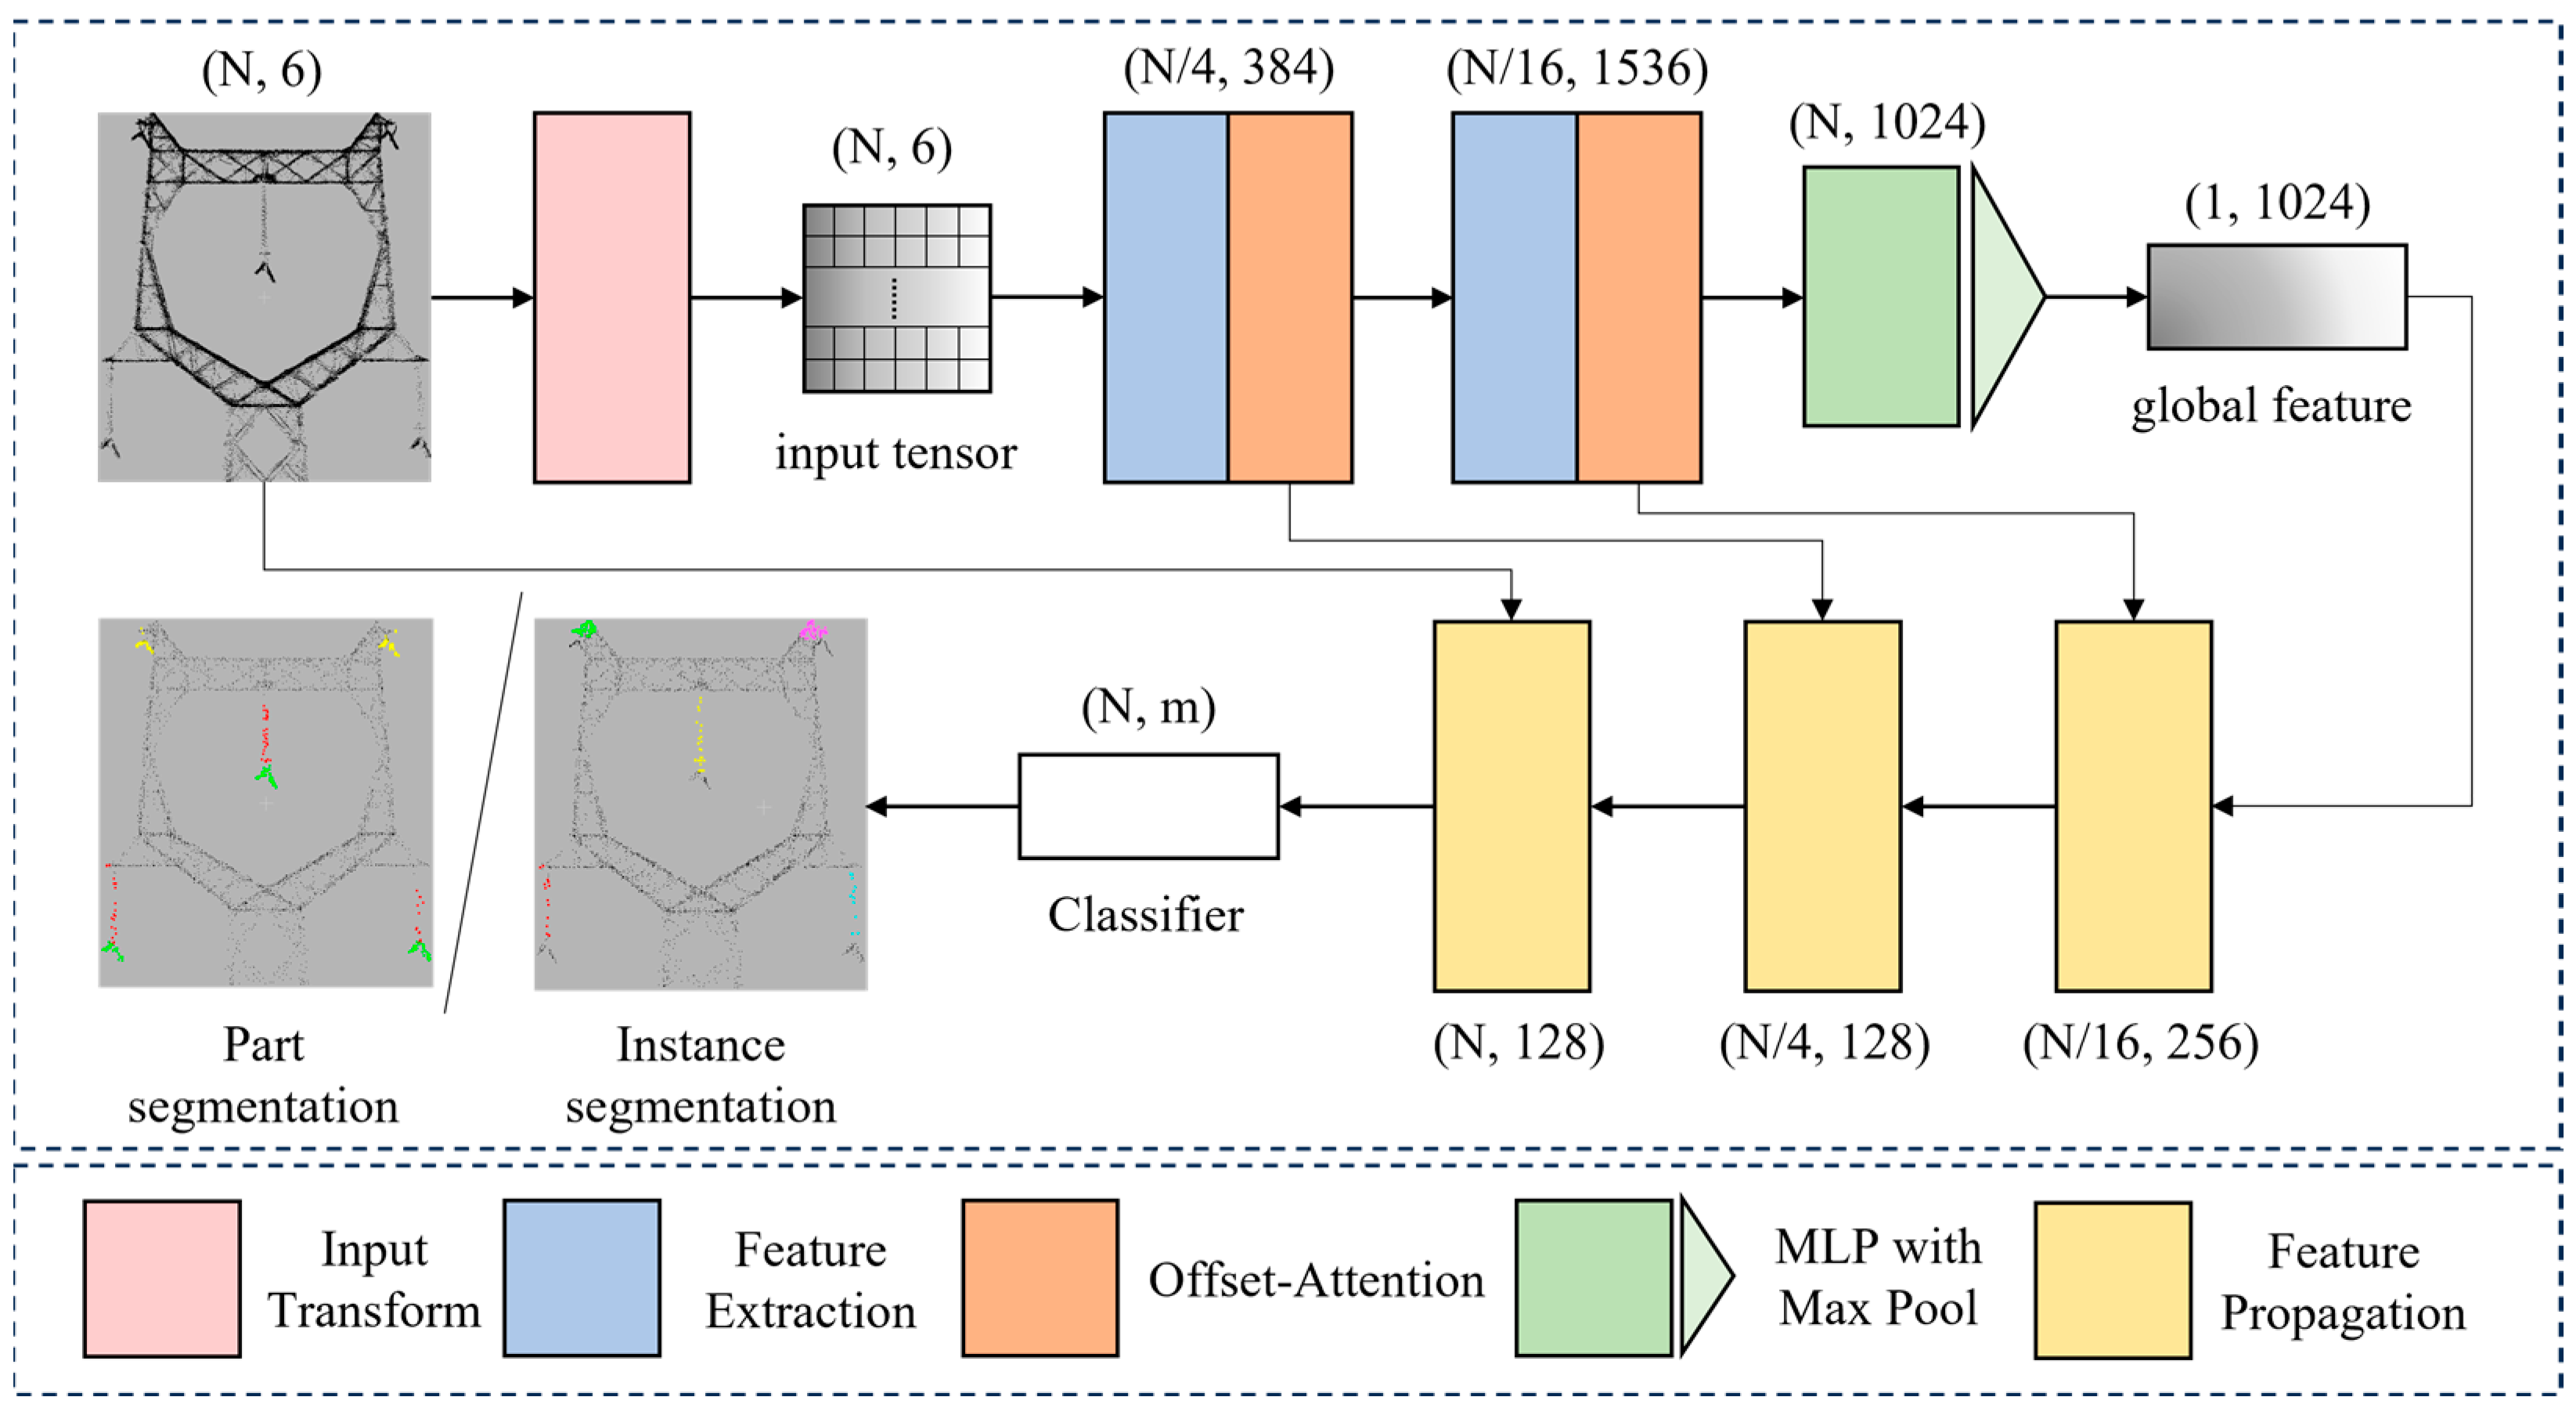
As shown in Figure 5, the overall architecture of our proposed PCTTS network is redesigned based on the structure of PointNet [28] and PointNet++ [29], which mainly consists of four parts, namely, the data preprocessing module, the feature extraction module, the attention mechanism module, and the feature propagation module, which are complementary to each other and ultimately realize the effective segmentation of the point cloud data of transmission towers.
Figure 5.
General architecture of PCTTS network.
The data preprocessing module mainly undertakes some functional transformation operations before inputting the point cloud data into the neural network, such as down-sampling, rotational transformation, normalization, etc. Among them, the operation of down-sampling can not only simplify the data according to the specific practical needs, which can be hundreds of thousands or even millions of points thinned down to a few tens of thousands or even a few thousands of points, but also plays an auxiliary role in the process of extracting the local features in the follow-up. The operation of rotational transformation not only serves as a data enhancement during training but also serves as a function to check the generalizability of the model during testing. The operation of normalization can solve the problem of the point cloud data of different transmission towers having too much difference in individual coordinates due to the difference in the actual location or the problem of large differences in the coordinates of each structure due to the use of different scenarios and different actual sizes of the same type of transmission towers. The feature extraction module is one of the most important parts of the whole network, which can abstract the collection of transmission tower point cloud data input into the network and extract the global features and local features to be used for learning, which can help the network understand and analyze the point cloud data better. The attention mechanism module can improve the performance of the model by selecting and utilizing information more efficiently, focusing on relatively more important information with higher weights, ignoring less important information with lower weights, and constantly adjusting the weight allocation so that more helpful information can be selected in different situations. The feature propagation module mainly plays the role of feature fusion and feature transfer, which is essentially an up-sampling operation, combining the global information of the higher level with the local information of the lower level and then transferring the feature information upward across the hierarchy to the higher level, updating the obtained features upward step by step to the feature vectors of each point and completing the categorization of the category of each point.
In summary, the workflow of our proposed PCTTS network can be summarized as data preprocessing → feature extraction → feature propagation → point cloud segmentation, in which how to better adapt to the transmission tower point cloud data and learn more helpful feature information from it to make the segmentation results more accurate becomes the key highlight of this research method.
3.2. Data Preprocessing Module
In addition to some of the most basic operations such as cropping, denoising, and other preprocessing steps, we also need to carry out the operation of down-sampling to reduce the data size and minimize the storage and computation needs.
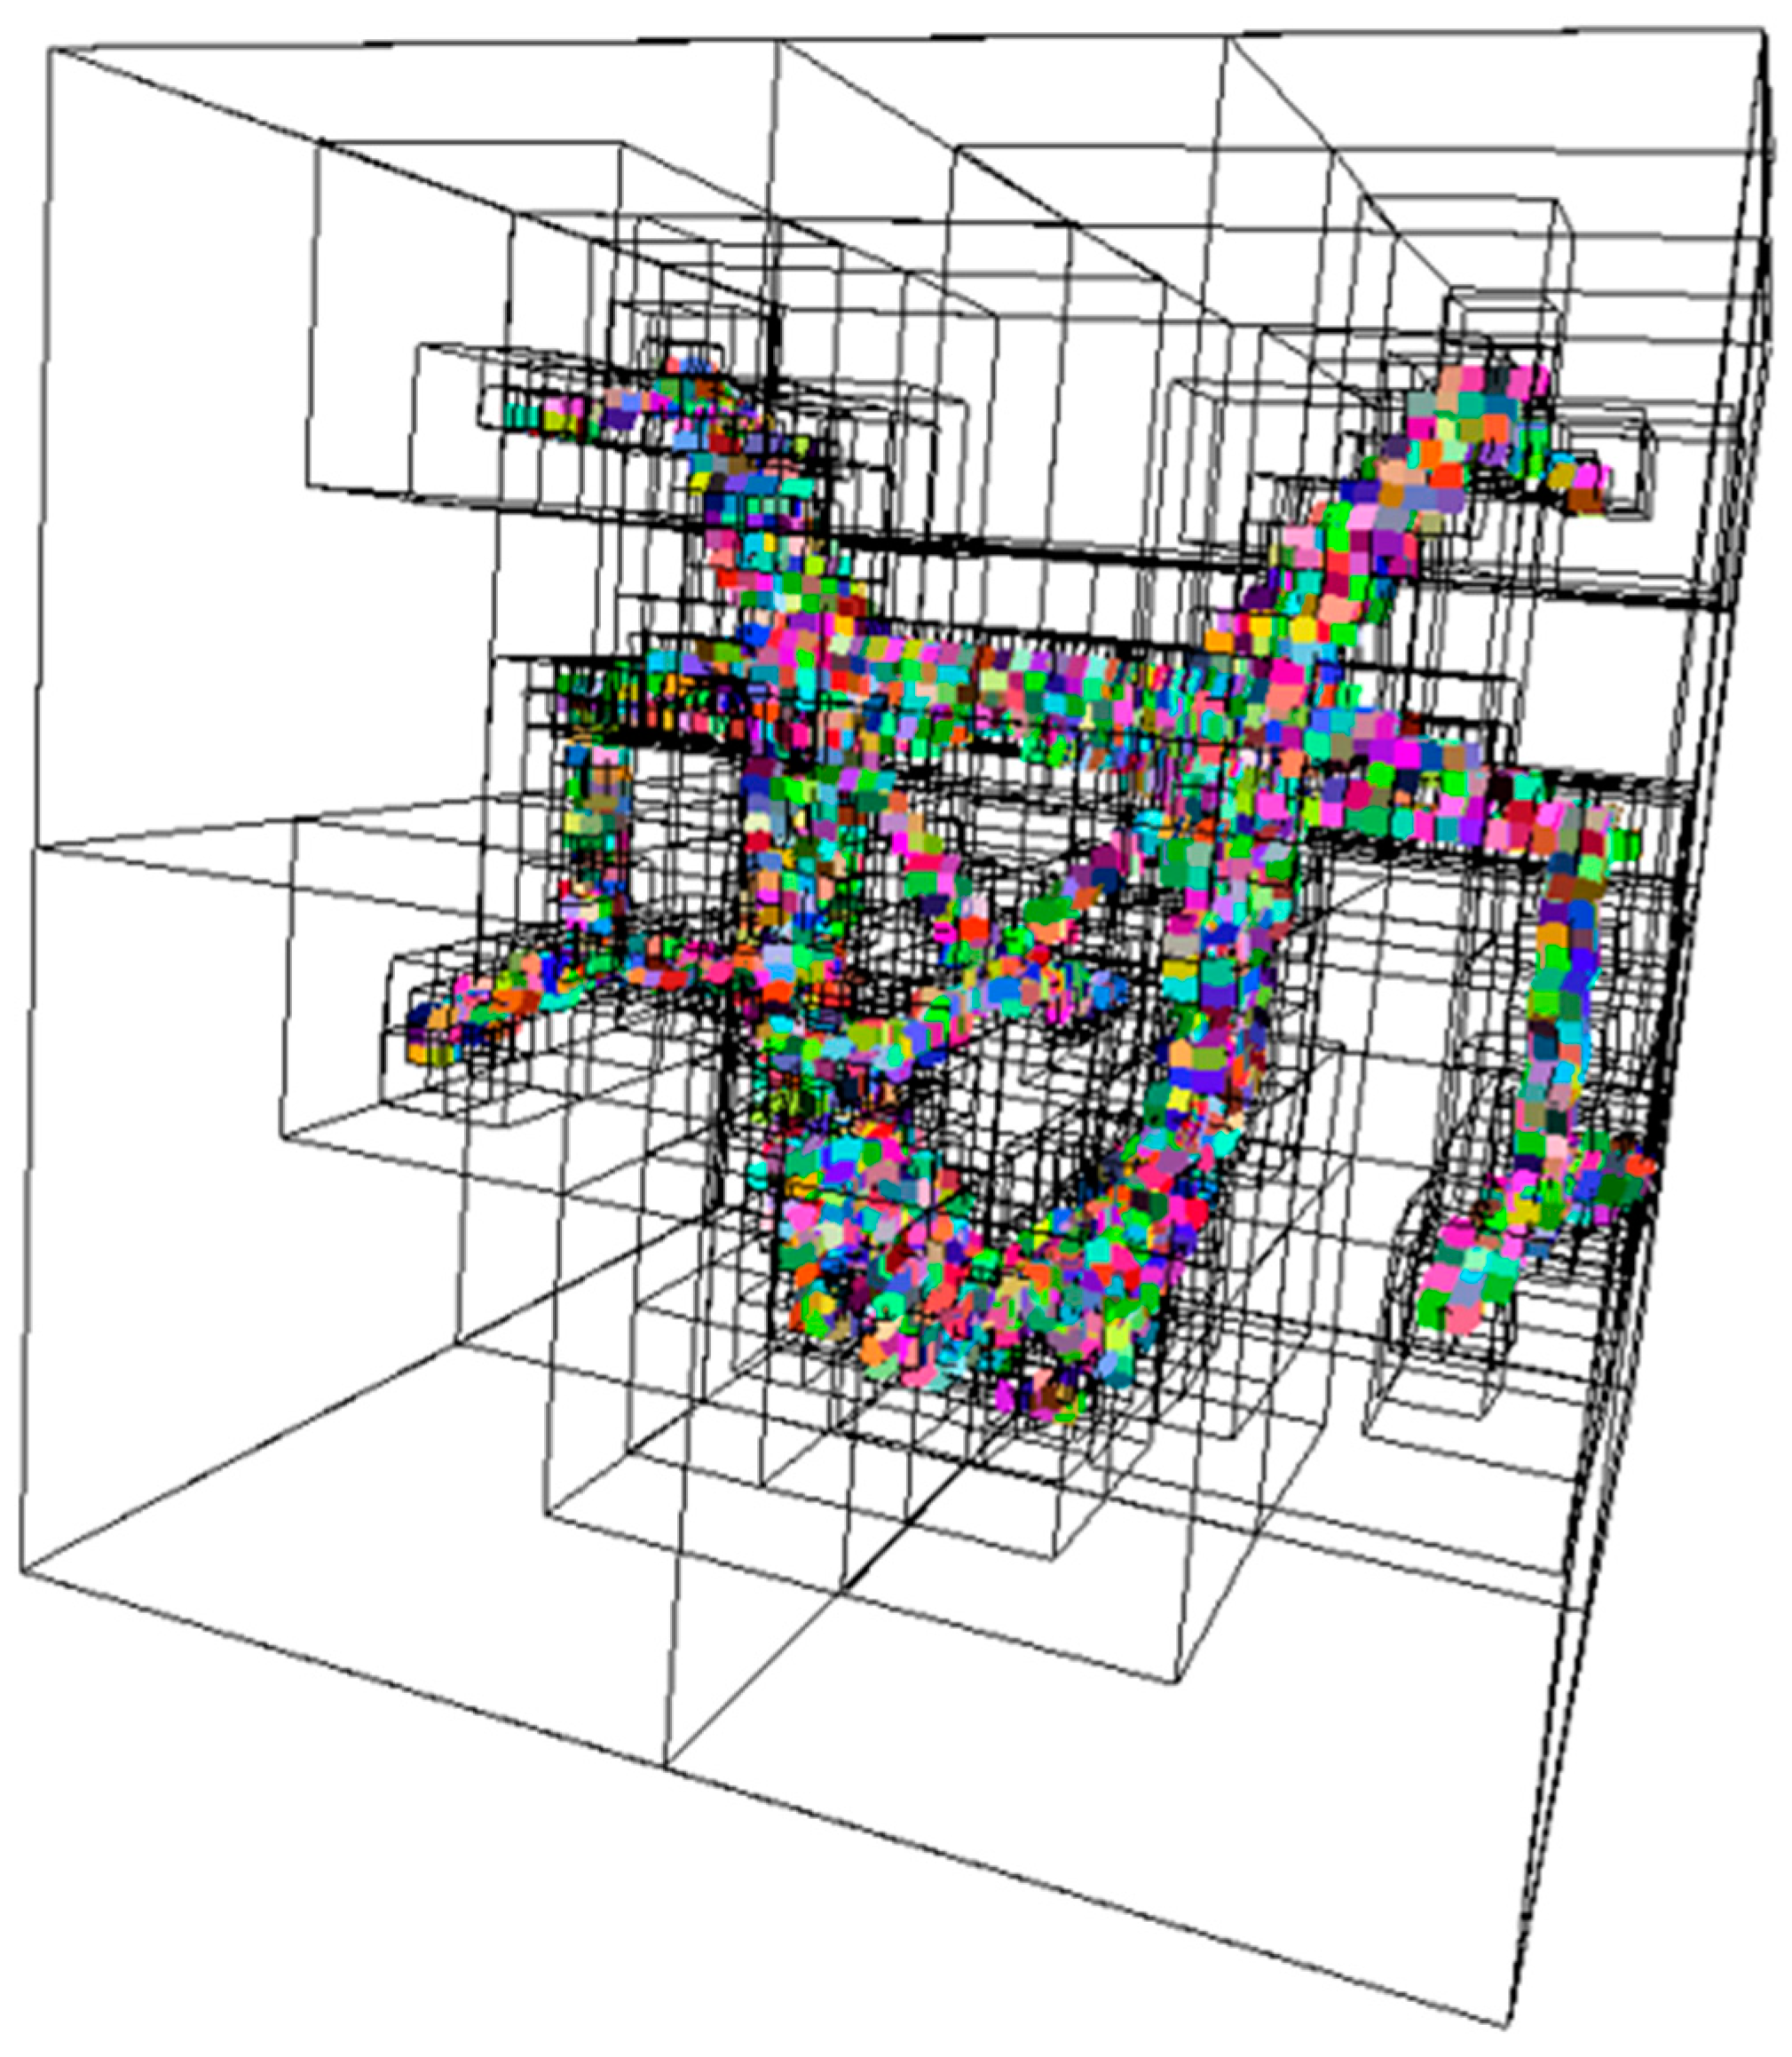
Due to the specification difference between the different LiDAR equipment used to collect the point cloud and the different methods of collection, the point cloud density and the data size of a tower may vary drastically. For example, some towers may have millions of points, while other towers may have only a few tens of thousands of points, which will significantly influence the neural network training effect and performance. Therefore, we chose to use the octree [41] sampling method to first thin the data of various transmission towers to a certain extent. After this processing step, almost all the transmission tower point cloud data are restricted to 10,000 pts or so. The effect of octree sampling is schematically shown in Figure 6, which divides the 3D space into a hierarchical structure consisting of octree nodes and divides the space by recursively dividing a region into eight sub-regions each time until the division stops after reaching the set conditions. The octree sampling method is used to down-sample the point cloud data of transmission towers, which can retain the shape characteristics of the transmission towers well compared to random sampling; it will also make the sampled point cloud data uniformly distributed to a certain extent like isometric sampling and also avoids the influence of different point densities at different locations due to different materials of each part in the data acquisition stage; it maintains a high sampling while maintaining high sampling quality, and the computational complexity is much lower than that of the farthest point sampling.
Figure 6.
Schematic diagram of octree sampling effect.
After down-sampling, two random rotational transformations are applied to the transmission tower point cloud data, i.e., a random rotation around the Z-axis and a random SO(3) rotation in three-dimensional space, computed with the rotation matrix as follows:
where denotes the rotation matrix, denotes the angle of rotation around the X-axis, denotes the angle of rotation around the Y-axis, and denotes the angle of rotation around the Z-axis.
The former is used to simulate the situation in which different transmission towers in a realistic scenario have different orientations to be more realistic for data enhancement, as well as to improve the generalizability of the model; the latter is only used for model generalizability testing and is not used in practical application.
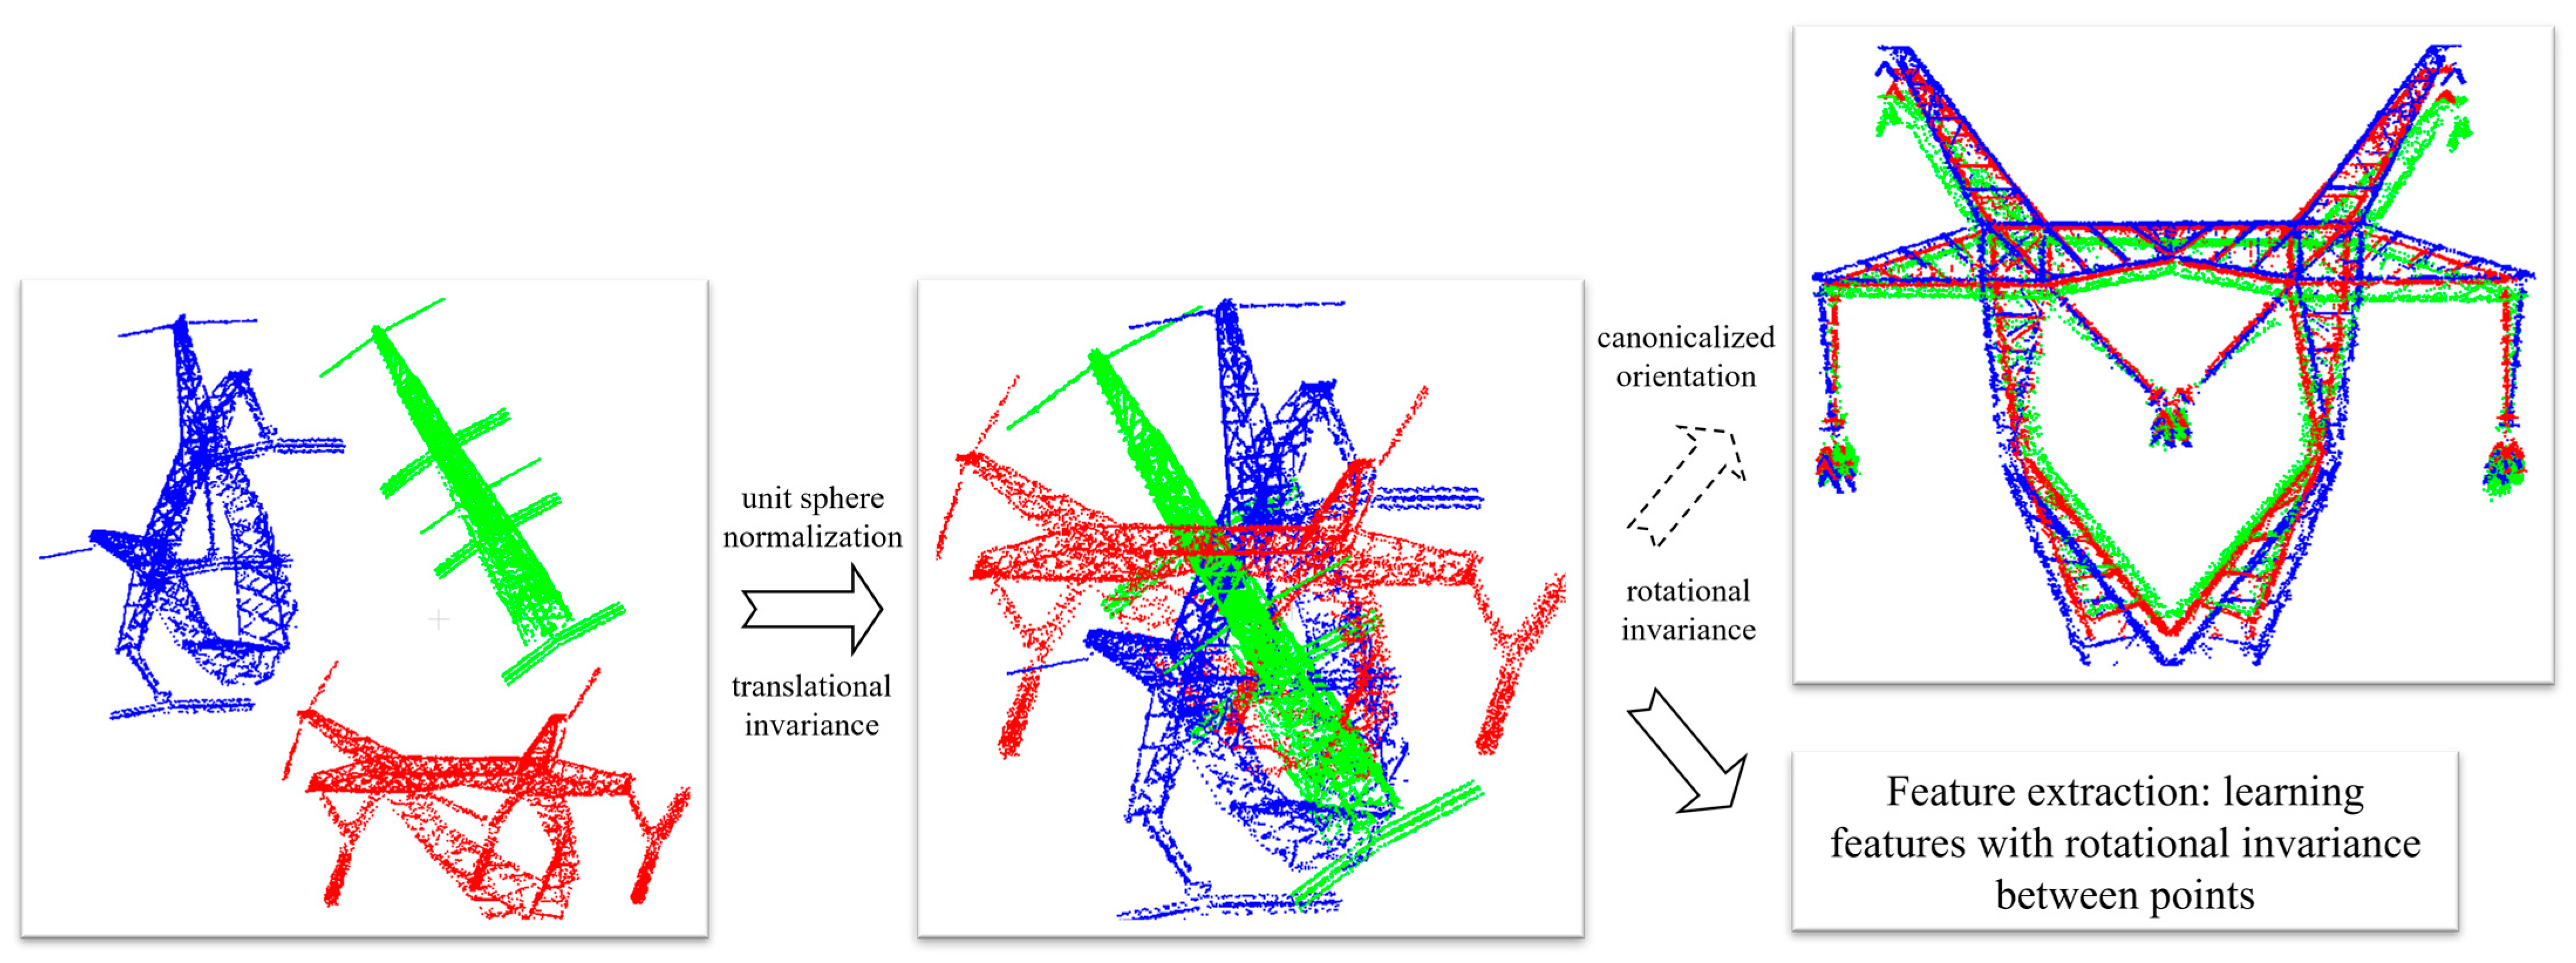
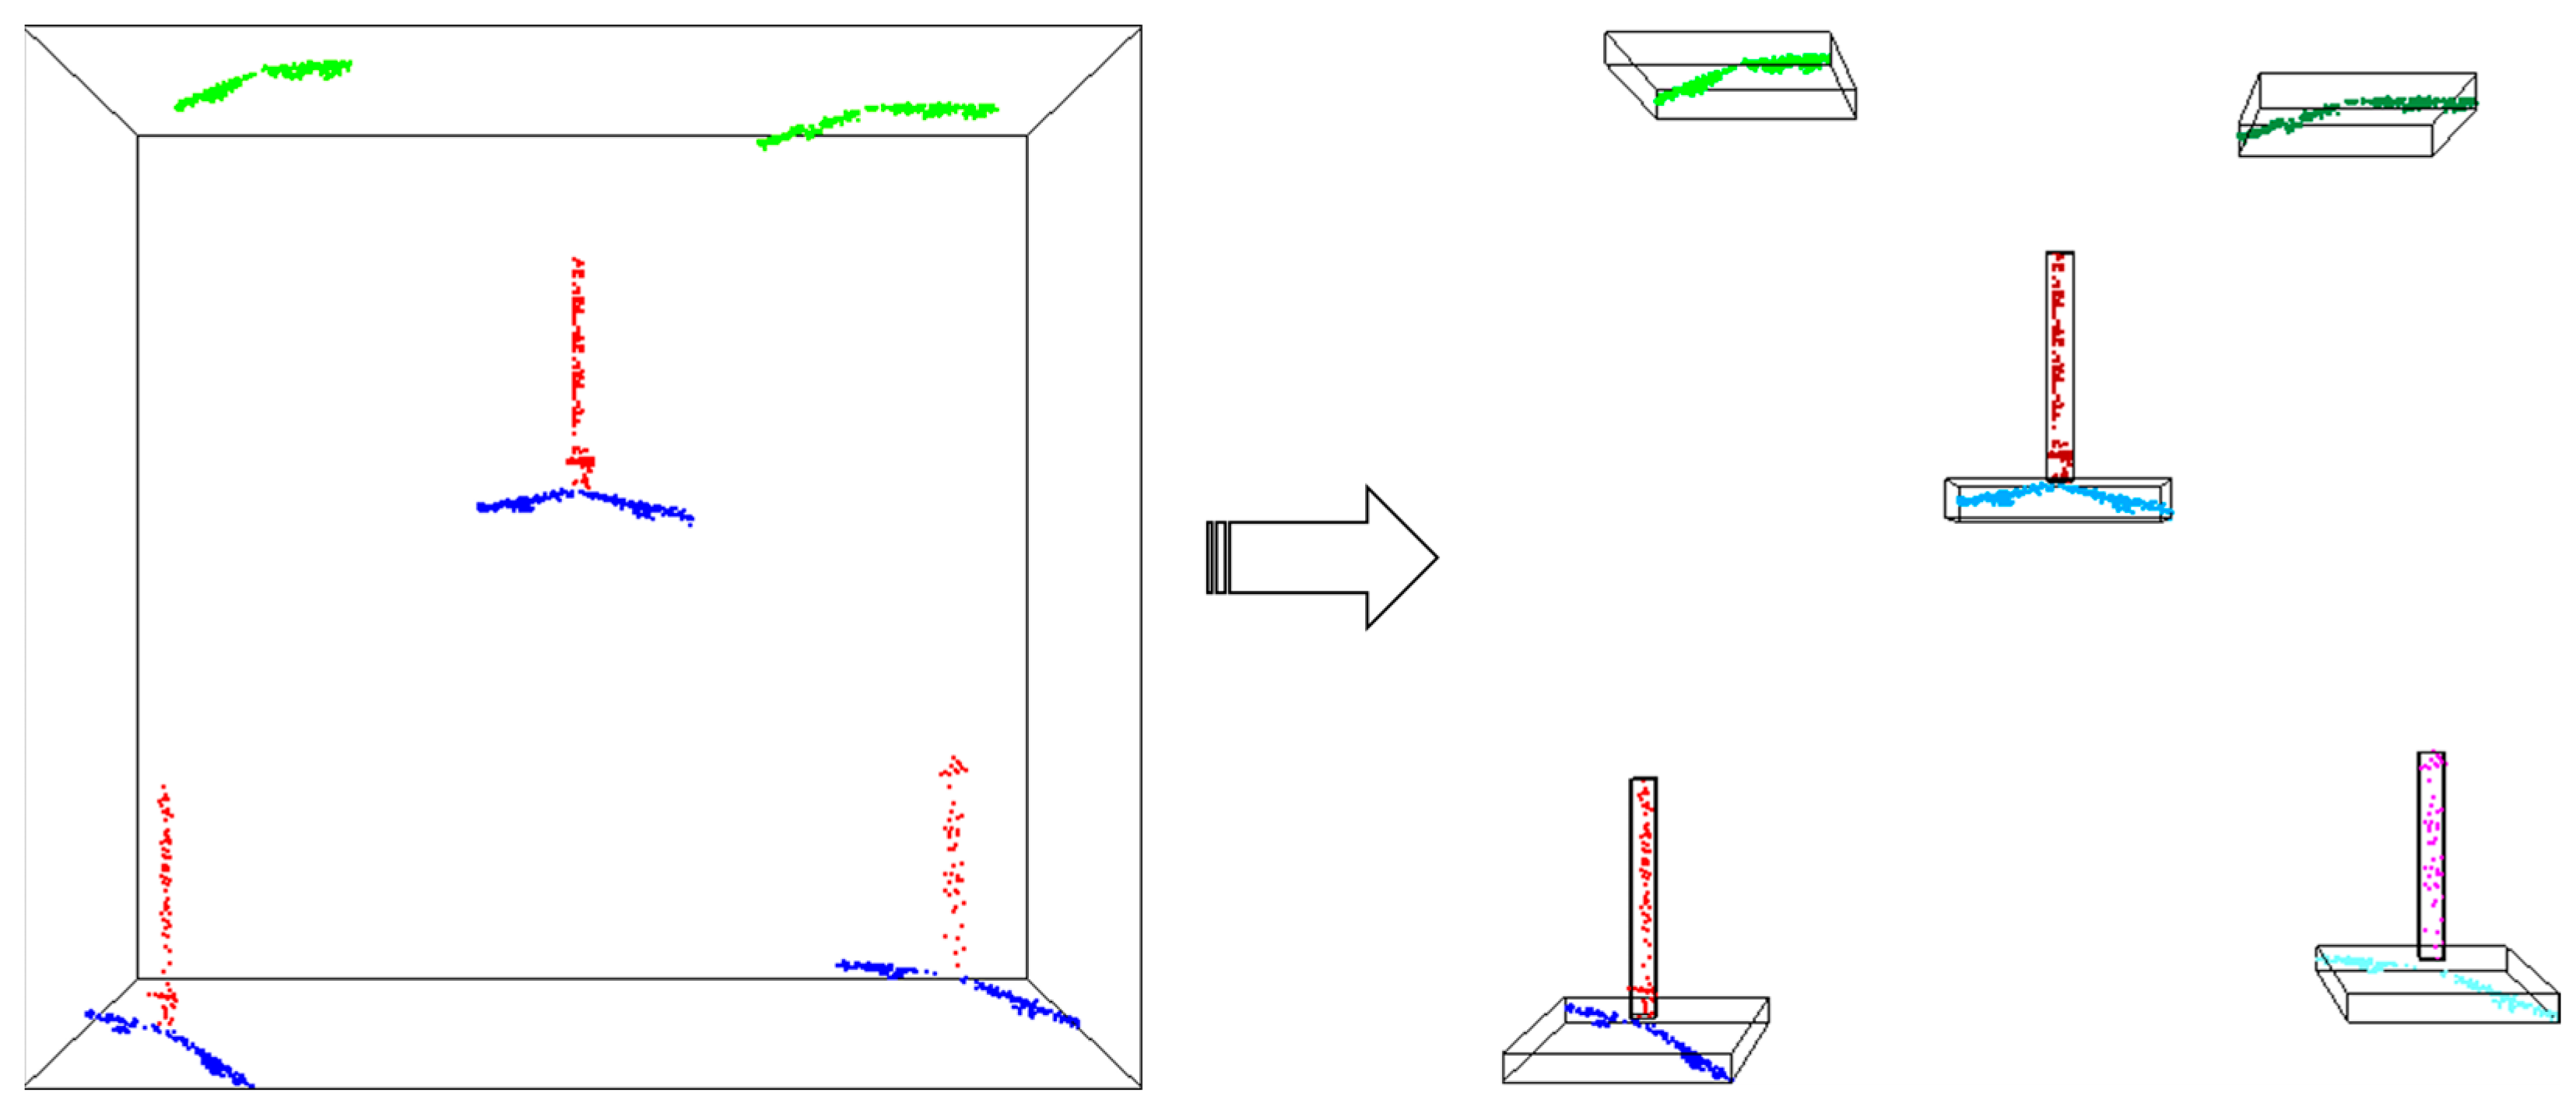
Finally, a unit sphere normalization operation is applied to the transmission tower point cloud data. In this way, the point cloud data of a transmission tower located in different locations, with the same types of towers with different sizes or different tower types, is uniformly translated and scaled into a unit sphere with the origin (0, 0, 0) as the center and a radius of size 1, which unifies and standardizes the point cloud data of each transmission tower. The schematic diagram of the data preprocessing module is shown in Figure 7.
Figure 7.
Schematic diagram of the data preprocessing module.
Translation and Rotation Invariance
For the transmission tower point cloud data, the coordinates of each point in it correspond to a real position in the real world. If segmentation is operated directly on the original point set, the locational and geometric differences between two towers will be significant since they are in different positions and may be oriented in different directions even if they have identical transmission tower types. In order to solve this problem, we need to ensure the translational and rotational invariance of the point cloud data in order to minimize the influence of the coordinate difference on the trained model to realize the effective segmentation of the various components of the transmission towers.
We adopt the currently commonly used unit sphere normalization method to normalize the data, which can be formulated as the following equations:
where denotes the original x, y, and z coordinates of the center of mass point, n denotes the total number of points in the point cloud, and m denotes the scaling factor required for the ball normalization operation.
The point cloud data of each transmission tower are processed in turn until all the transmission towers are normalized into the unit sphere. After the final segmentation is completed, it is necessary to carry out the inverse normalization according to the unique coordinate offset parameter and scaling parameter of each transmission tower point cloud data to restore the coordinates to the real position in the real world.
In order to ensure the rotational invariance of the transmission tower point cloud data, one solution is to unify all the point cloud data into a standard orientation [42], and another is to try to weaken the effect caused by rotational transformations through data enhancement. However, both methods can be problematic in practice. In the former approach, it is difficult to define a suitable rotation transformation matrix to unify the orientation of each different transmission tower completely, while in the latter approach, trying to employ a finite number of random rotations for data augmentation can essentially only mitigate the effect but does not really solve the problem, since the rotational operation is infinite in three dimensions. Instead of relying on some preprocessing of the point cloud data, the approach we take here is to extract features with rotational invariance in the point cloud to help our model learn the intrinsic rotational invariance feature of the transmission towers [43]. The schematic diagram of the operation to ensure translation and rotation invariance is shown in Figure 8.
Figure 8.
Schematic diagram of the operation to ensure translational and rotational invariance.
3.3. Multi-Scale Feature Extraction and Fusion Module
This module is the core part of the whole network, aiming to extract features from point cloud data for learning, and the overall structure learns from the multi-scale grouping (MSG) design of PointNet++ [29], which applies grouping layers with different scales, using multiple radii, to extract features with different resolutions and splicing them to form multi-scale features.
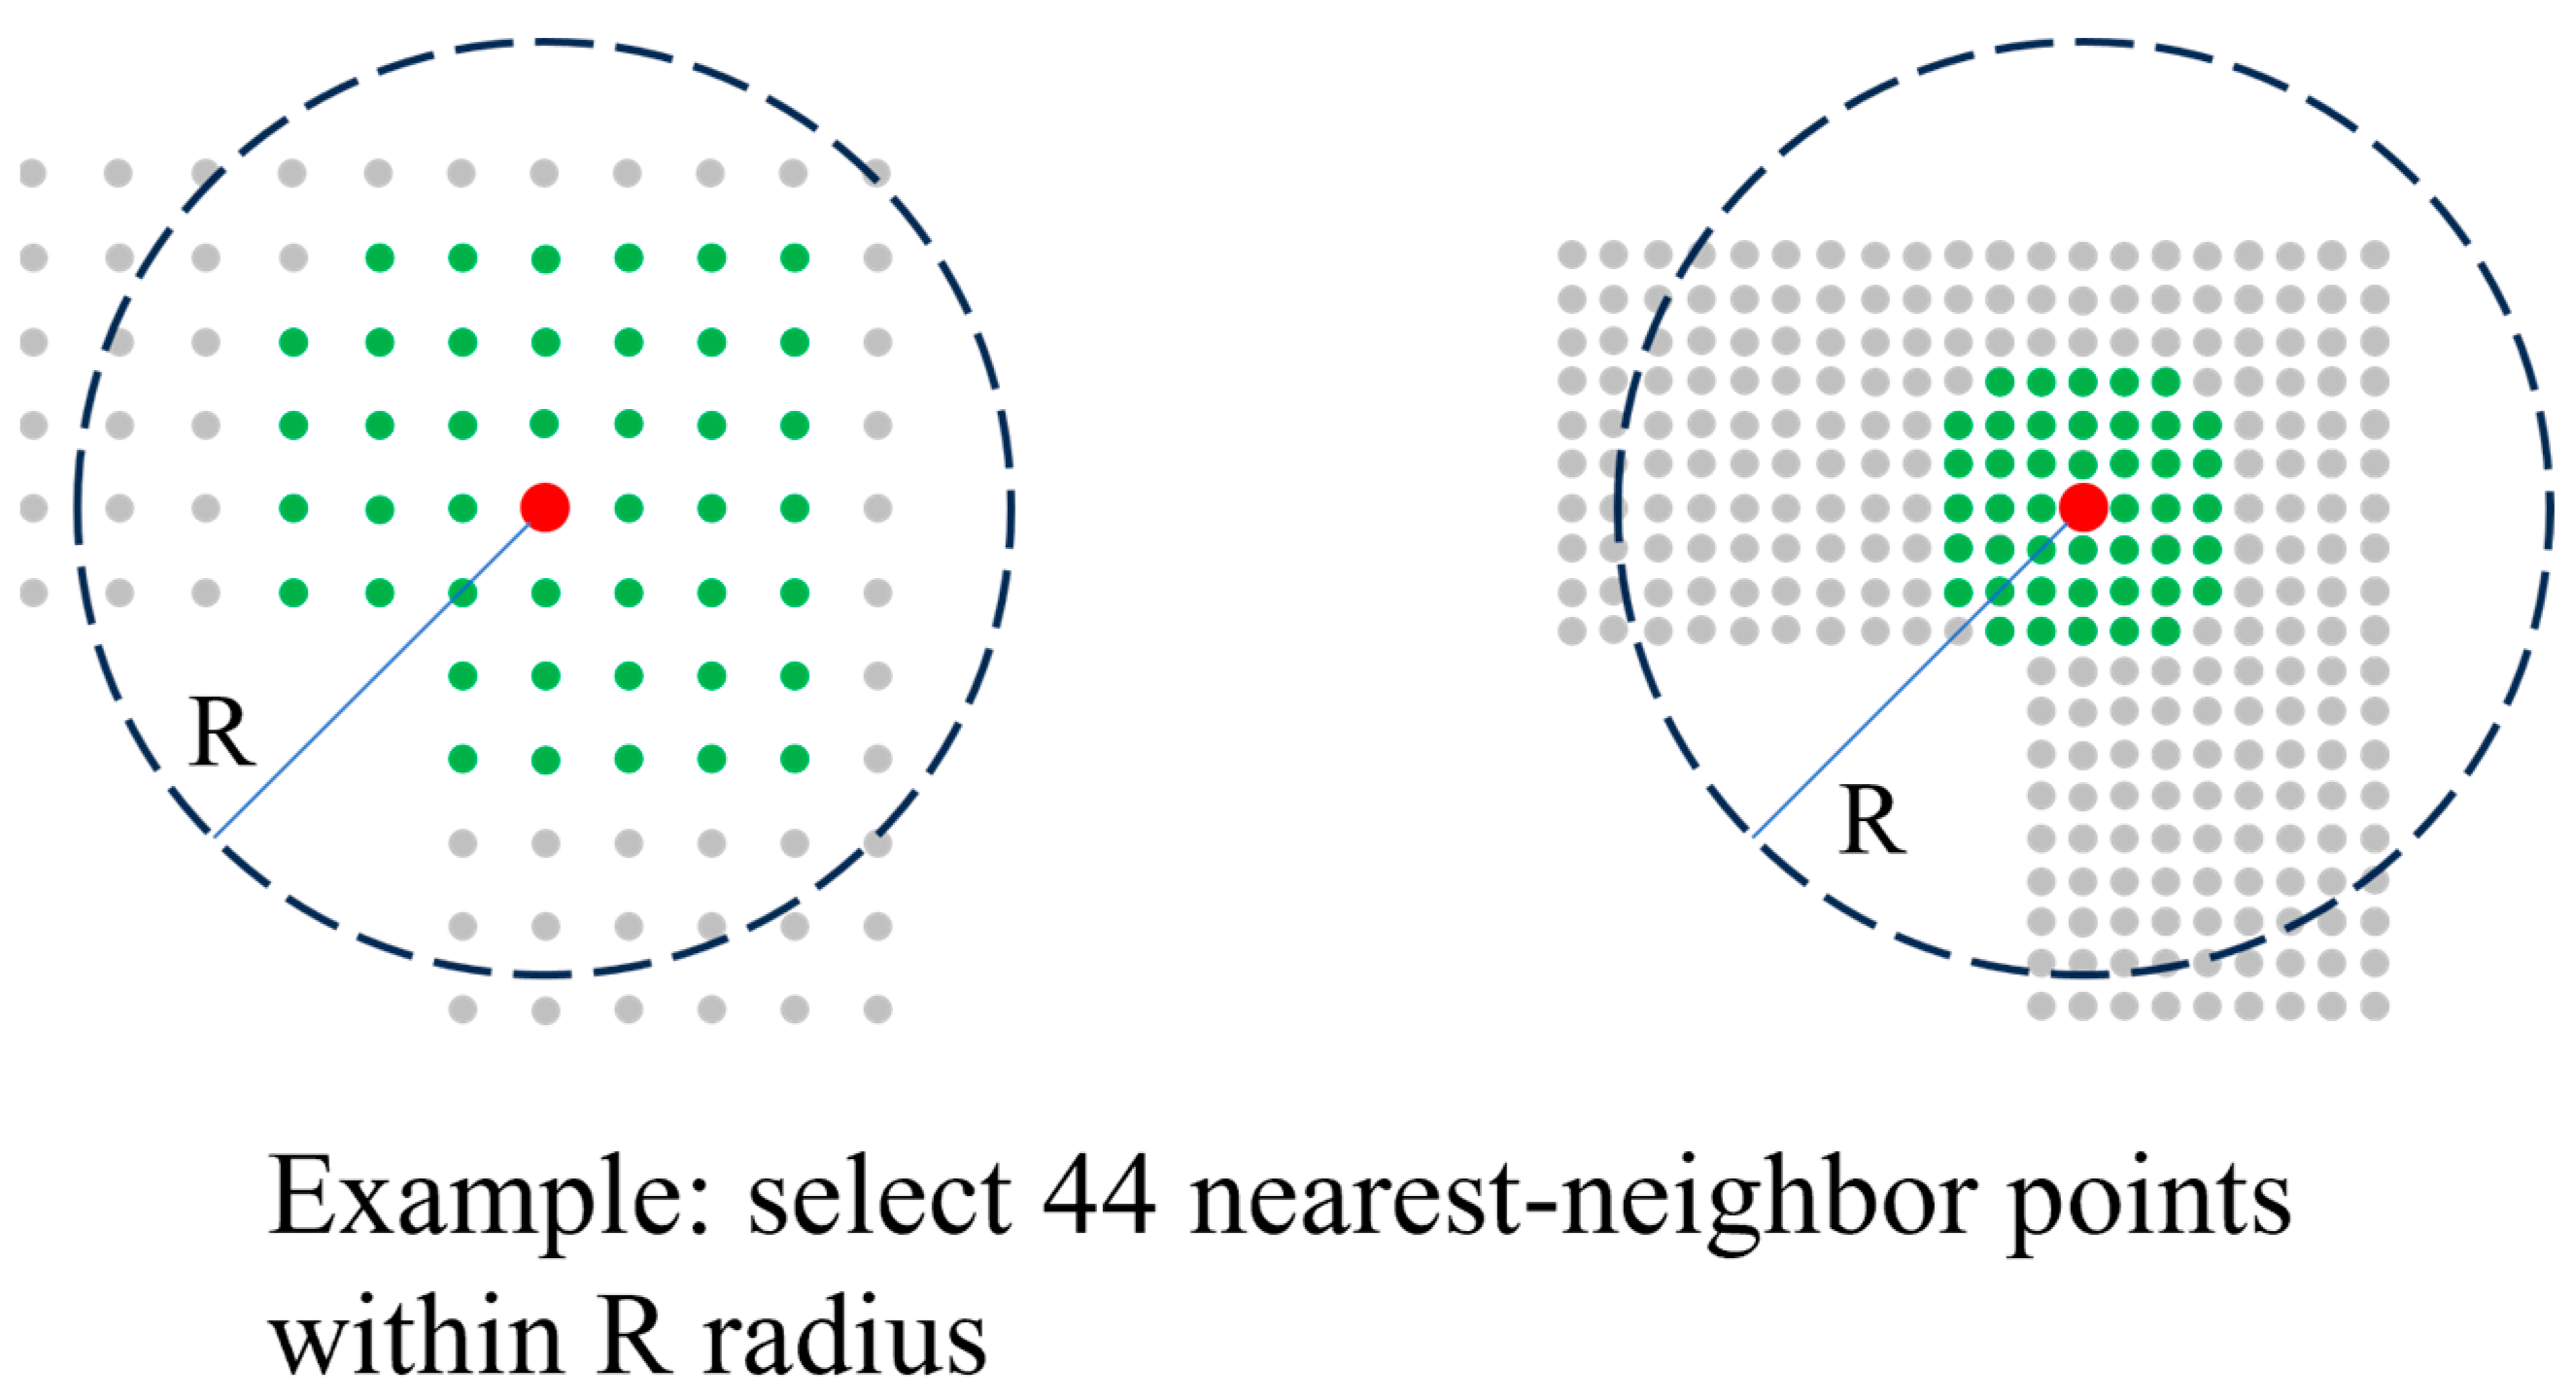
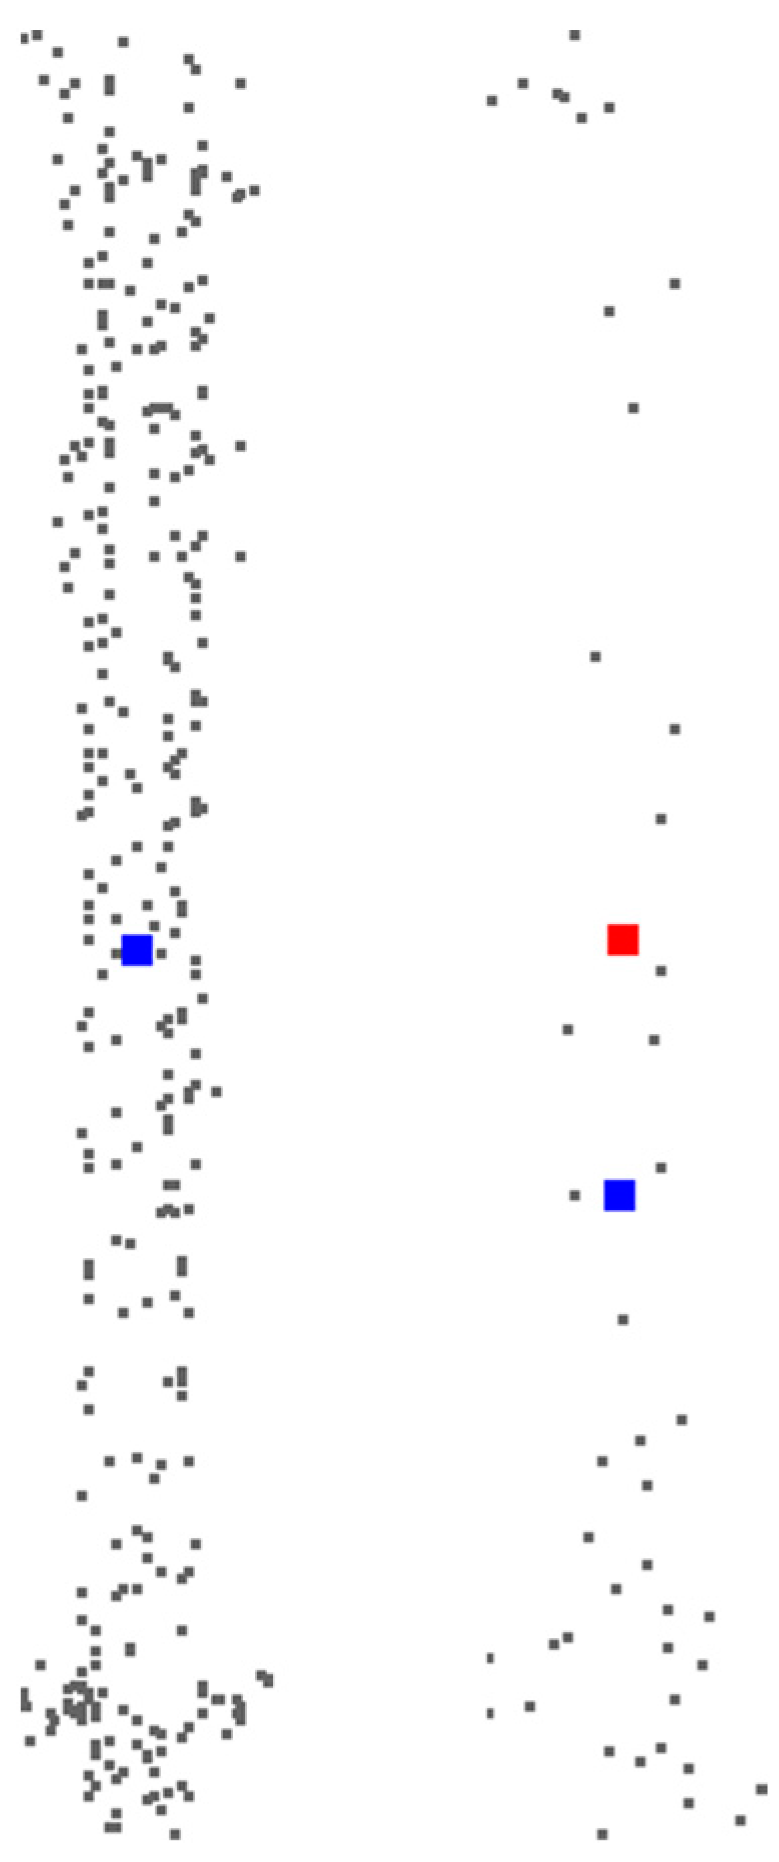
The number of points in the transmission tower point cloud data has yet to be standardized with the preprocessing module; consequently, a random sampling method is used to reduce each point cloud file to 4096 points before feeding it into the network. The network then uses the farthest-point sampling method to choose a subset of the points, which is performed twice. For the first time, 1024 points are retained, which are used to establish the center point of the grouping to divide the entire transmission tower point cloud data into 1024 local point sets. In addition to this central point, each point set will contain a certain number of neighboring points within a certain radius of the central point. The same operation is used again and then preserves the 256 local centroids, forming a set of 256 local points. Note in this step, the advantage of the octree sampling preprocessing process may also be reflected for the same shape of the point cloud with different point densities, considering the possibility of missing the more critical structure features if the point density is too high, as shown in Figure 9.
Figure 9.
Schematic diagram of the local point set. The red point represent central point, while the green points represent neighboring points.
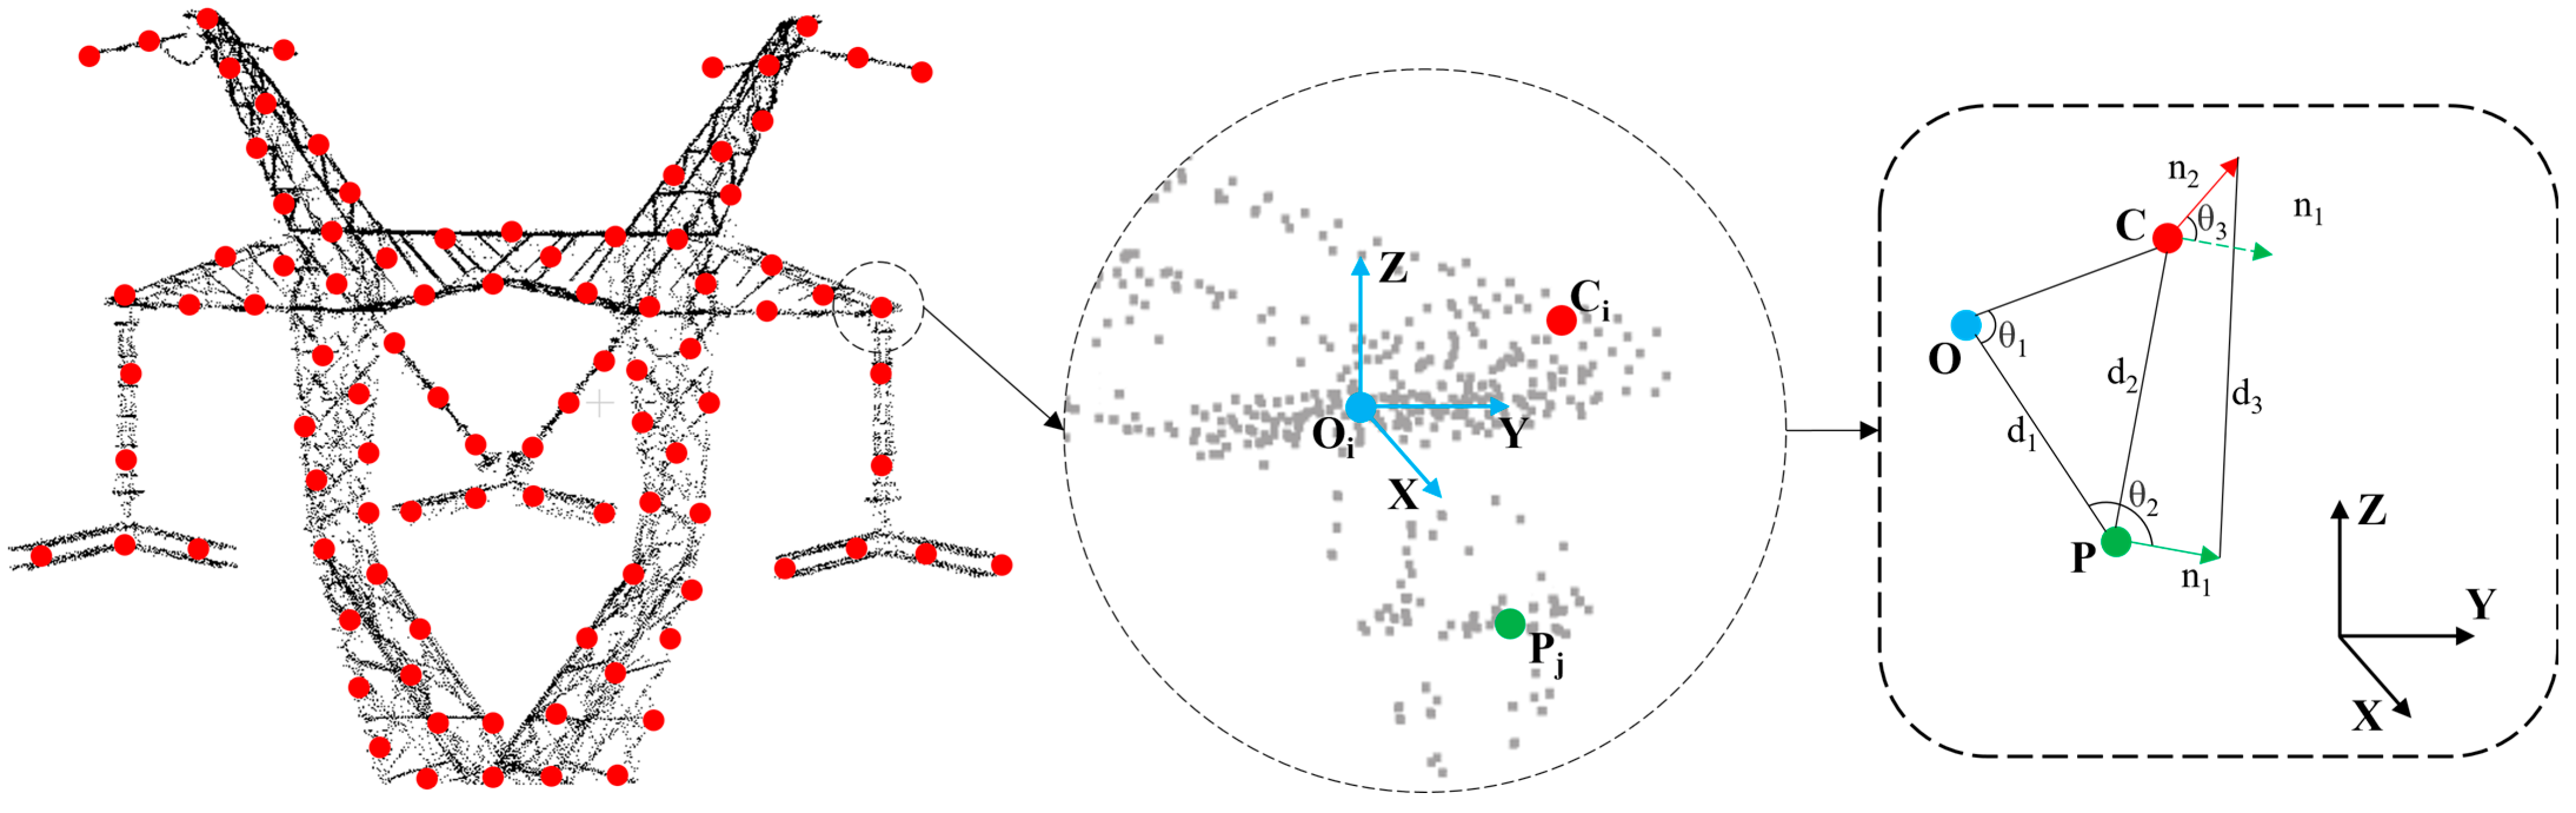
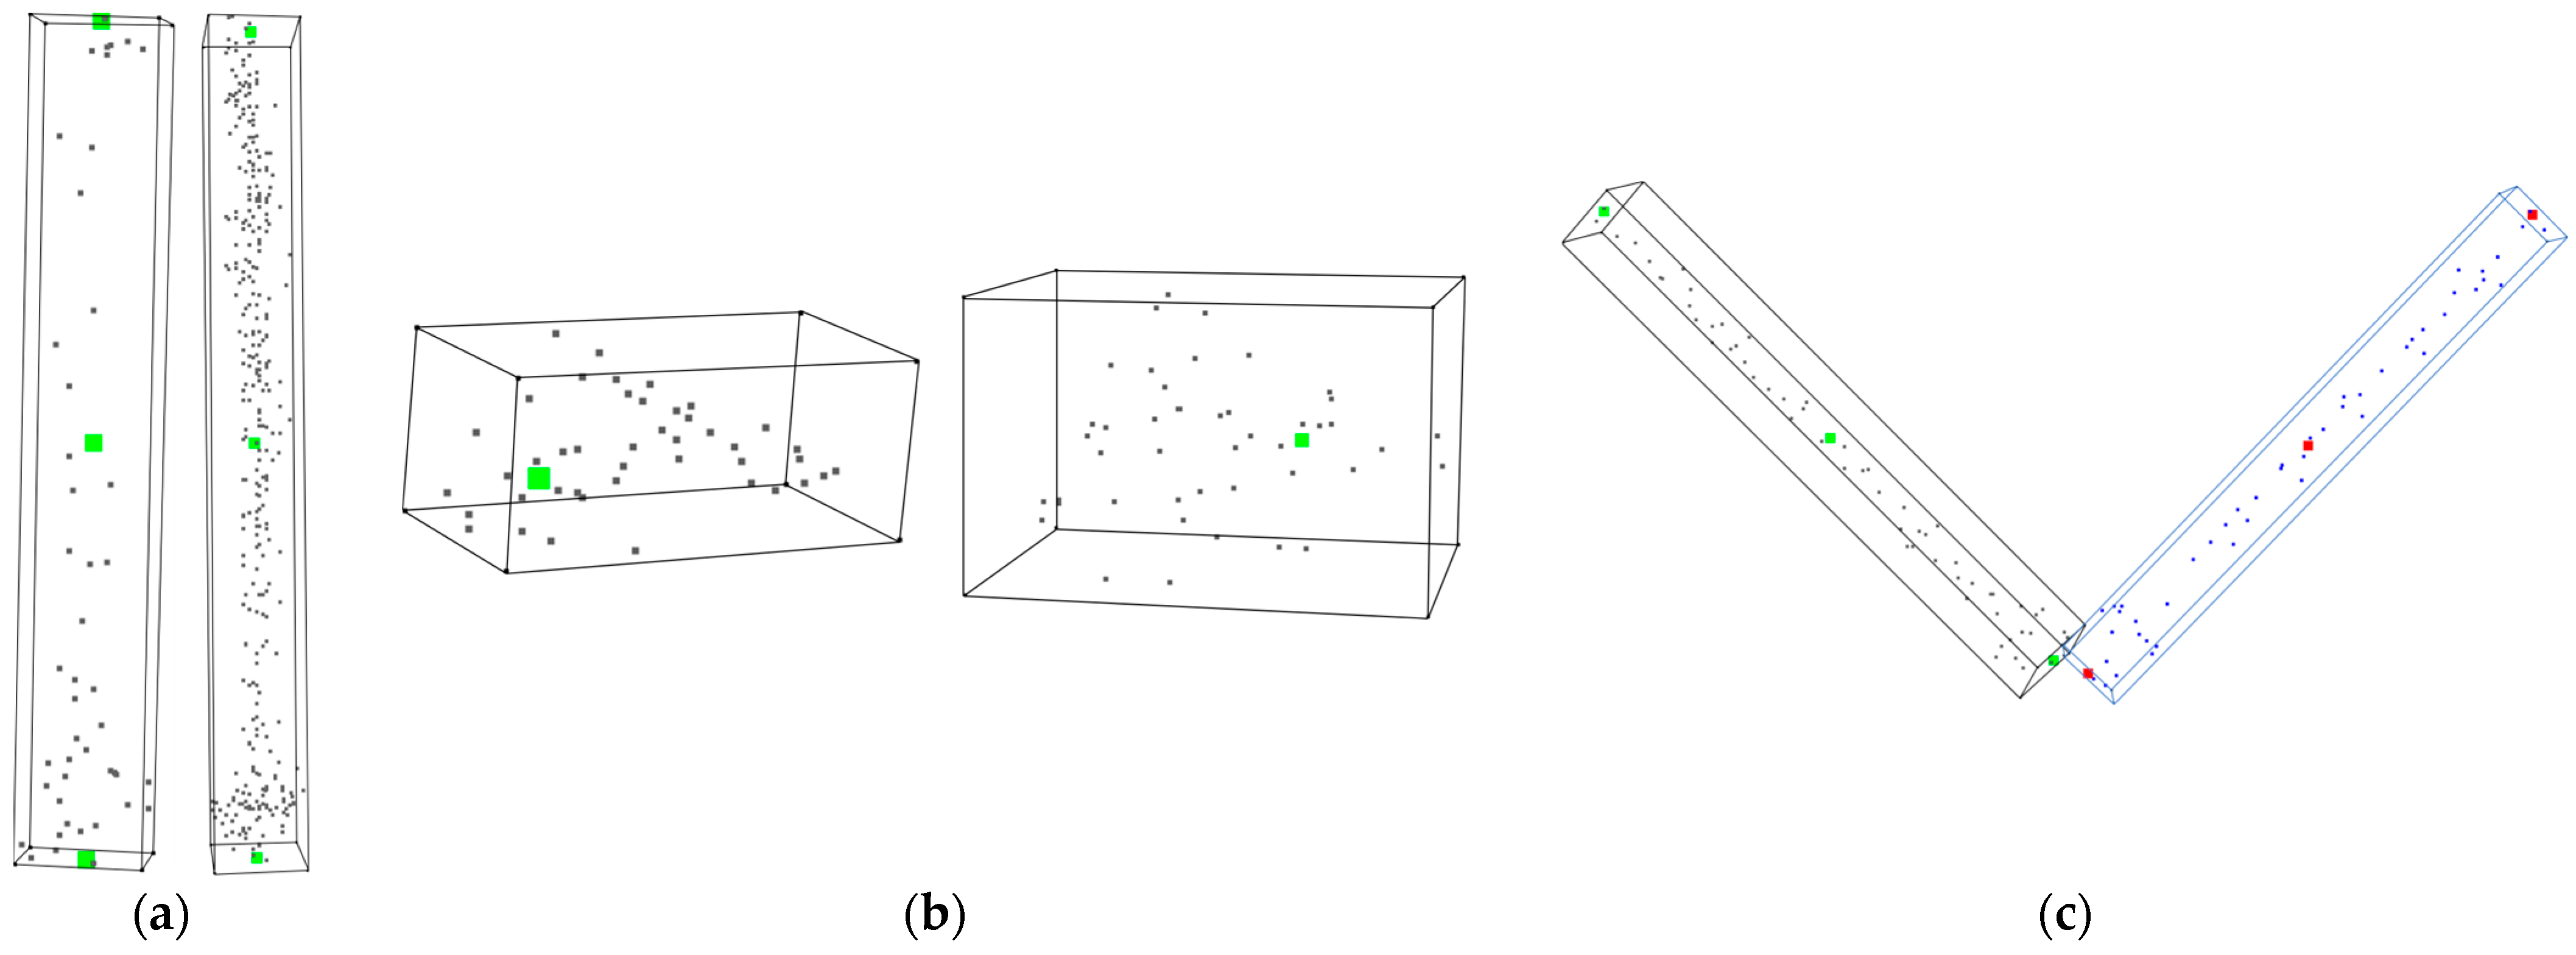
After determining the grouping of the local point sets, the center of mass point of each local point set will be calculated, a local coordinate system will be constructed with the center of mass point as the origin (0, 0, 0), and the multilayer perceptron (MLP) will be used to extract features from each local point set. In addition to encoding the position information and normal vector information of each point, we also calculate the interrelationships between the center of mass point, center point, and each neighboring point information in the local point set to extract the feature information of Euclidean distance and cosine similarity, which are fused with the basic information of the points and encoded together as the feature information of the point set:
where F denotes a feature encoding function, A1 denotes the features obtained by encoding the base information of the points, A2 denotes the features obtained by encoding the interrelationships between the points, denotes the Euclidean distance, and denotes the cosine similarity, which can correspond to the schematic diagram of the local feature extraction in the point cloud. The schematic diagram of the local feature extraction of the point cloud is shown in Figure 10, where the red point C indicates the center point of the local point set obtained after sampling the farthest point, the blue point O indicates the center of mass point of the local point set obtained after computation, and the green point P indicates any neighboring point in the local point set.
Figure 10.
Schematic diagram of local feature extraction.
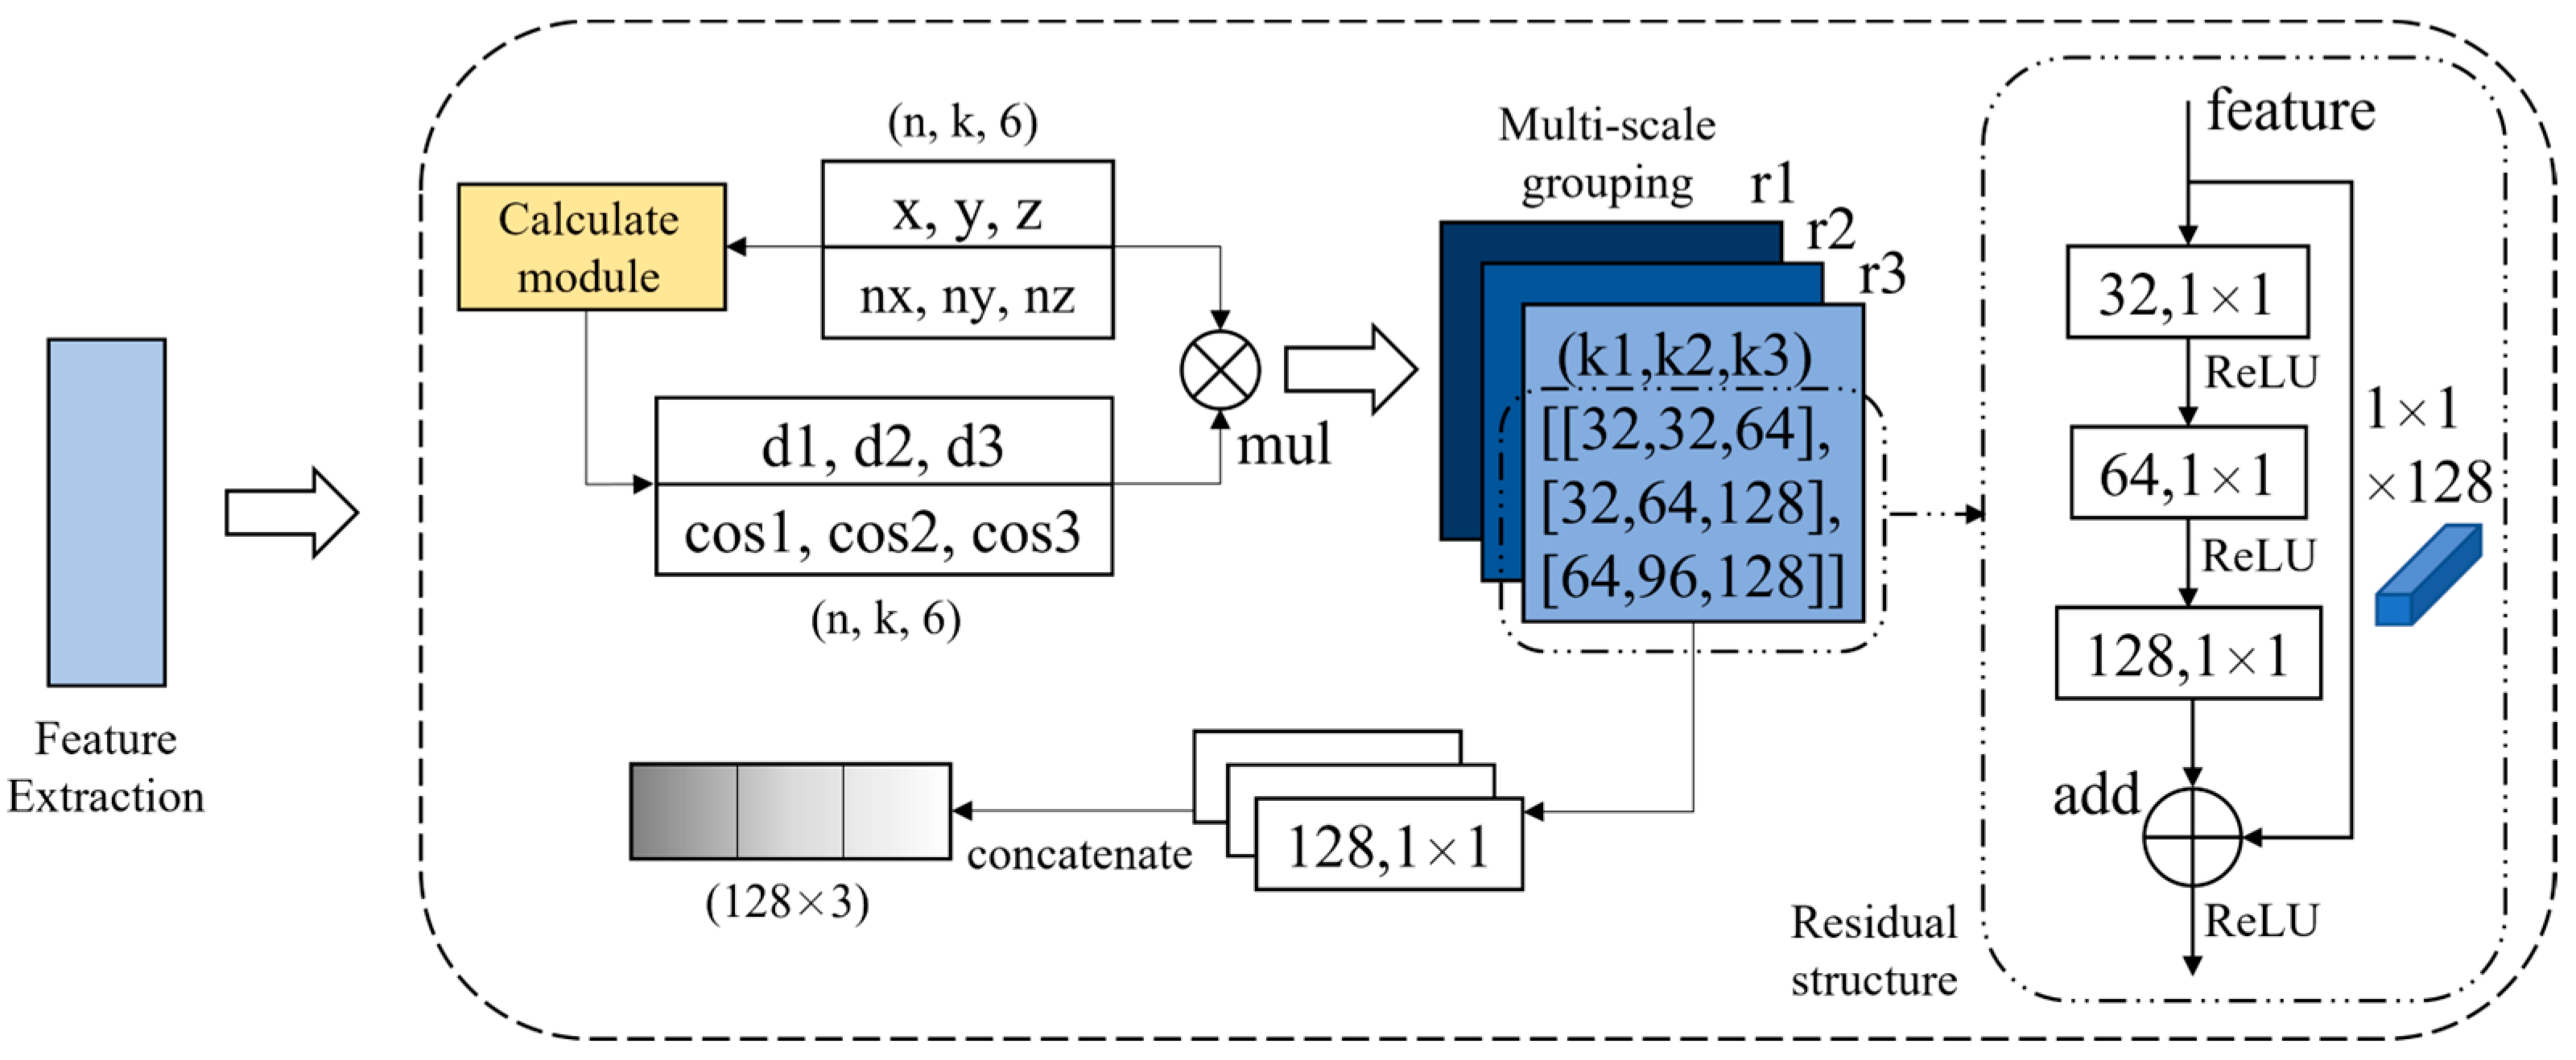
The structure of the multi-scale feature extraction module is shown in Figure 11. Through the point coordinate information and normal vector information, the required Euclidean distance information and cosine similarity information can be calculated. The MSG structure can be hierarchical and scaled to extract a variety of resolutions of the features, stacked twice, which allows the model to more smoothly increase the sensory field with more robust feature extraction capabilities. At the same time, we learn from the design advantages of the ResNet [44,45] network and introduce the residual structure to optimize the network structure further, avoid the degradation problem, and improve the model segmentation accuracy. Finally, the features extracted at the three radius scales are stitched together to obtain more comprehensive information passed to the next module.
Figure 11.
Structure of multi-scale feature extraction module.
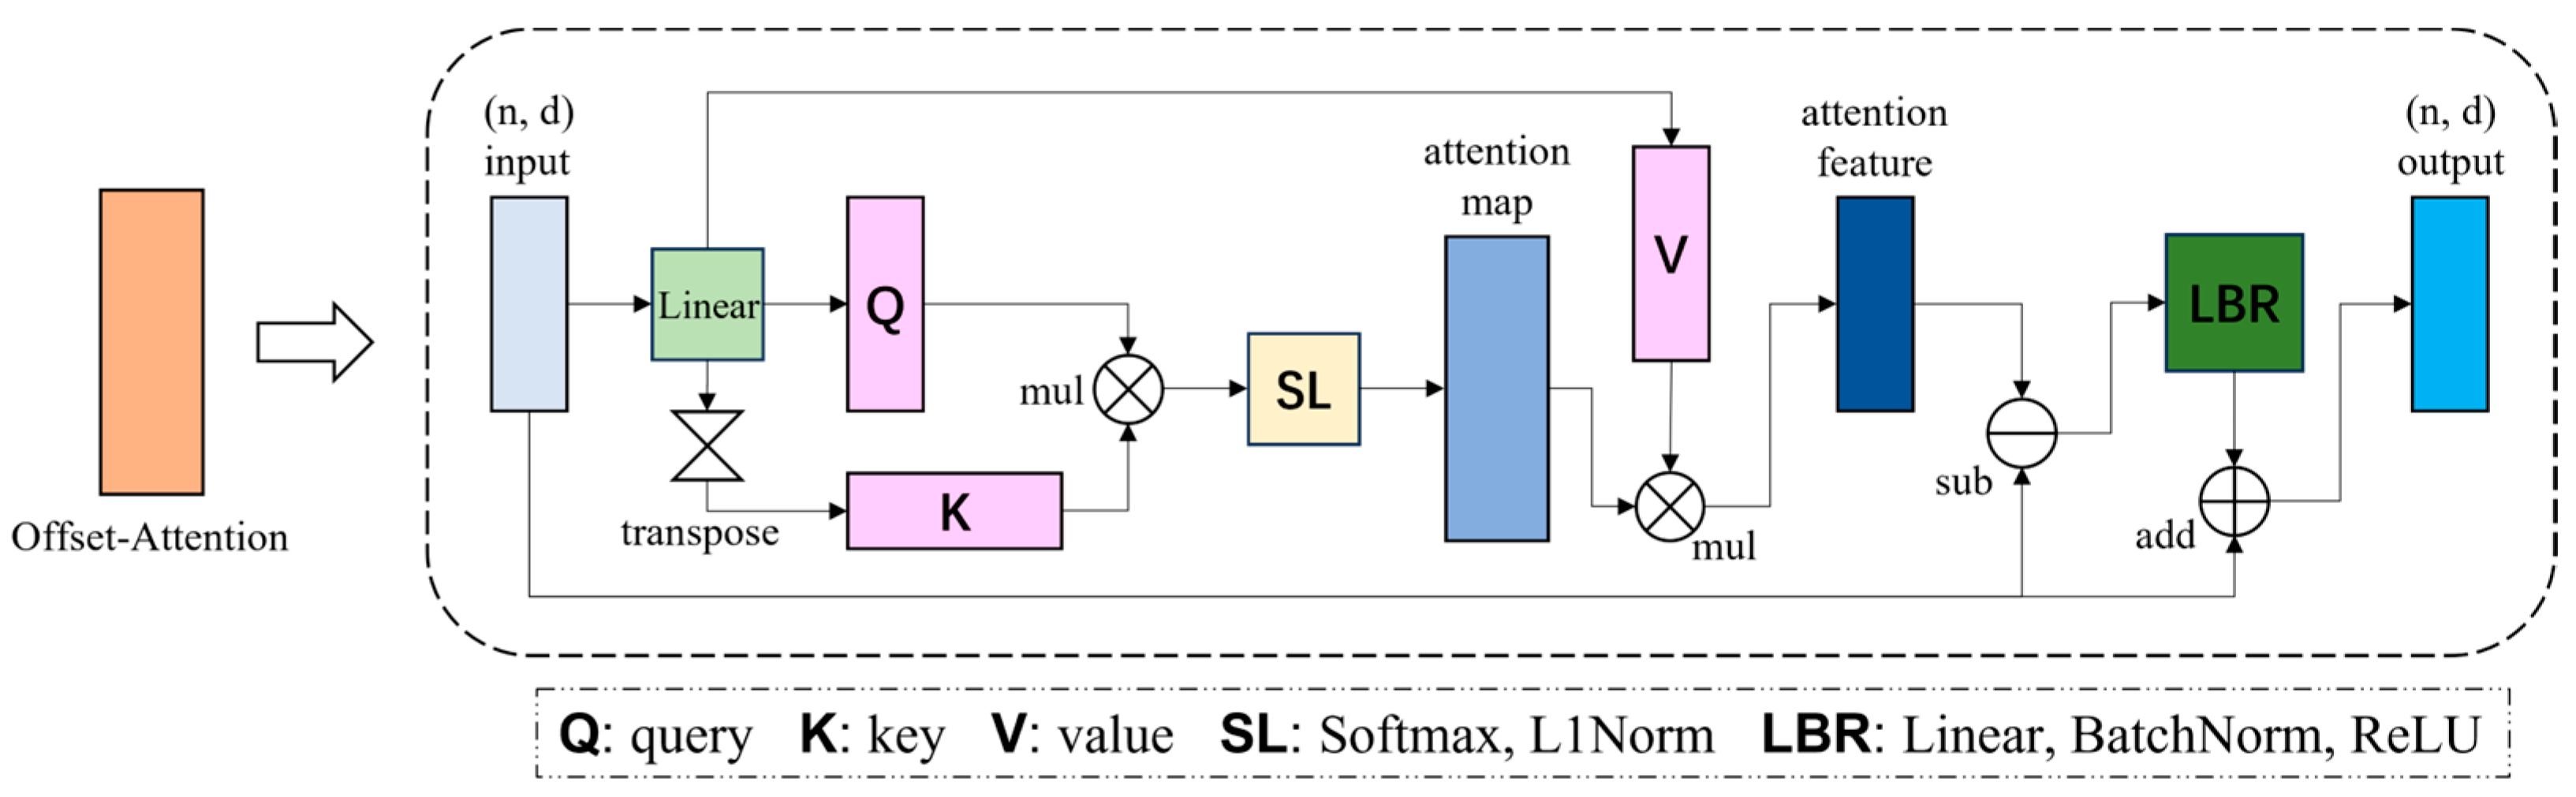
3.4. Offset-Attention Mechanism
The attention mechanism [34] is an important technique used to improve the performance of neural networks. The core idea of the attention mechanism is to find the correlation between the original data and highlight some of its important features. The model will assign different weights to each part of the feature map, highlighting key and vital information and suppressing unimportant information so that the model can make more accurate judgments.
The offset-attention mechanism we use is improved from the self-attention mechanism, which was first applied in the point cloud transformer (PCT) network [32]. The self-attention mechanism is a method for calculating semantic correlations between different elements in a data sequence. Specifically, we first convert each element into a query, a key, and a value for an input sequence. We then obtain an attention score by computing the dot product of the query with all keys, which indicates how well the query matches each key. Next, we perform a softmax operation on these scores so that they sum to 1, which gives us an attention weight. Finally, we weigh and sum the values with this weight, and the result obtained is the output of the self-attention mechanism. The formula for the self-attention mechanism is shown below:
where denotes the dimensionality of the bond, and the Q, K, and V contained in the formula all have their origin in the product of the input sequence X and the weight matrix and are essentially linear transformations of X.
The offset-attention mechanism calculates the offset between the self-attentive features and the input features by element-to-element subtraction and then passes this offset to the subsequent steps instead of the output of the original self-attention mechanism. The structure of the offset-attention mechanism is shown in Figure 12. In the traditional self-attention mechanism, the first dimension is scaled to , and the second dimension is normalized using softmax. In contrast, in the offset-attention mechanism, the softmax operator is used in the first dimension, and the L1 paradigm is used to normalize the attention graph in the second dimension. The offset-attention mechanism will increase the attentional weight and reduce the effect of noise, which will be more favorable for downstream tasks. The formula for the offset-attention mechanism is shown below:
Figure 12.
Structure of offset-attention mechanism.
3.5. Feature Propagation Module
The difference between the point cloud segmentation task and the classification task is that classification requires only one overall feature to discriminate the overall point cloud class. In contrast, segmentation can be understood as classifying each point in the point cloud, and thus, each point needs to correspond to a separate feature.
PCTTS reduces the number of points sampled layer by layer with the network to ensure that the network receives enough global information, which is similar to PointNet++ [29]. In order to obtain point features for all the points in the point cloud while avoiding higher computational costs, we use the known feature points to interpolate to complete the up-sampling so that the network outputs the same features as the input points.
The nearest neighbor interpolation is used to complete the up-sampling layer by layer, and the features of the previous layer are spliced with the features of this layer using the cross-level skip link concatenation strategy of hierarchical propagation to form a new feature representation. In PCTTS, the specific up-sampling process involves taking the globally obtained features, copying them first, and then splicing them with the 256 sampled centroid features from the preceding layer. Subsequently, nearest neighbor interpolation is applied to the results based on the distance matrix, modifying the feature values—an operation that can be interpreted as a form of weighting. After completing one round of up-sampling, the interpolated point features correspond to the 1024 sampled centroids of the next higher layer, and the features are spliced once again. This entire operation is repeated twice, gradually completing the up-sampling process and obtaining features for each of the 4096 points to fulfill the classification task for each point. The formula followed for nearest neighbor interpolation is shown below:
Here, we use three-point interpolation, where denotes the feature of the point, and denotes the weight of each point, which is weighted based on distance.
4. Point Cloud Transmission Tower UAV Inspection using Target Point Localization
4.1. Automatic Segmentation of Point Cloud Transmission Towers Based on PCTTS
4.1.1. Part Segmentation
The part segmentation is used to classify the same structure on the same transmission tower into the same class, as shown in Figure 13. To facilitate the estimation of the location of each tower part as a camera shooting target position, we need to separate the same class into individual entities by point cloud clustering. By setting a threshold value, the point cloud can be segmented into distinct clusters based on the distance relationships between points, each representing an individual entity. In addition, to locate the junction point between the tower head and the lightning line, we use the highest point position of the lightning line instead. However, in some cases, occlusion may result in the absence of point cloud data for the highest point location of the lightning line. This absence could lead to a significant deviation, necessitating a slight offset in the post-processing stage based on the actual circumstances. Despite these problems, the outcomes of part segmentation can still furnish high-precision foundational data for applications beyond the scope of this study, such as 3D reconstruction and digital management.
Figure 13.
Cluster segmentation effect of different individuals of the same category.
4.1.2. Instance Segmentation
The instance segmentation is used to segment each part on the same transmission tower into individual entities without additional processing. When constructing the instance segmentation dataset, distinct entities within the same category are assigned unique category labels and then utilized for network training. During the detailed inspection of transmission towers using UAVs, there is no necessity to capture separate photos of transmission lines and lightning lines. Therefore, we labeled the regions on either side of the tower head and the insulator string area as samples. The remaining unused areas, along with the tower body, were labeled as other categories. After our model is fully trained, each component can be segmented individually.
4.2. Fitting Center Point Coordinates Based on Segmentation Results
After obtaining the individual point cloud data for each part, the center point coordinates of the part can be obtained for subsequent target point localization. Since the quality of point cloud data varies, two methods are designed to find the center point coordinates of the parts. Take the vertical insulator string as an example. In the case of point cloud data with good quality, i.e., plenty of uniformly distributed points, the mean coordinate values of all the points can be calculated as the centroid point coordinates of the point cloud. An additional benefit of this approach is that it can reduce the impact of outliers on the estimation result. The method can be formulated as follows:
For point cloud data with poor quality, the mean coordinate values of the point may deviate from the central position significantly since the number of points may be less and the distribution of the points may be more scattered. In this case, the mean value of the z-axis of the highest point and the lowest point is calculated as the z-axis coordinate of the central position. The x-axis and y-axis coordinates are still estimated in terms of the mean x-axis and y-axis coordinate values of all points, as shown in Equation (14):
A comparison of the results of the two methods is shown in Figure 14, where the blue color indicates the fitting results of the former method, the red color indicates the fitting results of the latter method; the results of the two methods on the left side of the figure overlap; the right side of the figure demonstrates the significant differences of the results obtained from the use of the two different fitting methods in the case of poorer data quality and non-uniform distribution of the points.
Figure 14.
Comparison of results of center point fitting calculations.
4.3. Target Point Localization and Inspection
After obtaining the geometric center of each part, the target points are located according to the coordinates of the center point. The number of target points to be located varies for each tower type, depending on the number of tower heads and insulator strings. Each tower head position requires at least one target point, which is used to photograph the tower head and the lightning line hanging point during UAV inspection; each insulator string position normally requires three target points, which are used to photograph the hanging point at both ends and the insulator string itself. For the target point at the tower head, we directly use the fitted center point of that part of the point cloud and then add a fixed offset for each different tower type as appropriate. For the target point at the vertical insulator string, we first construct the oriented bounding box (OBB) based on the fitting results of the center point coordinates and then calculate the center coordinates of the top and bottom surface and geometric center coordinates of the OBB, which correspond to the target point coordinates at the two ends of the hanging point and the insulator string itself. For horizontal insulator strings, the coordinates of the center of the left-side and right-side faces of the OBB are calculated, corresponding to the coordinates of the target point at the hanging points at both ends, respectively. For the “V-shaped” insulator string structure in Tower A and Tower E, we consider it as two insulator strings during the segmentation process, but the bottom two target points will be merged during the target point localization so that there will be only five target points in the structure. A schematic diagram of the positioning points for each part of the transmission tower is shown in Figure 15.
Figure 15.
Schematic diagram of the positioning points of each part of the transmission tower. (a) insulator string. (b) tower head. (c) the “V-shaped” insulator string.
5. Experimental Results and Analysis
5.1. Data Sets and Evaluation Criteria
In order to validate the performance of our proposed PCTTS model, as mentioned before, we produced two types of datasets: one for part segmentation, which contains six tower types and 200 “half-tower” point cloud data, and the other for instance segmentation, which contains three tower types and 116 “half-tower” point cloud data. The specific number of towers of each tower type and the partition of training and testing sets are shown in Table 1 and Table 2.
Table 1.
Part segmentation dataset partition table.
Table 2.
Instance segmentation dataset partition table.
In the above two datasets, the segmentation results of each tower type were evaluated using the mean intersection over union (mIOU) [46], which is the most commonly used in point cloud segmentation tasks and is calculated as follows:
where and denote the number of incorrect predictions, denotes the number of correct predictions, and k denotes the number of categories.
5.2. PCTTS Model Training
We converted our dataset to the same format as the ShapeNet dataset [16], categorizing each type of transmission tower into a separate class. We carried out the training in two ways: one was to train all the transmission towers together and end up with a total model file, and the other was to train each type of transmission tower separately and end up with their individual model files. The purpose of the latter is to avoid different types of transmission towers affecting each other to explore whether the segmentation accuracy will be improved. Ultimately, the higher the segmentation accuracy, the more accurate our target point localization will be.
For our task, the network is designed and implemented in PyTorch, and all experiments are implemented in the same configuration. Among them, the hardware platform of the experiment is Intel(R) Xeon(R) Gold 6130 CPU, two NVIDIA GeForce RTX 2080Ti GPUs equipped with 11 GB memory each, and 128 GB RAM. The experimental software platform is based on the Windows 10 PyCharm operating system, including CUDA 11.6, Pytorch 1.13.0, and Python 3.8.13. And we adopt the AdamW [47] optimizer and use optimization techniques such as the cosine learning rate decay strategy, cross-entropy loss function with label smoothing, etc., to optimize our model. The initial hyperparameters are shown in Table 3.
Table 3.
Training parameters.
5.3. Comparative Analysis of Automatic Segmentation Experiments for Point Cloud Transmission Towers
5.3.1. Comparative Analysis of Part Segmentation Results
Based on our self-constructed point cloud transmission tower part segmentation dataset, we complete the training to obtain the part segmentation model and compare the PCTTS model proposed in this paper with the PointNet [28], PointNet++ [29], DGCNN [35], Point Transformer [30], and PointMLP [48] models to assess the performance of the model. The results are shown in Table 4.
Table 4.
Comparison of segmentation accuracy of different models on point cloud transmission tower part segmentation dataset.
From the results in the above table, it can be seen that our model achieves the overall optimal segmentation accuracy on the point cloud transmission tower part segmentation dataset, with an mIOU value of 94.1%. Only the segmentation accuracy of Tower C is lower than that of the DGCNN model by 1.5%, which proves the effectiveness of the model. Meanwhile, if each type of transmission tower is trained separately to avoid mutual interference, the final segmentation accuracy improves significantly, as shown in the last row of Table 4. Figure 16 shows the segmentation results of the PCTTS model. Figure 17 shows the segmentation results of the other models.
Figure 16.
Visualization of PCTTS point cloud transmission tower part segmentation results, with the tower body represented in blue, transmission lines in green, lightning lines in yellow, and insulator strings in red. (a) PCTTS-Tower A. (b) PCTTS-Tower B. (c) PCTTS-Tower C. (d) PCTTS-Tower D. (e) PCTTS-Tower E. (f) PCTTS-Tower F.
Figure 17.
Visualization of point cloud transmission tower part segmentation results for other models, with the tower body represented in blue, transmission lines in green, lightning lines in yellow, and insulator strings in red. (a) PointNet-Tower A. (b) PointNet++-Tower C. (c) DGCNN-Tower D. (d) Point Transformer-Tower E. (e) PointMLP-Tower B.
As can be seen from the results in Figure 16 and Figure 17, our model shows superior performance in the part segmentation at the joints of the parts. In addition, the segmentation results of our model do not have less misclassification in the region, compared to the results of other models, which can be seen in Figure 17 and are shown as messed up colors. This kind of misclassification will greatly impact the subsequent target point localization if corresponding post-processing modification measures are not taken.
In addition to segmentation accuracy, we also compared the parameter count and per-epoch runtime of the aforementioned models on the dataset for segmenting components of transmission towers, as shown in Table 5. From the results in the table, it is evident that there is no absolute relationship between the model’s performance and its parameter count or runtime; rather, it mostly depends on the model design. Fully connected layers tend to have a larger parameter count compared to convolutional layers, while transformer architectures, due to their depth and the relevance of attention mechanisms, result in larger parameter matrices and longer computation times. Moreover, better optimization strategies and data parallelization also impact performance. We should balance accuracy, runtime, parameter count, and other factors according to different usage scenarios. Ultimately, our goal is to achieve optimal performance across all aspects.
Table 5.
Comparison of parameter count and runtime for different models on point cloud transmission tower part segmentation dataset.
5.3.2. Comparative Analysis of Instance Segmentation Results
Since each component on the transmission tower needs to be photographed and inspected one by one during the UAV inspection process, the indoor route planning should identify all components as individual instances and localize their positions. The instance segmentation experiment is considered here to separate each component. To do so, a point cloud transmission tower instance segmentation dataset is created to train the instance segmentation model, as we have described in Section 2.2. The PCTTS model proposed in this paper, as well as the other above-mentioned models, is also compared to evaluate the performance differences. The results are shown in Table 6.
Table 6.
Comparison of segmentation accuracy of different models on point cloud transmission tower instance segmentation dataset.
From the results in the above table, it can be seen that since the instance segmentation is more refined than the part segmentation, the segmentation accuracies of all the models have decreased compared to the part segmentation accuracies. However, the PCTTS model still achieves the overall optimal segmentation accuracy, with the mIOU value reaching 86.9%, with the exception of tower A, which is lower than the DGCNN model by 0.8%. Furthermore, if each type of transmission tower is trained separately to avoid mutual interference, the segmentation accuracy improves mIOU by 5%, as shown in Table 6. Figure 18 shows the segmentation results of the PCTTS model, while Figure 19 shows the segmentation results of the other models.
Figure 18.
Visualization of PCTTS point cloud transmission tower instance segmentation results, where the color of each part is different. (a) PCTTS-Tower A. (b) PCTTS-Tower B. (c) PCTTS-Tower C.
Figure 19.
Visualization of point cloud transmission tower instance segmentation results for other models, where the color of each part is different. (a) PointNet-Tower A. (b) PointNet++-Tower C. (c) DGCNN-Tower C. (d) PointMLP-Tower B. (e) Point Transformer-Tower A.
As can be seen from the results, the main problems in instance segmentation compared to part segmentation still lie in the unclear segmentation of the interconnected locations of the structures, as well as the misclassification of certain regions, which can be seen in Figure 19 and are shown as messed up colors. Comparing the segmentation results of the PCTTS model with other models, it is shown that the PCTTS model is superior in terms of having far fewer misclassification errors and better completeness, which is very helpful for reducing the error of subsequent target localization work.
5.4. Analysis of Target Point Localization for UAV Inspection of Point Cloud Transmission Towers
After completing the original point cloud transmission tower data segmentation, we extracted one transmission tower from each type for UAV inspection target point localization experiments for both part segmentation and instance segmentation results. In the results of part segmentation, we selected one transmission tower from each of the six types and separated different individuals of the same structure by first doing a clustering operation on the segmentation results. Then, according to the lightning line point cloud, the insulator string point cloud fitting center point is finally calculated to obtain the UAV inspection target point coordinates. For the special “V-shaped” insulator string position, it is also necessary to integrate the two lower-end coordinates into one, as shown in Figure 20.
Figure 20.
Example of UAV inspection target point localization based on point cloud transmission tower part segmentation results. (a) Tower A. (b) Tower B. (c) Tower C. (d) Tower D. (e) Tower E. (f) Tower F.
In the results of the instance segmentation, we selected one transmission tower from each of the three types of transmission towers, and the segmentation results were directly used to fit the center point of each individual point cloud and then calculated to obtain the coordinates of the target point of the UAV inspection. For the more special “V-shaped” insulator string location, it is also necessary to integrate the two lower-end coordinates into one. The specific results are shown in Figure 21.
Figure 21.
Example of UAV inspection target point localization based on point cloud transmission tower instance segmentation results. (a) Tower A. (b) Tower B. (c) Tower C.
From the results illustrated in Figure 20 and Figure 21, the two segmentation methods show the high consistency of the final location of the UAV inspection target point. The main difference lies in the localizing point at the tower head position, where the former is located near the lightning line, while the latter is located near the tower head. In general, the final results of the two segmentation methods are both acceptable and have trivial differences.
Note here that the incompleteness of the tower point cloud, usually caused by the LiDAR data acquisition due to the obscured area, low reflectance of the materials, etc., may greatly affect the accuracy of the target point positioning. Therefore, it is not possible to automatically obtain the accurate coordinates of the UAV inspection target points where the key positions of the point cloud data are missed in a large area. In this case, human–computer interaction is necessary to validate and refine the automatic localization results.
5.5. Ablation Experiment
In order to verify the validity of the PCTTS model proposed in this paper, we conducted the following ablation experiments with identical experimental parameter settings described in Table 3, and the experimental results are shown in Table 7 and Table 8.
Table 7.
Comparison of ablation experimental results for part segmentation of point cloud transmission towers.
Table 8.
Comparison of ablation experimental results, for instance, segmentation of point cloud transmission towers.
From the results shown in Table 7 and Table 8, it can be seen that the simultaneous use of the Euclidean distance feature and the cosine similarity feature can effectively improve the segmentation accuracy both in the point cloud part segmentation and instance segmentation. The improvement is especially significant in the instance segmentation experiments, which indicates that the simultaneous use of these two features can effectively improve the segmentation performance of the model and the ability of the model to differentiate between individuals of the symmetric structure. Given the lesser amount and slightly lower quality of data in Tower C compared to Towers A and B, along with the findings from the ablation experiments, we observe that the offset-attention mechanism is more effective in enhancing the model’s capability to concentrate on the target region. This improvement contributes to better segmentation performance, particularly in scenarios with suboptimal data quality and limited dataset size.
The ablation experimental results verify that the method proposed in this paper, when using Euclidean distance and cosine similarity as features at the same time and adding the offset-attention mechanism, is able to improve the performance of the model more comprehensively, especially in instance segmentation.
6. Conclusions
To reduce the labor work involved in the manual determination of the target point of UAV inspection, this paper proposes a deep learning-based target point localization method for point cloud transmission towers by UAV inspection. The method first extracts the transmission tower from the original transmission channel point cloud data, then proposes a PCTTS deep learning model to segment the transmission tower point cloud data automatically and uses the segmented results to locate the coordinates of the target point of the key component of the transmission tower. The following conclusions can be drawn from the experimental results of this paper:
- (1)
- The deep learning-based point cloud transmission tower UAV inspection target point localization method proposed in this paper has the advantages of low artificial demand, high operational efficiency, and low cost. Based on the current experimental results, this method demonstrates strong generalization capabilities for various types of transmission towers, providing substantial assistance in periodic power inspection operations;
- (2)
- Compared with other commonly used models in the field of point cloud segmentation, the PCTTS point cloud transmission tower automatic segmentation model proposed in this paper shows a better segmentation effect for transmission tower point cloud data by solving point cloud down-sampling, translation, and rotation invariance;
- (3)
- The automatic part and component segmentation results of the transmission tower point cloud data by the PCTTS model, combined with the corresponding target point positioning algorithm, have the potential to replace the traditional manual selection of the inspection target point, which may significantly reduce the labor work time and costs.
Author Contributions
Conceptualization, X.L., Y.L. and Z.L.; data curation, X.L. and G.Z.; funding acquisition, Y.L., Y.C. and Z.L.; investigation, X.L. and G.Z.; methodology, X.L., Y.L. and Z.L.; project administration, Y.L., Y.C., G.Z. and Z.L.; supervision, Y.L., Y.C. and Z.L.; validation, X.L.; visualization, X.L.; writing—original draft, X.L.; writing—review and editing, X.L. and Z.L. All authors have read and agreed to the published version of the manuscript.
Funding
This research was funded by the National Key Research and Development Program of China (2018YFB0504504) and the Funded Project of Fundamental Scientific Research Business Expenses of the Chinese Academy of Surveying and Mapping (AR2203; AR2201).
Data Availability Statement
The data in this study are owned by the research group and will not be shared.
Conflicts of Interest
The authors declare no conflicts of interest.
References
- Punse, G.S. Analysis and design of transmission tower. Int. J. Mod. Eng. Res. 2014, 4, 116–138. [Google Scholar]
- Conde, B.; Villarino, A.; Cabaleiro, M.; Gonzalez-Aguilera, D. Geometrical Issues on the Structural Analysis of Transmission Electricity Towers Thanks to Laser Scanning Technology and Finite Element Method. Remote Sens. 2015, 7, 11551–11569. [Google Scholar] [CrossRef]
- Zhu, H.Y.; Liu, J.B.; Jiang, L.; Xu, A.R. Type Selection Design and Structural Optimization of 66 kV Transmission Line Tower. In Proceedings of the 2019 Chinese Automation Congress (CAC), Hangzhou, China, 22–24 November 2019; pp. 5690–5694. [Google Scholar]
- Wang, Q.H.; Zhang, L.; Li, G.D.; Li, T.C.; Zang, H.; Hu, Y.; Liu, L.; Wang, Q.; Guo, Y.; Liu, X.; et al. Discussion on Differential Lightning Protection of Transmission Line. In Proceedings of the 2019 4th International Workshop on Materials Engineering and Computer Sciences (IWMECS 2019), Xi’an, China, 16–17 March 2019; pp. 498–504. [Google Scholar]
- Ma, D.; Peng, J.; Zhang, B.Y.; Ding, H.H.; Yang, S.Z.; Liu, Y.J. Risk Assessment of Tower Transmission Based on Insulator Online Monitoring. In Proceedings of the 2023 5th Asia Energy and Electrical Engineering Symposium (AEEES), Chengdu, China, 23–26 March 2023; pp. 384–389. [Google Scholar]
- Zhang, C.; Li, C.; Zhao, H.; Han, B. A review on the aging performance of direct current cross-linked polyethylene insulation materials. In Proceedings of the 2015 IEEE 11th International Conference on the Properties and Applications of Dielectric Materials (ICPADM), Sydney, NSW, Australia, 19–22 July 2015; pp. 700–703. [Google Scholar]
- Liu, Z.Y.; Miao, X.R.; Xie, Z.Q.; Jiang, H.; Chen, J. Power Tower Inspection Simultaneous Localization and Mapping: A Monocular Semantic Positioning Approach for UAV Transmission Tower Inspection. Sensors 2022, 22, 7360. [Google Scholar] [CrossRef]
- Peng, X.Y.; Liu, Z.J.; Mai, X.M.; Luo, Z.B.; Wang, K.; Xie, X.W. UAV electric power line safety inspection system and key technology. Remote Sens. Inf. 2015, 51–57. [Google Scholar] [CrossRef]
- Zhang, T.; Dai, J. Electric power intelligent inspection robot: A review. J. Phys. Conf. Ser. 2021, 1750, 012023. [Google Scholar] [CrossRef]
- Ye, B.; Song, X. Research on an intelligent electric inspection robot. J. Phys. Conf. Ser. 2021, 2005, 012100. [Google Scholar] [CrossRef]
- Lekidis, A.; Anastasiadis, A.G.; Vokas, G.A. Electricity infrastructure inspection using AI and edge platform-based UAVs. Energy Rep. 2022, 8, 1394–1411. [Google Scholar] [CrossRef]
- He, T.; Zeng, Y.H.; Hu, Z.L. Research of Multi-Rotor UAVs Detailed Autonomous Inspection Technology of Transmission Lines Based on Route Planning. IEEE ACCESS 2019, 7, 114955–114965. [Google Scholar] [CrossRef]
- Xie, X.W.; Liu, Z.J.; Xu, C.J.; Zhang, Y.Z. A Multiple Sensors Platform Method for Power Line Inspection Based on a Large Unmanned Helicopter. Sensors 2017, 17, 1222. [Google Scholar] [CrossRef]
- Wang, Z.; Gao, Q.; Xu, J.; Li, D. A review of UAV power line inspection. In Advances in Guidance, Navigation and Control; Springer: Singapore, 2020; pp. 3147–3159. [Google Scholar]
- Guan, H.; Sun, X.; Su, Y.; Hu, T.; Wang, H.; Wang, H.; Peng, C.; Guo, Q. UAV-lidar aids automatic intelligent powerline inspection. Int. J. Electr. Power Energy Syst. 2021, 130, 106987. [Google Scholar] [CrossRef]
- Chang, A.X.; Funkhouser, T.; Guibas, L.; Hanrahan, P.; Huang, Q.; Li, Z.; Savarese, S.; Savva, M.; Song, S.; Su, H. Shapenet: An information-rich 3d model repository. arXiv 2015, arXiv:1512.03012. [Google Scholar]
- Zhang, Y.; Shi, Z.; Zhuang, C. Instance Segmentation of Low-texture Industrial Parts Based on Deep Learning. In Proceedings of the 2021 IEEE International Conference on Mechatronics and Automation (ICMA), Takamatsu, Japan, 8–11 August 2021; pp. 756–761. [Google Scholar]
- Hassan, R.; Fraz, M.M.; Rajput, A.; Shahzad, M. Residual learning with annularly convolutional neural networks for classification and segmentation of 3D point clouds. Neurocomputing 2023, 526, 96–108. [Google Scholar] [CrossRef]
- Gurses, Y.; Taspinar, M.; Yurt, M.; Ozer, S. GRJointNET: Synergistic Completion and Part Segmentation on 3D Incomplete Point Clouds. In Proceedings of the 2021 29th Signal Processing and Communications Applications Conference (SIU), Istanbul, Turkey, 9–11 June 2021. [Google Scholar]
- He, Y.; Yu, H.; Liu, X.; Yang, Z.; Sun, W.; Wang, Y.; Fu, Q.; Zou, Y.; Mian, A. Deep learning based 3D segmentation: A survey. arXiv 2021, arXiv:2103.05423. [Google Scholar]
- Guo, Y.L.; Wang, H.Y.; Hu, Q.Y.; Liu, H.; Liu, L.; Bennamoun, M. Deep Learning for 3D Point Clouds: A Survey. IEEE Trans. Pattern Anal. Mach. Intell. 2021, 43, 4338–4364. [Google Scholar] [CrossRef]
- Hara, K.; Kataoka, H.; Satoh, Y. Can spatiotemporal 3D CNNs retrace the history of 2D CNNs and ImageNet? In Proceedings of the 2018 IEEE/CVF Conference on Computer Vision and Pattern Recognition, Salt Lake City, UT, USA, 18–23 June 2018; pp. 6546–6555. [Google Scholar]
- Wu, B.C.; Wan, A.; Yue, X.Y.; Keutzer, K. SqueezeSeg: Convolutional Neural Nets with Recurrent CRF for Real-Time Road-Object Segmentation from 3D LiDAR Point Cloud. In Proceedings of the 2018 IEEE International Conference on Robotics and Automation (ICRA), Brisbane, QLD, Australia, 21–25 May 2018; pp. 1887–1893. [Google Scholar]
- Iandola, F.N.; Han, S.; Moskewicz, M.W.; Ashraf, K.; Dally, W.J.; Keutzer, K. SqueezeNet: AlexNet-level accuracy with 50× fewer parameters and<0.5 MB model size. arXiv 2016, arXiv:1602.07360. [Google Scholar]
- Sutton, C.; McCallum, A. An introduction to conditional random fields. Found. Trends® Mach. Learn. 2012, 4, 267–373. [Google Scholar] [CrossRef]
- Liu, F.Y.; Li, S.P.; Zhang, L.Q.; Zhou, C.H.; Ye, R.T.; Wang, Y.B.; Lu, J.W. 3DCNN-DQN-RNN: A Deep Reinforcement Learning Framework for Semantic Parsing of Large-scale 3D Point Clouds. In Proceedings of the 2017 IEEE International Conference on Computer Vision (ICCV), Venice, Italy, 22–29 October 2017; pp. 5679–5688. [Google Scholar]
- Kruse, R.; Mostaghim, S.; Borgelt, C.; Braune, C.; Steinbrecher, M. Multi-layer perceptrons. In Computational Intelligence: A Methodological Introduction; Springer: Berlin/Heidelberg, Germany, 2022; pp. 53–124. [Google Scholar]
- Qi, C.R.; Su, H.; Mo, K.; Guibas, L.J. Pointnet: Deep learning on point sets for 3D classification and segmentation. In Proceedings of the 2017 IEEE Conference on Computer Vision and Pattern Recognition (CVPR), Honolulu, HI, USA, 21–26 July 2017; pp. 652–660. [Google Scholar]
- Qi, C.R.; Yi, L.; Su, H.; Guibas, L.J. Pointnet++: Deep hierarchical feature learning on point sets in a metric space. Adv. Neural Inf. Process. Syst. 2017, 30, 5105–5114. [Google Scholar]
- Zhao, H.; Jiang, L.; Jia, J.; Torr, P.H.; Koltun, V. Point transformer. In Proceedings of the 2021 IEEE/CVF International Conference on Computer Vision Workshops (ICCVW), Montreal, BC, Canada, 11–17 October 2021; pp. 16259–16268. [Google Scholar]
- Wu, X.; Lao, Y.; Jiang, L.; Liu, X.; Zhao, H. Point transformer v2: Grouped vector attention and partition-based pooling. Adv. Neural Inf. Process. Syst. 2022, 35, 33330–33342. [Google Scholar]
- Guo, M.-H.; Cai, J.-X.; Liu, Z.-N.; Mu, T.-J.; Martin, R.R.; Hu, S.-M. Pct: Point cloud transformer. Comput. Vis. Media 2021, 7, 187–199. [Google Scholar] [CrossRef]
- Engel, N.; Belagiannis, V.; Dietmayer, K. Point transformer. IEEE Access 2021, 9, 134826–134840. [Google Scholar] [CrossRef]
- Vaswani, A.; Shazeer, N.; Parmar, N.; Uszkoreit, J.; Jones, L.; Gomez, A.N.; Kaiser, Ł.; Polosukhin, I. Attention is all you need. Adv. Neural Inf. Process. Syst. 2017, 30, 5998–6008. [Google Scholar]
- Wang, Y.; Sun, Y.; Liu, Z.; Sarma, S.E.; Bronstein, M.M.; Solomon, J.M. Dynamic graph cnn for learning on point clouds. ACM Trans. Graph. 2019, 38, 146. [Google Scholar] [CrossRef]
- Zhu, J.; Yao, G.; Zhang, G. Survey of few shot learning of deep neural network. Comput. Eng. 2021, 57, 22–33. [Google Scholar]
- Hu, Y.M.; Liu, Y. Improved PointNet++-based insulator segmentation method for power tower insulators. Chang. Inf. Commun. 2022, 35, 180–184. [Google Scholar]
- Lin, Z.; Feng, M.; Santos, C.N.d.; Yu, M.; Xiang, B.; Zhou, B.; Bengio, Y. A structured self-attentive sentence embedding. arXiv 2017, arXiv:1703.03130. [Google Scholar]
- Huang, Z.; Gu, X.; Wang, H.X.; Zhang, X.W.; Zhang, X. Semantic Segmentation Model of Transmission Tower Point Cloud Based on Improved PointNet++. China Electr. Power 2023, 56, 77–85. [Google Scholar]
- Thomas, H.; Qi, C.R.; Deschaud, J.-E.; Marcotegui, B.; Goulette, F.; Guibas, L.J. Kpconv: Flexible and deformable convolution for point clouds. In Proceedings of the 2019 IEEE/CVF International Conference on Computer Vision (ICCV), Seoul, Republic of Korea, 27 October–2 November 2019; pp. 6411–6420. [Google Scholar]
- Schnabel, R.; Klein, R. Octree-based Point-Cloud Compression. PBG@ SIGGRAPH 2006, 3, 111–121. [Google Scholar]
- Yu, R.; Wei, X.; Tombari, F.; Sun, J. Deep positional and relational feature learning for rotation-invariant point cloud analysis. In Proceedings of the Computer Vision–ECCV 2020: 16th European Conference, Glasgow, UK, 23–28 August 2020; pp. 217–233. [Google Scholar]
- Bello, S.A.; Wang, C.; Sun, X.T.; Deng, H.W.; Adam, J.M.; Bhatti, M.K.A.; Wambugu, N.M. PDConv: Rigid transformation invariant convolution for 3D point clouds. Expert Syst. Appl. 2022, 210, 118356. [Google Scholar] [CrossRef]
- Shafiq, M.; Gu, Z.Q. Deep Residual Learning for Image Recognition: A Survey. Appl. Sci. 2022, 12, 8972. [Google Scholar] [CrossRef]
- He, K.; Zhang, X.; Ren, S.; Sun, J. Deep residual learning for image recognition. In Proceedings of the 2016 IEEE Conference on Computer Vision and Pattern Recognition (CVPR), Las Vegas, NV, USA, 27–30 June 2016; pp. 770–778. [Google Scholar]
- Garcia-Garcia, A.; Orts-Escolano, S.; Oprea, S.; Villena-Martinez, V.; Garcia-Rodriguez, J. A review on deep learning techniques applied to semantic segmentation. arXiv 2017, arXiv:1704.06857. [Google Scholar]
- Loshchilov, I.; Hutter, F. Decoupled weight decay regularization. arXiv 2017, arXiv:1711.05101. [Google Scholar]
- Ma, X.; Qin, C.; You, H.; Ran, H.; Fu, Y. Rethinking network design and local geometry in point cloud: A simple residual MLP framework. arXiv 2022, arXiv:2202.07123. [Google Scholar]
Disclaimer/Publisher’s Note: The statements, opinions and data contained in all publications are solely those of the individual author(s) and contributor(s) and not of MDPI and/or the editor(s). MDPI and/or the editor(s) disclaim responsibility for any injury to people or property resulting from any ideas, methods, instructions or products referred to in the content. |
© 2024 by the authors. Licensee MDPI, Basel, Switzerland. This article is an open access article distributed under the terms and conditions of the Creative Commons Attribution (CC BY) license (https://creativecommons.org/licenses/by/4.0/).