Article

Double Augmentation: A Modal Transforming Method for Ship Detection in Remote Sensing Imagery

Key Laboratory of Target Cognition and Application Technology, Aerospace Information Research Institute, Chinese Academy of Sciences, Beijing 100190, China
*
Author to whom correspondence should be addressed.
Remote Sens. 2024, 16(3), 600; https://doi.org/10.3390/rs16030600
Submission received: 2 January 2024 / Revised: 29 January 2024 / Accepted: 2 February 2024 / Published: 5 February 2024

Abstract

:
Ship detection in remote sensing images plays an important role in maritime surveillance. Recently, convolution neural network (CNN)-based methods have achieved state-of-the-art performance in ship detection. Even so, there are still two problems that remain in remote sensing. One is that the different modal images observed by multiple satellite sensors and the existing dataset cannot satisfy network-training requirements. The other is the false alarms in detection, as the ship target is usually faint in real view remote sensing images and many false-alarm targets can be detected in ocean backgrounds. To solve these issues, we propose a double augmentation framework for ship detection in cross-modal remote sensing imagery. Our method can be divided into two main steps: the front augmentation in the training process and the back augmentation verification in the detection process; the front augmentation uses a modal recognition network to reduce the modal difference in training and in using the detection network. The back augmentation verification uses batch augmentation and results clustering to reduce the rate of false-alarm detections and improve detection accuracy. Real-satellite-sensing experiments have been conducted to demonstrate the effectiveness of our method, which shows promising performance in quantitative evaluation metrics.

1. Introduction

Achievement of the capability to automatically detect sailing ships would allow a wide range of applications in marine and commercial fields [1]. Remote sensing has a wide view with high resolution, which plays an irreplaceable role in ocean surveillance [2], especially when the target’s Automatic Identification System (AIS) is disabled.
Currently, a large number of remote sensing satellites are launched to perform earth observation, including WorldView, QuickBird, SPOT, Landsat, IKONOS, and GaoFen satellites, which provides a convenient and effective approach for maritime surveillance [3,4]. Satellites can obtain different kinds of images in entirely different modalities, such as multi-spectral (color) images, synthetic aperture radar (SAR) images and panchromatic (PAN) images. These images have different spectral resolutions, spatial resolutions and image properties, and their datasets are also incompatible [5,6,7].
For ship detection, there are several datasets for multi-spectral images and SAR images; however, there are much fewer data for PAN images. PAN images have low spectral resolution but high spatial resolution, and they are more susceptible to image noise. Recently, convolution neural network (CNN)-based methods have achieved state-of-the-art performance in ship detection. However, there are still two problems remaining for ship detection in remote sensing images. One is that different modal images are observed by multiple satellite sensors and the existing datasets cannot satisfy the network-training requirements for all modalities. The other is false alarms in detection; the ship target (especially if it is a fishing boat) is usually faint in a real view remote sensing image, which has a small region, and clouds, islands, wakes and noise points can easily cause false alarms in ocean backgrounds, especially with high spatial resolution.
To solve these problems, this study proposes a double augmentation framework for ship detection in cross-modal remote sensing imagery. The proposed method can be divided into two main steps: front augmentation in the training process and back augmentation verification in the detection process. The front augmentation acquires a transformation relation for training that uses a modal recognition network to reduce the modal difference in training and when using a detection network. After achieving a detection network, the back augmentation verification uses batch augmentation and results clustering to reduce the false-alarm rate and improve the detection accuracy. Real-satellite-sensing experiments have been conducted to demonstrate the effectiveness of our method. The experimental results show that the proposed method can generate the closest result to the ground truth, despite the huge differences between the multi-spectral (color) image in training and the panchromatic (PAN) image in testing.
The contributions of this study can be summarized as follows.
  • The proposed method achieves effective modal transforming and generalization of detection, the method only needs little images from a target domain and no labeled images are required. This makes it convenient to use the existing dataset in training.
  • The proposed method is run in a transparent way without changing the network, no matter what kind of backbone network is used. So, an open-source light-weight model can be easily used, which significantly reduces the requirements and difficulty of training and deployment, making it suitable for running in edge node.
  • The proposed method can effectively reduce the false-alarm rate in detection and improve the confidence of detection.
The remainder of this paper is organized as follows. Section 2 introduces the existing work related to ship detection in remote sensing. Section 3 describes the proposed research methodology. Section 4 describes the experiments and results, including the experimental conditions, dataset introduction, performance comparison experiment, ablation study and limitations. Finally, conclusions and future work are discussed in Section 5.

2. Related Works

Related works on ship detection in remote sensing are introduced as follows.
The object detection task is used to find the interesting object in images by using a specific algorithm, and to calibrate the position and size of the object by using a rectangular boundary box. Most of the early target-detection methods use manually designed feature to distinguish targets; the traditional ship detection method extracts the difference of the image information between the ship target and the background through image processing methods, so as to separate the ship target. Typical methods include the following: detection based on gray features and texture features; detection based on gradient and edge contour features and detection methods based on visual significance [8]. However, with the improved spatial resolution of remote sensing images, the observed target information is richer and more complex background information is acquired. Traditional methods are often simple in design and used in simple application scenarios, which causes a huge challenge for ship detection in complex backgrounds.
With the rapid development of deep learning, deep neural networks transform original input information into higher-dimensional and more abstract features with excellent spatial and semantic expression capabilities, which greatly improves the results of target detection. On this basis, remote sensing detection technology based on deep neural network have also begun to develop rapidly. Detection algorithms based on deep learning can generally be divided into two-stage detection algorithms based on candidate regions and single-stage detection algorithms based on regression according to whether regions of interest need to be extracted. In the first stage of two-stage detection, the candidate region method is used to create the region of interest for target detection. In the second stage of detection, the convolutional neural network is used to classify the target of the candidate region and select the target prediction box. Two-stage detection algorithms generally have high detection accuracy but slow detection speed, which are typically represented by R-CNN (Region Convolutional Neural Networks) series algorithms such as R-CNN [9], SPP-net [10], Fast R-CNN [11], R-FCN [12], Faster R-CNN [13] and Mask R-CNN [14].
The one-stage detection algorithm does not need to generate candidate regions and directly predicts the class probability and location information of the target, and the detection speed is much higher than that of the two-stage detection algorithm. Typical representatives of one-stage detection algorithms are YOLOv3 [15], YOLOv4 [16], YOLOv5 [17], SSD [18] and RetinaNet [19].
The classical CNN-based target-detection algorithm has achieved good results on natural image data sets, but in remote sensing images the background is often complex and the scale of the ship target changes greatly, so the classical target-detection algorithm sometimes cannot effectively extract the ship features. Al-saad et al. [20] proposed a method of frequency domain enhancement by embedding a wavelet transform into Faster R-CNN, and before extracting ROI the original image was decomposed into high and low frequency components for training and testing in the frequency domain, thus improving the detection accuracy. This method is simple and easy, but the accuracy is not high. Li et al. [21] proposed a Hierarchical Selective Filtering (HSF) layer to improve Faster R-CNN. Multi-scale ship features are generated using a hierarchical convolution operation, and different sizes of nearshore and offshore ships are detected effectively. Jiao et al. [22] proposed a densely connected multi-scale neural network based on the Faster-R-CNN framework. This network draws on the DenseNet’s idea of dense connections between layers. Each layer accepts the feature maps of all previous layers as additional inputs and splices the feature maps from different layers to maintain the integrity of the feature information at the lower layers. Tian et al. [23] designed a dense-feature-extraction module, integrating low-level location information and high-level semantic information of different resolutions. The module was applied to the classical detection networks YOLO and Mask-R-CNN, and the detection accuracy of the improved network with both visible light image and SAR image data sets was improved. In recent years, researchers have applied a transformer [24] model, which has excellent performance in the field of natural processing, to the field of image processing, achieving good results by constructing global context dependency. Among them, DETR (Detection Transformer) [25], which transforms target detection into unordered set prediction, overcomes the anchor frame mechanism of the prior design of the CNN model and the post-processing non-maximum suppression (NMS) process of manual design and expands the range of the effective receptive field. However, since the self-attention mechanism of the ViT model is to model image context, it brings higher memory and computational cost than CNN model.
In order to solve the problem of the scarcity of small-ship samples in remote sensing image data sets, Shin et al. [26] proposed a “cut and paste” strategy to enhance images for training models in which pre-trained Mask-R-CNN is used to extract ship slices and paste them into various background ocean scenes to synthesize new images. The detection results verify the effectiveness of the synthesized ship image. Hu et al. [27] proposed a hybrid strategy that mixes the sea surface target area with multiple changing scenarios to increase both diversity and the number of training samples. Chen et al. [28] proposed a gaussian hybrid Wasserstein GAN using gradient punishment to generate a small-ship target sample with sufficient information. CNNs are then trained using raw and generated data to achieve accurate real-time detection of small ships. In order to solve the problem that small targets disappear in deep-feature mapping, a common method is to make full use of the information in shallow-feature mapping to detect small targets. HyperNet, proposed by Kong et al. [29], utilizes layer-hopping feature extraction to obtain both high-level features containing semantic information and shallow features containing high-resolution location information, and uses shallow features to improve detection performance for small targets. Recently, some rotating-ship-detection methods have also been proposed to meet the high requirements for ship-orientation detection. A directional R-CNN network is designed specifically for rotating-target detection, which considers the speed requirements while retaining the strong detection accuracy advantage of the two-stage target detection network [30]. Zhu et al. [31] proposed an Automatic Organized Points Detector (AOPDet), which derives precise localization results by applying a novel rotating-object representation, and an Automatic Organization Mechanism (AOM) technique is designed to guide the model to automatically organize points to object corners. Generally, the precision of rotating-object detectors is still less than that of horizontal-object detectors, especially for small targets.
In summary, most of the presented algorithms and datasets focus on ship detection in color images or SAR images, and they have limited generalization ability and are less precise when detecting small ships. To solve the problem of ship detection in PAN images with barely any positive samples, this study proposes a modal transforming method that uses cross-modal images to achieve high-precision detection.

3. Research Methodology

In this section, we describe the proposed modal transforming method, namely double augmentation using cross-modal images for ship detection in remote sensing imagery. First, we present the overview structure based on the CNNs. Then, we give detailed depictions of the key parts of our approach with some implementation details from our real applications.

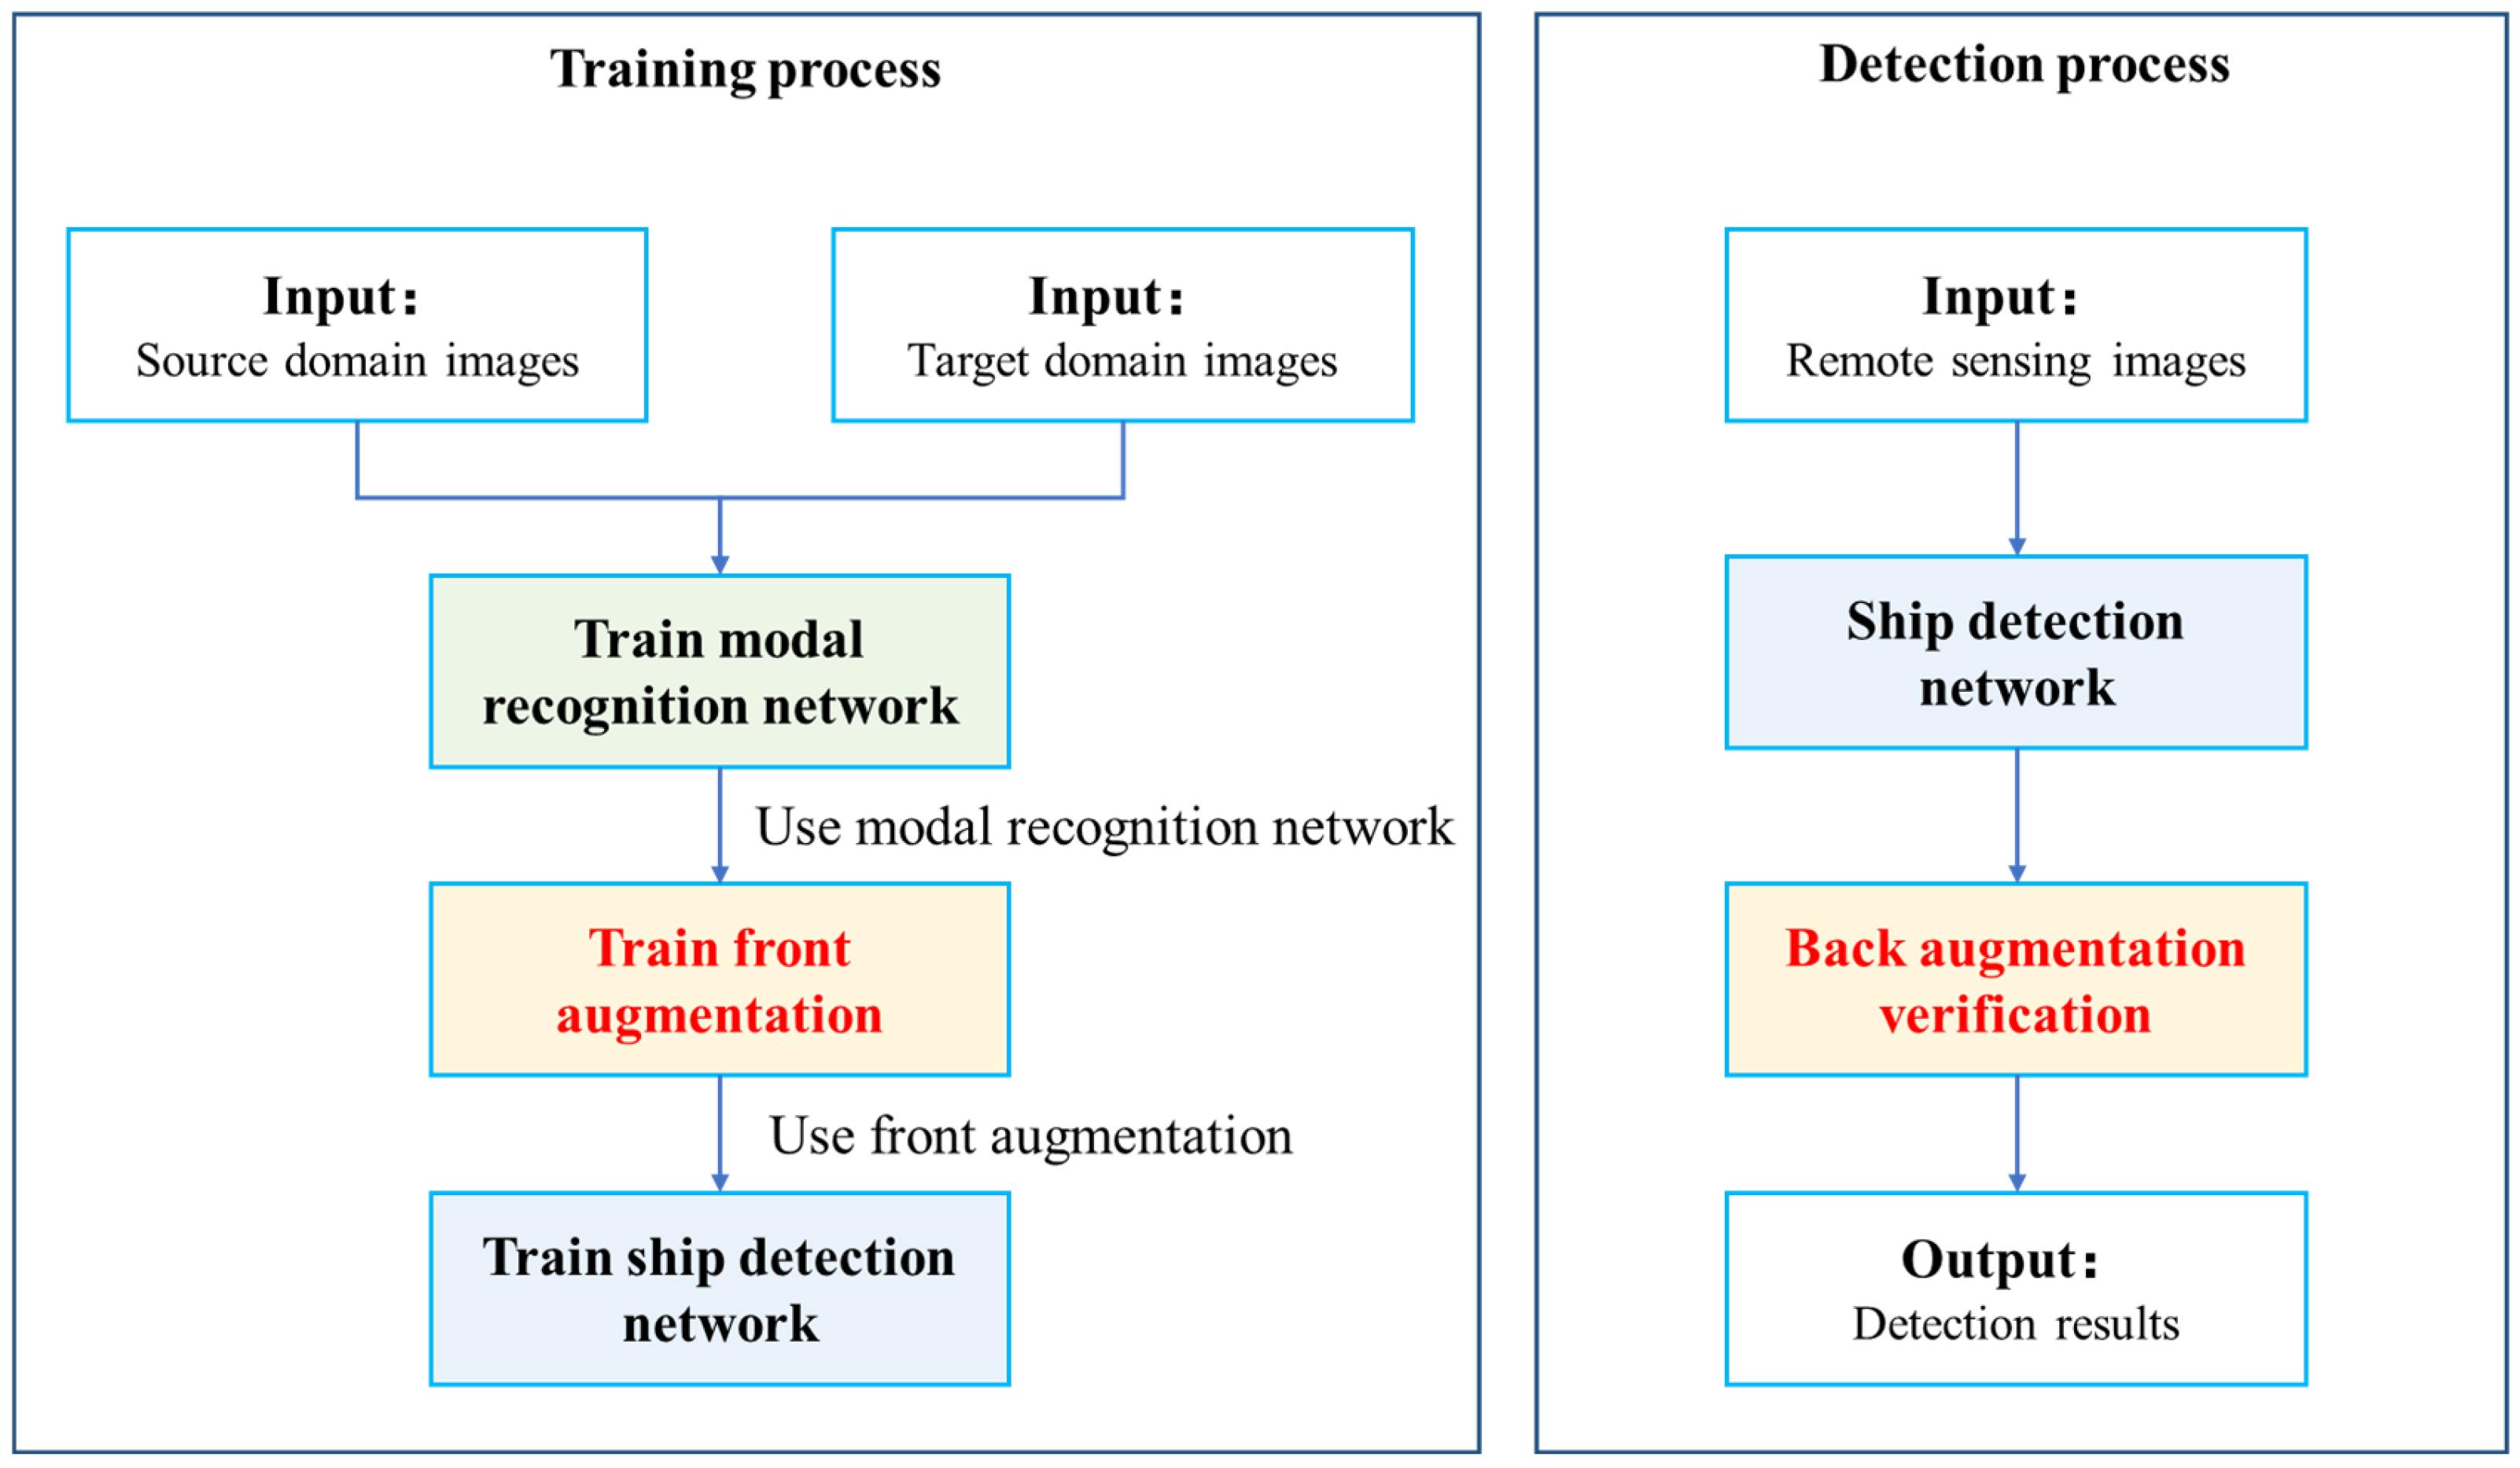
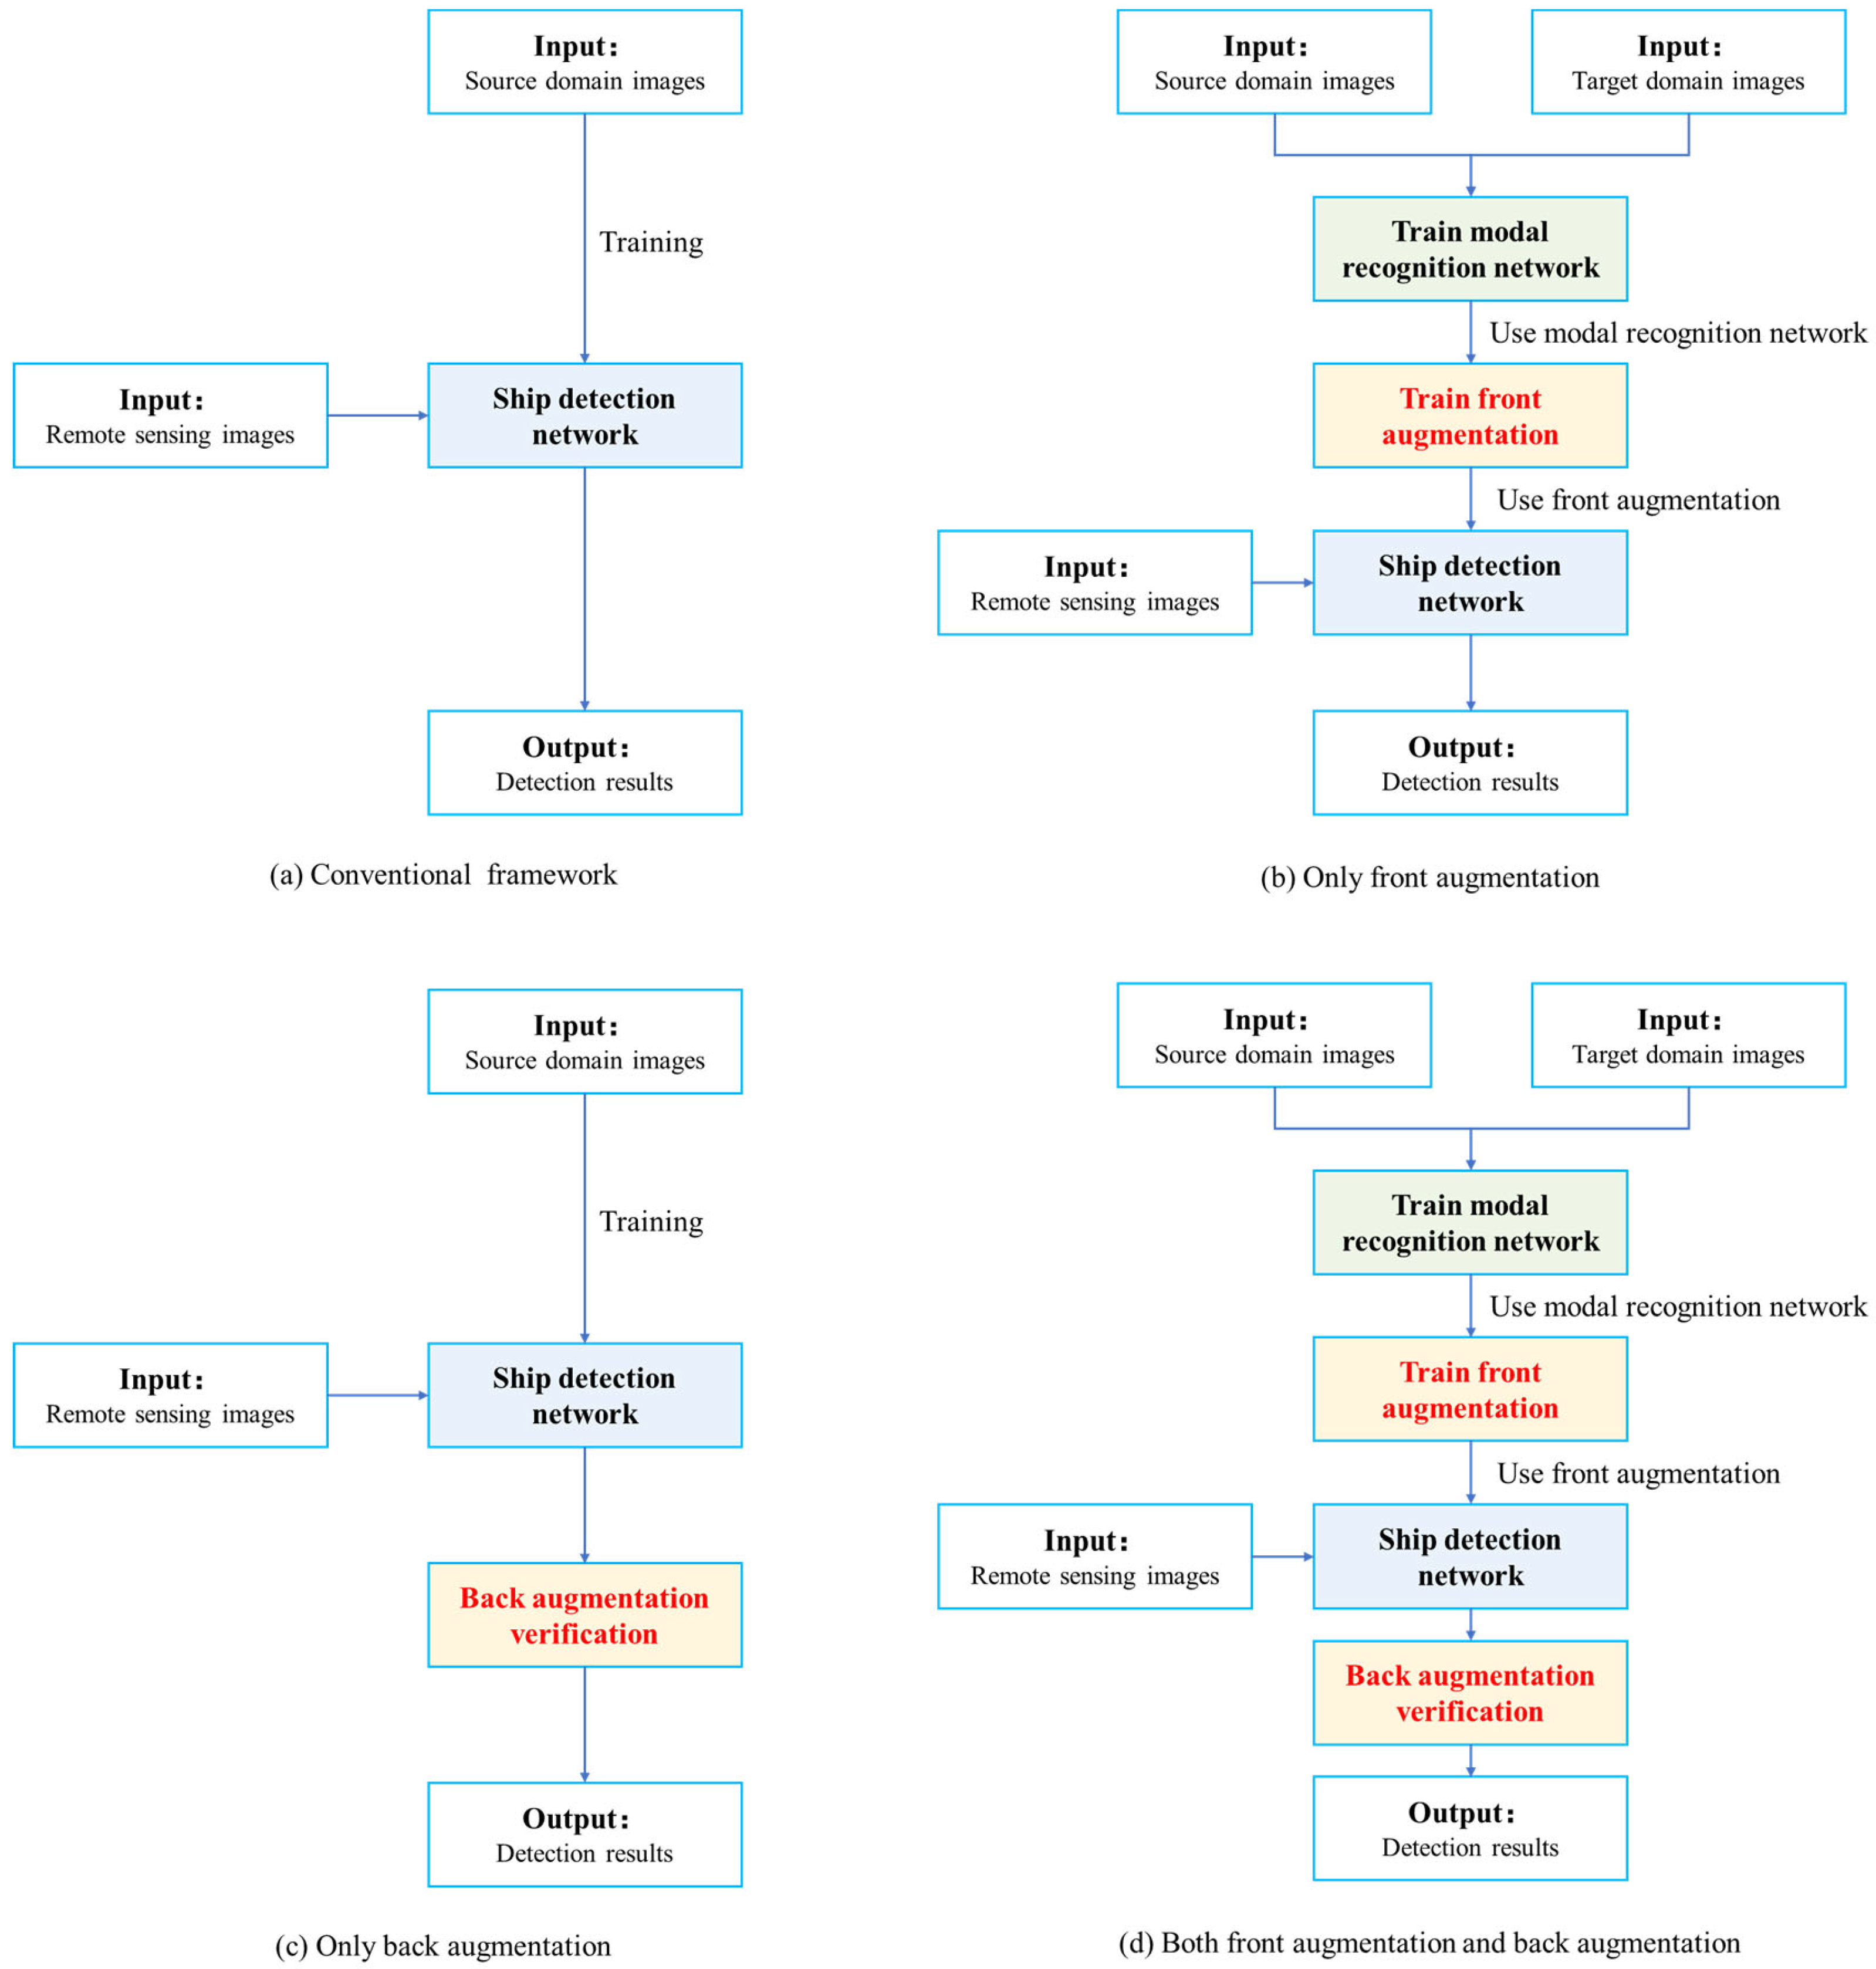
3.1. Overview of the Framework

As mentioned, for ship detection from remote sensing images there exist two main problems: one is the false-alarm rate, as the ship target (especially if it is a fishing boat) has a small region in a real view remote sensing image, and clouds, islands, wakes and noise points can easily cause false alarms, which makes accurate detection more difficult. The other problem is the various kinds of satellite payloads, and different payloads have different kinds of image distribution, which causes less labeled data to be available for training and also difficulty in network generalization.
We are aiming to meet the following requirements of real applications:
  • A large color-image dataset for training the ship detection network given the barely available PAN datasets for ship detection;
  • The modal difference between images causes great performance deterioration;
  • Deployment for edge nodes needs a light-weight model.
Hence, we propose a modal transforming method for ship detection in remote sensing imagery. As illustrated in Figure 1, the general process of our method can be divided into two main steps: the training process and the detection process. The proposed method is run in a transparent way, no matter what kind of backbone network is used. The additional input target domain images in our method can be all negative samples, as the target information is unnecessary and there is no need to label the image for training.

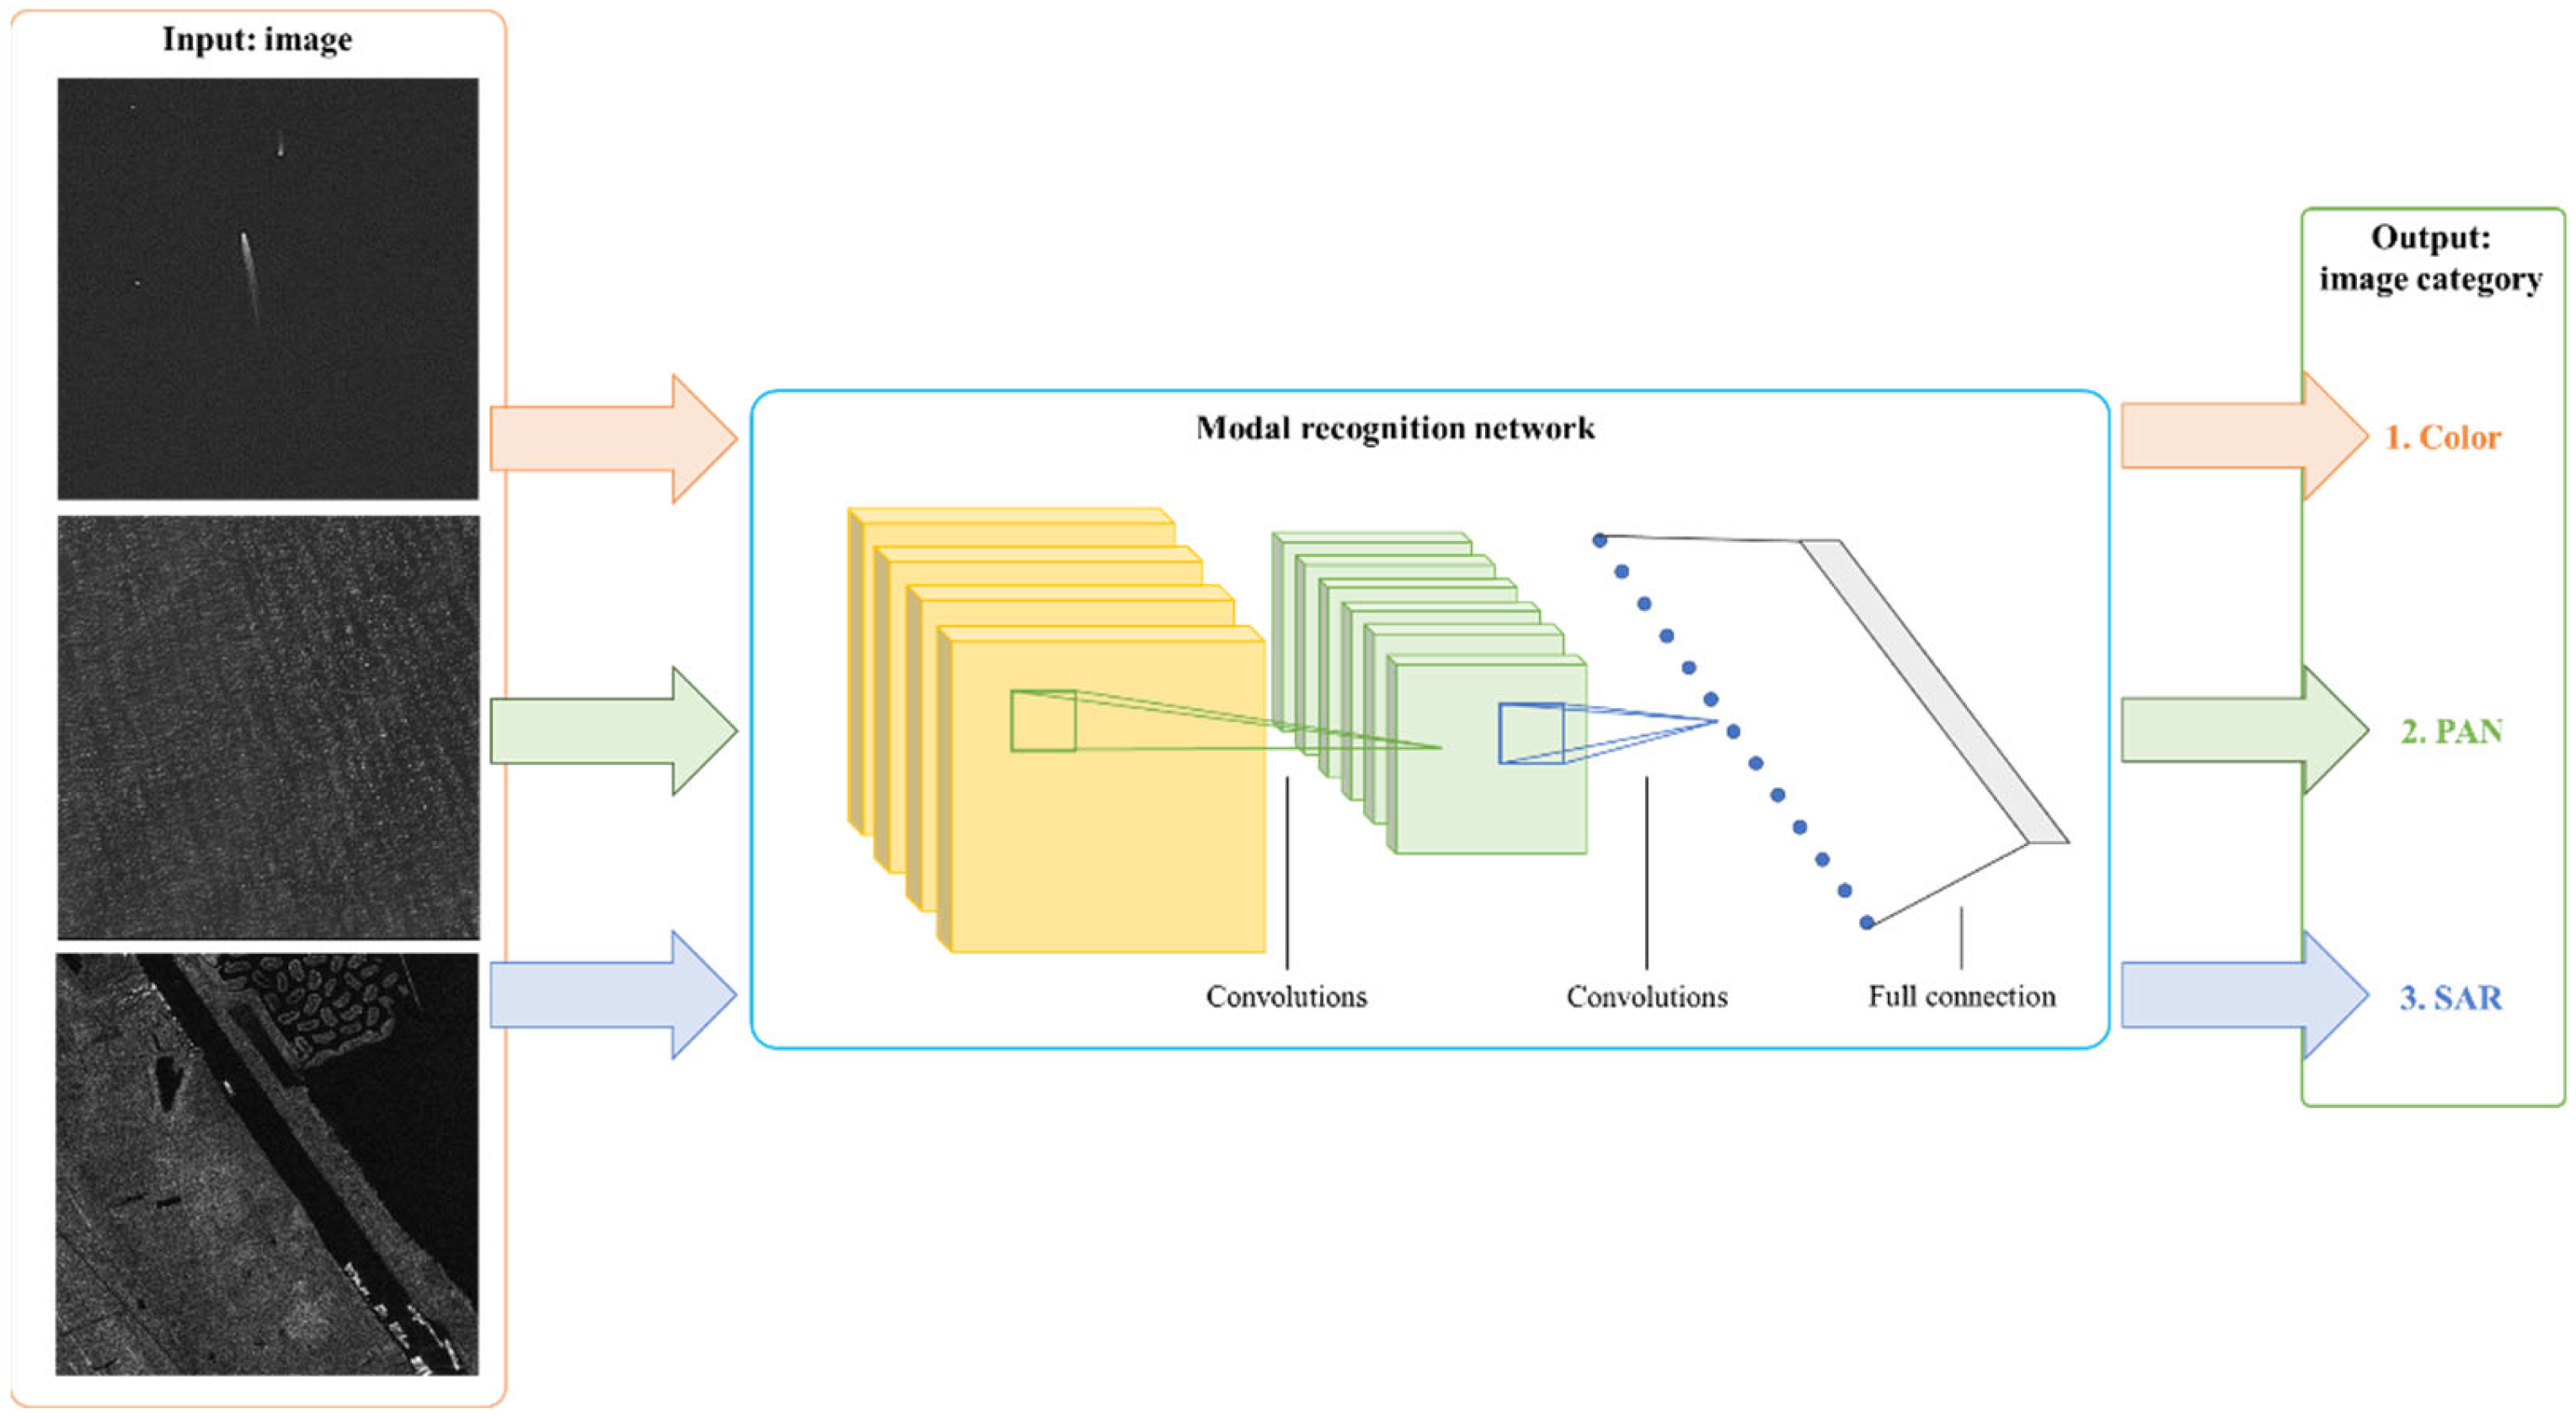
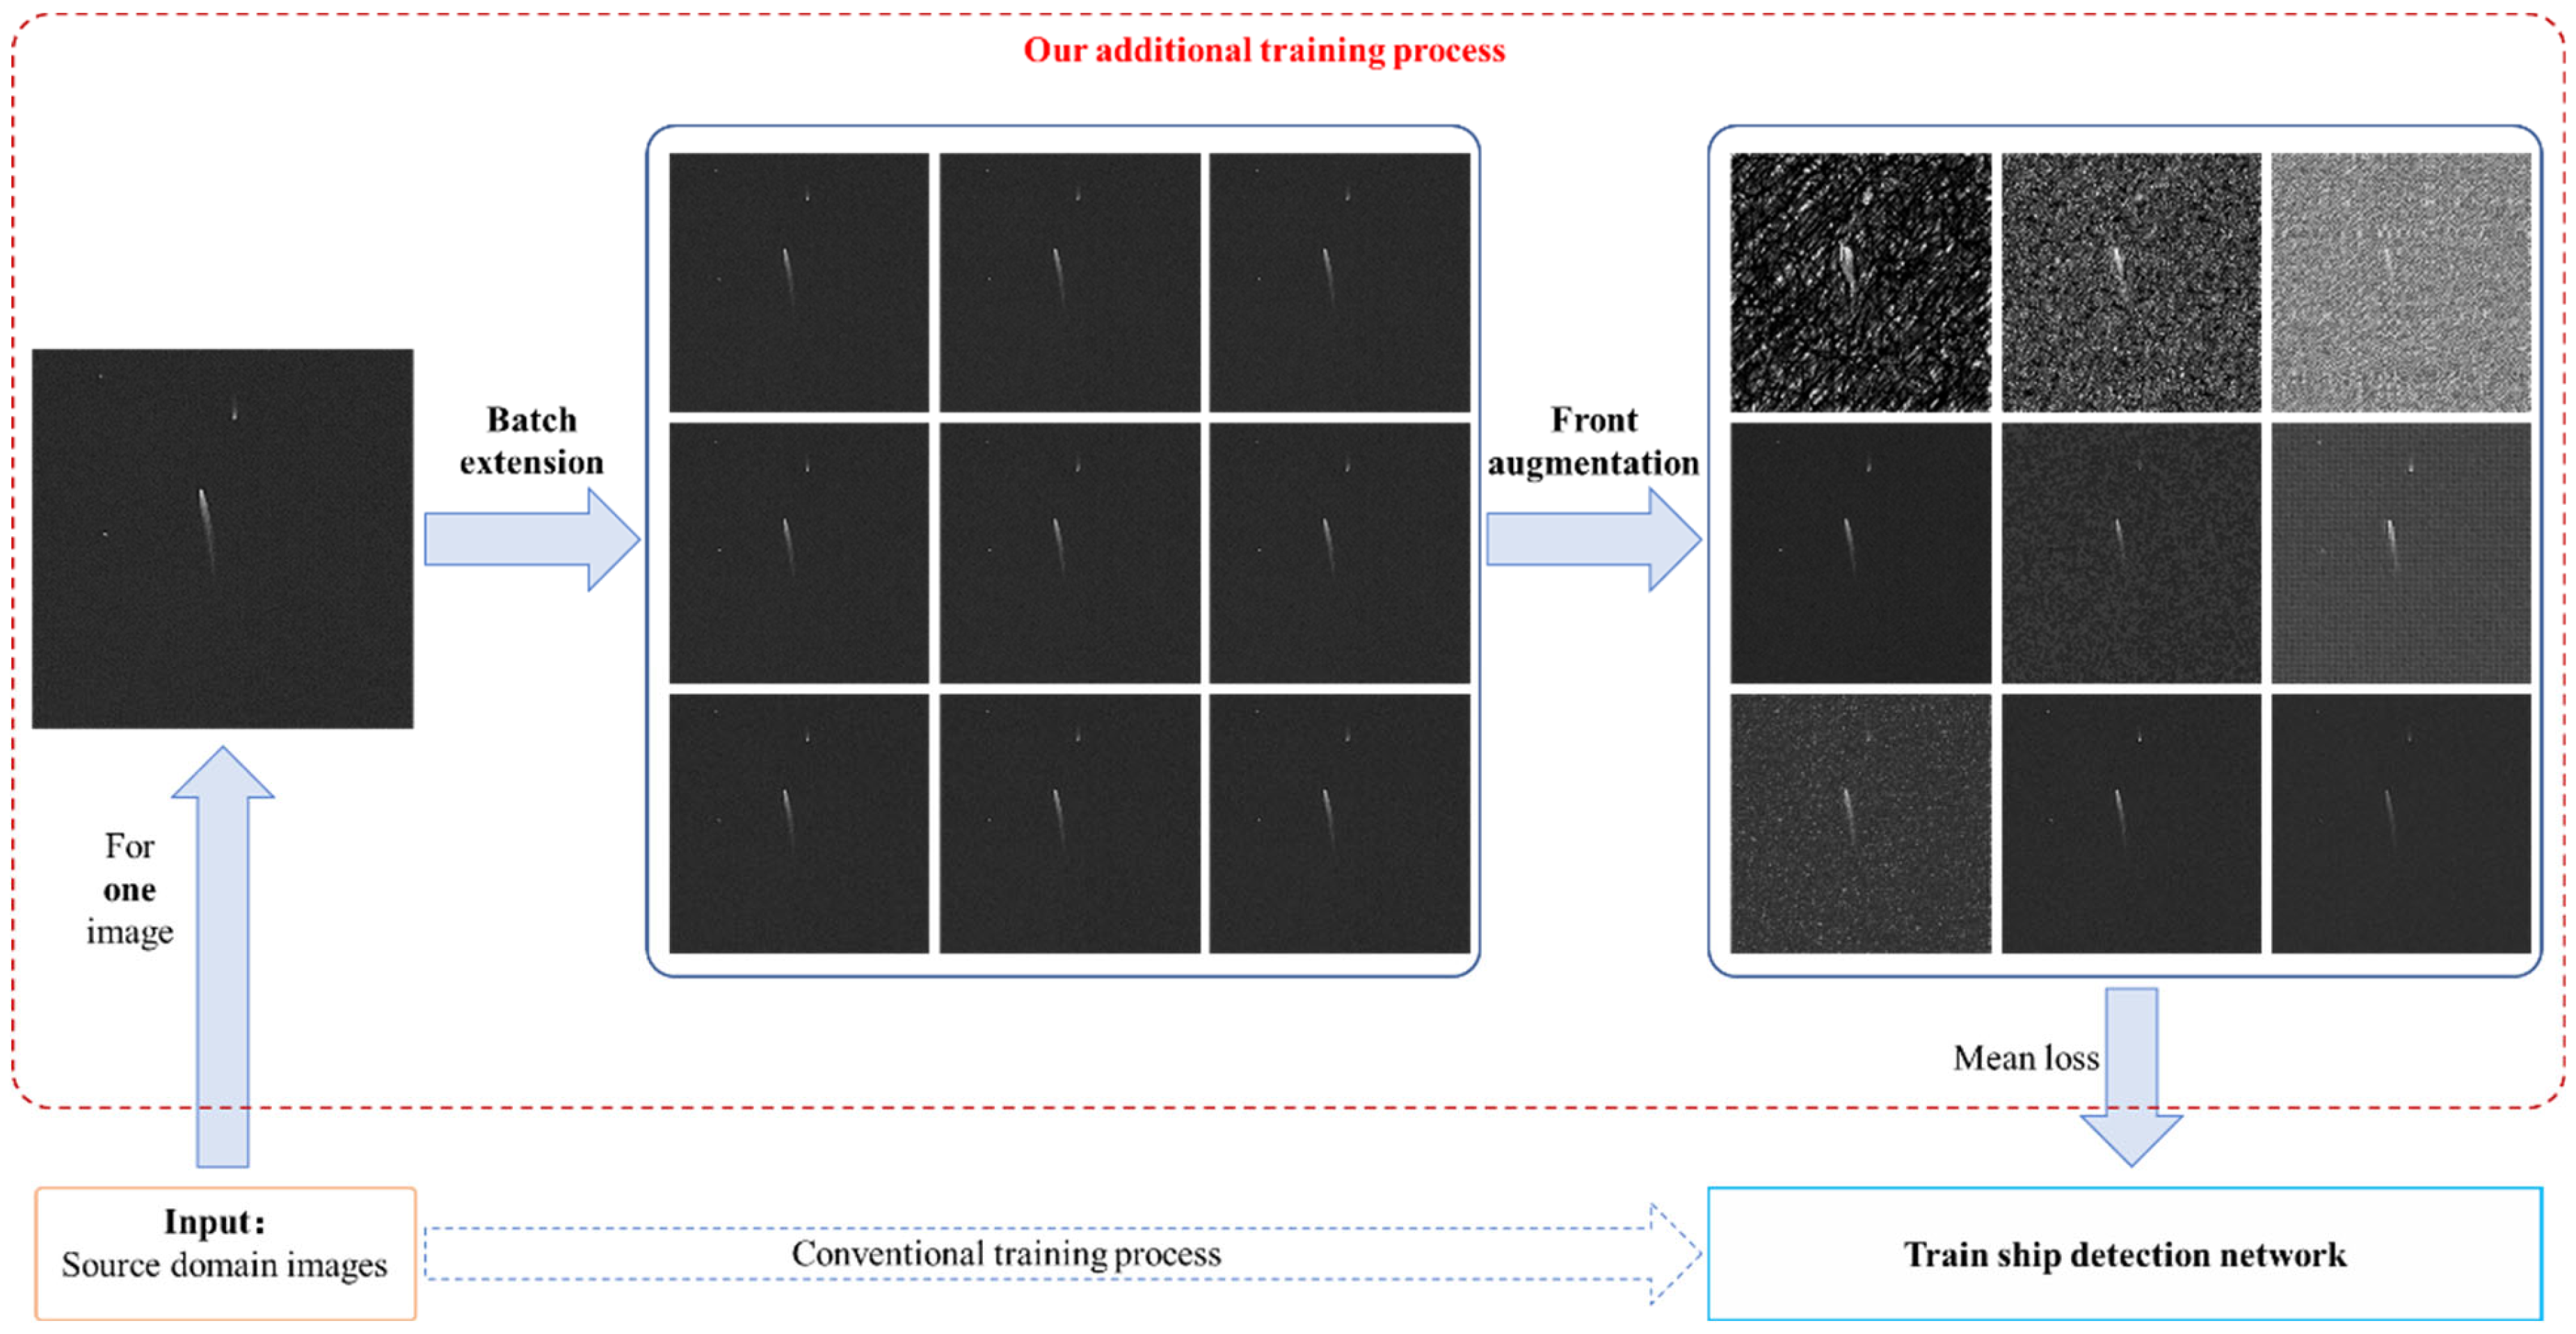
3.2. Training Process

Generally, the training process is to construct a transformation relation from the source domain to the target domain, and to use the transformation relation as image augmentation to train a ship detection network. Specifically, the following steps are performed.
Step 1: 
train the modal recognition network
We first train a modal recognition network to distinguish different kind of images; a conventional image-classification network like ResNet-101 [32] can be used to achieve this goal. Here, the training data consist of different classes of images, including training images that do not need to contain the detection targets (ship in our case), and we note that the category of image is identified in the configuration file of remote sensing data. This step is used to learn the potential features of different kinds of images, for example, color images, SAR images and PAN images. Then we can use these potential features to train the transformation relation to reduce the significant differences between different modalities. An illustration of the modal recognition network is shown in Figure 2. Here, the input images should have the same number of channels, since both the SAR image and PAN image are single channel, and we first perform color image to gray processing for color images.
Step 2: 
train the front augmentation process
After training the modal recognition network, we next train the front augmentation process to achieve the transformation relation from the source domain to the target domain. The aim of the front augmentation process is to find a reasonable way to generate different kinds of target domain images using source domain images as input to reduce the modal differences when further training the detection network. In order to obtain the augmentation operation with explicit physical meaning, we use a combination of pixel-level and spatial-level image augmentation transforms, and the basic transforms are chosen as follow: contrast limited adaptive histogram equalization, cutout, gaussian noise, gaussian blur, image compression and random gamma correction. We encode these transform parameters and use heuristic algorithms like particle swarm optimization to obtain the front augmentation process, and the objective function is the absolute error between soft prediction of the modal recognition network and the one-hot encoding for the target domain. An illustration of front augmentation training is shown in Figure 3. Here, Θ = [ θ 1 , , θ 6 ] are the transform parameter set, for example, θ 1 = [ θ 1 , 1 , θ 1 , 2 , θ 1 , 3 ] is the transform parameter for contrast limited adaptive histogram equalization, θ 1 , 1 represents the upper threshold value for contrast limiting and [ θ 1 , 2 , θ 1 , 3 ] represents the size of grid for histogram equalization. After obtaining optimized Θ , we can ignore these parameters with small values to further simplify the operations of front augmentation.
Here, we note that the front augmentation is different from the image augmentation used in training, and image augmentation is also used in further training to improve the generalization of the network.
Step 3: 
train the ship detection network
Now we can use additional front augmentation after image input to train the ship detection network; here, the ship detection network can be any kind of structure, such as YOLOv5, YOLOv8 or Mask-R-CNN. The train loss is the mean loss L o s s M for a certain number of augmentations for one input image:
L o s s M = i L o s s i / n
where L o s s i is the detection loss for one independent augmentation of the same input image and n is the number of augmentations. Using Equation (1), the network can have high average precision in the augmentations.
The training process is shown in Figure 4. The additional training process shown is aimed at obtaining a detection network that has the following characteristics: the network is more likely to detect correct targets when augmentation or noise is added to the original image, which is the basic idea behind our further performance of back augmentation verification.
Now that we have completed the front augmentation for training, we note that the front augmentation is used to achieve data transforming from other modalities, which reduces the modal differences in training and when using a detection network (in this paper, we mainly focus on the transformation from color images to PAN images). We aiming at using a large color-image dataset for training ship detection network the barely available PAN datasets for ship detection in PAN images.

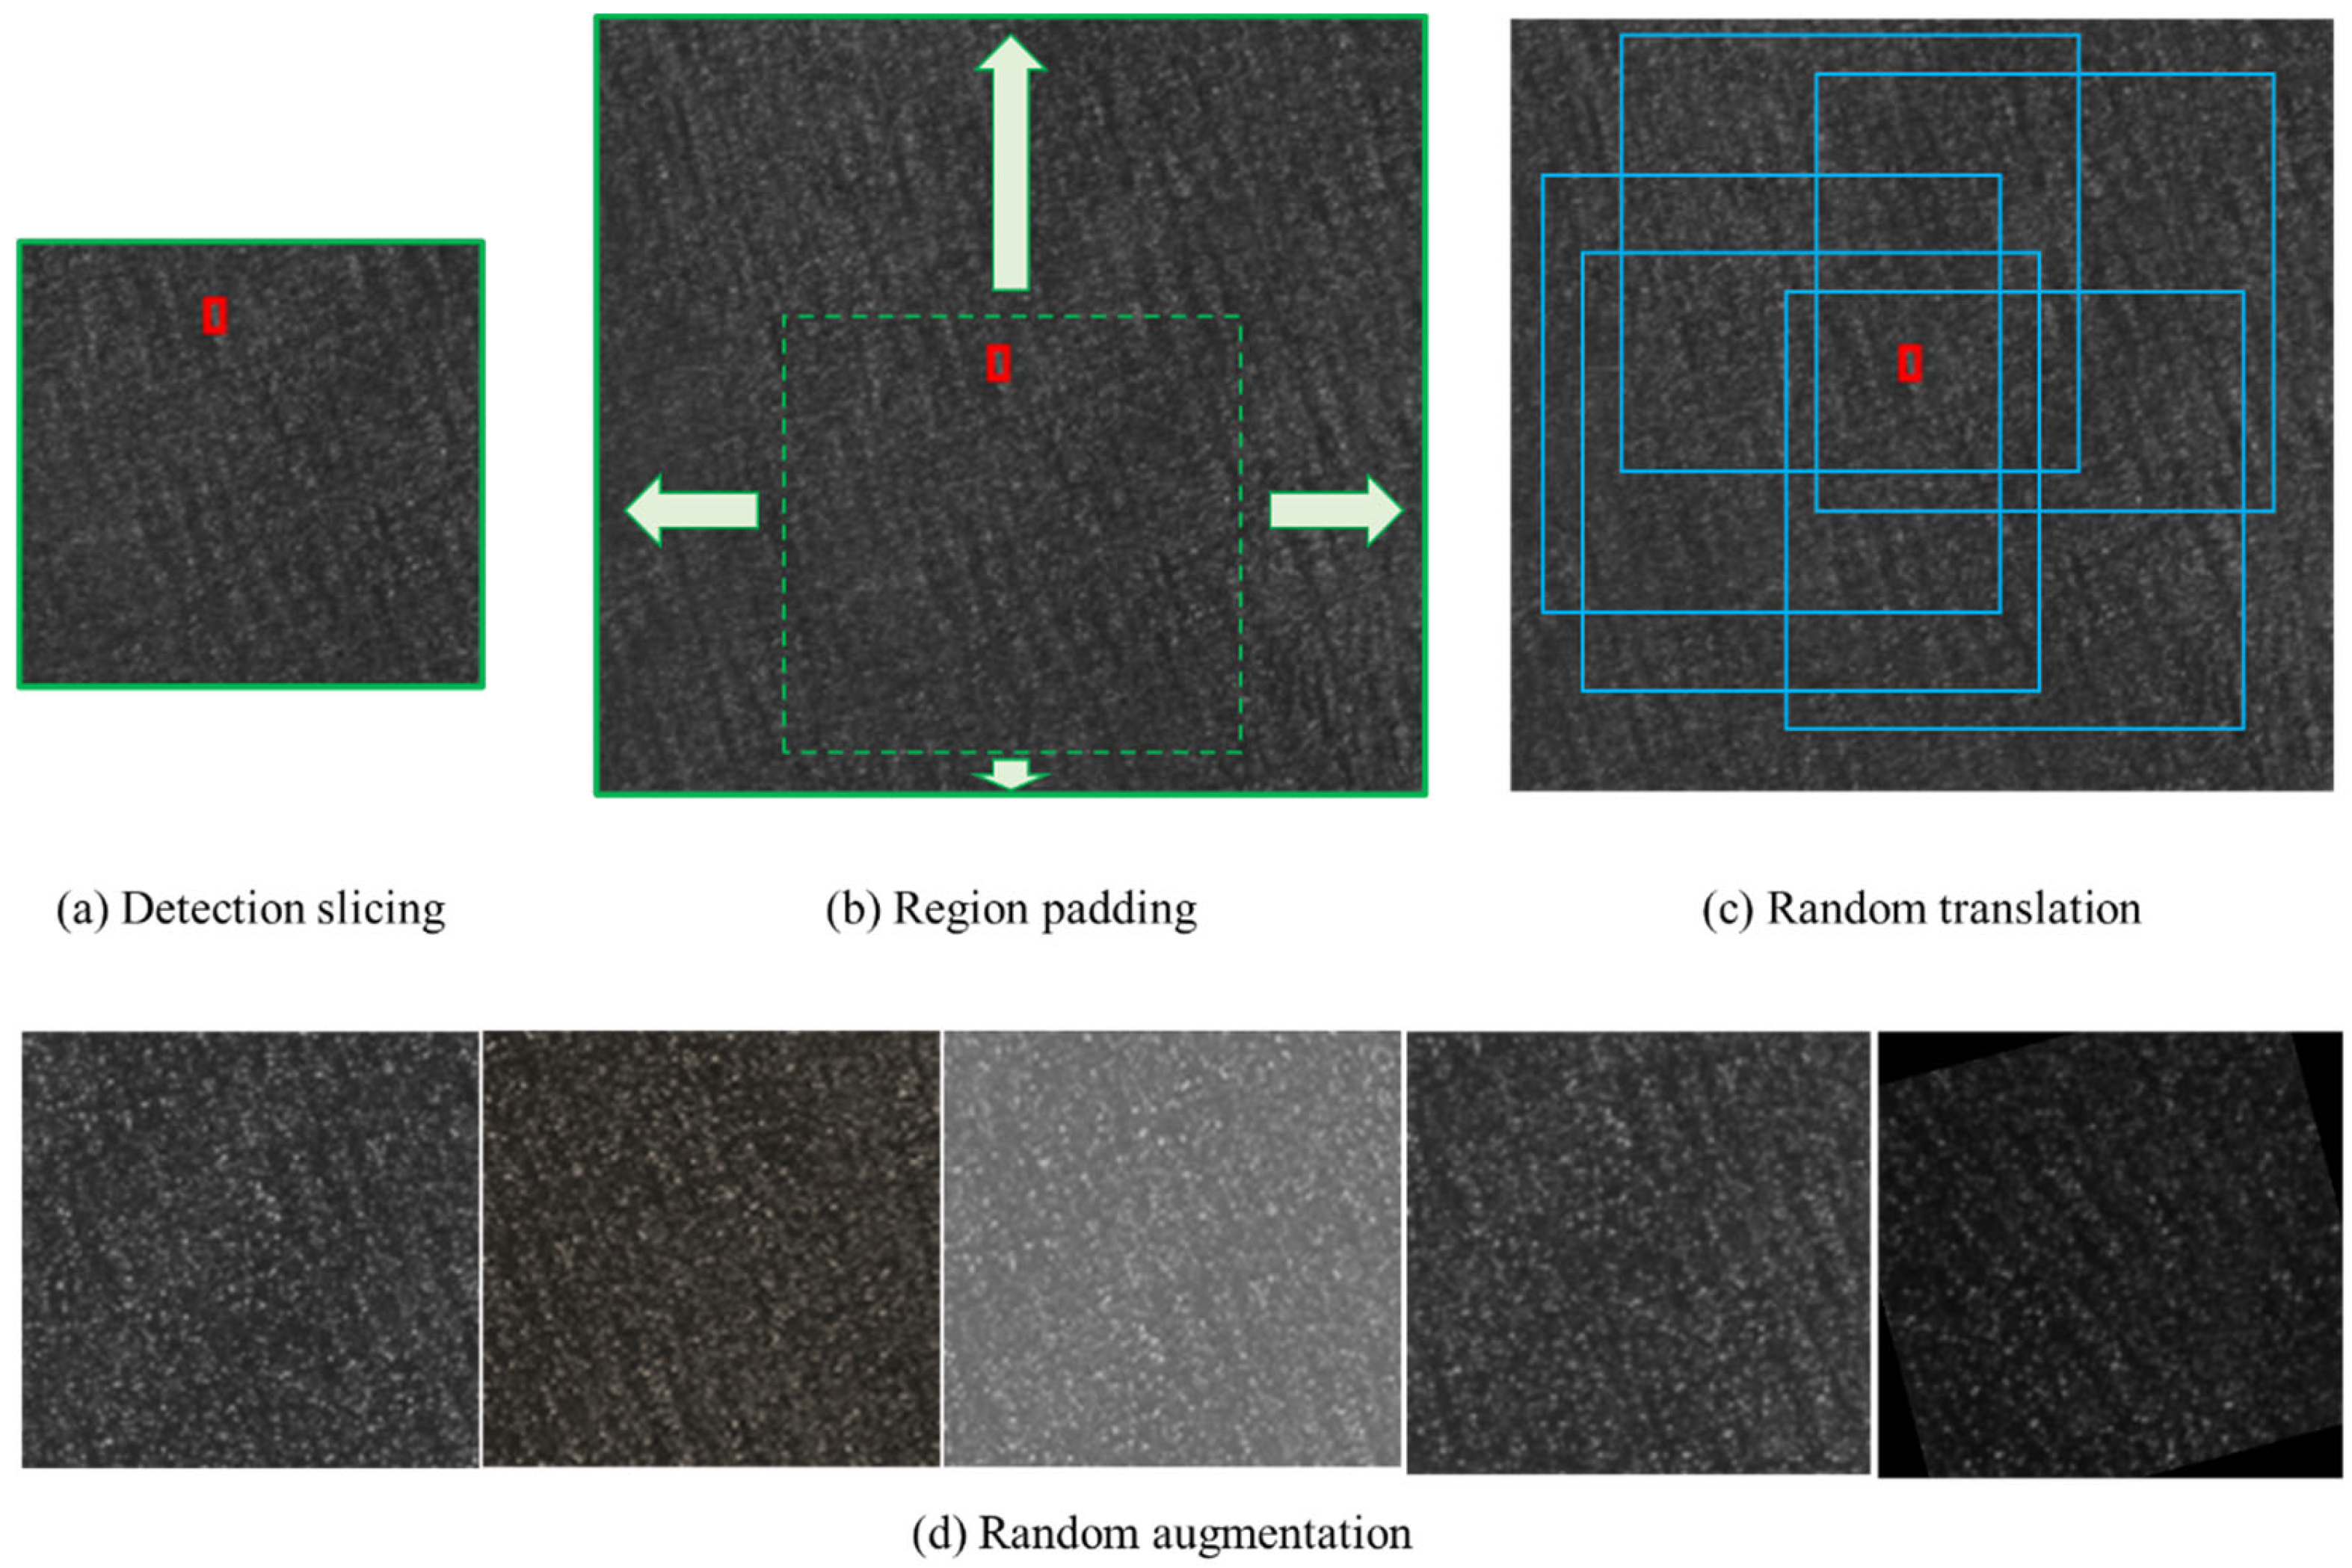
3.3. Detection Process

For detection, we perform back augmentation verification to reduce the false-alarm rate and improve the detection accuracy. Since a real view remote sensing image has a large size, it is common to slice the original image and perform independent detection for each slice. When detecting targets in one slice, the back augmentation verification is performed in the following steps:
Step 1: 
generate the detection batch
We first generate the detection batch according to the slice having targets detected, the general process is as shown in Figure 5. For one slice, as shown in Figure 5a, we perform region padding with double the slice size based on the original image, and it is best for the targets to lie in the center, as shown in Figure 5b. Then, we perform random translation with same size of slice; the translation step should be sufficiently large, and in our case, the minimum translation step is chosen as 5 times the detection-window size. The generated slice is as shown in the blue window of Figure 5c, and each target should have at least n generated slices. The detection batch is achieved by using random augmentation for generated slices, and the augmentation parameters are chosen to be the same as those in the training process. The generated detection batch is as shown in Figure 5d.
Step 2: 
merge and eliminate targets
After generating a detection batch, we use the following method to obtain the final detection targets. The process is as shown in Figure 6. We first use the ship detection network to achieve the detection results for the generated detection batch, and the input images and corresponding detection results are as shown in Figure 6a,b. Then, we construct the feature vector f w for each detection and use the density-based spatial clustering of an application with noise (DBSCAN) method [33] to perform clustering for detections. The feature vector f w is defined as:
f w = [ x , y , k 0 w , k 0 h ]
where x is the x-coordinate of the center of detection; y is the y-coordinate of the center of detection; w is the width of detection window; h is the height of detection window and k 0 ( 0 , 1 ) is a weight factor, since we are more concerned about the position than the size of the detection window.
The DBSCAN algorithm constructs the ε -neighborhood of the data point as
N ε ( p ) = { q X c   |   d i s t ( p , q ) ε }
where d i s t is the distance function, and we choose L 2 norm as the distance function in our method.
The DBSCAN method uses the neighborhood density threshold M ε to discover the clusters of the dataset that contains at least M ε central points. Choosing M ε n / 2 , the false-alarm rate can be reduced so that the detection accuracy is improved, as shown in Figure 6c. In fact, there is no ship target in the original slice (checked manually according to AIS data), and the proposed method can effectively eliminate the false-alarm target in the original detection.
The proposed detection process has the following characteristic,
Remark 1. 
Let  p 1  denote the true detection precision of the original ship network,  p 2  denote the false-alarm detection precision of the original ship network and  p 1 , p 2  satisfy  p 1 > 0.5 > p 2 , then the true detection precision of our method can converge to 1 according to the probability, and false-alarm detection precision can converge to 0 when the generated batch size n .
Proof. 
Let n = 2 m , m 1 , the true detection precision of our method is given as
P ( n ) = k = m n C n k p 1 k ( 1 p 1 ) n k
We have
1 P ( n ) = k = 0 m 1 C n k p 1 k ( 1 p 1 ) n k C 2 m 1 m 1 k = 0 m 1 p 1 k ( 1 p 1 ) n k = C 2 m 1 m 1 ( 1 p 1 ) 2 m 1 k = 0 m 1 ( p 1 1 p 1 ) k = C 2 m 1 m 1 ( 1 p 1 ) 2 m 1 1 p 1 1 2 p 1 ( 1 ( p 1 1 p 1 ) m )
According to Striling formula [34], when m , we can have
C 2 m 1 m 1 = ( 2 m 1 ) ! ( m 1 ) ! m ! 2 π ( 2 m 1 ) ( 2 m 1 e ) 2 m 1 2 π ( m 1 ) ( m 1 e ) m 1 2 π m ( m e ) m = 2 m 1 2 π ( m 1 ) m ( 2 m 1 m 1 ) m 1 ( 2 m 1 m ) m
This means
lim m k = 0 m 1 C n k p 1 k ( 1 p 1 ) n k lim m 2 m 1 2 π ( m 1 ) m ( 2 m 1 m 1 ) m 1 ( 2 m 1 m ) m ( 1 p 1 ) 2 m 1 1 p 1 1 2 p 1 ( 1 ( p 1 1 p 1 ) m ) = lim m 2 2 m 2 π m ( 1 p 1 ) 2 m 1 1 p 1 1 2 p 1 ( 1 ( p 1 1 p 1 ) m ) = lim m 1 2 π m 1 p 1 1 2 p 1 ( 2 m ( 1 p 1 ) 2 m 1 2 m ( 1 p 1 ) m 1 p 1 m ) = 0
And
lim m P ( 2 m 1 ) = 1
The true detection precision of our method can be proved as monotonically increasing with respect to p 1 .
( 1 P ( n ) ) p 1 = k = 0 m 1 C n k ( ( k 1 ) p 1 k 1 ( 1 p 1 ) n k ( n k ) p 1 k ( 1 p 1 ) n k 1 ) = k = 0 m 1 C n k p 1 k 1 ( 1 p 1 ) n k 1 ( n 1 ) ( k 1 n 1 p 1 ) < 0
That is
P ( n ) p 1 > 0
The false-alarm detection precision is given as the same form
P f ( n ) = k = m n C n k p 2 k ( 1 p 2 ) n k
Similarly, we have
lim m P f ( 2 m 1 ) = 0 , P f ( n ) p 2 < 0
And the false-alarm detection precision of our method can be proved as monotonically decreasing with respect to p 2 .
From Equations (8), (10) and (12), we find that the true detection precision of our method can converge to 1 and false-alarm detection precision can converge to 0 according to the probability when the generated batch size n . This completes the proof. □
From the above analysis, we can observe that the true detection precision of the original ship network p 1 and the false-alarm detection precision of the original ship network p 2 are critical when performing back augmentation, which requires that the detection has enough detection accuracy. Hence, the front augmentation is a necessary step that reduces the modal difference in training and guarantees the basic detection accuracy in different modal images.

4. Experiments and Discussion

In this section, we train the model mainly using the Kaggle Ship Detection Dataset [35] and verify the effectiveness of our method using real remote sensing images observed by GaoFen satellites. The total size of the training set is about 15,000, with about 80% of them from the Kaggle Ship Detection Dataset, 10% from the AIR-MOT dataset, and 10% from the GF-6 satellite. In the training process, the dataset is split into training and validation sets with an 80–20 split. The general real-satellite experiment process is as follows.
We first analyze the historical AIS and weather data of the South China Sea and choose a suitable region then we decide on the sensing time and report these to the management team of the GaoFen satellite. In order to definitely observe a ship in the image, we rent a small ship to sail within the selected region at the satellite-sensing time. The experiment lasts for several weeks, and these remote sensing images with AIS data as the ground truth compose our testing data.
The training dataset consists of color images and the real remote sensing image is a PAN image. The detection backbone network is chosen from Mask-R-CNN [36], Deformable DETR [37], YOLOv5 [38] and YOLOv8 [39], which are the most widely used network forms in ship detection from remote sensing. The experiments are conducted on a high-performance workstation equipped with a 24 GB Nvidia RTX 4090 GPU.

4.1. Comparison Experiments

In this experiment, we demonstrate the efficiency of the proposed method on a real remote sensing image and compare it with widely used methods. Since our method needs a detection backbone network, we give the comparative results of each backbone network, and we note “(ours)” to indicate that the method is performed in our proposed framework. All the detection networks are trained for 1000 epochs and choose the best performance model. The Mask-R-CNN network is employed using the Detectron2 platform [40], and the Deformable DETR network is employed using the mmdetection platform [41].
The mean average precision (mAP) and mean false-alarm rate (mFAR) of slices are used to evaluate the ship detection performance. The AP is a measure of the quality of detection results for a certain category, and the calculation of AP is as follows:
A P = 0 1 P ( R ) d R
where P is the precision, which measures how well you can find true positives out of all positive predictions; R is the recall, which measures how well you can find true positives out of all predictions and AP is the area enclosed by the P–R curve.
The mFAR is defined as follows:
mFAR = i F P i N i ( F P i + T P i ) / N t
where F P i is the number of false positives of all slices of one view image; T P i is the number of true positives of all slices of one view image; N i is the number of slices of one view image and N t is the number of views of a remote sensing image. The mFAR reflects the possibility of false-alarm detection in one slice; because a lot of negative slices are generated for one view image, mFAR = 1 indicates that all slices or test images having false-alarm targets and all detections are false alarms.
The training dataset and testing views of a real remote sensing image are as shown in Figure 7, Figure 7a shows the training color images and Figure 7b illustrates the real remote sensing PAN images. We can observe huge differences between different modal images. The size of the real remote sensing image is about 14,000 × 24,000, the size of each slice is 1500 × 1500 and the padding size is 1000, and we use 10 views of a real remote sensing image with over 15,000 slices for evaluating the performance. The ground truth of the real remote sensing image is checked manually according to the ship’s AIS data in same time period.
The statistical results of the precision and runtime are shown in Table 1; here, m A P 0 means the mAP in the training dataset, m A P 1 means the mAP in the real PAN images, mFAR means the mean false-alarm rate in the real remote sensing images and runtime means the average computing time to complete the detection of one view image, which indicates the total detections of all slices (about 1500 slices).
From the results, we see that all kinds of backbone detection networks have poor performance in real remote sensing images because huge differences between different modal images cause difficulty in generalization. Due to the modal gap, the detection performance sharply decreases in real PAN images, and although mAP is over 0.8 in training color images, the mAP is only about 0.53 in real PAN images. Our method can improve the detection precision and reduce the false-alarm rate for all kinds of backbone detection networks without changing the network structure, and the mAP in real PAN images is improved by about 136% for Mask-R-CNN, 64.5% for Deformable DETR, 99.3% for YOLOv5 and 60.2% for YOLOv8. And the mFAR of detection network is less than 1.3%, which indicates about 8 false-alarm targets detected in one view of an image, which has decreased over 12% indicating that over 54 false-alarm targets have been removed in one view of an image. These results can show that our method can generate the closest result to the ground truth, despite the huge difference between a multi-spectral (color) image in training and a panchromatic (PAN) image in testing.
The detection results from real remote sensing images are as shown in Figure 8 and Figure 9. The other five real-satellite remote sensing images have the same characteristics as the presented images. Here, we show the best and least satisfactory performances from comparable methods to better demonstrate the effectiveness of our method.
Figure 8a shows the ground truth of these three views of PAN images; these images are observed by GaoFen-3 with a resolution of 0.75 m, and only one ship target lies in the middle-column image. Figure 8b shows the detection result from conventional Mask-R-CNN, which generally has the least satisfying result of the comparative detection backbone networks, with 23 detection results in the first image, 33 detection results in the second image and 171 detection results in the third image; although the true ship target is detected, a total of 225 false-alarm targets are also incorrectly detected and the mFAR is about 24%. Figure 8d shows the detection result of conventional YOLOv8, which has the best satisfactory result of the detection backbone networks on average, with 19 detection results in first image, 21 detection results in the second image and 29 detection results in the third image. Similarly, the true ship target is detected, total 68 false-alarm targets are also incorrectly detected and the mFAR is about 7.3%. Figure 8c,e show the detection results of the same structure with the Mask-R-CNN and YOLOv8 networks, respectively; using our method, all the networks can achieve 100% precision and 0% mFAR in these PAN images, which verifies the efficiency and applicability of the proposed method.
Figure 8 shows the promising performance of our method in mitigating false alarms induced by cross-modal images. Next, we demonstrate the performance of our method in detection accuracy. The Figure 9 image was also observed by GaoFen-3 with a resolution of 0.75 m, and two adjacent views of images have been stitched together using longitude and latitude information that causes rotation of the image, and the size of original remote sensing image was 22,352 × 21,478. As shown in Figure 9b, 24 ships exist according to manually checked results using the AIS data. Figure 9c shows the detection result of conventional YOLOv8, which has the most satisfactory results of the detection backbone networks on average, with 12 positive true detections, 12 false-negative detections and 54 false-alarm detections, and the detection recall and mFAR are 50% and 14.95%, respectively. Figure 9d shows the detection result of same structure with the YOLOv8 network using our method, with 20 positive true detections, 4 false-negative detections and 7 false-alarm detections, and the detection recall and mFAR are 83.33% and 1.64%, respectively. From the results, we can find that both the detection accuracy and false-alarm rates are influenced by cross-modal images, causing significant performance degradation in real PAN images. Our method can effectively reduce the influences of different cross-modal images, holding a satisfactory detection accuracy and effectively mitigating false alarms, which verify the efficiency and applicability of the proposed method.
The results of the training dataset of the Kaggle Ship Detection Dataset are as shown in Figure 10. The detection results from the original YOLOv8 and from YOLOv8 with our framework are shown in Figure 10a,b, respectively. From Figure 10a, we can observe that original YOLOv8 has satisfactory detection accuracy, most ships are detected with little false-alarm targets. Since front augmentation is used, the original images are transferred to single channel patterns as shown in Figure 10b. As observed, detection accuracy in training dataset slightly decreased while the false-alarm rate also decreased in our framework. And generally, the detection accuracy is still satisfactory with higher mAP (mainly caused by the decreasing false-alarm rate). Here, we note that the detection accuracy in training dataset may not further increase; however, the performance in the training dataset is not our main concern, as our aim is to use the large color-image dataset for training ship detection network instead of the barely available PAN datasets. And the presented results show that the detection accuracy of our method is still satisfactory.
We note that the runtime of our method in Table 1 can be divided into the network prediction time and the results-clustering time. From these, the largest part of the running time is for the network prediction time, and the clustering time is less than 0.4 s on average. Generally, the additional running time relates to the original false-alarm rate of the backbone detection network, as more false-alarm detections requires more time for completion of the total detection process of our method. The additional running-time complexity of our method is approximately O ( N F A T D ) , where N F A is the number of false-alarm detections, and T D is the detection time of the network.

4.2. Ablation Study

An ablation study conducted on different structure combinations is described in this section. Considering whether the front augmentation or back augmentation is used, four structures are described in Figure 11.
The training dataset and testing dataset are as same as those used in Section 4.1, and we have chosen Mask-R-CNN as the detection backbone network to better demonstrate the effectiveness of different structures in our method. The statistical results of the metrics are shown in Table 2, where T 0 represents the training time of the network. The total size of the training set is about 15,000, and the testing set consists of 10 views of real remote sensing images with over 15,000 slices. We present the illustration results of ablation study using the image shown in Figure 9, and the results are shown in Figure 12.
From these results, we can see that both the front augmentation and the back augmentation are important in improving the network performance; the front augmentation can sightly improve the generalization of the network and mainly influences the training network time, and it is not related to runtime as it is only performed in training. Although the improvement by only using front augmentation may seem to be not very obvious in the experiment (increasing mAP by 0.0539 and decreasing mFAR by 0.0797), the front augmentation is still necessary as it plays an important role in meeting the basic requirement of our method that p 1 , p 2 satisfy p 1 > 0.5 > p 2 , which guarantees detection accuracy as shown in Figure 12. The back augmentation can improve the generalization of the network and reduce the false-alarm rate, mainly by influencing the network prediction time, and it is not related to training time as it is only performed when running detection. As shown in Figure 12, the back augmentation can achieve better performance when the network has enough performance, which is acquired by using front augmentation. Hence, our method that combines front augmentation and back augmentation can effectively improve the detection precision and reduce false alarms.
In conclusion, the front augmentation provides the potential detection ability of training network, and the back augmentation improves the false-alarm rejection capability. By applying these two structures simultaneously, we can get the best detection results in cross-modal remote sensing images.

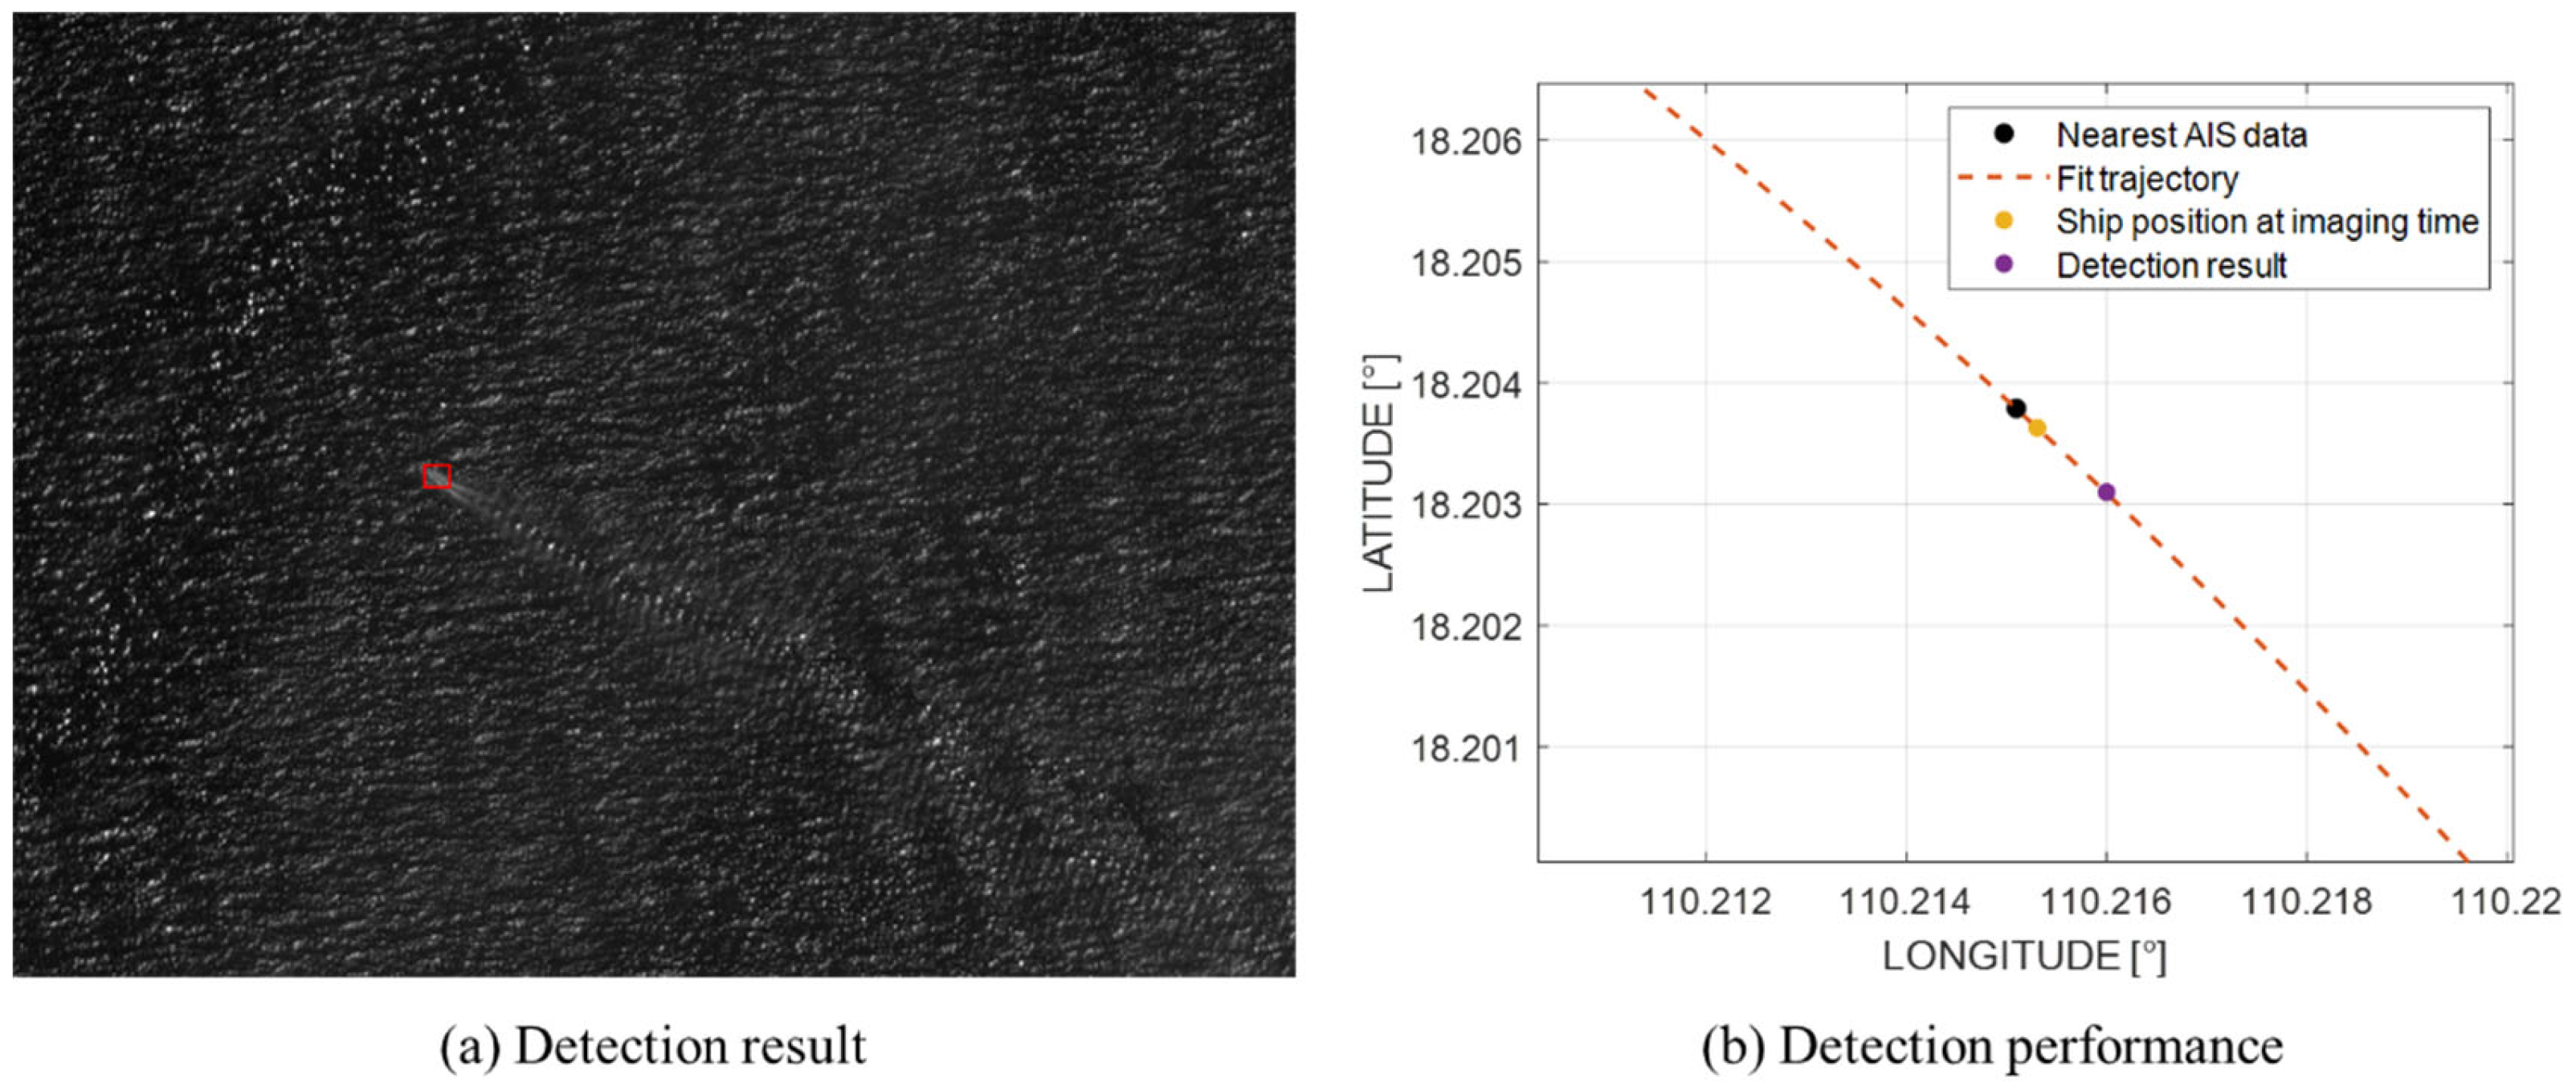
4.3. Detection Precision

In the experiment shown in Figure 8, the imaging time is from 29 June 2023, 11:23:17 to 29 June 2023, 11:23:25, and the observing ship’s AIS trajectory near the imaging time is shown in Table 3. As only one ship is found according to AIS data in the imaging area, we can directly analyze the detection precision.
The detection result of our method is shown in Figure 13, and the detection position of the analyzing ship is 110.2160° longitude, 18.2031° latitude. The detection error is about 96.4851 m, which shows the great potential of our method for automatic ship detection and tracking.

4.4. Limitations

Although the proposed double-augmentation method shows satisfactory advantages in ship detection for cross-modal remote sensing images, the presented study also has certain limitations. First, the proposed method uses additional front augmentation to train the detection network, which needs additional data of the target domains and costs more training time. In our case, the total training time can be about double that of training for conventional methods and more GPU memory is also needed in training. Second, the back augmentation verification needs additional predictions and costs more detection time, which causes a detection rate that is lower than that of conventional methods. In addition, the proposed method can only be valid under the condition that the true detection precision of the original ship network is over 0.5 and the false-alarm rate is less than 0.5, which requires that the detection network has enough performance and the improvement also has a boundary.

5. Conclusions

This paper presents a practical and effective scheme for ship detection in cross-modal remote sensing images, which is suitable for ship detection in PAN images with little training data using a light-weight detection network. Our method constructs a double augmentation structure to improve the performance of a conventional detection backbone network. We train a modal recognition network to distinguish different kinds of images and use the extracted potential features to train the transformation relation between different modal images, and the obtained transformation relation consists of the front augmentation. Then, we use the front augmentation to train the detection backbone network and use back augmentation verification to reduce the false-alarm rate and improve the detection accuracy. Comparative results show that the proposed method can greatly improve ship-detection precision and effectively reject the false alarms caused by cross-modal images.
However, the proposed method has some limitations. One limitation is that the additional processes need more training and prediction time. Second, the improvement has a boundary and requires that the detection network has enough performance, which indicates that the true positive detection of the original ship detection network should be greater than 0.5 and false-alarm detection precision of original ship detection network should less than 0.5. In other words, when the augmentation is added to images, the ship targets are more likely to be detected than are false alarms in background.
In the future, we aim to attempt to optimize the running process of the method to improve the efficiency. We also aim to further study the modal transformation and improve the structure of the backbone detection network.

Author Contributions

Conceptualization, F.M. and Z.F.; Methodology, F.M.; Programming, F.M.; Data analysis, C.J.; Formal analysis, F.M.; Investigation, F.M. and Y.Z.; Writing–original draft, F.M.; Writing–review and editing, F.M., Z.F., C.J., Y.Z., L.W. and X.L.; Resources, Z.F. and L.W.; Supervision, Z.F., L.W. and X.L.; Project administration, L.W. and X.L. All authors have read and agreed to the published version of the manuscript.

Funding

The authors gratefully acknowledge financial support from the Strategic Priority Research Program of the Chinese Academy of Sciences, Grant No. XDA0310502, and the Future Star of Aerospace Information Research Institute, Chinese Academy of Sciences, Grant No. E3Z10701.

Data Availability Statement

The data presented in this study are openly available in reference number [35].

Conflicts of Interest

The authors declare no conflicts of interest.

References

  1. Chaturvedi, S.K. Study of synthetic aperture radar and automatic identification system for ship target detection. J. Ocean Eng. Sci. 2019, 4, 173–182. [Google Scholar] [CrossRef]
  2. Shi, H.; He, G.; Feng, P.; Wang, J. An On-Orbit Ship Detection and Classification Algorithm for Sar Satellite. In IGARSS 2019—2019 IEEE International Geoscience and Remote Sensing Symposium; IEEE: New York, NY, USA, 2019. [Google Scholar]
  3. Ma, J.; Zhou, H.; Zhao, J.; Gao, Y.; Jiang, J.; Tian, J. Robust feature matching for remote sensing image registration via locally linear transforming, IEEE Trans. Geosci. Remote Sens. 2015, 53, 6469–6481. [Google Scholar] [CrossRef]
  4. Shao, Z.; Cai, J.; Fu, P.; Hu, L.; Liu, T. Deep learning-based fusion of landsat-8 and sentinel-2 images for a harmonized surface reflectance product. Remote Sens. Environ. 2019, 235, 111425. [Google Scholar] [CrossRef]
  5. Thomas, C.; Ranchin, T.; Wald, L.; Chanussot, J. Synthesis of multispectral images to high spatial resolution: A critical review of fusion methods based on remote sensing physics. IEEE Trans. Geosci. Remote Sens. 2008, 46, 1301–1312. [Google Scholar] [CrossRef]
  6. Ghassemian, H. A review of remote sensing image fusion methods. Inf. Fusion 2016, 32, 75–89. [Google Scholar] [CrossRef]
  7. Ma, J.; Yu, W.; Chen, C.; Liang, P.; Guo, X.; Jiang, J. Pan-GAN: An unsupervised pan-sharpening method for remote sensing image fusion. Inf. Fusion 2020, 62, 110–120. [Google Scholar] [CrossRef]
  8. Eikvil, L.; Aurdal, L.; Koren, H. Classification-based vehicle detection in high-resolution satellite images. ISPRS J. Photogramm. Remote Sens. 2009, 64, 65–72. [Google Scholar] [CrossRef]
  9. Girshick, R.; Donahue, J.; Darrell, T.; Malik, J. Rich feature hierarchies for accurate object detection and semantic segmentation. In Proceedings of the IEEE Conference on Computer Vision and Pattern Recognition; CVPR: Columbus, OH, USA, 2014; pp. 580–587. [Google Scholar]
  10. He, K.; Zhang, X.; Ren, S.; Sun, J. Spatial pyramid pooling in deep convolutional networks for visual recognition. IEEE Trans. Pattern Anal. Mach. Intell. 2015, 37, 1904–1916. [Google Scholar] [CrossRef]
  11. Girshick, R. Fast r-cnn. In Proceedings of the IEEE International Conference on Computer Vision; ICCV: Santiago, Chile, 2015; pp. 1440–1448. [Google Scholar]
  12. Dai, J.; Li, Y.; He, K.; Sun, J. R-fcn: Object detection via region-based fully convolutional networks. Adv. Neural Inf. Process. Syst. 2016, 29. [Google Scholar] [CrossRef]
  13. Jiang, H.; Learned-Miller, E. Face detection with the faster R-CNN. In Proceedings of the 2017 12th IEEE International Conference on Automatic Face & Gesture Recognition (FG 2017), Washington, DC, USA, 30 May–3 June 2017; pp. 650–657. [Google Scholar]
  14. He, K.; Gkioxari, G.; Dollár, P.; Girshick, R. Mask r-cnn. In Proceedings of the IEEE International Conference on Computer Vision; ICCV: Venice, Italy, 2017; pp. 2961–2969. [Google Scholar]
  15. Redmon, J.; Farhadi, A. Yolov3: An incremental improvement. arXiv 2018, arXiv:1804.02767. [Google Scholar]
  16. Bochkovskiy, A.; Wang, C.Y.; Liao, H.Y.M. Yolov4: Optimal speed and accuracy of object detection. arXiv 2020, arXiv:2004.10934. [Google Scholar]
  17. Liu, W.; Anguelov, D.; Erhan, D.; Szegedy, C.; Reed, S.; Fu, C.Y.; Berg, A.C. Ssd: Single shot multibox detector. In European Conference on Computer Vision; Springer: Cham, Switzerland, 2016; pp. 21–37. [Google Scholar]
  18. Dong, X.; Yan, S.; Duan, C. A lightweight vehicles detection network model based on YOLOv5. Eng. Appl. Artif. Intell. Int. J. Intell. Real-Time Autom. 2022, 113, 113. [Google Scholar] [CrossRef]
  19. Lin, T.Y.; Goyal, P.; Girshick, R.; He, K.; Dollár, P. Focal loss for dense object detection. In Proceedings of the IEEE International Conference on Computer Vision; ICCV: Venice, Italy, 2017; pp. 2980–2988. [Google Scholar]
  20. Al-saad, M.; Aburaed, N.; Panthakkan, A.; Al Mansoori, S.; Al Ahmad, H.; Marshall, S. Airbus ship detection from satellite imagery using frequency domain learning. In Image and Signal Processing for Remote Sensing XXVII; SPIE: Bellingham, WA, USA, 2021; pp. 267–273. [Google Scholar]
  21. Li, Q.; Mou, L.; Liu, Q.; Wang, Y.; Zhu, X.X. HSF-Net: Multiscale deep feature embedding for ship detection in optical remote sensing imagery. IEEE Trans. Geosci. Remote Sens. 2018, 56, 7147–7161. [Google Scholar] [CrossRef]
  22. Jiao, J.; Zhang, Y.; Sun, H.; Yang, X.; Gao, X.; Hong, W.; Fu, K.; Sun, X. A densely connected end-to-end neural network for multiscale and multi-scene SAR ship detection. IEEE Access 2018, 6, 20881–20892. [Google Scholar] [CrossRef]
  23. Tian, L.; Cao, Y.; He, B.; Zhang, Y.; He, C.; Li, D. Image enhancement driven by object characteristics and dense feature reuse network for ship target detection in remote sensing imagery. Remote Sens. 2021, 13, 1327. [Google Scholar] [CrossRef]
  24. Vaswani, A.; Shazeer, N.; Parmar, N.; Uszkoreit, J.; Jones, L.; Gomez, A.N.; Kaiser, Ł.; Polosukhin, I. Attention is all you need. Adv. Neural Inf. Process. Syst. 2017, 30. [Google Scholar] [CrossRef]
  25. Carion, N.; Massa, F.; Synnaeve, G.; Usunier, N.; Kirillov, A.; Zagoruyko, S. End-to-end object detection with transformers. In Proceedings of the Computer Vision–ECCV 2020: 16th European Conference, Glasgow, UK, 23–28 August 2020; Part I 16; Springer International Publishing: Berlin/Heidelberg, Germany, 2020; pp. 213–229. [Google Scholar]
  26. Shin, H.C.; Lee, K.I.; Lee, C.E. Data augmentation method of object detection for deep learning in maritime image. In Proceedings of the 2020 IEEE International Conference on Big Data and Smart Computing (BigComp), Busan, Republic of Korea, 19–22 February 2020; pp. 463–466. [Google Scholar]
  27. Hu, J.; He, J.; Jiang, P.; Yin, Y. SOMC: A Object-Level Data Augmentation for Sea Surface Object Detection. J. Phys. Conf. Ser. 2022, 2171, 012033. [Google Scholar] [CrossRef]
  28. Chen, Z.; Chen, D.; Zhang, Y.; Cheng, X.; Zhang, M.; Wu, C. Deep learning for autonomous ship-oriented small ship detection. Saf. Sci. 2020, 130, 104812. [Google Scholar] [CrossRef]
  29. Kong, T.; Yao, A.; Chen, Y.; Sun, F. Hypernet: Towards accurate region proposal generation and joint object detection. In Proceedings of the IEEE Conference on Computer Vision and Pattern Recognition; ICCV: Las Vegas, NV, USA, 2016; pp. 845–853. [Google Scholar]
  30. Zhang, S.; Cao, Y.; Sui, B. DF-Mask R-CNN: Direction Field-Based Optimized Instance Segmentation Network for Building Instance Extraction. IEEE Geosci. Remote Sens. Lett. 2023, 20, 1–5. [Google Scholar] [CrossRef]
  31. Zhu, Z.; Sun, X.; Diao, W.; Chen, K.; Xu, G.; Fu, K. AOPDet: Automatic Organized Points Detector for Precisely Localizing Objects in Aerial Imagery. IEEE Trans. Geosci. Remote Sens. 2022, 60, 5606816. [Google Scholar] [CrossRef]
  32. He, K.; Zhang, X.; Ren, S.; Sun, J. Deep residual learning for image recognition. In Proceedings of the IEEE Conference on Computer Vision and Pattern Recognition, Las Vegas, NV, USA, 26 June–1 July 2016; pp. 770–778. [Google Scholar]
  33. Ester, M.; Kriegel, H.P.; Sander, J.; Xu, X. A Density-Based Algorithm for Discovering Clusters in Large Spatial Databases with Noise; AAAI Press: Washington, DC, USA, 1996. [Google Scholar]
  34. Aissen, M.I. Some remarks on Stirling formula. Am. Math. Mon. 1954, 61, 687–691. [Google Scholar] [CrossRef]
  35. Inversion; Faudi, J.; Martin. Airbus Ship Detection Challenge. Kaggle. 2018. Available online: https://kaggle.com/competitions/airbus-ship-detection (accessed on 16 July 2023).
  36. Nie, X.; Duan, M.; Ding, H.; Hu, B.; Wong, E.K. Attention Mask R-CNN for Ship Detection and Segmentation From Remote Sensing Images. IEEE Access 2020, 8, 9325–9334. [Google Scholar] [CrossRef]
  37. Li, M.; Cao, C.; Feng, Z.; Xu, X.; Wu, Z.; Ye, S.; Yong, J. Remote Sensing Object Detection Based on Strong Feature Extraction and Prescreening Network. IEEE Geosci. Remote Sens. Lett. 2023, 20, 8000505. [Google Scholar] [CrossRef]
  38. Zheng, J.-C.; Sun, S.-D.; Zhao, S.-J. Fast ship detection based on lightweight YOLOv5 network. IET Image Process 2022, 16, 1585–1593. [Google Scholar] [CrossRef]
  39. Wang, G.; Chen, Y.; An, P.; Hong, H.; Hu, J.; Huang, T. UAV-YOLOv8: A Small-Object-Detection Model Based on Improved YOLOv8 for UAV Aerial Photography Scenarios. Sensors 2023, 23, 7190. [Google Scholar] [CrossRef]
  40. Wu, Y.; Kirillov, A.; Massa, F.; Lo, W.-Y.; Girshick, R. Detectron2. 2019. Available online: https://github.com/facebookresearch/detectron2 (accessed on 10 October 2023).
  41. Chen, K.; Wang, J.; Pang, J.; Cao, Y.; Xiong, Y.; Li, X.; Sun, S.; Feng, W.; Liu, Z.; Xu, J.; et al. MMDetection: Open MMLab Detection Toolbox and Benchmark. arXiv 2019, arXiv:1906.07155. [Google Scholar]
Figure 1. Framework of our modal transforming method for ship detection in remote sensing imagery.
Remotesensing 16 00600 g001
Figure 2. Illustration of modal recognition network.
Remotesensing 16 00600 g002
Figure 3. Illustration of training front augmentation.
Remotesensing 16 00600 g003
Figure 4. Illustration of process for training ship detection network.
Remotesensing 16 00600 g004
Figure 5. Process for generating a detection batch.
Remotesensing 16 00600 g005
Figure 6. Process used to merge and eliminate targets using generated detection batch. Here, red squares mean the detection results of network.
Remotesensing 16 00600 g006
Figure 7. Training dataset and testing real remote sensing.
Remotesensing 16 00600 g007aRemotesensing 16 00600 g007b
Figure 8. Illustration of detection results. Here, red squares mean the detection results of network.
Remotesensing 16 00600 g008aRemotesensing 16 00600 g008b
Figure 9. Illustration of detection accuracy. Here, red squares mean the detection results of network.
Remotesensing 16 00600 g009
Figure 10. Results of the training dataset Kaggle Ship Detection Dataset. Here, red squares mean the detection results of network.
Remotesensing 16 00600 g010aRemotesensing 16 00600 g010b
Figure 11. The four different structures of our proposed method for ablation study.
Remotesensing 16 00600 g011
Figure 12. Illustration of the ablation study. Here, red squares mean the detection results of network.
Remotesensing 16 00600 g012
Figure 13. The detection result of our method. Here, red square mean the detection result of network.
Remotesensing 16 00600 g013
Table 1. Quantitative comparison of eight methods on real images observed by GaoFen satellites, with all methods performed using the same equipment. Bold indicates the best result.
Method m A P 0 m A P 1 mFARRuntime [s]
Mask-R-CNN 0.68970.34820.23641133
Mask-R-CNN (ours) 0.85540.82230.01211320
Deformable DETR 0.81750.51190.1459835
Deformable DETR (ours) 0.87980.84210.0087946
YOLOv5 0.70250.41420.2104157
YOLOv5 (ours) 0.86020.82540.0120162
YOLOv8 0.82410.53150.1366204
YOLOv8 (ours) 0.88560.85130.0076223
Table 2. Quantitative comparison of four different structures within our proposed method for an ablation study. Bold indicates the best result.
Method m A P 0 m A P 1 mFAR T 0   [ h ] Runtime [s]
Conventional framework0.68970.34820.3364501133
Only front augmentation0.69540.40210.25671031138
Only back augmentation0.73350.68280.1378491325
Double augmentation0.85540.82230.01211031320
Table 3. Ship’s AIS trajectory near the imaging time.
Update Time:Longitude (°):Latitude (°):Course (°):Speed (kn):Heading (°):
29 June 2023 11:13:03110.231218.18648327.47.882.0
29 June 2023 11:14:23110.2294818.18898325.88.2325.8
29 June 2023 11:23:24110.215118.20379315.68.1315.6
29 June 2023 11:35:30110.1942418.2146112.67.6235.0
29 June 2023 11:41:23110.194518.215475290.07.5290.0
Disclaimer/Publisher’s Note: The statements, opinions and data contained in all publications are solely those of the individual author(s) and contributor(s) and not of MDPI and/or the editor(s). MDPI and/or the editor(s) disclaim responsibility for any injury to people or property resulting from any ideas, methods, instructions or products referred to in the content.

