Abstract
The circular synthetic aperture radar (CSAR) has the ability of all-round continuous observation and high-resolution imaging detection, and can obtain all-round scattering information and higher-resolution images of the observation scene, so as to realize the target information extraction and three-dimensional (3D) contour reconstruction of the observation targets. However, the existing methods are not accurate enough to extract the information of vehicle targets. Through the analysis of the vehicle target scattering model and CSAR image characteristics, this paper proposes a vehicle target information extraction and 3D contour reconstruction method based on multiple different pitch-angle observation CSAR data. The proposed method creatively utilizes the projection relationship of the vehicle in 2D CSAR imaging to reconstruct the 3D contour of the vehicle, without prior information. Firstly, the CSAR data obtained from multiple different pitch-angle observations are fully utilized, and the scattering points of odd-bounce reflection and even-bounce reflection echoes are extracted from the two-dimensional (2D) coherent CSAR images of the vehicle target. Secondly, the basic contour of the vehicle body is extracted from the scattering points of the even-bounce reflected echoes. Then, the geometric projection relationship of the “top–bottom shifting” effect of odd-bounce reflection is used to calculate the height and position information of the scattering points of odd-bounce reflection, so as to extract the multi-layer 3D contour of the vehicle target. Finally, the basic contour and the multi-layer 3D contour of the vehicle are fused to realize high-precision 3D contour reconstruction of the vehicle target. The correctness and effectiveness of the proposed method are verified by using the CVDomes simulation dataset of the American Air Force Research Laboratory (AFRL), and the experimental results show that the proposed method can achieve high-precision information extraction and realize distinct 3D contour reconstruction of the vehicle target.
1. Introduction
Synthetic aperture radars (SAR) obtain high resolution in the range direction by transmitting large-bandwidth signals, at the same time, the platform moves to observe the target at a large angle to obtain high resolution in the azimuth direction [1]. As one of the most productive sensors in the field of microwave remote sensing and advanced array signal processing, SAR has received rapid development and widespread attention. SAR imaging can obtain more electromagnetic scattering information of the observed target through the reconstruction of the target scattering function, which is helpful for the analysis, classification and identification of target characteristics [2]. SAR imaging offers significant advantages in remote sensing observation, due to its ability to operate regardless of external environmental conditions such as weather and light. It can provide all-weather and all-day reconnaissance capabilities, making it highly versatile [3]. As a result, SAR imaging has found wide-ranging applications in various fields. For instance, in the agricultural sector, SAR imaging enables the monitoring of crop growth, soil moisture levels, and the occurrence of pests and diseases. This accurate and timely data supports crop assessment and agricultural management [4]. In the domain of disaster forecasting, SAR imaging plays a vital role. Its capability to detect surface deformations allows for early warning of natural disasters such as earthquakes, volcanic eruptions, and floods, this information is crucial for rescue efforts and emergency response coordination [5].
In addition, SAR imaging has proven to be of great value in civilian applications such as marine surveying and mapping [6]. It provides detailed and precise data that aids in understanding oceanographic features, coastal erosion, and bathymetry, this information is essential for maritime industries, environmental monitoring, and coastal zone management [7]. Additionally, in military operations, SAR imaging facilitates battlefield reconnaissance. Its high-resolution imagery and ability to track enemy targets accurately contribute to situational awareness and support strategic decision-making. Furthermore, SAR technology aids in strategic early warning systems, enhancing national security and defense preparedness [8,9].
Circular SAR (CSAR) refers to a 360-degree circular movement of the radar platform around the target scene, and its antenna emission beam is always directed at the target scene [10]. Compared to traditional SAR with a straight flight trajectory, CSAR offers 360-degree observation, resulting in targets with more complete contours and better suppression of background [11]. The omnidirectional scattering characteristics of the target obtained by CSAR can effectively improve target detection performance. The biggest advantage of CSAR imaging is its ability to observe targets in all directions, allowing the resulting image to reflect the backscattering information of the target in all azimuths. This leads to higher image resolution and enables certain three-dimensional (3D) imaging capabilities [12]. The comprehensive coverage of CSAR imaging enables a more detailed and accurate representation of the target’s backscattering characteristics, resulting in improved image resolution and the potential for 3D imaging [13].
In recent years, the reconstruction of 3D images of CSAR data has become a research hotspot [14,15,16]. At present, the main method for 3D image reconstruction of observation scene targets using CSAR is to use multi-baseline CSAR imaging technology [17,18]. However, it requires the acceptance and processing of multi-baseline CSAR data, which can be time-consuming and expensive in terms of hardware requirements. Additionally, this technology is associated with complex imaging algorithms and often exhibits low processing efficiency.
E. Dungan, from the American Air Force Research Laboratory (AFRL), has proposed a 3D image reconstruction method of vehicle contour based on single-baseline fully polarimetric CSAR data [19]. Compared to HoloSAR imaging [20], this method has the advantage of requiring only single-baseline fully polarimetric CSAR data. This significantly reduces the cost of acquiring 3D images and simplifies the imaging algorithm, leading to improved processing efficiency. The use of single-baseline fully polarimetric CSAR data allows for the acquisition of meaningful information with fewer data points, reducing the hardware and computational costs associated with data collection and processing. Additionally, the simplified imaging algorithm used in this method reduces the complexity of the reconstruction process, resulting in faster processing times and decreased computational resources required. However, this method rectangles the vehicle contour to form a multi-dimensional variable search process, which greatly increases the amount of calculation, reduces the efficiency of the algorithm. Also, this method weakens the contour features of the target vehicle, and it is not conducive to the subsequent vehicle classification and recognition. Although this method does not require multi-baseline CSAR data, it requires a variety of polarized CSAR data, which leads to an increase in the amount of computation and a high cost of 3D image reconstruction.
L. Chen, from the National University of Defense Technology, has proposed a 3D image reconstruction method of vehicle contours based on single baseline single polarization CSAR data [21]. This method starts from the incoherent imaging processing, the basic contour information is extracted based on the two-dimensional (2D) image of the vehicle, and then the height information of the scattered points of the attribute is deduced by using the “top–bottom shifting” effect, and then the 3D contour image of the target vehicle is reconstructed. Also, this method obtains high-precision vehicle size estimation results and has the unique advantages of high efficiency and low cost. However, the method introduces the ratio of the underbody profile to the roof profile as a priori information, and does not extract the multi-layer profiles of the vehicle.
In order to solve the above problems, this paper proposes a new method to extract information and 3D contour reconstruction of vehicle target, based on multiple different pitch-angle observation CSAR data. The research content of this paper is as follows: Section 2 researches the distribution characteristics of the electromagnetic reflection model of the vehicle target, and the 2D CSAR imaging characteristics of the vehicle target at different pitch-angle observations. Section 3 provides a detailed description of the proposed method for 3D reconstruction of vehicle target contours. In Section 4, the civilian vehicle dome (CVDomes) simulation dataset is used to verify the correctness of the theoretical analysis and the effectiveness of the proposed method. Finally, the research work of this paper is summarized, and the next research work is prospected in Section 5.
2. Vehicle Scattering Model
This section begins by analyzing the scattering characteristic models of radar electromagnetic wave odd-bounce reflection and even-bounce reflection of the vehicle targets under far-field conditions. Then, an analysis of the 2D CSAR imaging features of vehicle targets at multiple different pitch-angle observations is presented.
According to the electromagnetic theory, the high-frequency echo response of a complex target can be regarded as the sum of the attribute scattering centers of multiple standard scatterers [22]. The attribute scattering center contains relevant information such as the position, amplitude, and polarization of the target, which can better describe the scattering characteristics of the target on the SAR data.
2.1. Odd-Bounce Reflection
Figure 1 shows the “top–bottom shifting” model of the vehicle target and the backscattering of electromagnetic waves, and the electromagnetic echoes reflected by the vehicle target are mainly divided into odd-bounce reflection (blue lines in Figure 1) and even-bounce reflection (orange lines in Figure 1). Among them, odd-bounce reflection refers to the electromagnetic echo that returns to the antenna after an odd number of bounce reflection, mainly provided by the edges and corners of the vehicle target (such as the roof ridge, etc.). The edges and corners of the vehicle target are the height dimensional information with the vehicle target, which can form the 3D contour of the vehicle.
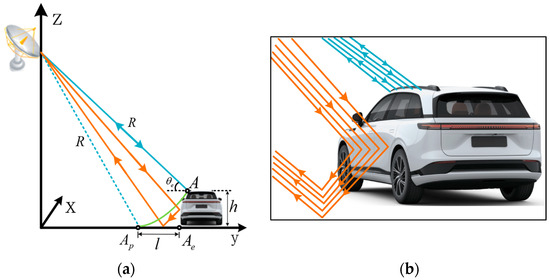
Figure 1.
The “top–bottom shifting” model of a vehicle target and the backscattering of electromagnetic waves: (a) Schematic diagram of the calculation of the “top–bottom shifting” of odd-bounce reflection; (b) schematic diagram of odd-bounce reflection (orange lines) and even-bounce reflection (blue lines) backscattering.
As shown in Figure 1a, when the ground plane is used as the imaging plane, the distance from the point A to the radar platform is , the height from the point A to the imaging plane is , and the pitch angle represents the observation angle from the radar to the point A. During imaging, the point A is projected onto the imaging plane . This shift in the position of the projection, which is caused by the height of focus, is called the “layover effect” [23]. The “top–bottom shifting” distance is , the slope distance from the antenna phase center to the target is , if is much smaller than , that is , this corresponds to the far-field condition. Then, the height of the point A to the ground plane is:
Therefore, starting from the CSAR 2D image of the vehicle, the edge position of the image of the vehicle ridge is obtained, which is the position of the odd-bounce reflected bright line. The shifting distance of the top and bottom of the ridge can be obtained, and then the height of the ridge and its position coordinates are calculated.
2.2. Even-Bounce Reflection
Figure 2 shows the even-bounce reflection geometry path. Even-bounce reflection refers to the secondary bounce reflection of electromagnetic waves emitted by radar antennas and finally return to the receiving antenna [24]. The even-bounce reflection path can be assumed to consist of three parts, including the outbound , the first bounce reflection , and the second bounce reflection . is the pitch angle from the radar to the point A. When the incident wave passes through the outbound journey and reaches a certain scattering center with a height of the vehicle, there is a scattering angle between the first bounce reflection and the specular reflection angle . generates a second bounce reflection through specular reflection with the ground, and subsequently returns to the receiving antenna. It is worth noting that and are not the only path, vary within the orange shaded area, as shown in Figure 2.
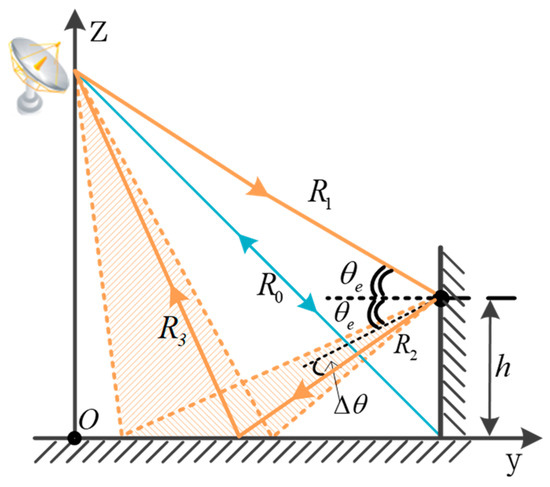
Figure 2.
Geometry of the even-bounce reflection.
For a vehicle target parked on the flat ground, the side of the vehicle forms a dihedral reflection with the ground, the dihedral reflection is directional, and its reflected energy is concentrated in the vertical direction. The projection of the even-bounce reflected energy can be thought of as a distribution along the junction between the ground and the side of the vehicle, i.e., the distribution of the basic contour of the underside of the vehicle. Although the even-bounce reflection has undergone the secondary bounce reflection of different medium planes, the energy of the reflected echo is relatively large, due to the large reflection surface of the vehicle target. And the even-bounce reflection appears as a relatively bright and thick closed rectangular frame on the 2D CSAR image [25].
Figure 3 shows the vehicle CSAR imaging results at different pitch-angle observations. As shown in Figure 3d,e, there are scattered centers of discrete properties formed by even-bounce reflection in the vicinity of the vehicle contour. Due to the “top–bottom shifting” effect, the odd-bounce reflection forms an outer contour outside the vehicle’s baseline, and as the pitch angle of the radar increases, the image of vehicle edge expands outward more.
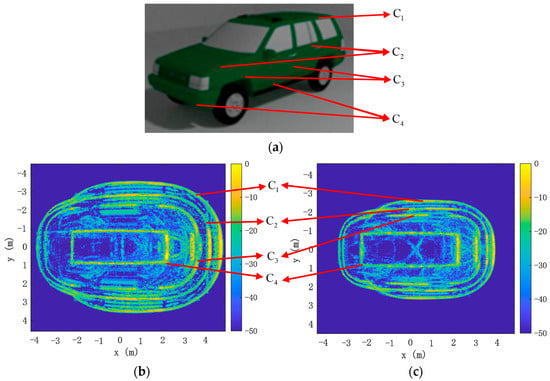
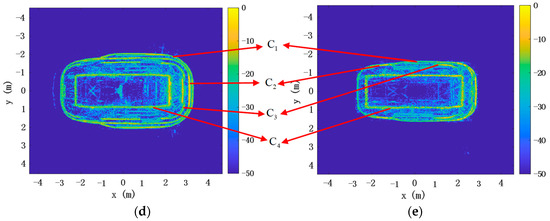
Figure 3.
Simulated vehicle model and 2D CSAR images of the vehicle at different pitch-angle observations: (a) Photographs of simulated vehicle Jeep93; (b) 2D CSAR images of vehicles with the pitch angle of 60 degree; (c) 2D CSAR images of vehicles with the pitch angle of 50 degree; (d) 2D CSAR images of vehicles with the pitch angle of 40 degree; (e) 2D CSAR image of a vehicle with the pitch angle of 30 degree (the unit of the colorbar is dB).
2.3. CSAR Image Characteristics of the Vehicle Target at Different Pitch-Angle Observations
In the CSAR data of HH polarization, the reflected energy of the dihedral angle is larger and the contour is clearer, so the HH polarization is used in this method [26,27,28,29]. Due to the lower side lobes of coherent imaging, which is more conducive to extracting the edge of the vehicle, the proposed method chooses to process the coherent imaging. This method extracts the inner even-bounce reflection contour and the outer odd-bounce reflection contour of the vehicle from the CSAR image at the same time. Subsequently, the basic contour of the vehicle bottom is obtained from the even-bounce reflection, and the 3D contour of the vehicle with height information is obtained from the odd-bounce reflection. The proposed method makes full use of the data at 30°, 40°, 50° and 60° observation pitch angles, and the angle of view is more comprehensive, the extracted vehicle target information is richer, and the error of information extraction is smaller.
As can be seen from Figure 3, the body and the edge of the vehicle will form four relatively distinct curves. From the inside to the outside, the first curve is the top contour curve of the vehicle, which is composed of a circle of roof covers, and it is the highest, at about 1.63 m. The second curve, , is the second layer of the vehicle formed by the door handle and the front cover, and its ridge curve is the second highest, at about 1.01–1.16 m. The third curve, , is the curve formed at the top of the wheel, the defect position is the position of the wheel, and its height is the third highest, at about 0.64–0.68 m. The fourth closed curve is the imaging result of the dihedral angle formed between the body and the ground, which is the imaging result of the even-bounce reflection of electromagnetic waves. As a result, curve closely approximates a rectangular frame, capturing the basic contours of the vehicle body. The imaging position of curve is almost unchanged under different pitch-angle observations.
When the ridge is higher, the observed pitch-angle is larger, which will lead to a greater distance of the top-bottom shifting. Therefore, the image of the target vehicle in pitch-angle of 60 expends more than in pitch angle of 50, as shown in Figure 3b,c. When the pitch angle of observation is 30 degrees, the top–bottom shifting distance of the ridge is relatively small, so the first curve, , and the second curve, , coincide multiple times.
3. Information Extraction and 3D Contour Reconstruction
Based on the “top–bottom shifting” effect, a novel approach that exploits the projection imaging relationship between different pitch-angle observations under the same polarization is proposed to extract the 3D contour of the vehicle target.
3.1. Overall Framework
Firstly, coherent processing is used to generate CSAR vehicle images. The complete 360° total aperture data is divided into every 1° sub-aperture aperture without overlap. To achieve high-resolution and low side lobes in CSAR vehicle 2D images, the back projection algorithm (BPA) is employed, which is capable of adapting to the CSAR geometry [30,31]. Additionally, GPU acceleration is utilized for improved efficiency. Due to its lower sidelobes and ability to provide more detailed target imaging, coherent accumulation is performed to obtain a CSAR coherent image of the vehicle under consideration.
Secondly, the CSAR 2D image is converted to the polar coordinates. Since the CSAR image is a 360-degree surround image, the image of the vehicle’s body and edges will be closed curves. In order to facilitate the extraction of contour curves, four sets of 2D CSAR images with multiple different pitch angles are transformed to polar coordinates, with the center of the image as the pole. The vehicle contour is changed from planar curves to a one-dimensional curve, so that the contour extraction and subsequent curve processing are easier.
Finally, the scattering points are obtained. Using the peak detection method, the odd-bounce reflection and even-bounce reflection scattering points of the four profile curves are extracted. As shown in Figure 4, the CSAR 2D image at the 60-degree pitch observation is transformed to polar coordinates, and the results (red dots in Figure 4) are extracted from odd-bounce and even-bounce reflection scattering points using the peak detection method. In Figure 4a, the leftmost red dots are the even-bounce reflection scattering points, and the other red dots are the odd-bounce reflection scattering points. And in Figure 4b, the scattering points that approximately make up the rectangular box inside are the even-bounce reflection scattering points; the three curves on the outside are the odd-bounce reflection scattering points.
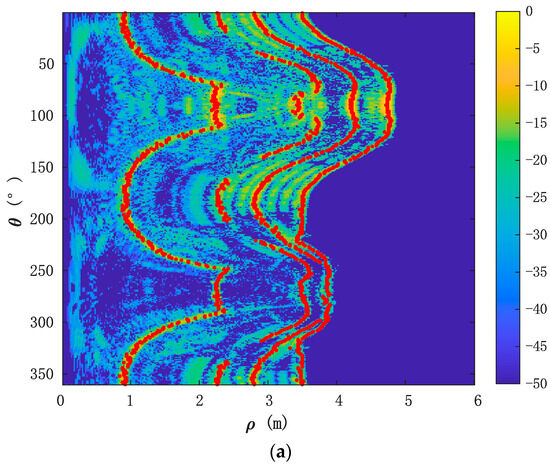
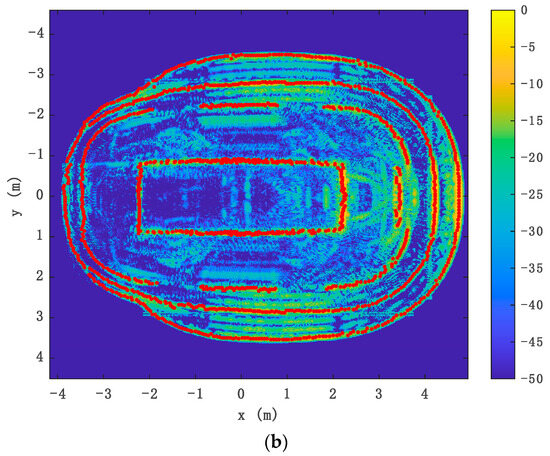
Figure 4.
Extraction results of scattering points at the 60-degree pitch-angle observation (vehicle Jeep93): (a) The extraction result of the scattering points in polar coordinates; (b) the extraction result of the scattering points in Cartesian coordinates (the unit of the colorbar is dB).
3.2. Contour Extraction of Even-Bounce Reflection
After converting the CSAR 2D image to the polar coordinates, the basic contour of the vehicle consisting of the even-bounce reflection scattering points is extracted in the following two steps.
Step 1: Smooth filtering of even-bounce scatter points. The side of the vehicle forms a vertical dihedral angle with the ground. The reflected echo of this vertical dihedral angle remains relatively unchanged as the pitch observation angles vary. As a result, the imaging position of the even-bounce scattered bright line shows minimal variation at top view observation angles of 30°, 40°, 50°, and 60°. As shown in Figure 3b–e, the position of the rectangle in the center of the four images, i.e., the even-bounce scattering light line, is basically unchanged.
In our method, the even-bounce scattering points obtained from four pitch-angle observations are used for mean filtering and smoothing. In Figure 5a, the extracted results are obtained by applying mean filtering and smoothing to the even-bounce reflection scattering points. These results form the 2D projection of the even-bounce reflection contour, specifically representing the 2D projection of the basic contour of the vehicle body, from which the geometric feature parameters such as orientation, length, and width of the vehicle can be extracted.
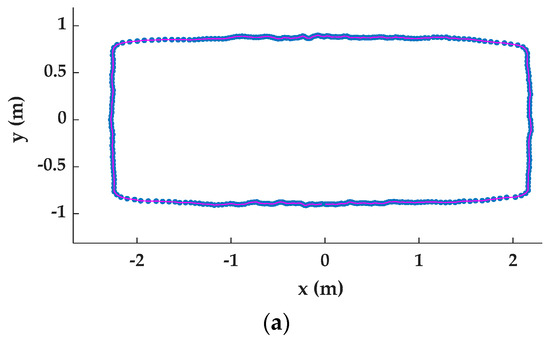
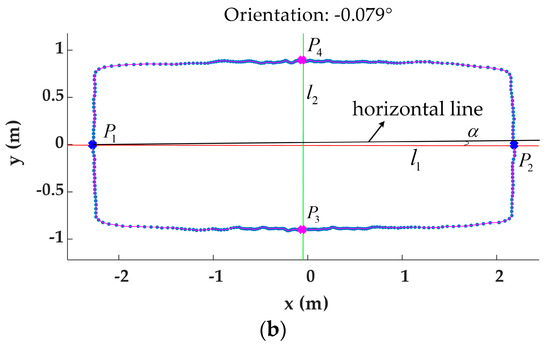
Figure 5.
The results of the processing of the vehicle even-bounce reflection contour and the calculation of the length and width of the vehicle body (vehicle Jeep93): (a) The results of the even-bounce reflection scattering points extraction after the mean filtering smoothing process; (b) the results of extracting geometric feature parameters of the vehicle.
Step 2: Extract and calculate the geometric parameters of the vehicle body. According to the projection of the basic contour of the vehicle body obtained in step 1 on the 2D CSAR imaging plane, the principal axis direction is estimated by calculating the covariance matrix of the projection matrix. The principal axis direction represents the direction of the closed surface, and refers to the major axis direction of the basic outline of the vehicle body projection. By determining the intersection angle between the major axis and the -axis of the ellipse with the same standard second-order central moment as the basic outline of the vehicle body projection, the orientation angle is obtained. represents the angle between the orientation of the vehicle and the horizontal line.
Then, a straight line is calculated, which passes through the projection of the basic outline of the vehicle body and has an inclination angle . Next, the intersection points and of the straight line with the contour of the vehicle are obtained. Subsequently, the perpendicular bisector connecting and is found. Later, the intersection points and of , and the projection of the basic contour of the vehicle body, are obtained.
The distance between and is the length of the vehicle body, and the distance between and is the width of the vehicle body. As shown in Figure 5b, the results are extracted for the geometric feature parameters such as orientation, length, and width of the vehicle. As shown in Figure 5b, the orientation of the vehicle is −0.079 degree with the horizontal line; the width and the length of the Jeep93 are 4.462 m and 1.796 m, respectively.
3.3. Contour Extraction of Odd-Bounce Reflection
Under different pitch-angle observations, the projection position shift will be different for imaging vehicle targets at a certain height, due to the “top–bottom shifting” effect. According to the odd-bounce reflection model in Section 2.1, there are:
where, is the height of the vehicle ridge, which can be the different parts of the vehicle, including the front, rear, and sides. , , and correspond to values of 30, 40, 50, and 60 degrees, meaning the pitch-angle of radar observation are 30, 40, 50, and 60 degrees, respectively. is the propagation distance of the “top–bottom shifting” in the 2D CSAR image at the 30~60 degree pitch-angle observations. are the coordinate position of the vehicle ridge contour in the 2D CSAR image at the 30~60 degree pitch observation angles. And is the actual coordinate position of the simulated vehicle model.
By simultaneously solving Equations (2)–(5), we obtain
The value range of is [2, 4] and the value range of is [1, 3]. There are six combinations of the above equation and the average of the results of these six calculations can be used to obtain the height of the vehicle edge. Returning to Equations (2)–(5), the coordinate position of the vehicle’s rib contour can be obtained.
Therefore, after converting the CSAR 2D image to the polar coordinates, the curves composed of three odd-bounce reflection scattering points need to be extracted, namely , and in Figure 3. Then, according to the different vehicle contour extensions in the two-dimensional CSAR image of the radar at the 30–60 degree pitch angle, the corresponding vehicle ridge height and its position coordinates of each contour curve are calculated by the joint relationship Equations (2)–(6).
The proposed method makes full use of different pitch-angle observations and uses multiple formulas to jointly calculate several times. It takes the average value to reduce the error and improves the accuracy of information extraction.
3.4. 3D Reconstruction of Vehicle Contour
From the above analysis, it can be seen that the roof contour containing height information can be extracted from the odd-bounce reflection. The position coordinates of the basic vehicle body contour consisting of the even-bounce reflection is obtained by the method shown in Section 3.2. Using the method in Section 3.3, the height of the vehicle ridge and its position coordinates composed of odd-bounce reflection can be obtained.
In the processing of fusing the basic vehicle body contour, the height of the vehicle ridge and its position coordinates, the base is the basic vehicle body contour, whose coordinate is zero in the coordinate system. And the position coordinates of the vehicle ridge is in the same coordinate system, whose coordinate is its height. Therefore, the whole contour of the vehicle can be reconstructed.
Based on the above analysis, the flow chart of the 3D contour reconstruction method of the vehicle target is shown in Figure 6. Firstly, the GPU-accelerated BPA is used to process the echo data for imaging, and the 2D CSAR images of the vehicle target to be reconstructed under four sets of different pitch-angle observations are obtained. Then, the polar coordinate transformation of the CSAR 2D image of the vehicle target is performed to extract the odd-bounce reflection and even-bounce reflection scattering points of the vehicle target. On the one hand, the scattering points formed by the even-bounce reflection are used to extract the basic contour of the vehicle body, and the geometric parameters such as the length and width of the vehicle. On the other hand, according to the “top–bottom shifting” model, the scattering points formed by the odd-bounce reflection are used to extract the height and position of the ridge. Finally, the basic contour of the vehicle body, as well as the height and position of the ridge, are fused to realize the reconstruction of the 3D contour of the vehicle.
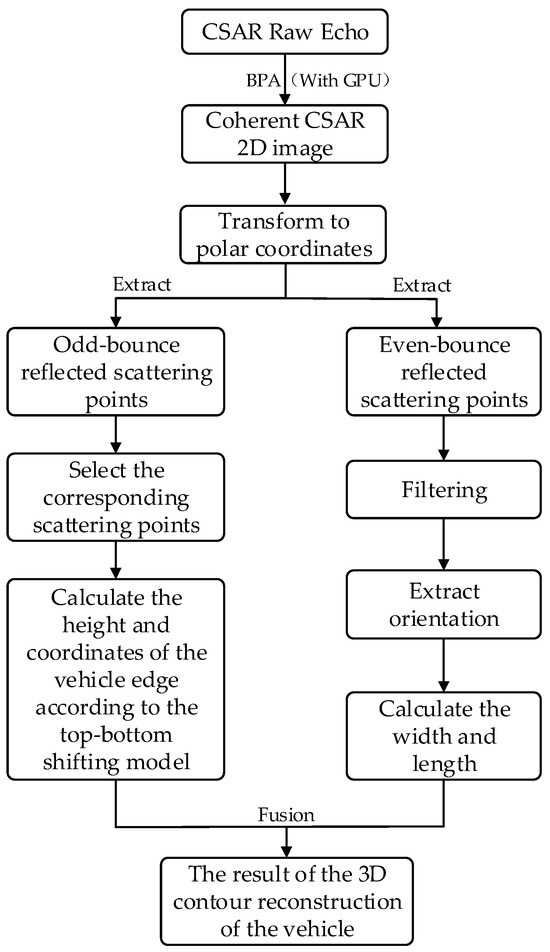
Figure 6.
Flow diagram of the 3D contour reconstruction of the vehicle target.
4. Experiment and Analysis
Civilian vehicle domes (CVDomes)—a dataset of simulated X-band signatures of civilian vehicles is generated for 360° in azimuth direction [32]. The CVDomes dataset consists of simulation data with different pitch angles ranging from 30°~60°. The main parameters of the CVDomes dataset are shown in Table 1.

Table 1.
The main parameters of CVDomes dataset.
In order to prove the effectiveness of the proposed 3D contour reconstruction and information extraction method based on CSAR data for the vehicle target, the echo data processing of vehicles in CVDomes dataset is used to verify it. The vehicles Jeep93 and Jeep99 are processed using the proposed method; the results are shown in Figure 7 and Figure 8, and Table 2 and Table 3.
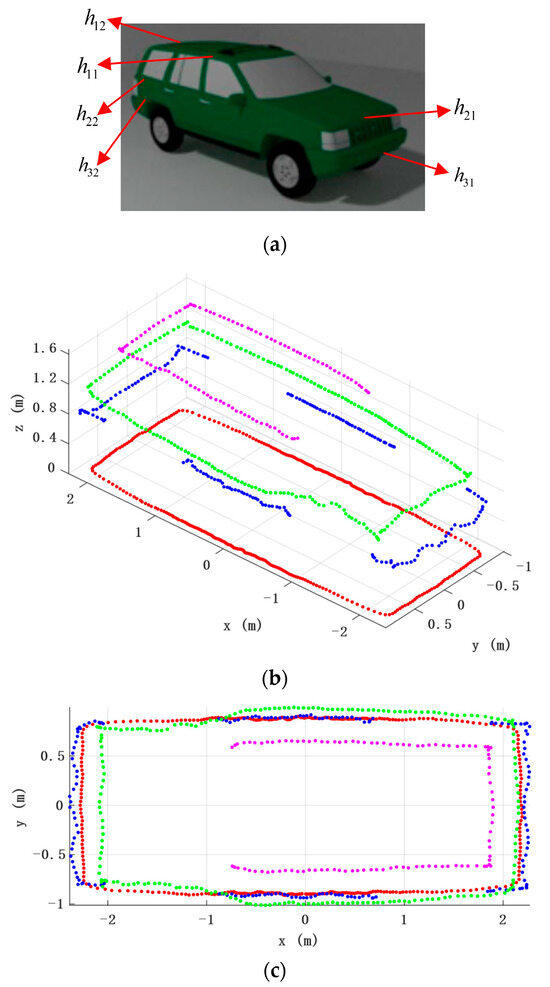
Figure 7.
3D contour reconstruction results of vehicle target Jeep93: (a) Photographs of simulated vehicle Jeep93; (b) 3D contour reconstruction results in 3D vision, the scattering points of the same color are the curves extracted from the same layer; (c) top view of the result of the 3D contour reconstruction of the vehicle.
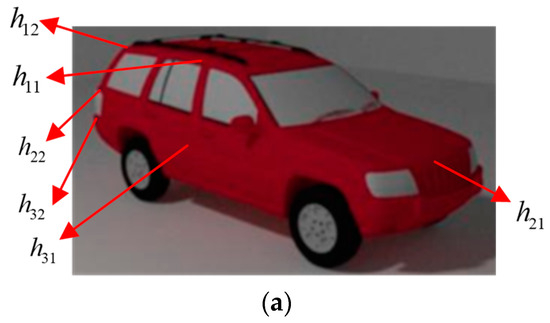
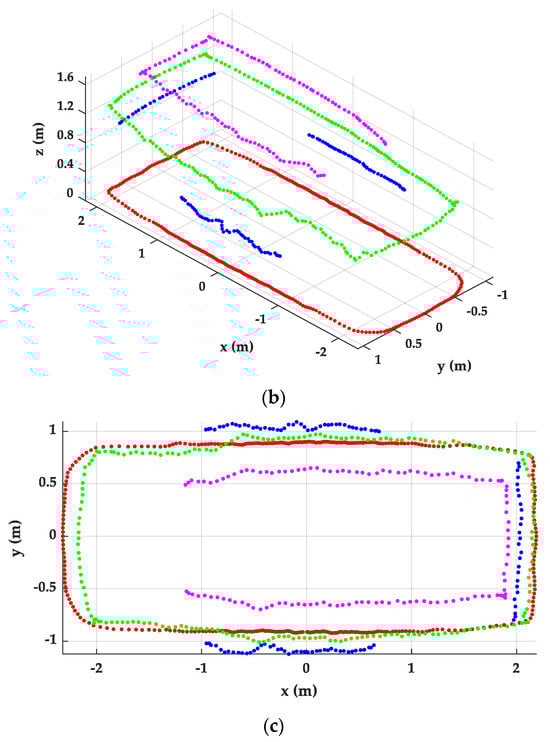
Figure 8.
3D contour reconstruction results of vehicle target Jeep99: (a) Photographs of simulated vehicle Jeep99; (b) 3D contour reconstruction results in 3D vision. The scattering points of the same color are the curves extracted from the same layer; (c) top view of the result of the 3D contour reconstruction of the vehicle.
Table 2.
Comparison of the geometric dimensions of the vehicle model Jeep93 with the estimation results of the proposed method, and comparison with paper [21] (unit: mm).
Table 3.
Comparison of the geometric dimensions of the vehicle model Jeep99 with the estimation results of the proposed method, and comparison with paper [21] (unit: mm).
As shown in Figure 7a and Figure 8a, is the height of the side edge of the first vehicle prism curve (contours of the vehicle roof). is the height of the rear edge of the first vehicle prism curve. is the height of the front cover of the second vehicle prism curve. is the height of the rear part of the second vehicle prism curve. is the height of the front of the vehicle for the third prism curve (i.e., the curve at the top of the wheel). is the height of the rear end of the third rim.
The method we propose can extract the multi-layered contours of the vehicle. Figure 7b and Figure 8b display points in four different colors. Points of the same color are the result of contour reconstruction of the same layer. The purple points represent the layer where and are located, which is the highest layer. The green points represent the layer where and are located. The blue points represent the layer where and are located. The red points represent the basic contours of the vehicle, which includes information such as the length and width of the vehicle.
As shown in Figure 7 and Figure 8, the proposed method effectively reconstructs the 3D contour of vehicles. The electromagnetic simulation dataset CVDomes used in this study had minimal external interference, and the signal bandwidth was extremely wide with high resolution. As a result, the reconstructed contours were found to be clear, smooth, and highly similar to the original model. The contour of the front of the vehicle is more rounded, closer to the real contour of the simulated vehicle model.
Table 2 and Table 3 show a comparison of the geometric dimensions of the vehicle models Jeep93 and Jeep99, with the estimation results of the proposed method, as well as the comparison with paper [21]. Where, and are the length and width of the vehicle body, respectively. is the sum of the error between the true value and the estimated value.
From Table 2 and Table 3, comparing the length, width, and height of the extracted vehicle between the simulation model and the proposed method, it can be observed that the parameters are remarkably close, indicating the accuracy of the proposed method. Overall, compared with the results in paper [21], the proposed method extracts the clearer multi-layer contour of the vehicle target, and exhibits higher accuracy.
5. Conclusions
This paper focuses on the problem of vehicle target information extraction and 3D contour reconstruction under CSAR 2D imaging, and then proposes a method by analyzing the CSAR image characteristics of the target vehicle under multiple different radar pitch-angle observations. The proposed method creatively utilizes the projection relationship of a vehicle in 2D CSAR imaging to reconstruct the 3D contour of the vehicle, without prior information. The basic contour of the vehicle body is extracted from the even-bounce reflection scattering points, and the height and position information of the vehicle ridge is extracted from the odd-bounce reflection points. Finally, the 3D contour of the vehicle can be reconstructed by fusing the vehicle body and the height and position of the vehicle ridge. The proposed method is applied to the reconstruction of CSAR simulation dataset, the high-quality 3D contour of the vehicle and high-precision vehicle size estimation results are obtained, which proves the correctness and effectiveness of this method.
The research results in this paper lay a foundation for future research on the target classification and recognition technology based on CSAR images, which have important practical value. By utilizing the reconstructed 3D contour, more accurate vehicle dimension information can be obtained, which is useful in areas such as vehicle industrial design, traffic planning and road safety. Additionally, the reconstructed 3D contour can be used for vehicle target detection and tracking, which is beneficial for fields like autonomous driving, traffic safety monitoring and smart transportation. The follow-up research is the high-precision imaging of bistatic CSAR, and the targets’ classification and recognition after the 3D reconstruction of targets.
Author Contributions
Conceptualization, J.Z. and H.X.; methodology, J.Z. and H.X.; software, J.Z. and H.X.; validation, J.Z. and H.X.; formal analysis, J.Z. and H.X.; investigation, J.Z. and H.X.; resources, H.X. and Z.L.; data curation, H.X. and L.Z.; writing—original draft preparation, J.Z. and H.X.; writing—review and editing, J.Z., H.X., L.Z. and Z.L.; visualization, J.Z. and H.X.; supervision, H.X. and L.Z.; project administration, H.X. and L.Z.; funding acquisition, H.X., L.Z. and Z.L. All authors have read and agreed to the published version of the manuscript.
Funding
This research was co-supported by the Guangdong Basic and Applied Basic Research Foundation (Grants No. 2023A1515011588 and No. 2021A1515010768), the Shenzhen Science and Technology Program (Grant No. 202206193000001, 20220815171723002), the Beijing Nova Program (Grant No. Z201100006820103), the National Natural Science Foundation of China (Grant No. 62001523, No. 62203465, No. 62201614 and No. 6210593) and the Fundamental Research Funds for the Central Universities, Sun Yat-sen University (Grant No. 23lgpy45). Hongtu Xie is the corresponding author.
Data Availability Statement
The data presented in this study is available in: https://www.sdms.afrl.af.mil/content/public-data/s3_scripts/index.php?file=Civilian-Vehicle-SampleSet.zip, (accessed on 19 December 2023).
Acknowledgments
The authors would like to thank the editors and reviewers for their very competent comments and helpful suggestions to improve this paper. Moreover, the authors would like to thank the American Air Force Research Laboratory (AFRL) for providing the CSAR data.
Conflicts of Interest
The authors declare no conflicts of interest.
References
- Xie, H.; An, D.; Huang, X.; Zhou, Z. Efficient Raw Signal Generation Based on Equivalent Scatterer and Subaperture Processing for One-Stationary Bistatic SAR Including Motion Errors. IEEE Trans. Geosci. Remote Sens. 2016, 54, 3360–3377. [Google Scholar] [CrossRef]
- Zhu, J.; Chu, N.; Song, Y.; Yi, S.; Wang, X.; Huang, X.; Moran, B. Alternative signal processing of complementary waveform returns for range sidelobe suppression. Signal Process. 2019, 159, 187–192. [Google Scholar] [CrossRef]
- Hu, X.; Xie, H.; Zhang, L.; Hu, J.; He, J.; Yi, S.; Jiang, H.; Xie, K. Fast Factorized Backprojection Algorithm in Orthogonal Elliptical Coordinate System for Ocean Scenes Imaging Using Geosynchronous Spaceborne-Airborne VHF UWB Bistatic SAR. Remote Sens. 2023, 15, 2215. [Google Scholar] [CrossRef]
- Zhu, J.; Peng, C.; Zhang, B.; Jia, W.; Xu, G.; Wu, Y.; Hu, Z.; Zhu, M. An Improved Background Normalization Algorithm for Noise Resilience in Low Frequency. J. Mar. Sci. Eng. 2021, 9, 803. [Google Scholar] [CrossRef]
- Dungan, K.E. Vehicle detection in wide-angle SAR. In Algorithms for Synthetic Aperture Radar Imagery XXIII; SPIE: Bellingham, WA, USA, 2016. [Google Scholar]
- Gianelli, C.D.; Xu, L. Focusing, imaging, and ATR for the Gotcha 2008 wide angle SAR collection. In Algorithms for Synthetic Aperture Radar Imagery XX; SPIE: Bellingham, WA, USA, 2013; Volume 8746, pp. 174–181. [Google Scholar]
- Dungan, K.E.; Nehrbass, J.W. Wide-area wide-angle SAR focusing. IEEE Aerosp. Electron. Syst. Mag. 2014, 29, 21–28. [Google Scholar] [CrossRef]
- Li, D.; Wei, G.; Sun, B.; Wang, X. Recursive Sidelobe Minimization Algorithm for Back-Projection Imaging of Impulse-Based Circular Synthetic Aperture Radar. IEEE Geosci. Remote Sens. Lett. 2020, 17, 1732–1736. [Google Scholar] [CrossRef]
- Saville, M.A.; Jackson, J.A.; Fuller, D.F. Rethinking vehicle classification with wide-angle polarimetric SAR. IEEE Aerosp. Electron. Syst. Mag. 2014, 29, 41–49. [Google Scholar] [CrossRef]
- Feng, D.; An, D.; Wang, J.; Chen, L.; Huang, X. A Focusing Method of Buildings for Airborne Circular SAR. Remote Sens. 2024, 16, 253. [Google Scholar] [CrossRef]
- Chen, L.; An, D.; Huang, X. Resolution Analysis of Circular Synthetic Aperture Radar Noncoherent Imaging. IEEE Trans. Instrum. Meas. 2020, 69, 231–240. [Google Scholar] [CrossRef]
- Palm, S.; Oriot, H.M.; Cantalloube, H.M. Radargrammetric DEM Extraction Over Urban Area Using Circular SAR Imagery. IEEE Trans. Geosci. Remote Sens. 2012, 50, 4720–4725. [Google Scholar] [CrossRef]
- Jia, G.; Buchroithner, M.F.; Chang, W.; Liu, Z. Fourier-based 2-D imaging algorithm for circular synthetic aperture radar: Analysis and application. IEEE J. Sel. Top. Appl. Earth Obs. Remote Sens. 2016, 9, 475–489. [Google Scholar] [CrossRef]
- Nan, Y.; Huang, X.; Guo, Y.J. An Universal Circular Synthetic Aperture Radar. IEEE Trans. Geosci. Remote Sens. 2022, 60, 5601920. [Google Scholar] [CrossRef]
- Austin, C.D.; Ertin, E.; Moses, R.L. Sparse multipass 3D SAR imaging: Applications to the Gotcha data set. In Algorithms for Synthetic Aperture Radar Imagery XVI; SPIE: Bellingham, WA, USA, 2009; Volume 7337, p. 733703. [Google Scholar]
- Ferrara, M.; Jackson, J.A.; Austin, C. Enhancement of multi-pass 3D circular SAR images using sparse reconstruction techniques. In Algorithms for Synthetic Aperture Radar Imagery XVI; SPIE: Bellingham, WA, USA, 2009; Volume 7337, p. 733702. [Google Scholar]
- Jiang, Y.; Deng, B.; Wang, H.; Zhuang, Z.; Wang, Z. Raw Signal Simulation for Multi-Circular Synthetic Aperture Imaging at Terahertz Frequencies. IEEE Geosci. Remote Sens. Lett. 2020, 17, 377–380. [Google Scholar] [CrossRef]
- Luo, Y.; Chen, S.W.; Wang, X.S. Manmade-Target Three-Dimensional Reconstruction Using Multi-View Radar Images. In Proceedings of the IGARSS 2022—2022 IEEE International Geoscience and Remote Sensing Symposium, Kuala Lumpur, Malaysia, 17–22 July 2022; pp. 3452–3455. [Google Scholar]
- Dungan, K.E.; Potter, L.C. 3-D imaging of vehicles using wide aperture radar. IEEE Trans. Aerosp. Electron. Syst. 2011, 47, 187–200. [Google Scholar] [CrossRef]
- Feng, D.; An, D.; Chen, L.; Huang, X. Holographic SAR Tomography 3-D Reconstruction Based on Iterative Adaptive Approach and Generalized Likelihood Ratio Test. IEEE Trans. Geosci. Remote Sens. 2021, 59, 305–315. [Google Scholar] [CrossRef]
- Chen, L.; An, D.; Huang, X.; Zhou, Z. A 3D Reconstruction Strategy of Vehicle Outline Based on Single-Pass Single-Polarization CSAR Data. IEEE Trans. Image Process. 2017, 26, 5545–5554. [Google Scholar] [CrossRef] [PubMed]
- Potter, L.C.; Moses, R.L. Attributed scattering centers for SAR ATR. IEEE Trans. Image Process. 1997, 6, 79–91. [Google Scholar] [CrossRef] [PubMed]
- Jakowatz, C.V.; Wahl, D.E.; Eichel, P.H.; Ghiglia, D.C.; Thompson, P.A. Spotlight-Mode Synthetic Aperture Radar: A Signal Processing Approach; Springer Science & Business Media: Berlin/Heidelberg, Germany, 1996. [Google Scholar]
- Skolnik, M.I. Radar Handbook, 3rd ed.; McGraw-Hill: New York, NY, USA, 2008; pp. 16.7–16.10. [Google Scholar]
- Fung, A.K. Theory of cross polarized power returned from a random surface. Apply Sci. Res. 1967, 18, 50–60. [Google Scholar] [CrossRef]
- Peng, X.; Tan, W.; Hong, W.; Jiang, C.; Bao, Q.; Wang, Y. Airborne DLSLA 3-D SAR Image Reconstruction by Combination of Polar Formatting and L1 Regularization. IEEE Trans. Geosci. Remote Sens. 2016, 54, 213–226. [Google Scholar] [CrossRef]
- Ponce, O.; Prats, P.I.; Pinheiro, M.; Rodriguez, M.; Scheiber, R.; Reigber, A.; Moreira, A. Fully Polarimetric High-Resolution 3-D Imaging with Circular SAR at L-Band. IEEE Trans. Geosci. Remote Sens. 2014, 52, 3074–3090. [Google Scholar] [CrossRef]
- Zyl, J.V.; Kim, Y. Synthetic Aperture Radar Polarimetry; John Wiley & Sons: Hoboken, NJ, USA, 2011. [Google Scholar]
- Ponce, O.; Prats, P.; Scheiber, R.; Reigber, A.; Hajnsek, I.; Moreira, A. Polarimetric 3-D imaging with airborne holographic SAR tomography over glaciers. In Proceedings of the 2015 IEEE International Geoscience and Remote Sensing Symposium (IGARSS), Milan, Italy, 26–31 July 2015; pp. 5280–5283. [Google Scholar]
- Chen, L.; An, D.; Huang, X. A Backprojection Based Imaging for Circular Synthetic Aperture Radar. IEEE J. Sel. Top. Appl. Earth Obs. Remote Sens. 2017, 10, 3547–3555. [Google Scholar] [CrossRef]
- Xie, H.; Shi, S.; An, D.; Wang, G.; Wang, G.; Xiao, H.; Huang, X.; Zhou, Z.; Xie, C.; Wang, F.; et al. Fast Factorized Backprojection Algorithm for One-Stationary Bistatic Spotlight Circular SAR Image Formation. IEEE J. Sel. Top. Appl. Earth Obs. Remote Sens. 2017, 10, 1494–1510. [Google Scholar] [CrossRef]
- Dungan, K.E.; Austin, C.; Nehrbass, J.; Potter, L. Civilian vehicle radar data domes. In Algorithms for Synthetic Aperture Radar Imagery XVII; SPIE: Bellingham, WA, USA, 2010; Volume 7699, p. 76990P. [Google Scholar]
Disclaimer/Publisher’s Note: The statements, opinions and data contained in all publications are solely those of the individual author(s) and contributor(s) and not of MDPI and/or the editor(s). MDPI and/or the editor(s) disclaim responsibility for any injury to people or property resulting from any ideas, methods, instructions or products referred to in the content. |
© 2024 by the authors. Licensee MDPI, Basel, Switzerland. This article is an open access article distributed under the terms and conditions of the Creative Commons Attribution (CC BY) license (https://creativecommons.org/licenses/by/4.0/).