Abstract
The impact of extreme climate events on vegetation growth and ecosystem function has garnered widespread attention, particularly in plateau regions, which are facing increasingly severe environmental pressures. This study employs the Events Coincidence Analysis (ECA) method to examine the impacts of extreme climate events on the Net Primary Productivity (NPP) of vegetation in plateau regions. Specifically, we focus on the unique phenomenon of asymmetric daytime and nighttime warming and evaluate the compounding effect of extreme precipitation with extreme temperature events. The results indicate that grassland NPP has higher overall sensitivity and Coincidence Rates (CR) to extreme precipitation events compared to extreme temperature events. Specifically, extreme drought events significantly negatively impact grassland NPP, and the sensitivity of NPP increases with the severity of extreme drought events. In lower elevations (<3200 m), grassland NPP shows a strong response to extreme precipitation events, with sensitivity decreasing with increasing elevation, especially for alpine meadows. Extreme high-temperature events contributed significantly to NPP in mid to high elevations (3000–5000 m). Compound extreme climate events amplify the average coincidence degree with NPP anomalies, with extreme precipitation events playing a major role in compound effects. The CR of compound climate events can reach above 0.6, reflected in the anomaly increase of NPP in temperate grasslands at higher elevations caused by compound events of extremely wet and extremely high temperatures.
1. Introduction
The rapid occurrence of climate change has become an undeniable reality [1], as evidenced by recent events such as the severe forest fires in Australia in 2019 and the hottest heat wave in history, experienced in North America in 2021, with temperatures reaching a record high of 49.6 °C in the Vancouver, Canada, area. In addition, Southern China experienced severe ecological damage in 2022 due to heavy rains that were uncommon in recent decades. These disasters continue to occur at an even more accelerated pace, posing unprecedented challenges to all aspects of forest management, water resources, agriculture, and ecosystems [2,3,4,5,6]. The uncertain nature of climate change further amplifies the potential threats that may arise. Therefore, it is imperative to develop tailored responses based on the unique characteristics of each ecosystem and natural environment, informed by a comprehensive understanding of the impacts of climate extremes on each region.
The impact of climate change on vegetation growth is most directly reflected in physiological activities such as respiration, transpiration, and photosynthesis. Currently, ecosystem vulnerability and biodiversity have become prominent topics in ecological research [7,8]. However, the impact of extreme climate events on vegetation may be more direct and significant than mean climate events [9]. For instance, the El Niño-Southern Oscillation (ENSO) caused rapid changes in African vegetation patterns [10]. At the same time, extreme temperature events significantly delayed the end of the vegetation-growing season in the Tibetan Plateau, and droughts and frosts caused significant disturbances in vegetation phenology in parts of Northern Europe [11]. These extreme events changed the dynamic balance of vegetation and carbon balance, leading to a shift from a carbon sink to a carbon source [12,13]. Asymmetric warming is also a growing concern worldwide, with plants exhibiting different growth patterns during the day and night [14]. The differences in temperature changes at different times of the day have already been shown to significantly impact vegetation activity in various ecosystems in the Northern Hemisphere [15], particularly in terms of phenology. Additionally, asymmetric warming affects ecosystem carbon balance, surface water balance, and energy balance [16,17,18]. It is, therefore, of great interest to study the details and linkages of vegetation dynamics patterns in response to different climate factors.
Choosing appropriate vegetation indices to assess the degree of climate impact on vegetation disturbance is crucial. Net Primary Productivity (NPP) is a comprehensive metric representing the net amount of carbon absorbed by plants through photosynthesis, accounting for respiratory losses. This indicator effectively characterizes overall vegetation productivity and health, serving as a fundamental representation of energy flow within ecosystems. By incorporating NPP into our study, our objective is to unveil the direct impact of extreme climate events on vegetation and reveal corresponding changes in ecosystem fundamental productivity and carbon balance. This holistic approach aligns with our broader research goals, aiming for a comprehensive understanding of the complex relationships between climate dynamics and vegetation health. It is imperative to thoroughly analyze the intricate interactions between temperature, precipitation, and NPP in our research. Temperature influences physiological processes such as photosynthesis rates and enzyme activity, while precipitation directly affects water availability, which is crucial for plant growth. Understanding the complex relationships between climate variables and NPP is vital for revealing subtle vegetation responses to changing environmental conditions. Investigating the comprehensive impacts of these climate variables, especially extreme climate events, on NPP allows for a holistic assessment of how vegetation copes with continuously evolving environmental conditions.
Given the subtle and sometimes nonlinear relationships between climate factors and NPP, employing a method that thoroughly explores their dynamic interconnections is highly effective. As a method of analysis, the complex response relationships between vegetation and climate cannot be fully explained using only the linear relationships demonstrated by the Pearson correlation analysis. The event coincidence analysis (ECA) method [19], developed in recent years to obtain more accurate response relationships, is highly regarded in terms of the impact of extreme events. This method adeptly accommodates the discrete characteristics of extreme climate events, ensuring a nuanced exploration of how climate change affects the productivity and sustainability of terrestrial ecosystems. This enriches the broader discourse on ecological resilience and adaptive strategies.
In a previous study, Baumbach et al. employed the ECA method to quantify the relationship between extreme events in vegetation and surface temperature anomalies during the daytime in Europe [20]. Fan utilized the same methodology to evaluate the impact of extreme temperature and precipitation events on various crops in South Asia [21]. However, most current studies only focus on the annual scale, which we believe is not specific enough. Therefore, we explored the monthly scale and the growing season (May–October) by simultaneously using a long time series of meteorological and vegetation data. We started by examining the effects of high and low temperatures during the day and night, respectively, to explore the characteristics of diurnal temperature effects on vegetation. Additionally, since the effects of precipitation and temperature on vegetation are simultaneous, the effects of compound extreme events are often more pronounced than those of individual extreme events. Unfortunately, compound climate events have been frequently overlooked in previous studies, posing a disadvantage to our in-depth analysis of the specific and comprehensive impacts of extreme climate events. Consequently, this aspect will be an integral part of our research, allowing us to explore and analyze the compound effects of extreme climate events on vegetation productivity.
Our research is concentrated on the ecologically sensitive plateau region, a pivotal area in our ecological conservation efforts. Conducting a comprehensive examination of the interactions between extreme climates and Net Primary Productivity (NPP) in this plateau region not only enhances our understanding of vegetation responses but also furnishes valuable insights for managing and preserving ecosystems grappling with ongoing climate change. The outcomes of this study will hold significant implications for the ecological conservation of this region and other grassland ecosystems, aiding them in adapting to the increasingly severe and intricate challenges posed by extreme climatic conditions. Ultimately, this exploration contributes to a broader scientific discourse on the impacts of climate change, ecosystem resilience, and strategies for sustainable management. Consequently, our primary research objectives are to (1) analyze the response of grassland productivity to extreme precipitation and extreme temperature events, including their compound effects; (2) explore the variation in response intensity along elevation gradients; and (3) analyze the responses of different grassland types in the plateau region to extreme climate events.
2. Materials and Methods
2.1. Study Area
Qinghai Province, situated in Northwestern China, covers a large land area of 723,000 km2 and is characterized by a diverse topography encompassing mountains, plateaus, basins, and plains. The elevation ranges between 1650 and 6860 m. The climate in Qinghai Province is predominantly characterized by two climatic zones: the semiarid alpine climate and the cold temperate semi-humid climate, which display noticeable fluctuations in temperature and precipitation levels concerning changes in elevation. In addition, with a vast coverage of grasslands in most areas of Qinghai Province, encompassing almost all grassland types found in the plateau region, this area serves as a representative of the climatic conditions in both Northwest China and the Qinghai–Tibetan Plateau [22,23]. The grassland types include temperate grasslands, alpine grasslands, alpine meadows, and desert grasslands, each displaying distinct characteristics along different altitudinal gradients (Figure 1). Thus, conducting research in this region is essential for gaining precise insights into the response patterns of grasslands to extreme climate events, particularly about changes in elevation and variations across different grassland types.
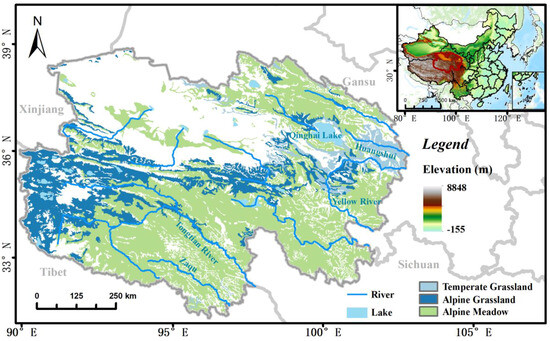
Figure 1.
Vegetation types and elevations in the study area (blank areas in the study area are non-grassland areas).
2.2. Datasets
Constrained by the available remote sensing data, specifically the commonly used MOD17A3 data, in terms of the temporal scale (post-2001), we opted to employ modeling techniques to simulate NPP data. This decision was made to extend the temporal scope to a longer period (1982–2019) and at a finer temporal resolution (monthly scale). This approach aims to enhance our analysis, allowing us to draw more accurate and universally applicable conclusions.
Therefore, the NPP data utilized in our study were derived from simulations conducted using the CASA model. The model incorporates NDVI data and DEM data, as well as precipitation, temperature, and insolation data obtained from meteorological stations. We validated the simulated NPP data using the MOD17A3 dataset (https://search.earthdata.nasa.gov/search?q=MOD17A3, accessed on 25 October 2022) and found that the overall correlation between the two datasets at all spatial points was as high as 0.83 (p < 0.01) based on multiyear averages for overlapping years (Figure 2). NDVI data were linearly fitted to MODIS data and GIMMS data to extend the study time range. DEM data were obtained from the Environmental Resources Center of the Chinese Academy of Sciences (https://www.resdc.cn/data.aspx?DATAID=284, accessed on 21 November 2022). Meteorological data were obtained from the National Meteorological Information Center of China (http://data.cma.cn/site/index.html, accessed on 24 October 2019). We then used the Anspline 1.0 software to interpolate the filtered meteorological station data into TIFF format.
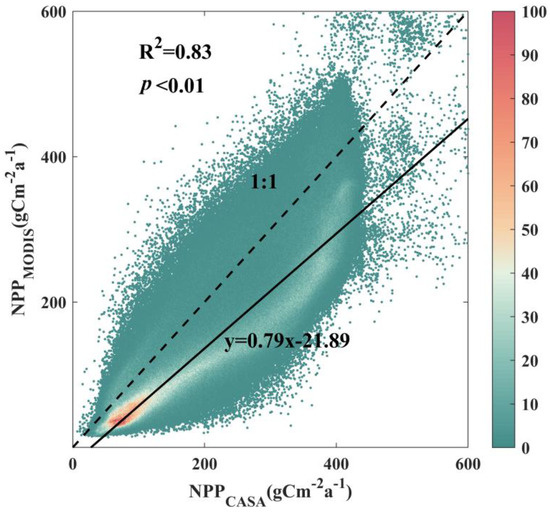
Figure 2.
Scatter plot depicting the accuracy validation density between CASA simulation results and the MOD17A3 dataset. The color differences in the scatterplot symbolize the number of pixels represented within each interval of the point.
We used the 1:1,000,000 vegetation type map of China (https://www.resdc.cn/data.aspx?DATAID=122, accessed on 17 June 2022) to classify the grassland types. The vegetation data were classified into three vegetation types: temperate grassland, alpine grassland, and alpine meadow.
2.3. Methods
2.3.1. Identify Extreme Events
To obtain more precise research results, we initially standardized each month of the growing season (May–October) to create comparable entities. Subsequently, we performed de-trending to eliminate the interference caused by overall trends in identifying extreme events. The modified dataset exhibits enhanced objectivity in discerning extreme events. We applied the above processing steps to each pixel in the raster grid to facilitate the conduction of ECA analysis. Transform the sequence as
with
where the newly obtained series represents the standardized data. The data correspond to different years in the same month, where i denotes the year and n represents the number of years. . is the mean of different years, and s is the standard deviation of the data . Then, the de-linearization process was applied to de-trend from the data. Subsequent analyses were conducted based on the time series of monthly data arranged in chronological order for each month of the processed multiyear growing season (all subsequent data processing mentioned is based on the time series processed as described above).
We determined whether a specific month was considered to have experienced an extreme event based on the deviation of its value at that time (month) from the entire time series. Specifically, if the value at that time (month) was less than −1 (in units of standard deviation), the month was defined as having experienced extreme minimum value events. Similarly, if the value was greater than 1 STD (standard deviation), it was defined as having experienced extreme maximum value events. Extreme precipitation events were further categorized into extreme drought events (PREmin) and extreme wet events (PREmax). We conducted separate analyses for nighttime and daytime events, explicitly distinguishing between extreme low-temperature events during the nighttime (TNmin), extreme low-temperature events during the daytime (TDmin), extreme high-temperature events during the nighttime (TNmax), and extreme high-temperature events during the daytime (TDmax). Anomalies in vegetation Net Primary Productivity (NPP) were divided into extreme maximum value events (NPPmax) and extreme minimum value events (NPPmin) to represent the vegetation growth conditions (Table 1).

Table 1.
Classification of extreme events.
2.3.2. Events Coincidence Analysis
Since our research focuses on analyzing the impact of extreme climate events occurring at specific nodes (i.e., events surpassing a certain threshold), commonly used methods such as the Pearson correlation analysis are no longer suitable. The Event Coincidence Analysis (ECA) method offers a practical and straightforward statistical concept to provide an analytical perspective. In essence, it reconstructs the data in a binary structure and analyzes the degree of coincidence in the occurrence timing of one event concerning another. This method identifies the correlation between two events by recognizing their co-occurrence frequency throughout the entire time series. Our study primarily utilized the ECA method to investigate direct and potential event associations. We conducted both individual event analysis (for calculating a single pixel) and extended event coincidence analysis (for calculating the regional average), with Coincidence Rates (CR) serving as the metric for the magnitude of the response relationship, ranging from 0 to 1. A CR value approaching 1 indicates a higher likelihood of simultaneous occurrence of events in both series. A value approaching 0 suggests a lower likelihood of temporal coupling between the two events. For detailed methodological principles, please refer to the literature [24,25]. The analytical significance test was based on the assumption of independent and sparse events.
Additionally, we conducted a compound analysis of extreme precipitation and extreme temperature events to assess the response of vegetation productivity. The simultaneous occurrence of two extreme climate events was identified as a composite extreme event (for the time series of precipitation and temperature indices, the absolute values in that month are both greater than 1 STD).
We also aim to utilize the ECA analysis to investigate the temporal lag effects of extreme climate events on NPP, which is incorporated within this method. The specific formula is outlined below.
Here, θ(·) represents the Heaviside function, and 1[0,ΔT] is the indicator function for the interval [0, ΔT]. When ΔT = 0, the function inside the sum becomes δ( − τ, ), where δ(·, ·) is the Kronecker delta, providing a value of 1 if and only if both arguments are equal, and zero otherwise. r (ΔT, τ) measures “the fraction of B-type events that are followed by at least one A-type event” equivalent to CR. By defining event lag time τ(ranging from 0 to 3 months) and a specific temporal tolerance window ΔT (in this study, set to 0), the comparison involves screening for the month with the maximum r (ΔT, τ) within the 0–3 month range, determining the lag duration.
2.3.3. Sensitivity Analysis
Although ECA analysis precisely captures the co-occurrence of extreme climate events and NPP anomalies, it does not inherently reflect the extent of NPP disturbance during extreme climate events. Therefore, it is essential to supplement this analysis by exploring the sensitivity of NPP to extreme precipitation and temperature events to assess the degree of climate event-induced disturbance.
Moreover, given that the impacts of climate events vary at different extreme levels (we define extreme climate events based on the specific threshold (>1 STD or <−1 STD) before), we classified extreme climate events into three categories based on their absolute values: Slight (1–1.5 STD), General (1.5–2 STD), and Severe (2–3 STD). To enable comparability, we standardized the values of all three categories to a range of 1–2 STD. For instance, for the values corresponding to extreme climate events occurring during the Slight category (1–1.5 STD), we subtracted 0.5 from the values and multiplied the result by 2, thereby converting them to the 1–2 range. A similar scaling process was applied to the General (1.5–2 STD) and Severe (2–3 STD) categories. Subsequently, for each type of extreme climate event, we divided the NPP (Standardized) corresponding to the time of extreme climate events by the value of its extreme climate indicator (after standardization and range conversion). We then averaged the results for each time point to represent the sensitivity level (in the unit of STD/STD). This operation is conducted for each pixel within the study area, and the averages of all pixels represent the overall level of the study area.
3. Results
3.1. Distribution of NPP along Elevation Gradient
The NPP levels across the grasslands in the study area primarily range from 0 to 500 gCm−2a−1. However, there are significant variations in the altitudinal ranges and overall NPP levels for each grassland type. As depicted in Figure 3, temperate grasslands predominantly thrive in areas below 4000 m (Figure 3a), while alpine meadows and alpine grasslands tend to grow in higher-elevation regions, precisely above 2600 m (Figure 3b,c), with the most extensive distribution occurring within the 4000–5000 m elevation range. With increasing elevation, both temperate grassland NPP and alpine meadow NPP exhibit a trend of initially increasing and then decreasing, reaching peak NPP levels around 3500 m. In contrast, alpine grasslands consistently experience a decline in NPP with rising elevation and those concentrated between 4500–5000 m exhibit comparatively lower NPP levels (<150 gCm−2a−1).
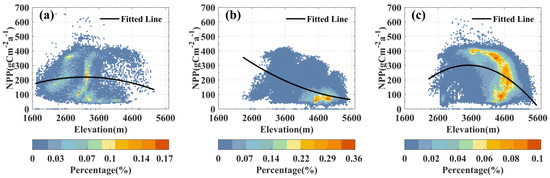
Figure 3.
Spatial variation of NPP along elevation gradient: Density scatterplots for temperate grassland (a), alpine grassland (b), and alpine meadow (c). Color representation based on percentage of pixels in each grassland category (i.e., density within the respective range).
3.2. Sensitivity of Grasslands to Extreme Climate Events
The impact of extreme precipitation events on NPP is significant, as illustrated in Figure 4. We observed that the occurrence of PREmin resulted in a negative response of NPP at all elevations (Figure 4a). This indicates a rapid reduction in NPP during drought events, with a more pronounced effect on vegetation in lower-elevation areas. Conversely, PREmax events prominently lead to NPP increase, also with a significant decrease in disturbance intensity as elevation decreased (Figure 4b). Temperate grassland and alpine grassland exhibited a higher degree of responsiveness to precipitation compared to alpine meadows. Additionally, alpine meadows growing below 3200 m elevation experience significant effects from extreme precipitation events (PREmin and PREmax), whereas alpine grasslands above 3200 m exhibit minimal fluctuations in NPP under such events. Notably, alpine meadows growing in regions above 3600 m demonstrated a feeble response in NPP to PREmax events.
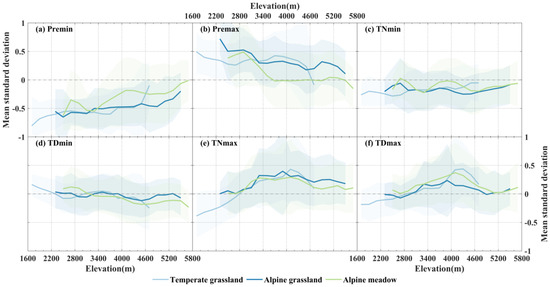
Figure 4.
The average NPP (standardized) in three different grassland types at different elevation gradients during months of the occurrence of extreme precipitation (temperature) events (absolute value STD > 1). Different grassland types are represented using different colors (shaded areas are 95% standard error intervals for each vegetation type).
Extreme low-temperature events during nighttime and daytime (TNmin and TDmin) generally lead to a decrease in NPP across most regions (Figure 4c,d). However, NPP shows positive values below 3000 m elevation when TDmin events occur, indicating a slight promotional effect of TDmin on NPP in some middle- to low-elevation regions. TNmax and TDmax exhibit a more apparent promotion of grassland NPP within the elevation range of 3000–5000 m, gradually weakening with increasing elevation (Figure 4e,f). Importantly, high-temperature events during both nighttime and daytime have a suppressive impact on the NPP of temperate grasslands growing below 2800 m elevation (standardized average NPP < 0), particularly under the disturbance caused by nighttime high-temperature events.
More severe extreme drought events corresponded to a heightened disruption of grassland NPP (Figure 5). The sensitivity of NPP to drought events steadily increased from mild to severe drought, a trend evident in temperate grasslands, alpine grasslands, and alpine meadows. During Severe extreme drought events (STD > 2), the sensitivity of temperate grassland and alpine grassland reached −0.86 and −0.89, respectively. However, the sensitivity of the three types of grasslands to PREmax was less pronounced than that to PREmin. Temperate grasslands exhibited higher sensitivity to PREmax than the other two grassland types, and its NPP demonstrated a higher sensitivity to events with extreme moisture levels.
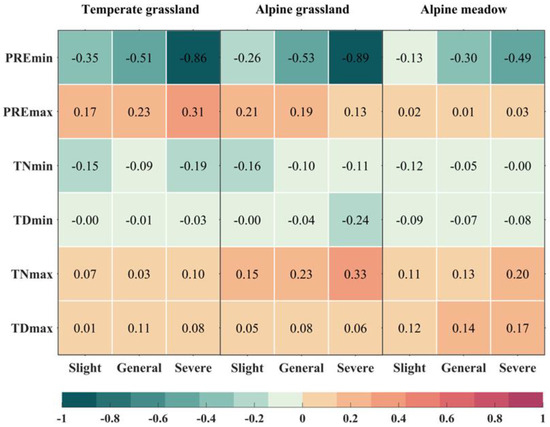
Figure 5.
The sensitivity (in units of STD/STD) of three types of grassland NPP to various levels of extreme precipitation (temperature) events, categorized as temperate grassland, alpine grassland, and alpine meadow from left to right. Extreme climate events are classified into three severity levels, namely Slight, General, and Severe. The color variations represent the sensitivity of grassland NPP to these extreme climate events.
In general, alpine meadows showed less sensitivity to extreme drought and extreme moisture events compared to temperate grasslands and alpine grasslands. The overall sensitivity of grasslands to extreme temperature events was lower than their sensitivity to extreme precipitation events. All types of grasslands exhibited negative sensitivity to extreme low-temperature events (TNmin and TDmin) and positive sensitivity to extreme high-temperature events (TNmax and TDmax). Specifically, alpine grasslands displayed higher sensitivity to Severe TDmin and TNmax events, reaching −0.24 and 0.33, respectively. Temperate grasslands showed higher sensitivity only to TNmin, while alpine meadows demonstrated higher sensitivity only to extreme high-temperature events, especially those with higher degrees of severity.
3.3. The Coincidence Rate between Grasslands and Individual Extreme Climate Events
The extent of disturbance caused by individual extreme events on NPP varies considerably, as depicted in Figure 6. The NPPmin in both temperate grassland and alpine grassland exhibit higher Coincidence Rates (CR) with PREmin. Over 60% of the regions in these two grasslands show higher CR values (>0.2) with PREmin. While multiple factors affect NPPmin in alpine meadows, PREmin remains the primary influencing factor. NPPmin in alpine meadows below 4000 m elevation demonstrate higher CR values (>0.2) with PREmin (Figure 7e). Moreover, there is a noticeable decrease in CR values between NPPmin and PREmin with increasing elevation across all three grassland types.
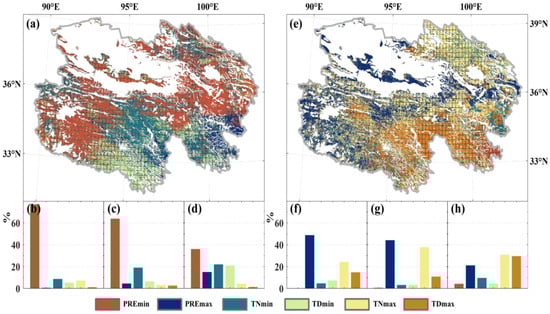
Figure 6.
The CR between extreme anomalous events in grassland NPP and individual extreme climate types. The left and right sides represent NPPmin and NPPmax caused by extreme climate, respectively. (a,e) depict the spatial distribution of CR (The portion covered by the grid passes the 95% significance test.), where each pixel shows the extreme climate event with the maximum CR for NPP extreme events. The bottom section represents the proportion of the maximum individual extreme climate event area attributed to extreme anomalous NPP events (NPPmin and NPPmax) in temperate grassland (b,f), alpine grassland (c,g), and alpine meadow (d,h). Colors indicate different types of extreme climate events.
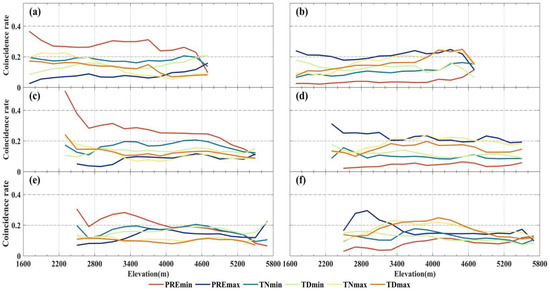
Figure 7.
Trend of CR between extreme anomalous events in grassland NPP and individual extreme climate types with elevation variation. The left and right sides represent NPPmin and NPPmax caused by extreme climate, respectively. The vertical direction corresponds to temperate grassland (a,b), alpine grassland (c,d), and alpine meadow (e,f).
NPPmax exhibits relatively high CR values (>40%) with PREmax, maintaining a CR level of 0.2 for both temperate grassland and alpine grassland. The CR values between NPPmax and TNmax are higher than those with TDmax. In alpine grasslands below 3200 m elevation, NPPmax shows higher CR values (>0.2) with PREmax (Figure 7d). In contrast, at higher elevations, the CR values are not significant and are instead driven by extremely high-temperature events. Furthermore, the most prominent regions with significant CR values between TNmax and TDmax and grassland NPPmax occur within the 3000–4000 m elevation range (Figure 7a,c,e).
3.4. The Coincidence Rate between Grasslands and Compound Extreme Climate Events
The compound events of PREmin and extreme temperature exhibit significantly higher CR with NPPmin compared to the compound events of PREmax and extreme temperature (Figure 8a). For temperate grassland and alpine grassland, TNmin and TDmin show high CR values with NPPmin under the influence of PREmin, and the proportion of the main affected areas exceeds 20% (Figure 8b,c). Under the compound impact of PREmin, TNmin demonstrates higher CR values with NPPmin across various elevation intervals in temperate grassland. The effect of compound events on NPPmin in alpine meadows is similar, but TDmin shows higher CR than TNmin under the compound of PREmin (Figure 8d). Furthermore, we observed that the PREmin and TDmin compound events significantly impact NPPmin in the lower elevation regions (<3200 m) for all three grassland types (Figure 9a,c,e). When the elevation exceeds 3200 m, the CR between this compound event and NPPmin drastically declines.
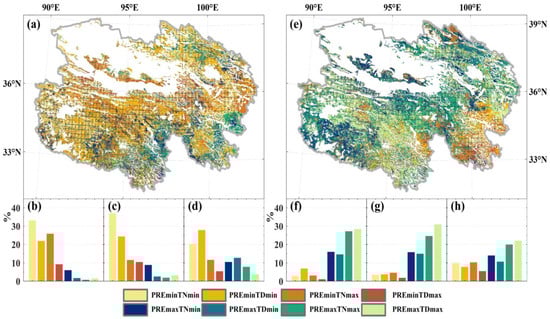
Figure 8.
The CR between extreme anomalous events in grassland NPP and compound extreme climate types. The left and right sides represent NPPmin and NPPmax caused by extreme climate, respectively. (a,e) depict the spatial distribution of CR (The portion covered by the grid passes the 95% significance test.), where each pixel shows the extreme climate event with the maximum CR for NPP extreme events. The bottom section represents the proportion of the maximum compound extreme climate event area attributed to extreme anomalous NPP events (NPPmin and NPPmax) in temperate grassland (b,f), alpine grassland (c,g), and alpine meadow (d,h). Colors indicate different types of extreme climate events.
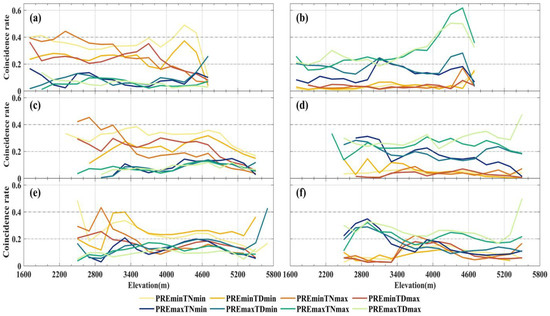
Figure 9.
Trend of CR between extreme anomalous events in grassland NPP and compound extreme climate types with elevation variation. The left and right sides represent NPPmin and NPPmax caused by extreme climate, respectively. The vertical direction corresponds to temperate grassland (a,b), alpine grassland (c,d), and alpine meadow (e,f).
Conversely, NPPmax exhibits higher CR values only with the compound events of extreme climate under PREmax, particularly with the compound events of PREmax and TNmax or TDmax. Under the compound of PREmax, the CR difference between TNmax and TDmax with NPPmax is insignificant (Figure 8). However, only in high-elevation alpine grassland and alpine meadows above 5200 m NPPmax shows higher CR values with the compound events of TDmax and PREmax (Figure 9d,f). Unlike these two, the NPPmax of temperate grasslands exhibits a clear increase in CR with increasing elevation under the combined influence of PREmax and either TNmax or TDmax. Within the 4000–4600 m elevation range, the CR between the two compound events of extreme climate and NPPmax exceeds 0.4. The observed altitudinal trend of CR is contrary to individual PREmax on NPPmax.
3.5. Lag Analysis of Grassland Response to Extreme Climate Events
We conducted a lagged analysis using ECA to explore the response lag months of NPP to extreme climate events (0–3 months). The analysis was stratified by elevation gradients: <3000 m, 3000–4000 m, and >4000 m. To ensure temporal continuity in the time series, we carried out a monthly analysis covering the twelve months of the year. The lagged impact of individual extreme climate events on NPP is illustrated in Figure 10. Overall, for results with relatively large CR values, the events of PREmin and extreme low temperature (TNmin and TDmin) show a significant immediate impact on NPPmin in the same month. However, alpine grassland growing below 3000 m exhibits exceptions, with NPPmin showing a significant lagged response of two months to TNmin. The effects of PREmax and extreme high-temperature events (TNmax and TDmax) on NPPmax are also predominantly immediate (same month). For extreme high-temperature events, there is a two-month lagged response for NPPmax in temperate grasslands and alpine grasslands growing below 3000 m elevation, although the results are not statistically significant.
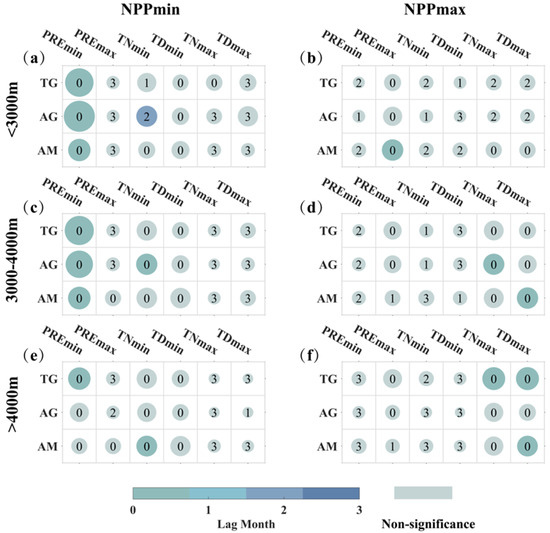
Figure 10.
The lagged responses of three types of grasslands to individual extreme climate events at different elevation gradients. The x-axis represents TG, AG, and AM, corresponding to temperate grassland, alpine grassland, and alpine meadow. The y-axis corresponds to different extreme climate events. The six plots are organized into three rows representing elevation gradients: <3000 m (a,b), 3000–4000 m (c,d), and >4000 m (e,f). The first column illustrates the lagged relationship between extreme climate events and NPPmin (a,c,e), while the second column depicts the lagged relationship between extreme climate events and NPPmax (b,d,f). Colors and numbers in the figures represent lag months, with gray indicating non-significance. The size of the circles represents the magnitude of the composite CR values, ranging from 0 to 0.3.
For compound extreme climate events, the occurrence of extreme climate events under the compound condition of PREmin is more likely to induce NPPmin events in the same month (Figure 11a,c,d). It is observed in compounds with all four types of extreme temperature events. However, variations exist, the compound climate events of PREmin with TDmin triggering significant lagged responses of two months for temperate grassland growing below 3000 m elevation with notable CR. Similarly, alpine meadows at elevations between 3000–4000 m show a lagged response of three months to compound extreme drought and high-temperature events (PREmin combined with TNmax and TDmax). The triggering factors for NPPmax events are most significantly associated with compound extreme wet and high-temperature events, with a higher likelihood of direct triggering in the same month (Figure 11b,d,e). Notably, alpine meadow growing above 3000 m elevation shows a two-month lagged response to compound extreme drought and daytime high-temperature events.
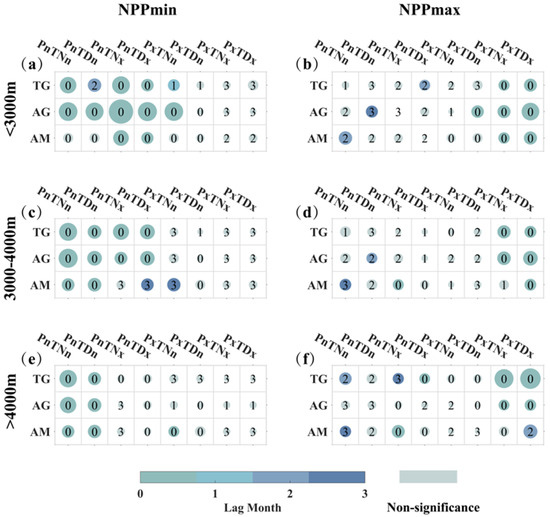
Figure 11.
The lagged responses of three types of grasslands to compound extreme climate events at different elevation gradients. The x-axis represents TG, AG, and AM, corresponding to temperate grassland, alpine grassland, and alpine meadow. The y-axis corresponds to different extreme climate events. The six plots are organized into three rows representing elevation gradients: <3000 m (a,b), 3000–4000 m (c,d), and >4000 m (e,f). The first column illustrates the lagged relationship between extreme climate events and NPPmin (a,c,e), while the second column depicts the lagged relationship between extreme climate events and NPPmax (b,d,f). Colors and numbers in the figures represent lag months, with gray indicating non-significance. The size of the circles represents the magnitude of the composite CR values, ranging from 0 to 0.45. In addition, due to space limitations, “Pre” is abbreviated as “P” here, while “min” is represented as “n”, and “max” is represented as “x”.
4. Discussion
4.1. Identification of Extreme Events
Numerous scholars have previously adopted the percentile threshold method for identifying extreme events [20,21], particularly extreme climate events. The percentile threshold method is feasible and correct for evaluating a specific extreme climate event, but it is more suitable for such individual assessments rather than comparing the impacts of various climate events. This is because the threshold in the percentile threshold method is influenced by the overall fluctuation of the sequence itself. As a result, the method tends to identify a fixed and the same number of extreme climate events, regardless of whether the overall fluctuation amplitude and frequency of the time series are high or low. However, events identified in sequences with weaker fluctuations may not constitute extreme events, and some events with significant anomalies in sequences with strong fluctuations may be overlooked. Our study aims to compare the impact and correlation of various extreme climate events on vegetation, so we set thresholds based on specific standard deviations. This approach ensures that the defined extreme events are relatively equitable across different climate types, thereby avoiding the possibility of identifying extreme situations in climates with less pronounced trends. Additionally, our de-trending of the temporal data serves the same purpose, maximizing the assurance that the analyzed abnormal vegetation growth conditions are solely influenced by extreme climate events and not disturbances caused by long-term, gradual, and cumulative climate changes. This is crucial because various factors may influence vegetation growth, including natural variations and slowly evolving climate trends. More accurate handling of these factors may lead to accurate interpretations. De-trending allows us to focus specifically on short-term anomalies related to extreme climate events. By eliminating the background trend or gradual climate changes, we can highlight abnormal vegetation growth conditions and attribute them solely to the impact of extreme events.
Furthermore, it is essential to note that in the northwest region of China, particularly in the plateau areas such as Qinghai Province, the dry and vegetation-lacking conditions contribute to weaker greenhouse effects and heat conduction. As a result, significant temperature differences between day and night occur during certain months in spring and autumn [26,27]. In other words, interannual variations may lead to non-synchronous temperature fluctuations between daytime and nighttime in certain months. Higher daytime temperatures do not necessarily indicate higher nighttime temperatures within the same month on an interannual scale. Relying solely on average temperature may not sufficiently reflect extreme temperature climate events. Consequently, we consider the monthly maximum and minimum temperatures (within the growing season) as fundamental indicators to identify extreme temperature events. Monthly maximum and minimum temperatures provide a more comprehensive representation of temperature changes than relying solely on average temperature. These indicators can explain heatwaves and cold spells by reflecting the maximum and minimum temperatures during day and night, which is crucial for regions where daytime and nighttime temperature fluctuations are not synchronized, allowing for a more accurate description of climate conditions.
4.2. Grassland Response to Extreme Climate Events at Different Elevations
The high elevation of Qinghai Province results in a colder and drier environment throughout the year [28], which poses a challenge to vegetation growth. Low temperatures reduce the rate of photosynthesis, which is the primary process of vegetation growth. The reduction in photosynthetic activity leads to decreased organic matter production, inhibiting plant growth. The reduction in water availability leads to a decrease in the expansion pressure of plant cells [29], affecting their ability to absorb nutrients and grow, ultimately leading to a decrease in vegetation productivity. However, at the same time, the low atmospheric pressure resulting from the high elevation reduces the required water and nutrients for plant growth [30]. Some vegetation species have evolved to adapt to these harsh environmental conditions. For instance, deep root systems allow plants to obtain water and nutrients from deeper soil layers [31], while small leaves and thick epidermis help reduce water loss through transpiration [32]. These adaptations have enabled vegetation in Qinghai Province to survive and thrive despite the low temperature and drought conditions.
Extremely low temperatures and drought events can further interfere with vegetation growth, decreasing productivity. Conversely, high temperatures and rainfall would improve vegetation conditions [33,34]. Elevated temperatures have been observed to enhance the photosynthesis rate, promoting organic matter production and increasing soil nitrogen mineralization and availability. Furthermore, plant growing seasons are extended [35], and plant habitats are expanded towards the higher and colder areas [36,37]. Additionally, precipitation provides the necessary water for vegetation growth, leading to increased expansion of plant cells and an increased ability to absorb nutrients and grow.
Extreme precipitation events significantly impact vegetation more than extreme temperatures, particularly at lower elevations. However, it is worth noting that the extreme hot events at low elevations promote vegetation growth less than at other elevations. Even high temperature has a negative effect on vegetation growth. The higher average temperature at lower elevations increases vegetation transpiration, resulting in increased water evaporation [38,39]. For areas where vegetation is more susceptible to moisture limitation, the increase in temperature results in a decrease in soil moisture, leading to soil drought and moisture deficit, which negatively impacts vegetation. Furthermore, photosynthesis can be significantly affected when daytime temperatures exceed the optimal temperature for plant photosynthesis [33]. High temperatures also lead to increased respiration of vegetation, which consumes more carbon.
Interestingly, our findings suggest that high nighttime temperatures significantly contribute to vegetation growth than those during the day. It is due to the large diurnal temperature difference in highlands and subzero temperatures at night, which bring about milder temperature changes and frost risk reduction. Additionally, high nighttime temperatures affect vegetation growth mainly by enhancing the dark respiration of vegetation. Recent studies have shown that dark auto respiration is more dominant in vegetation activity at high elevations [40]. This enhanced respiration often leads to increased photosynthesis, which plants must use to compensate for their consumption and stimulate carbon sequestration. This drive may result in an overcompensation of nocturnal respiratory depletion, which is one of the ways in which vegetation growing in the highlands can combat the harsh environment [41].
In contrast, high daytime temperatures have a greater level of promotion of vegetation growth under a compound of extreme wetting events, especially at middle and high elevations. High daytime temperatures significantly improve vegetation conditions at high elevations and may be accompanied by increased evaporation of soil moisture and stronger solar radiation. Although it has been reported that vegetation at high elevations is largely influenced by temperature [42], as an arid region, only a more humid environment can provide moisture assurance and weaker solar radiation under these weather conditions.
4.3. Response of Different Grasslands to Extreme Climate Events
The sensitivity of alpine meadows to extreme precipitation events, including heavy rainfall and drought, is not as pronounced as temperate grasslands and alpine grasslands, both in the case of individual extreme events and compound events involving extreme temperatures. This diminished sensitivity is particularly evident at elevations above 3200 m. This may be related to the individual climate sensitivity factors of vegetation. It has been reported that temperature is the primary limiting factor for CO2 flux during the growing season of alpine meadows [43], with CO2 flux increasing as temperatures rise. In contrast, the CO2 flux of temperate grasslands and alpine grasslands is primarily limited by water constraints resulting from seasonal drought [44], with temperature being a secondary factor. In addition, alpine meadows exhibit a higher presence of wetlands and lakes. Although mostly frozen or partially frozen, during our study period (May–October), they are readily available water sources for long durations. The presence of wetlands and lakes provides significant soil moisture resilience and allows for ample flexibility in response to extreme precipitation events. Furthermore, wetlands and lakes can absorb and release substantial amounts of heat over short periods, stabilizing the surrounding environment’s temperature and enhancing the stability of alpine meadow ecosystems. Compared to alpine meadows, alpine grasslands are more prone to drying out and face more severe challenges in water supply.
We have observed that the climate response of temperate grasslands varies more significantly along the elevation gradient compared to the other two types of grasslands, especially in the context of compound extreme events. The temperate grasslands above 4000 m elevation likely exhibit a significant increase in NPP following compound events of extremely wet and extremely high temperatures (both daytime and nighttime). We noticed pronounced variations in species diversity across different elevations despite the same in grassland types (temperate grassland). The higher species diversity in lower elevation areas contributes to enhanced resource utilization efficiency. The coexistence of multiple grassland types facilitates mutual complementation, forming complex interaction networks. In lower elevations, where the growth environment is relatively more favorable, temperate grasslands show a less pronounced positive response to high-temperature and wet events. However, the higher levels of species diversity and abundance in lower elevations also imply greater demands for water and nutrients, contributing to a stronger negative response under prolonged drought events. In higher elevation areas, where nutrient availability in the soil is relatively limited and water retention capacity is not as prominent, biodiversity is comparatively lower than in lower elevations. Hence, vegetation in these areas fully exploits the conducive environmental conditions during extremely high-temperature and precipitation events to promote accelerated growth [45]. Additionally, if compound events of extremely high temperatures and abundant rainfall occur at the beginning or end of the growing season, they can significantly advance or extend the growing season [46]. Unlike temperate grasslands, the variations in vegetation types and biodiversity along the altitudinal gradient are not as pronounced in alpine grasslands and meadows. Consequently, the probability of extreme climate events triggering abnormal vegetation responses does not exhibit a clear trend with elevation changes.
5. Conclusions
We analyzed the effects of extreme climate events (precipitation and temperature) on grassland NPP in the plateau region (Qinghai Province). Our findings indicate that grasslands respond more significantly to extreme precipitation than extreme temperature events. This response is also evident in the compound effects of precipitation and temperature, where only the compound effect of extreme precipitation events gives rise to a higher likelihood of abnormal increases or decreases in grassland NPP. Overall, extremely wet and extremely high-temperature events are more likely to cause abnormal increases in grassland NPP. Conversely, extreme drought and extremely low-temperature events are more likely to result in abnormal decreases in NPP. However, different types of grasslands at different elevations exhibit variations in their responses. Extreme precipitation events have a more pronounced impact on grassland NPP in relatively low-elevation regions (below 3000 m), particularly temperate grasslands and alpine grasslands. With increasing elevation, grassland exhibits a stronger response to extreme temperature events, particularly within the elevation range of 3000–5000 m. There is a higher probability of nighttime extreme high temperatures causing abnormal increases in NPP compared to daytime extreme high-temperature events. In addition, most of the extreme climate event-induced anomalies in the NPP are generated in transient response (for that month) rather than lagged.
Author Contributions
H.A.: methodology, software, validation, visualization, and writing—original draft. J.Z., X.S. and W.S.: conceptualization, methodology, writing—reviewing and editing, supervision, resources, and funding acquisition. G.W., Y.Z. and K.Z.: data curation and software. All authors have read and agreed to the published version of the manuscript.
Funding
This work was supported by the National Key Research and Development Program of China [grant numbers: 2022YFC3201702], the National Natural Science Foundation of China [grant numbers: 42177328], Special Project of High Resolution Earth Observation System [grant numbers: 42111101011012] and Regular Remote Sensing Survey and Assessment of National Ecological Status of China [grant numbers: 22111101006001].
Data Availability Statement
The data presented in this study are available on request from the corresponding author. The data are not publicly available due to privacy.
Conflicts of Interest
Authors Gang Wang. Yu Zhong. Ke Zhang were employed by the company Chengdu Hydroelectricity Construction Engineering Co., Ltd. of Sinohydro Bureau No. 7 Company. The remaining authors declare that the research was conducted in the absence of any commercial or financial relationships that could be construed as a potential conflict of interest.
References
- Stott, P. How Climate Change Affects Extreme Weather Events Research Can Increasingly Determine the Contribution of Climate Change to Extreme Events Such as Droughts. Science 2016, 352, 1517–1518. [Google Scholar] [CrossRef] [PubMed]
- Cleverly, J.; Eamus, D.; Edwards, W.; Grant, M.; Grundy, M.J.; Held, A.; Karan, M.; Lowe, A.J.; Prober, S.M.; Sparrow, B.; et al. TERN, Australia’s Land Observatory: Addressing the Global Challenge of Forecasting Ecosystem Responses to Climate Variability and Change. Environ. Res. Lett. 2019, 14, 095004. [Google Scholar] [CrossRef]
- Duane, A.; Castellnou, M.; Brotons, L. Towards a Comprehensive Look at Global Drivers of Novel Extreme Wildfire Events. Clim. Chang. 2021, 165, 43. [Google Scholar] [CrossRef]
- Hulme, P.E. Addressing the Threat to Biodiversity from Botanic Gardens. Trends Ecol. Evol. 2011, 26, 168–174. [Google Scholar] [CrossRef] [PubMed]
- Lewis, S.C.; King, A.D.; Mitchell, D.M. Australia’s Unprecedented Future Temperature Extremes under Paris Limits to Warming. Geophys. Res. Lett. 2017, 44, 9947–9956. [Google Scholar] [CrossRef]
- Mishra, V.; Aadhar, S.; Asoka, A.; Pai, S.; Kumar, R. On the Frequency of the 2015 Monsoon Season Drought in the Indo-Gangetic Plain. Geophys. Res. Lett. 2016, 43, 12102–12112. [Google Scholar] [CrossRef]
- Chen, Q.; Timmermans, J.; Wen, W.; van Bodegom, P.M. Ecosystems Threatened by Intensified Drought with Divergent Vulnerability. Remote Sens. Environ. 2023, 289, 113512. [Google Scholar] [CrossRef]
- Katic, P.G.; Cerretelli, S.; Haggar, J.; Santika, T.; Walsh, C. Mainstreaming Biodiversity in Business Decisions: Taking Stock of Tools and Gaps. Biol. Conserv. 2023, 277, 109831. [Google Scholar] [CrossRef]
- Saleem, A.; Awange, J.L.; Kuhn, M.; John, B.; Hu, K. Impacts of Extreme Climate on Australia’s Green Cover (2003–2018): A MODIS and Mascon Probe. Sci. Total Environ. 2021, 766, 142567. [Google Scholar] [CrossRef]
- Fensholt, R.; Proud, S.R. Evaluation of Earth Observation Based Global Long Term Vegetation Trends—Comparing GIMMS and MODIS Global NDVI Time Series. Remote Sens. Environ. 2012, 119, 131–147. [Google Scholar] [CrossRef]
- Xie, Y.; Wang, X.; Silander, J.A. Deciduous Forest Responses to Temperature, Precipitation, and Drought Imply Complex Climate Change Impacts. Proc. Natl. Acad. Sci. USA 2015, 112, 13585–13590. [Google Scholar] [CrossRef]
- Piao, S.; Zhang, X.; Chen, A.; Liu, Q.; Lian, X.; Wang, X.; Peng, S.; Wu, X. The Impacts of Climate Extremes on the Terrestrial Carbon Cycle: A Review. Sci. China Earth Sci. 2019, 62, 1551–1563. [Google Scholar] [CrossRef]
- Wang, Y.; Luo, Y.; Shafeeque, M. Interpretation of Vegetation Phenology Changes Using Daytime and Night-Time Temperatures across the Yellow River Basin, China. Sci. Total Environ. 2019, 693, 133553. [Google Scholar] [CrossRef] [PubMed]
- Zhu, G.; Wang, X.; Xiao, J.; Zhang, K.; Wang, Y.; He, H.; Li, W.; Chen, H. Daytime and Nighttime Warming Has No Opposite Effects on Vegetation Phenology and Productivity in the Northern Hemisphere. Sci. Total Environ. 2022, 822, 153386. [Google Scholar] [CrossRef] [PubMed]
- Balducci, L.; Deslauriers, A.; Rossi, S.; Giovannelli, A. Stem Cycle Analyses Help Decipher the Nonlinear Response of Trees to Concurrent Warming and Drought. Ann. For. Sci. 2019, 76, 88. [Google Scholar] [CrossRef]
- Wen, Y.; Liu, X.; Pei, F.; Li, X.; Du, G. Non-Uniform Time-Lag Effects of Terrestrial Vegetation Responses to Asymmetric Warming. Agric. For. Meteorol. 2018, 252, 130–143. [Google Scholar] [CrossRef]
- Wen, Y.; Liu, X.; Yang, J.; Lin, K.; Du, G. NDVI Indicated Inter-Seasonal Non-Uniform Time-Lag Responses of Terrestrial Vegetation Growth to Daily Maximum and Minimum Temperature. Glob. Planet. Chang. 2019, 177, 27–38. [Google Scholar] [CrossRef]
- Zheng, L.; Li, D.; Xu, J.; Xia, Z.; Hao, H.; Chen, Z. A Twenty-Years Remote Sensing Study Reveals Changes to Alpine Pastures under Asymmetric Climate Warming. ISPRS J. Photogramm. Remote Sens. 2022, 190, 69–78. [Google Scholar] [CrossRef]
- Siegmund, J.F.; Wiedermann, M.; Donges, J.F.; Donner, R.V. Impact of Climate Extremes on Wildlife Plant Flowering over Germany. Biogeosci. Discuss. 2015, 12, 18389–18423. [Google Scholar]
- Baumbach, L.; Siegmund, J.F.; Mittermeier, M.; Donner, R.V. Impacts of Temperature Extremes on European Vegetation during the Growing Season. Biogeosciences 2017, 14, 4891–4903. [Google Scholar] [CrossRef]
- Fan, X.; Zhu, D.; Sun, X.; Wang, J.; Wang, M.; Wang, S.; Watson, A.E.E. Impacts of Extreme Temperature and Precipitation on Crops during the Growing Season in South Asia. Remote Sens. 2022, 14, 6093. [Google Scholar] [CrossRef]
- Tao, J.; Zhang, Y.; Dong, J.; Fu, Y.; Zhu, J.; Zhang, G.; Jiang, Y.; Tian, L.; Zhang, X.; Zhang, T.; et al. Elevation-Dependent Relationships between Climate Change and Grassland Vegetation Variation across the Qinghai-Xizang Plateau. Int. J. Climatol. 2015, 35, 1638–1647. [Google Scholar] [CrossRef]
- Zhao, R.; Chen, B.; Zhang, W.; Yang, S.; Xu, X. Moisture Source Anomalies Connected to Flood-Drought Changes over the Three-Rivers Headwater Region of Tibetan Plateau. Int. J. Climatol. 2023, 43, 5303–5316. [Google Scholar] [CrossRef]
- Donges, J.F.; Schleussner, C.-F.; Siegmund, J.F.; Donner, R.V. Event Coincidence Analysis for Quantifying Statistical Interrelationships between Event Time Series. Eur. Phys. J. Spec. Top. 2016, 225, 471–487. [Google Scholar] [CrossRef]
- Siegmund, J.F.; Siegmund, N.; Donner, R.V. CoinCalc—A New R Package for Quantifying Simultaneities of Event Series. Comput. Geosci. 2017, 98, 64–72. [Google Scholar] [CrossRef]
- You, Q.; Kang, S.; Aguilar, E.; Yan, Y. Changes in Daily Climate Extremes in the Eastern and Central Tibetan Plateau during 1961–2005. J. Geophys. Res. 2008, 113, D07101. [Google Scholar] [CrossRef]
- Liu, X.; Yin, Z.; Shao, X.; Qin, N. Temporal Trends and Variability of Daily Maximum and Minimum, Extreme Temperature Events, and Growing Season Length over the Eastern and Central Tibetan Plateau during 1961–2003. J. Geophys. Res. 2006, 111, D19109. [Google Scholar] [CrossRef]
- Qin, W.; Huang, Y.; Wang, L.; Lin, G.; Yang, J.; Song, P.; Gao, H.; Zhang, J.; Zhang, T. Gut Microbiota Enabled Goitered Gazelle (Gazella Subgutturosa) to Adapt to Seasonal Changes. Pak. J. Zool. 2020, 52, 1637–1646. [Google Scholar] [CrossRef]
- Frensch, J. Primary Responses of Root and Leaf Elongation to Water Deficits in the Atmosphere and Soil Solution. J. Exp. Bot. 1997, 48, 985–999. [Google Scholar] [CrossRef]
- He, C.; Davies, F.T.; Lacey, R.E. Separating the Effects of Hypobaria and Hypoxia on Lettuce: Growth and Gas Exchange. Physiol. Plant. 2007, 131, 226–240. [Google Scholar] [CrossRef]
- Kato, Y.; Abe, J.; Kamoshita, A.; Yamagishi, J. Genotypic Variation in Root Growth Angle in Rice (Oryza Sativa L.) and Its Association with Deep Root Development in Upland Fields with Different Water Regimes. Plant Soil 2006, 287, 117–129. [Google Scholar] [CrossRef]
- Turunen, M.; Latola, K. UV-B Radiation and Acclimation in Timberline Plants. Environ. Pollut. 2005, 137, 390–403. [Google Scholar] [CrossRef] [PubMed]
- Lyu, M.; Sun, M.; Penuelas, J.; Sardans, J.; Sun, J.; Chen, X.; Zhong, Q.; Cheng, D. Thermal Acclimation of Foliar Carbon Metabolism in Pinus Taiwanensis along an Elevational Gradient. Front. Plant Sci. 2022, 12, 778045. [Google Scholar] [CrossRef]
- Tong, S.; Xu, D.; Wang, Y.; Zhang, X.; Li, Y.; Wu, H.; Ye, N. Influence of Ocean Acidification on Thermal Reaction Norms of Carbon Metabolism in the Marine Diatom Phaeodactylum Tricornutum. Mar. Environ. Res. 2021, 164, 105233. [Google Scholar] [CrossRef] [PubMed]
- Currier, C.M.; Sala, O.E. Precipitation versus Temperature as Phenology Controls in Drylands. Ecology 2022, 103, e3793. [Google Scholar] [CrossRef]
- Crozier, L. Warmer Winters Drive Butterfly Range Expansion by Increasing Survivorship. Ecology 2004, 85, 231–241. [Google Scholar] [CrossRef]
- Goulden, M.L.; Bales, R.C. Mountain Runoff Vulnerability to Increased Evapotranspiration with Vegetation Expansion. Proc. Natl. Acad. Sci. USA 2014, 111, 14071–14075. [Google Scholar] [CrossRef] [PubMed]
- Berg, A.; Sheffield, J. Evapotranspiration Partitioning in CMIP5 Models: Uncertainties and Future Projections. J. Clim. 2019, 32, 2653–2671. [Google Scholar] [CrossRef]
- Schwingshackl, C.; Davin, E.L.; Hirschi, M.; Sorland, S.L.; Wartenburger, R.; Seneviratne, S.I. Regional Climate Model Projections Underestimate Future Warming Due to Missing Plant Physiological CO2 Response. Environ. Res. Lett. 2019, 14, 114019. [Google Scholar] [CrossRef]
- Peng, S.; Piao, S.; Ciais, P.; Myneni, R.B.; Chen, A.; Chevallier, F.; Dolman, A.J.; Janssens, I.A.; Peñuelas, J.; Zhang, G.; et al. Asymmetric Effects of Daytime and Night-Time Warming on Northern Hemisphere Vegetation. Nature 2013, 501, 88–92. [Google Scholar] [CrossRef] [PubMed]
- Wan, S.; Xia, J.; Liu, W.; Niu, S. Photosynthetic Overcompensation under Nocturnal Warming Enhances Grassland Carbon Sequestration. Ecology 2009, 90, 2700–2710. [Google Scholar] [CrossRef]
- Chen, Z.; Yu, G.; Ge, J.; Sun, X.; Hirano, T.; Saigusa, N.; Wang, Q.; Zhu, X.; Zhang, Y.; Zhang, J.; et al. Temperature and Precipitation Control of the Spatial Variation of Terrestrial Ecosystem Carbon Exchange in the Asian Region. Agric. For. Meteorol. 2013, 182–183, 266–276. [Google Scholar] [CrossRef]
- Fu, Y.; Zheng, Z.; Yu, G.; Hu, Z.; Sun, X.; Shi, P.; Wang, Y.; Zhao, X. Environmental Influences on Carbon Dioxide Fluxes over Three Grassland Ecosystems in China. Biogeosciences 2009, 6, 2879–2893. [Google Scholar] [CrossRef]
- Li, H.; Wang, C.; Zhang, F.; He, Y.; Shi, P.; Guo, X.; Wang, J.; Zhang, L.; Li, Y.; Cao, G.; et al. Atmospheric Water Vapor and Soil Moisture Jointly Determine the Spatiotemporal Variations of CO2 Fluxes and Evapotranspiration across the Qinghai-Tibetan Plateau Grasslands. Sci. Total Environ. 2021, 791, 148379. [Google Scholar] [CrossRef] [PubMed]
- Zhang, B.; Li, W.; Chen, S.; Tan, X.; Wang, S.; Chen, M.; Ren, T.; Xia, J.; Huang, J.; Han, X. Changing Precipitation Exerts Greater Influence on Soil Heterotrophic than Autotrophic Respiration in a Semiarid Steppe. Agric. For. Meteorol. 2019, 271, 413–421. [Google Scholar] [CrossRef]
- Jiang, S.; Chen, X.; Huang, R.; Wang, T.; Smettem, K. Effect of the Altitudinal Climate Change on Growing Season Length for Deciduous Broadleaved Forest in Southwest China. Sci. Total Environ. 2022, 828, 154306. [Google Scholar] [CrossRef]
Disclaimer/Publisher’s Note: The statements, opinions and data contained in all publications are solely those of the individual author(s) and contributor(s) and not of MDPI and/or the editor(s). MDPI and/or the editor(s) disclaim responsibility for any injury to people or property resulting from any ideas, methods, instructions or products referred to in the content. |
© 2024 by the authors. Licensee MDPI, Basel, Switzerland. This article is an open access article distributed under the terms and conditions of the Creative Commons Attribution (CC BY) license (https://creativecommons.org/licenses/by/4.0/).