Article

Long-Term Spatiotemporal Characteristics and Influencing Factors of Dust Aerosols in East Asia (2000–2022)

1
College of Resources and Environment, University of Chinese Academy of Sciences, Beijing 100049, China
2
Beijing Yanshan Earth Critical Zone National Research Station, University of Chinese Academy of Sciences, Beijing 101408, China
3
College of Geodesy and Geomatics, Shandong University of Science and Technology, Qingdao 266000, China
*
Author to whom correspondence should be addressed.
Remote Sens. 2024, 16(2), 318; https://doi.org/10.3390/rs16020318
Submission received: 30 November 2023 / Revised: 7 January 2024 / Accepted: 7 January 2024 / Published: 12 January 2024
(This article belongs to the Special Issue Advances and Challenges in Remote Sensing of Atmospheric Mineral Dust)

Abstract

:
The Taklamakan Desert Region (TDR) and the Gobi Desert Region (GDR) in East Asia significantly impact air quality, human health, and climate through dust aerosols. Utilizing the MERRA-2 dataset’s long-term dust aerosol optical depth (DAOD) at 550 nm from 2000 to 2022, we systematically monitored the spatiotemporal dynamics of DAOD. Our analysis covered annual, seasonal, and monthly scales, employing geographical detector analyses to investigate the impact of eight factors on DAOD distribution. Over the 23-year period, the interannual variability in DAOD across East Asia was not pronounced, but a discernible decreasing trend was observed, averaging an annual decrease of −0.0002. The TDR had higher DAOD values (0.337) than the GDR (0.103). The TDR showed an average annual increase of 0.004, while the GDR exhibited an average annual decrease of −0.0003. The spatial distribution displayed significant seasonal variations, with peak values in spring, although the peak months varied between the TDR and GDR. The driving factor analysis revealed that relative humidity and soil moisture significantly impacted the DAOD spatial distribution in East Asia, which were identified as common driving factors for both the region and the major dust sources. Complex mechanisms influenced the variation in DAOD, with interactions between variables having a greater impact than individual effects. The geodetector-derived interaction q-value identified the collective impact of soil temperature and relative humidity (0.896) as having the highest impact on the spatial and temporal DAOD distribution. The overall spatial pattern exhibited a nonlinear enhancement trend, with the TDR and GDR showing bilinear enhancement patterns. These findings contribute to a better understanding of the factors influencing DAOD, offering a theoretical basis for atmospheric pollution control in East Asia.

Graphical Abstract

1. Introduction

Among aerosol particles, dust aerosols are significant contributors and represent the largest source of aerosols globally, accounting for approximately 40–50% of the total aerosol content [1,2,3,4,5]. Research indicates that around 2 billion tons of dust are released into the atmosphere annually [6,7,8,9,10,11,12]. Emissions of dust pose significant threats to ecology, the environment, and human well-being over short periods of time. As suspended aerosols in the air, sand and dust also exert a notable influence on climate change. Not only do dust particles alter the Earth’s radiation balance through the absorption and scattering of short- and long-wave radiation, but the absorption and scattering of solar radiation during dust events can impact air temperatures, leading to adverse effects on human health, ecosystems, and even causing economic and human losses [13,14,15,16].
Global aerosol concentrations exhibit a significant increase during the spring and summer seasons, coinciding with frequent occurrences of dust storms. As a result, dust and mineral dust aerosol particles are the primary contributors to the observed aerosol augmentation. The East Asian dust source is the second largest source of dust in the world after the Sahara Desert. The dust source areas in East Asia cover approximately 5% of the total global desert area, and the dust emissions account for about 10–25% of the global total [15,16]. These areas play a crucial role as a significant component of the Earth’s dust source–sink system and have important implications in biogeochemical cycles. Due to its large dust emissions and wide-ranging impacts, East Asia has become a key region for studying global changes and regional feedback. Influenced by cold fronts, the annual springtime dust emissions in East Asia are estimated to be around 230–800 Tg, accounting for approximately 50% of the total global atmospheric dust content [17]. Some studies have even indicated that from 2001 to 2020, the dominant aerosol type in East Asia was dust aerosol, accounting for more than 80% of the total aerosol content [1]. Approximately 30% of emitted dust aerosols settle back in desert regions, while the remaining 70% are transported beyond the source areas. These aerosols can be uplifted to the planetary boundary layer and subsequently carried to various regions, including China [18], the Korean Peninsula [19], Japan [20], and even over long distances across the Pacific Ocean to North America [21], Canada [22], and even the Arctic [23]. The transportation of dust aerosols in the troposphere can persist for several days to even up to two weeks, posing a significant threat to air quality in the regions along the transport pathways.
In order to accurately assess the impact of dust aerosols on climate and the ecological environment, it is essential to quantify the spatiotemporal distribution of dust aerosols. Currently, aerosols in East Asia have attracted widespread attention and become a focal point in climate research. Kang et al. [24] studied the spatiotemporal distribution of three major absorbing aerosols in East Asia from 2005 to 2016 based on OMI satellite data in order to further understand the distribution characteristics of absorbing aerosols over East Asia. Proestakis et al. [25] analyzed the multi-year average distribution, seasonal variation, and evolutionary trends of dust aerosols in East Asia, as well as the columnar mass flux of dust. Gui et al. [26] utilized CALIPSO data to observe the horizontal and vertical distribution of dust aerosols in East Asia from 2007 to 2019 and the results revealed that the long-range transport of various aerosols, including dust, polluted dust, and smoke, made significant contributions to the aerosol burden in East Asia. Aerosol optical depth (AOD) is a crucial optical parameter that serves as an indicator of air pollution levels [27]. Monitoring the spatial and temporal variations in AOD in the atmosphere is essential for assessing the environmental impact of air pollution. In addition, to study the main determinants of dust aerosols in the region, it is necessary to identify the main influencing factors. Many scholars have conducted research on the factors influencing the spatial distribution of AOD [28,29,30,31,32,33]. The findings consistently suggest that the spatial pattern of AOD is the result of complex interactions among various factors [33]. Li et al. [30] examined the importance of various factors affecting AOD in Xinjiang using the random forest model. The results revealed that the AOD in Xinjiang is influenced by a combination of natural and human factors, with natural gas (NG) being the most significant factor (14.65%), followed by precipitation (P) (13.65%). Zhou et al. [1] monitored the spatiotemporal dynamics of the AOD in Central Asia from 2001 to 2020 and investigated the impact of six environmental factors on the AOD distribution using a geographic detector, along with an analysis of land use/cover changes (LUCCs) during different periods. Liu et al. [31] investigated the impact of soil moisture on dust aerosols in Central Asia and concluded that an exponential decrease in aerosol emissions from dust sources was observed with increasing soil moisture under different wind speed conditions.
Remote sensing has outstanding advantages in acquiring AOD data with large-scale coverage and high temporal resolution, overcoming limitations such as the lack of ground observations and spatial heterogeneity [34,35,36,37,38,39]. It provides an efficient method for obtaining comprehensive knowledge and theoretical support regarding the distribution and concentration of aerosols. Although satellite data can provide real-time information on aerosol distribution, they are susceptible to limitations such as cloud cover and algorithmic influences. A reanalysis dataset covers a longer time series and has a higher resolution, allowing for a more comprehensive analysis. Additionally, it provides multiple types of aerosol information, thereby better covering a wide range of research areas. The MERRA-2 dataset provides continuous global aerosol data. Numerous validation studies at both global and regional scales have reported a good agreement between ground-based observation data from AERONET and MERRA-2 [28,40,41,42]. The global validation of MERRA-2 AOD with AERONET measurements demonstrated significant spatial consistency between MERRA-2 and ground-based AOD. The MERRA-2 AOD data are capable of quantitatively reproducing the annual and seasonal variations in AOD at both regional and global scales [28].
In this study, we investigated the spatiotemporal distribution characteristics of the DAOD in the East Asia region using the long-term (2000–2022) dust aerosol data obtained from the MERRA-2. The long-term evolution trends of East Asian dust aerosol were described from monthly, seasonal, and interannual perspectives. To ensure the reliability of the reanalysis products, the aerosol data from MERRA-2 were validated against observations from AERONET. Furthermore, we analyzed the driving factors behind the long-term DAOD variations in East Asia and two typical dust source regions, considering meteorological factors, ground conditions, and human activities.

2. Materials and Methods

All calculations, analyses, and mapping for this study were conducted using Python (version 3.6.12) and the ArcGIS geographic information system (version 10.6, ESRI, Redlands, CA, USA). Additionally, Matlab software (version R2018a, MathWorks, Natick, MA, USA) was employed for mapping and analyzing trend changes.

2.1. Study Area

East Asia is located between 73° to 150° east longitude and 4° to 53° north latitude, covering an area of approximately 11.76 million km2. The region features a high topography in the west and low topography in the east, with numerous plateaus and mountains in the western interior and plains and hills along the eastern coast. The rivers in this region primarily flow from west to east, emptying into the Pacific Ocean. East Asia comprises five countries: China, Mongolia, Japan, Korea, and North Korea [43]. The Taklamakan Desert Region (TDR), located in the southern center of Xinjiang, and the Gobi Desert Region (GDR), which spans between China and Mongolia, are the two most significant sources of dust in East Asia. Covering an area of approximately 337,000 km2, the TDR is the largest desert in China. The GDR, on the other hand, is a highland desert that covers the northern and northwestern regions of China, as well as the southern part of Mongolia, with an altitude ranging from 910 to 1520 m.

2.2. Dataset

2.2.1. MERRA-2 AOD

MERRA-2 is a new generation of atmospheric reanalysis data that NASA’s Global Modeling and Assimilation Office (GMAO) released in 2016. The dataset is easily accessible, covers a long global time series, and has a uniform distribution. It provides assimilated traditional meteorological observation data from 1980 to the present, encompassing not only various meteorological fields but also data on dust emission fluxes, column densities, concentrations, and Aerosol Optical Depth (AOD).
Our research explored the spatial and temporal characteristics of dust aerosol optical depth (DAOD) in East Asia using monthly data from 2000 to 2022 from the MERRA-2 aerosol diagnostic product tavgM_2d_aer_Nx, which provides information on DAOD at 550 nm. The data were formatted as nc and processed into tif for computation. Missing values were replace with NaN.

2.2.2. Ground-Based Observation AOD

AERONET (Aerosol Robotic Network) is a global ground-based aerosol observation network established by NASA and CNRS. The network provides data for download at three different quality levels for various wavelengths of the Aerosol Optical Depth (AOD): Level 1.0 (without cloud mask and quality check), Level 1.5 (with completed cloud mask), and Level 2.0 (with completed cloud mask and quality check). AERONET’s ground-based aerosol observation data are considered a reliable source for validating satellite aerosol products and conducting research [27,44].
We validated the accuracy of the MERRA-2 DAOD dataset by obtaining all available data for the four sites (AOE_Baotou, Beijing, Dalanzadgad, and QOMS_CAS) over the study period (2000–2022) and processing them as monthly averages; missing data varied across the four sites, and data records containing missing data were not used. The locations of the sites are shown in Figure 1.

2.2.3. Data on Influencing Factors

Studying the trends of influencing factors on dust aerosols in East Asia is crucial for gaining insights into their sources and trends. In this section, we selected eight influencing factors that have the potential to affect changes in the Dust Aerosol Optical Depth (DAOD) from three perspectives: meteorological factors, ground conditions, and human activities. These factors include 10 m wind speed, temperature, precipitation, relative humidity, NDVI, soil temperature, soil moisture, and population density.
Meteorological data during the study period as well as ground conditions (soil temperature and soil moisture) were obtained from the 5th-generation atmospheric reanalysis (ERA5) dataset of the European Center for Medium-Range Weather Forecasts (ECMWF) [45]. The data were formatted as nc and processed into tif for computation. The missing values were replaced with NaN. Details on the data used to study the influencing factors are given in Table 1.
By utilizing multivariate data with long time series and employing linear regression analysis methods, we analyzed the changes in the distribution of DAOD due to these influencing factors and their respective trends.

2.3. Methodology

2.3.1. Linear Trend Analysis

Simple linear regression analysis utilizes the least squares method to model the temporal variation pattern of a variable on an image-by-image basis, thereby capturing its variation characteristics over a given time period [46,47,48,49]. This technique is commonly employed for trend analyses of aerosol data, as it can effectively fit the variation of variables over the entire time series. To reflect the trends of and spatial differences in dust aerosols and their influencing factors in East Asia from 2000 to 2022, a one-dimensional linear regression analysis of the annual mean dust aerosol levels based on the image element scale was conducted using the slope of the trend of the image element DAOD or DAOD influencing factor.
s = i = 1 n y i y x i x i = 1 n x i x 2
where i = 1, 2, … n is the length of the study year and n is 23; y is the DAOD or the impact factor of DAOD; xi is the year; and s is the slope. If s is positive, it means that the physical quantity represented by this image element had an increasing trend during 2000–2022, and vice versa.

2.3.2. Pearson’s r

The correlation coefficient, denoted as Pearson’s r, indicates the strength of the correlation between two variables. In a set of variables x and y with a sample size of n, the correlation coefficient measures the linear relationship between the two variables by calculating the ratio of their covariance to the product of their variances. The formula for calculating the correlation coefficient is as follows:
r = i = 1 n x i x y i y i = 1 n x i x 2 i = 1 n y i y 2
where r denotes the Pearson correlation coefficient of the two elements, and xi and yi represent the mean values of x and y in the study years, respectively.

2.3.3. Grey Relational Analysis

Grey relational analysis (GRA) is a kind of analysis method based on grey system theory that uses grey correlation to describe the strength, magnitude, and order of relationships between factors based on sample data for each factor [50,51,52]. Grey correlation analysis can address the issues of nonlinear relationships and small sample sizes, which are not addressed by Pearson’s correlation coefficient. Furthermore, it considers the influences of multiple factors. Hence, it is an effective analysis tool that can be applied in the study of the relationship between dust aerosols and influencing factors.
Let Xi(k) (i = 1, 2, …, h) denote h driving factors and Y(k) denote DAOD, a time series for k = 1, 2, …, n. The following formula was used to calculate the average correlation coefficients of each driving factor with respect to DAOD [53].
G i ( k ) = D i ( k ) m i n + D i ( k ) m a x D i ( k ) + b D i ( k ) m a x
The following formula defines four variables: Di(k) = |Y(k) − Xi(k)|, which represents the absolute difference between Y and Xi at the kth point; Di(k)min, which describes the minimum difference between the two poles; Di(k)max, which denotes the maximum difference between the two poles; and b, which is the resolution coefficient and can be assigned any value ranging between 0 and 1, but is typically set to 0.5.
The grey correlation between each driving factor and DAOD is:
P i = 1 n k = 1 n G i ( k )

2.3.4. Geographical Detector

The geographic detector is a statistical model used for analyzing spatial data and exploring the driving forces of variables [54]. The geographic detector model includes four detectors: risk, factor, ecological, and interaction detectors [1]. In this study, factor detection and interaction detection using geodetectors were used to analyze the drivers of dust aerosol distribution and their interactions in East Asia. The factor detectors measure the magnitude of the drivers by calculating the spatial similarity between the drivers and the variables being detected, which are expressed as q-values, in the range [0, 1]:
q = 1 h = 1 L N h σ h 2 N σ 2
where σ2 is the variance of independent variable Y and N is the number of sample points. Furthermore, Nh denotes the number and variance of the samples (pixels) in layer h. L represents the number of categories obtained after discretizing the factors during the data preprocessing stage. The superposition of X and Y variables forms L layers in Y, which are represented as h = 1, 2, …, L.
The significant advantage of interaction detection is its ability to analyze the combined effects of two factors on the dependent variable Y in terms of explanatory power. These interactions can be categorized into five types, as shown in Table 2.

3. Results and Discussions

3.1. MERRA-2 AOD Data Accuracy Validation

When verifying the accuracy of satellite AOD data using AERONET ground-based observation data, it is important to consider wavelength matching and the spatial and temporal scales of the two datasets to improve the reliability of the comparison. Typically, the AOD at 550 nm is selected for study. However, due to the lack of data in the 550 nm band at AERONET sites, wavelength interpolation is necessary. According to Ångström’s theory, aerosol optical depth and wavelength satisfy the Ångström relationship:
α = ln τ λ 1 ln τ λ 2 ln λ 1 ln λ 2
where α represents the Angstrom wavelength index and λ represents the wavelength. Since some of the AERONET sites are missing 500 nm data, the AOD at 550 nm was obtained by interpolating the data from sites with wavelengths of 440 nm and 675 nm. Additionally, to account for the differences in time and space between the site and satellite image, a validation evaluation was conducted by comparing the average value of the satellite data within a 3 × 3 pixel area surrounding the site location with the site data.
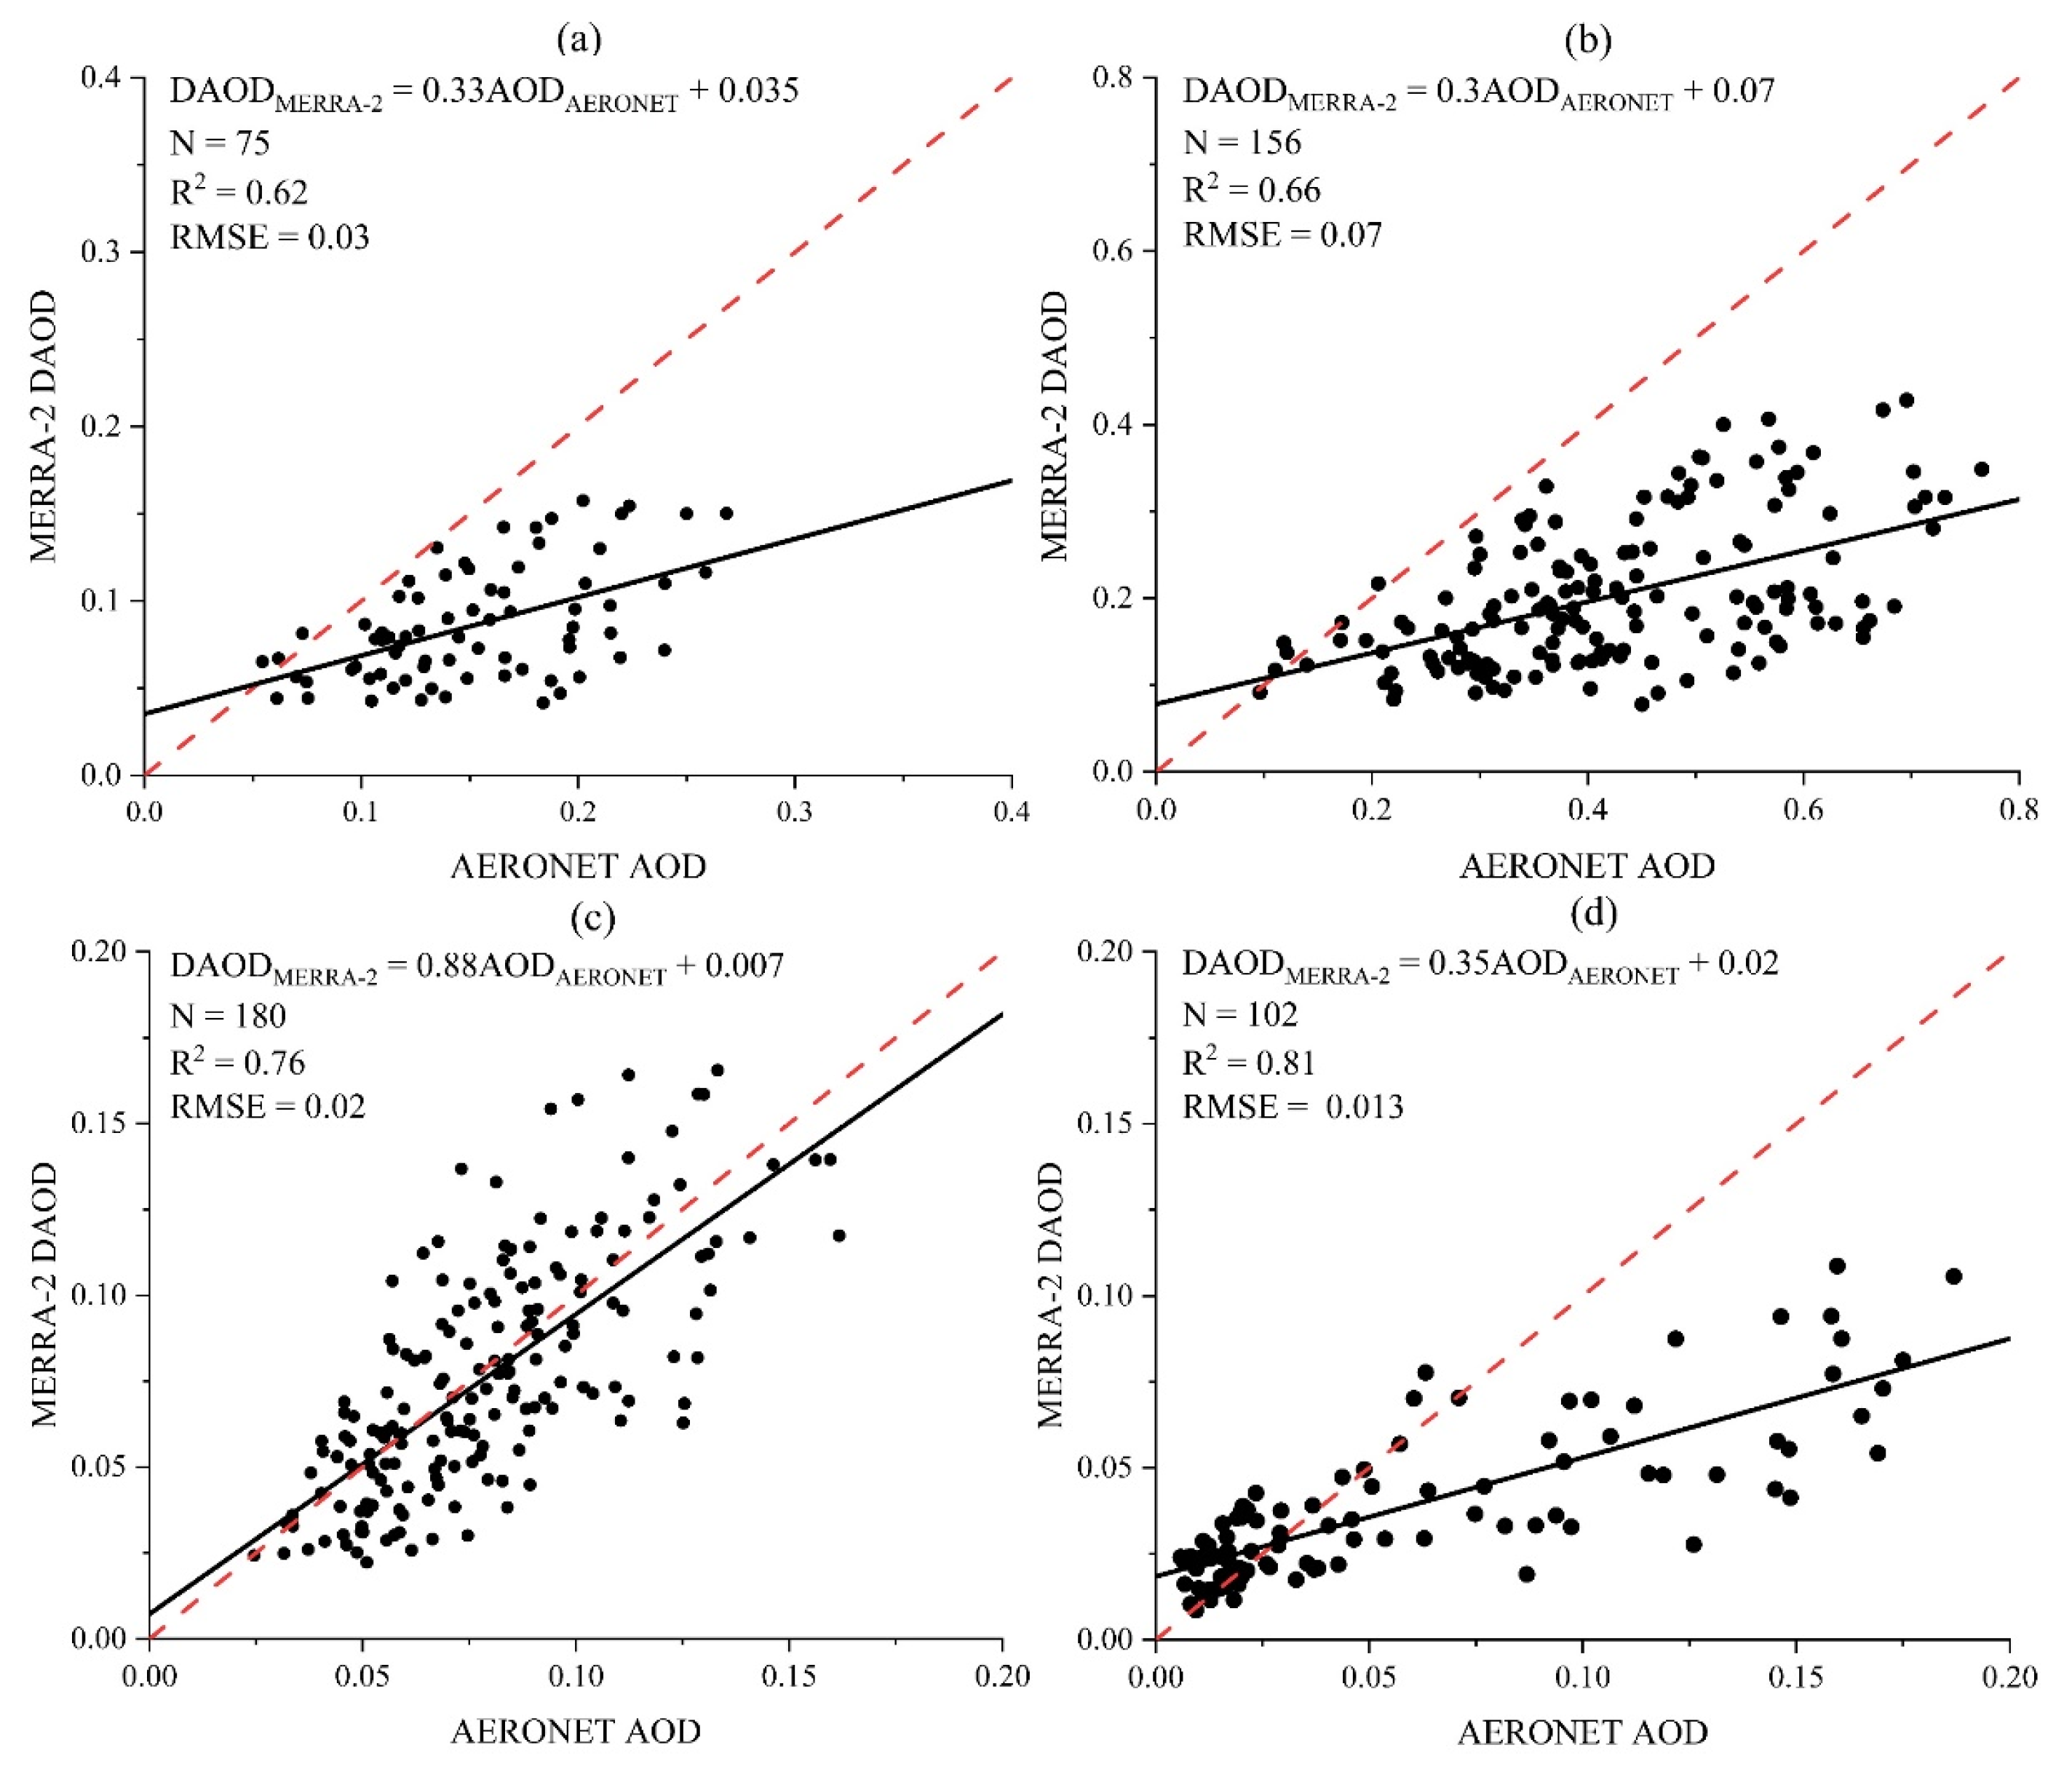
The accuracy of the MERRA-2 DAOD dataset was verified using available monthly AERONET observations from four stations (AOE_Baotou, Beijing, Dalanzadgad, and QOMS_CAS) for the years 2000–2022. The results are shown in Figure 2. The slope of the linear fit equation for the data of all four stations was less than 1, indicating that the AOD values of the MERRA-2 DAOD were lower than those of the ground stations. This result is consistent with a previous study [28]. This difference is attributed to the fact that dust aerosol is one of the aerosols, and the proportion of the AOD accounted for by the DAOD is different at different stations. The DAOD showed lower values compared to the AERONET AOD at all sites except for Dalanzadgad, but similar values were shown at Dalanzadgad. This is believed to be due to the location of the observation site and the influence of dominant aerosols. Dalanzadgad is located at the source of dust particles, and most of the AOD is dust, but it is believed that the other three regions have a lot of other pollutants in addition to dust aerosol.
From Figure 2, it can be seen that the MERRA-2 DAOD data from the four stations show a significant positive correlation with the AERONET site data at 550 nm. The overall trends of the two were consistent, with small standard errors and an R2 greater than 0.6. These results indicate that the precision of the MERRA-2 DAOD data is reliable and can be used for analyzing the spatial and temporal distribution of dust aerosols.

3.2. Spatiotemporal Dynamic Characteristics of DAOD and Changing Trends

3.2.1. Interannual Distribution and Variation of DAOD

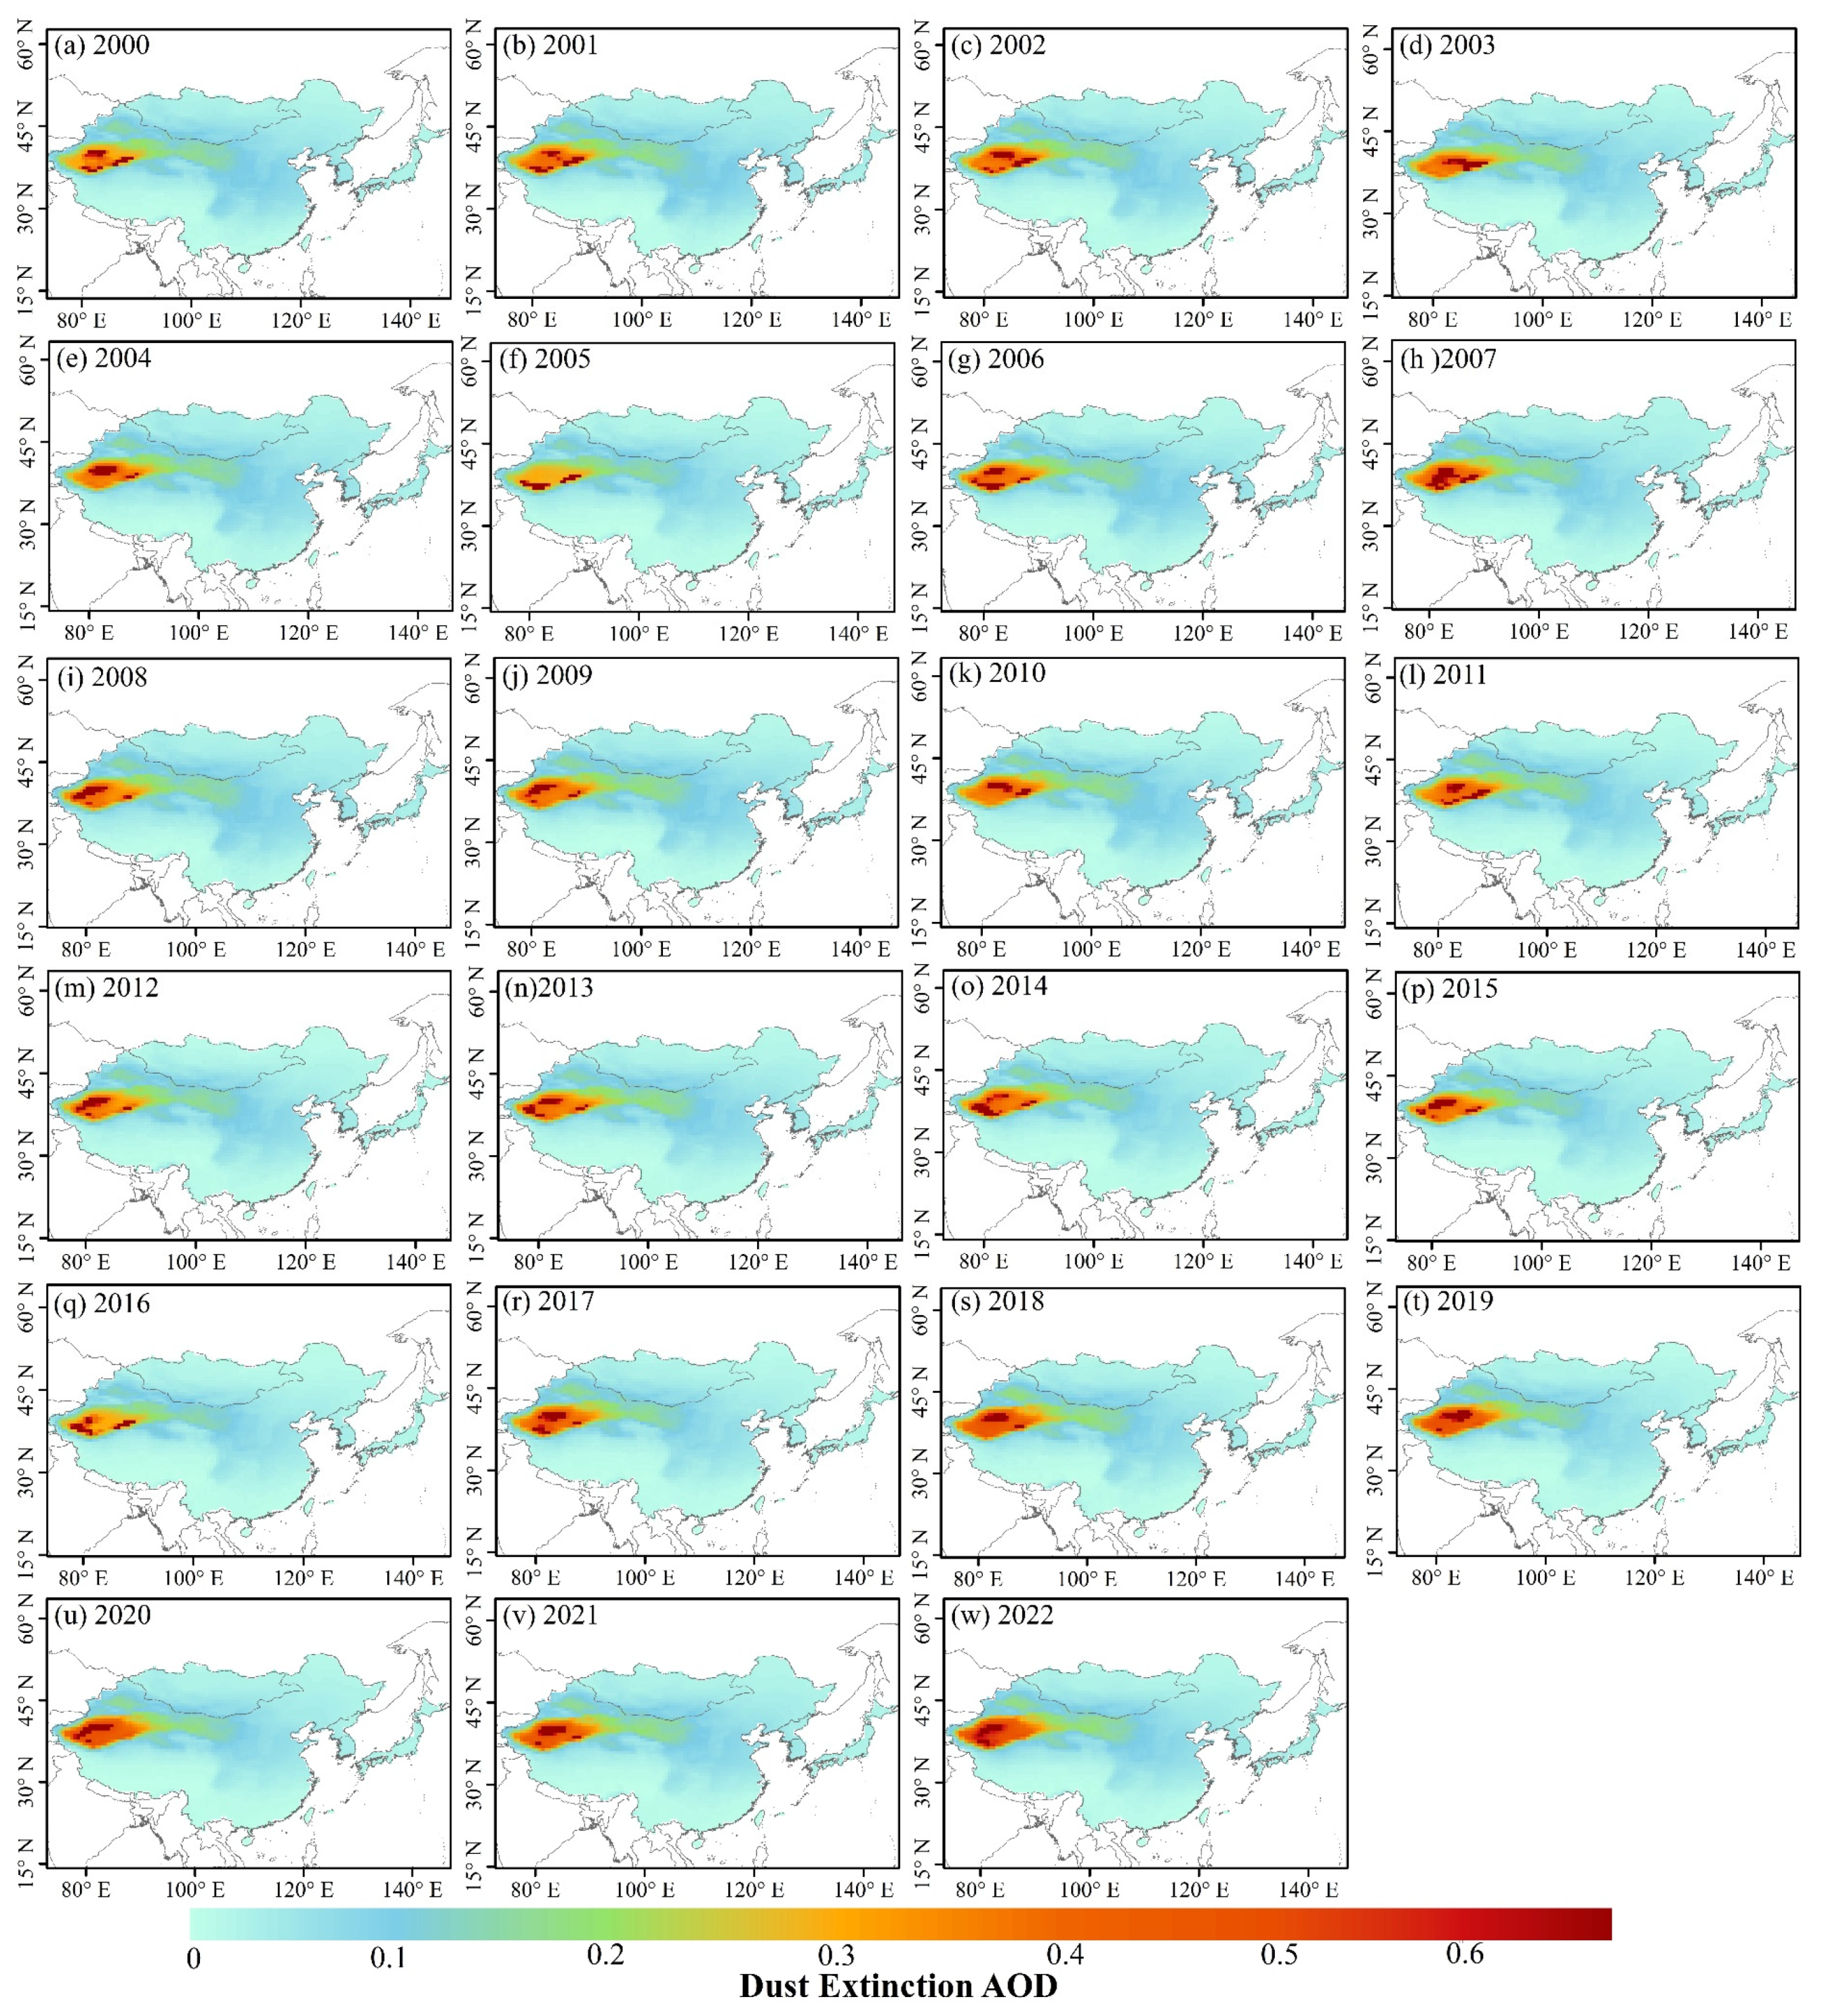
The spatial distribution of the dust aerosol optical depth (DAOD) in different years in East Asia is shown in Figure 3. Since 2000, the overall spatial pattern of the average DAOD in East Asia exhibited a decreasing trend from northwest to southeast, with the TDR and GDR being the two areas with the highest DAOD values. The annual mean DAOD in East Asia varied between 0 and 0.6, with an annual mean DAOD in the GDR of around 0.2–0.3, while the annual mean DAOD in the TDR was the highest, reaching 0.3–0.6. The DAOD in different years also showed different spatial distributions. The DAOD in East Asia was higher in 2007, 2009, 2018, 2020, and 2022, while it was lower in 2000, 2005, 2012, and 2016. The remaining years, such as 2000–2004 and 2013–2015, showed a basically flat trend.
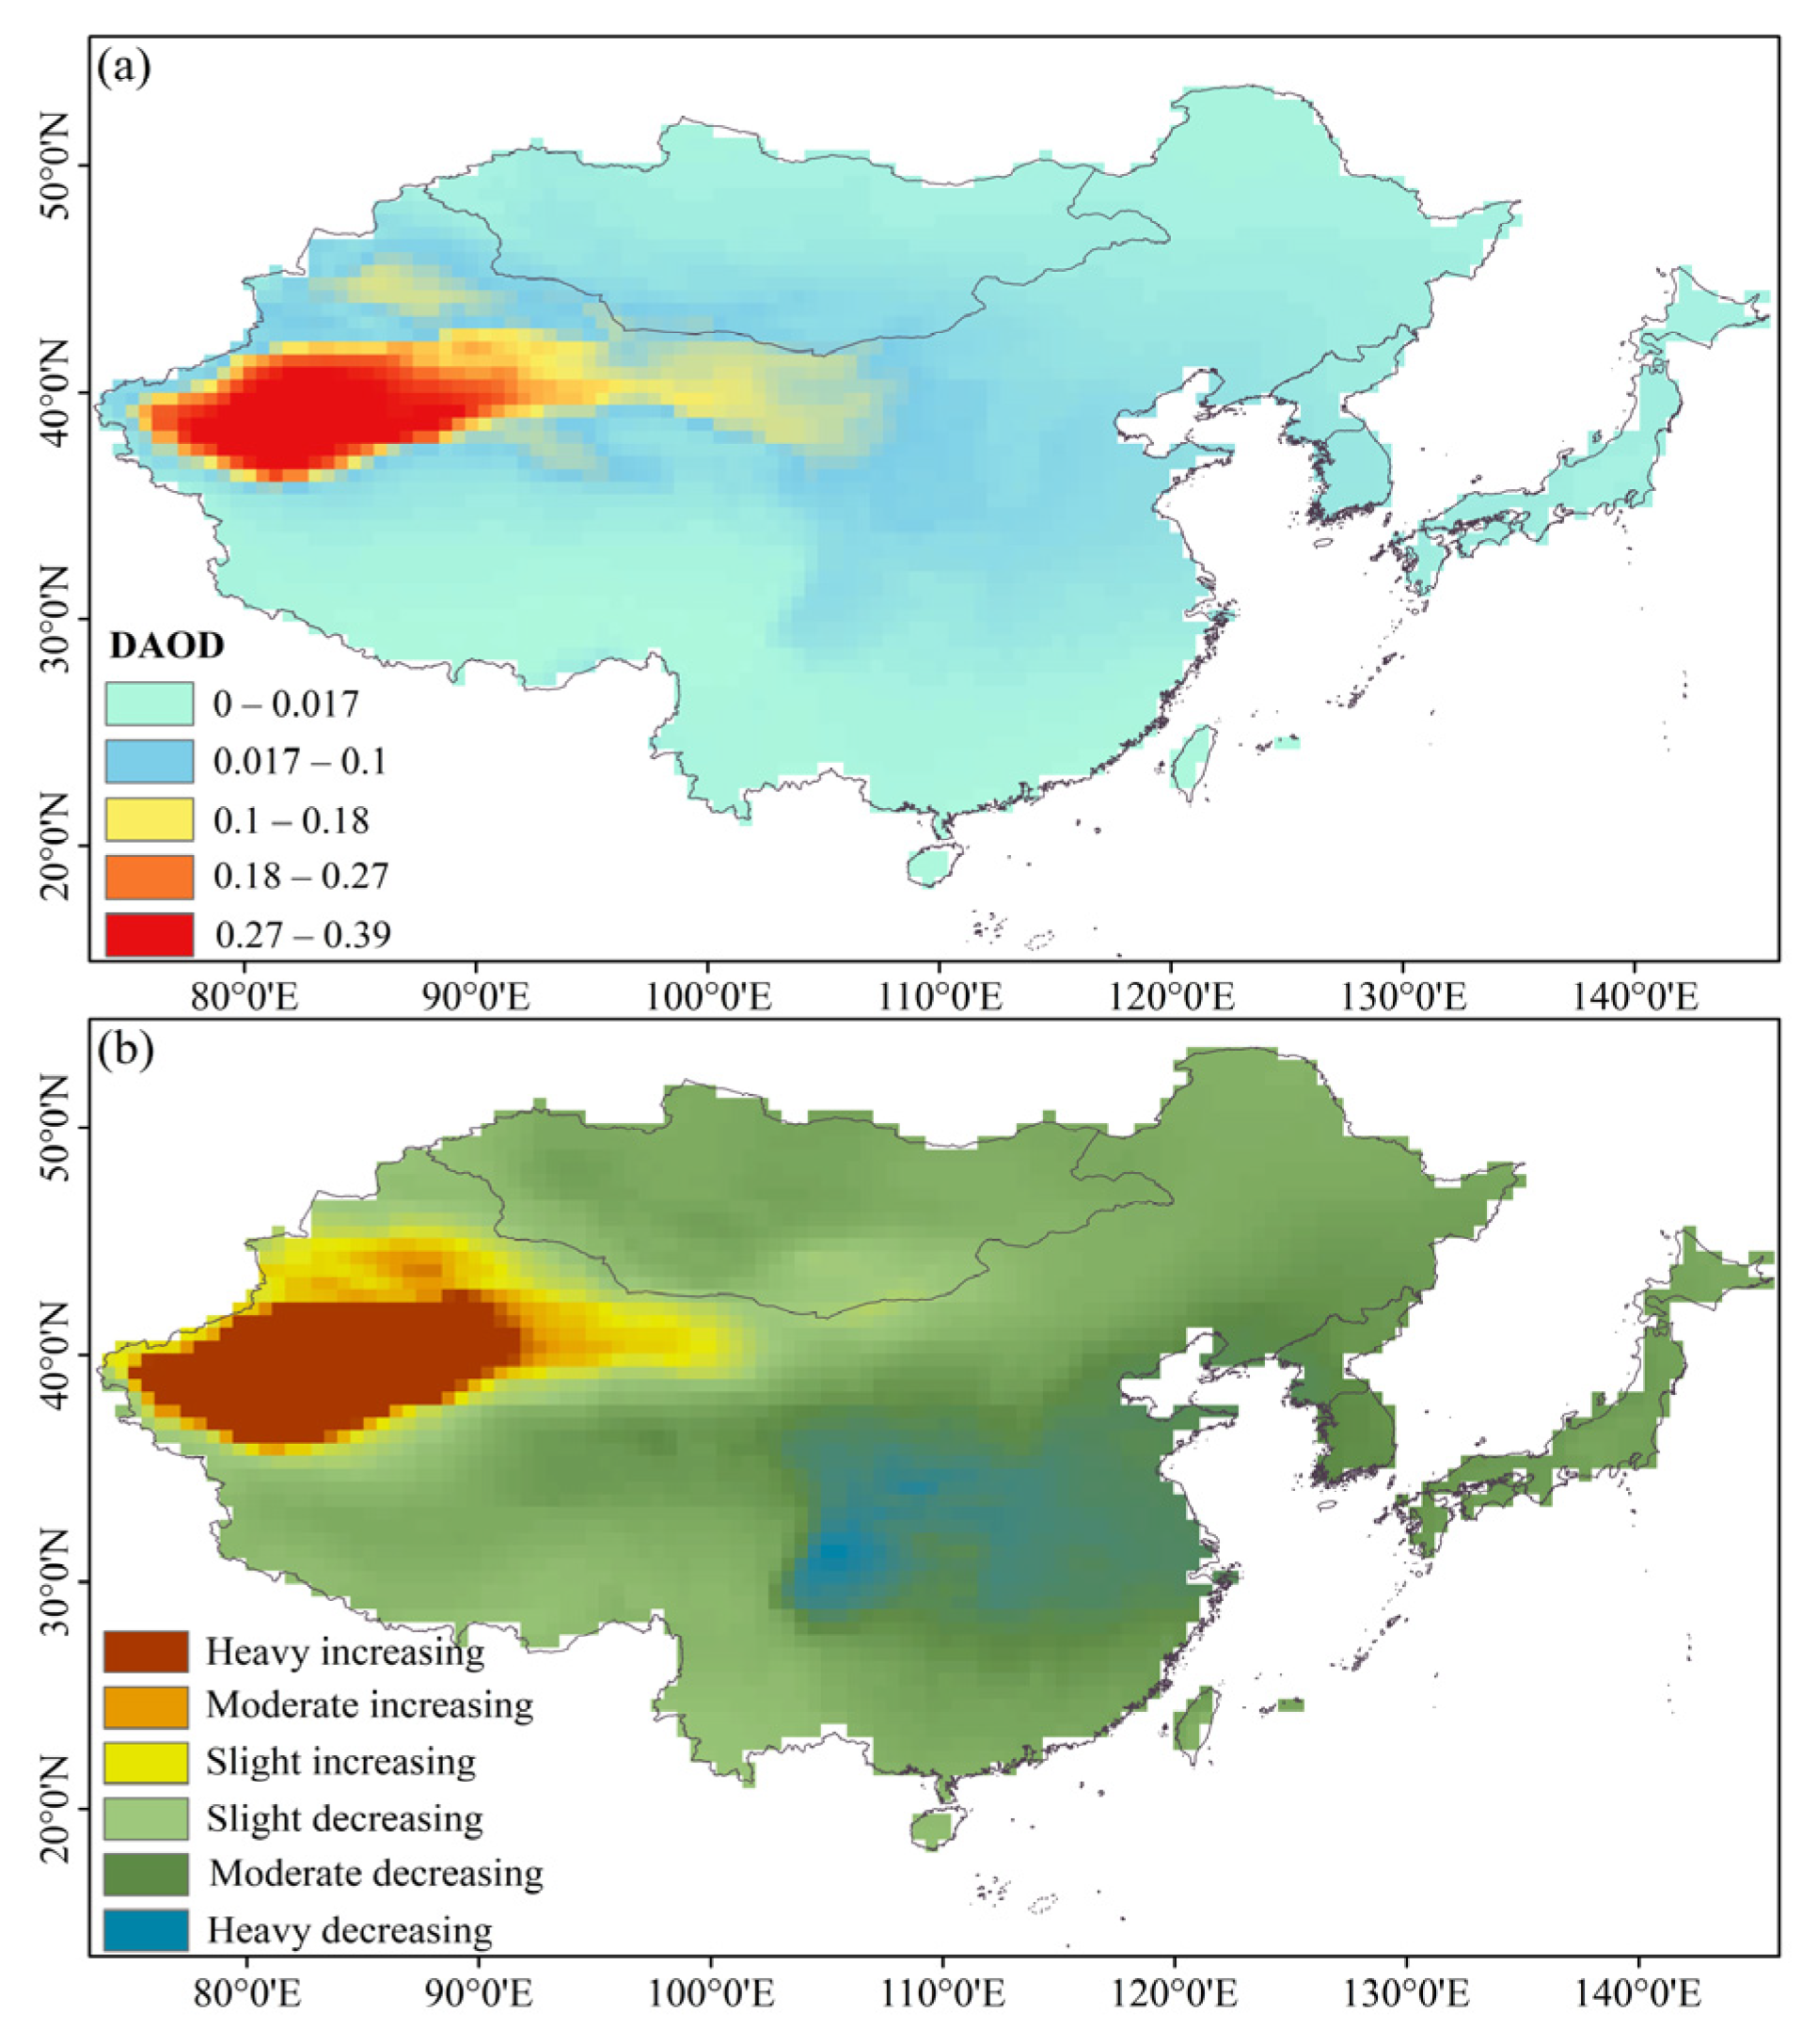
Figure 4a displays the spatial distribution of the multi-year average DAOD in East Asia from 2000 to 2022. The annual trend of DAOD from 2000 to 2022 in East Asia was classified based on a pixel trend analysis, which divided the pixels into six levels: slightly increasing, moderately increasing, heavily increasing for pixels with positive slopes and slightly decreasing, moderately decreasing, heavily decreasing for pixels with negative slopes. The results can be seen in Figure 4b. Owing to the considerable geographic variability of dust aerosols and their unstable physical and chemical characteristics, there were noticeable spatial disparities in the DAOD variation across East Asia during the study period. Dust particles in the TDR had the highest contribution to the DAOD at 0.337, followed by the GDR at 0.103. The substantial amount of TDR dust particles implies their significant role in shaping the variation in DAOD. The multi-year analysis of the DAOD trends in East Asia revealed that 95.6% of the total area showed a declining trend, while only 4.4% displayed an escalating trend. Apart from the TDR and its adjacent areas where a significant increase in the DAOD was apparent, the other regions exhibited a decline in DAOD, especially in the southern area with a significant decreasing trend. The GDR, as another significant source of dust in East Asia, had an overall slight decline. As a general trend, the DAOD variation in East Asia followed a significant increase–moderate decrease–moderate decrease–significant decrease pattern from the northwest to the southeast.
Figure 5 displays the interannual variation trend of dust aerosols in East Asia, as well as their typical sources, such as the TDR and GDR, during the period from 2000 to 2022. It can be observed from Figure 5 that the DAOD values of different regions exhibited varying trends and fluctuations in different years. Overall, the DAOD in East Asia showed a decreasing trend from 2000 to 2022, with an average annual reduction rate of −0.0002 (p < 0.01). The DAOD of the two major dust sources in East Asia exhibited different trends, consistent with the conclusions obtained from Figure 4. In the two major dust sources in East Asia during the research period, the annual average DAOD in the TDR increased, with an average annual growth rate of 0.004 (p < 0.01), while the GDR experienced a decrease, with an average annual reduction rate of −0.0003 (p < 0.01). These two trends exhibited distinct patterns: one trend showed an increase with fluctuations while the other exhibited a decrease. However, they showed similar patterns of change such as a decreasing DAOD in 2005, 2012, and 2016 and increasing DAOD in 2006, 2013, and 2018. The overall annual trend in changes in DAOD between 2000 and 2022 in East Asia was extremely similar to the trend in the GDR.

3.2.2. Intermonthly Distribution and Changes of DAOD

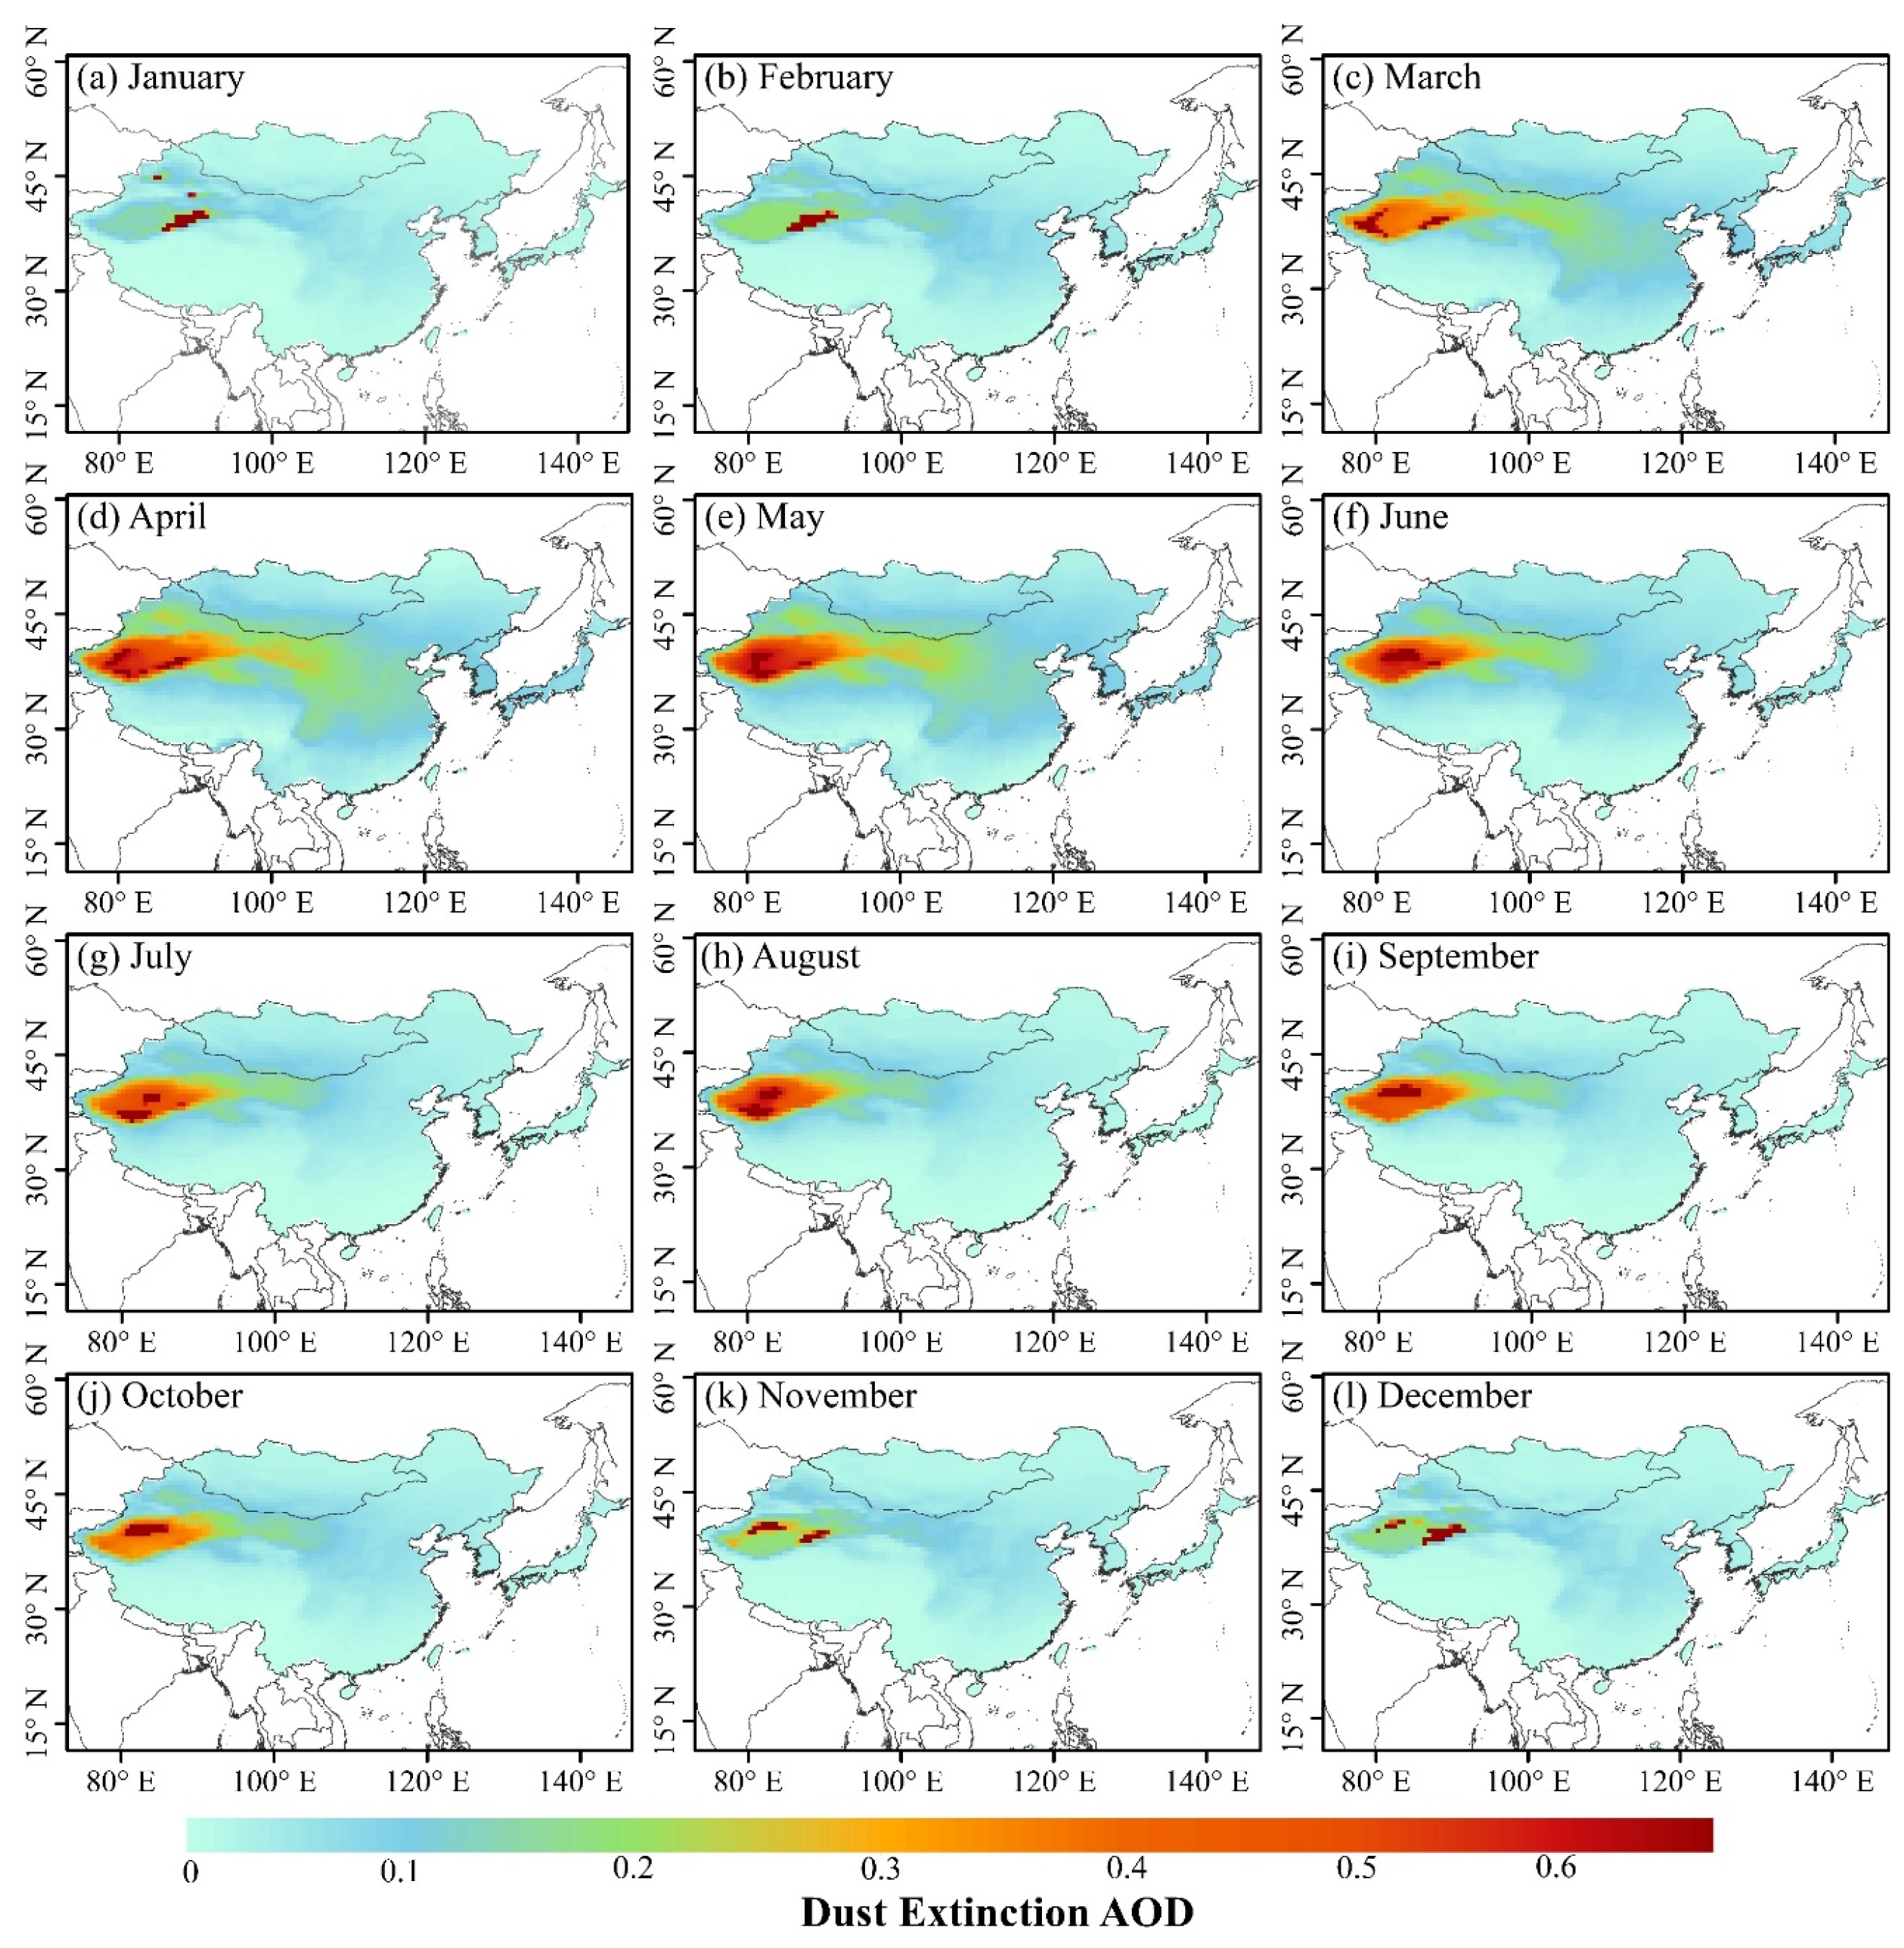
Figure 6 illustrates the monthly average distribution of the DAOD in East Asia from 2001 to 2022. The spatial pattern revealed a consistent northwest-to-southeast gradient, with higher values observed in the TDR and GDR. Notably, the DAOD exhibited substantial variability across different months. The months of April to September exhibited the highest DAOD values, followed by March and October, while the lowest values occurred during January, February, November, and December.
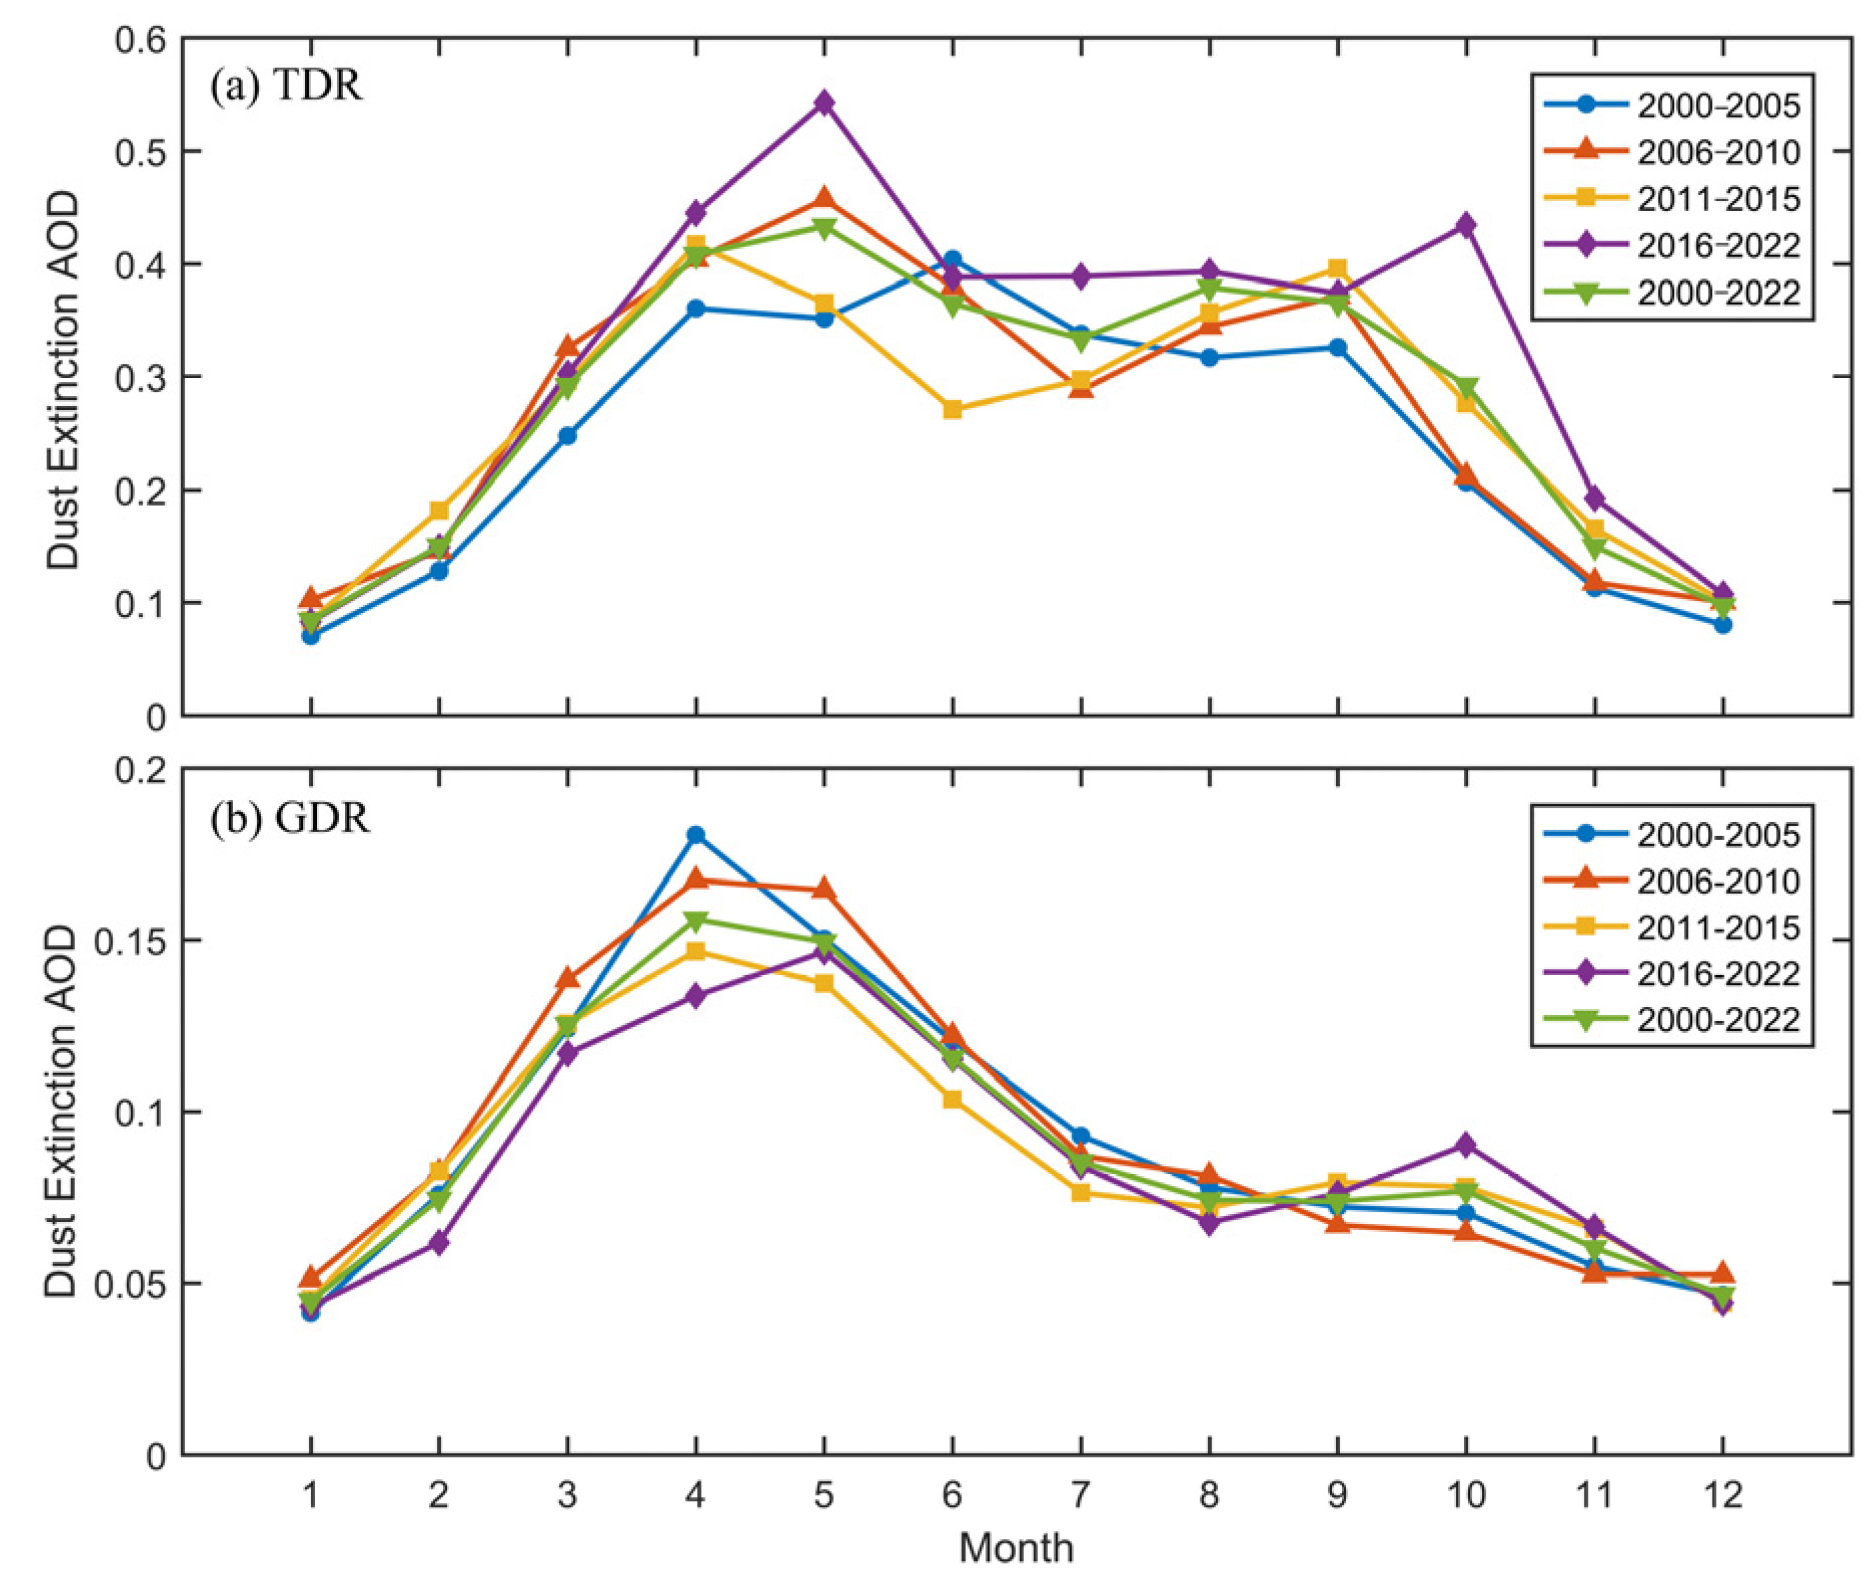
Figure 7 facilitated the determination of the mean variations in DAOD for both the TDR and GDR over different months and years. Notably, distinct spatial and temporal patterns emerged in the evolution of the DAOD. In the TDR, a bimodal pattern characterized the annual DAOD variations. The majority of high DAOD values across different years occurred predominantly in May, with the highest peak during 2000–2005 observed in June and during 2011–2015, it was observed in April. In addition to the major peaks in April–June, minor peaks appeared in September–October. Conversely, the GDR exhibited a consistent peak in DAOD values during April for each year, while the lowest values were consistently observed in August, except during 2006–2010 when they appeared in September. Additionally, the GDR consistently exhibited a minor peak in DAOD during October, regardless of the specific year. The disparities in the timing of the highest and lowest monthly DAOD values between the TDR and GDR underscore potential variations in influencing factors. These findings emphasize the need to consider region-specific factors when assessing the temporal variability of DAOD [55].

3.2.3. Interseasonal Distribution and Changes in DAOD

This study adopted the widely recognized seasonal division in meteorology, which divides a year into four seasons (spring (March to May), summer (June to August), autumn (September to November), and winter (December to next February)) in order to analyze the average seasonal distribution of the DAOD for East Asia from 2000 to 2022, as shown in Figure 8. The average seasonal distribution of dust aerosols in East Asia from 2000 to 2022 showed distinct seasonal characteristics. The areas with high DAOD values in all four seasons were mainly distributed in the two major dust sources in East Asia: the TDR and GDR. Among these, the AOD of dust aerosols in the TDR was more than twice that of the GDR. Secondly, the distribution of the DAOD in East Asia exhibited a clear seasonal pattern. The TDR has a DAOD greater than 0.5 in spring, which decreased gradually during summer and autumn, and was the lowest (DAOD < 0.2) in winter. In the GDR, the DAOD reached approximately 0.3 in spring and declined to around 0.2 during summer and autumn, and only 0.1 or lower in winter. The seasonal contribution of dust aerosols was highest in spring (0.114), followed by summer (0.076), autumn (0.055), and winter (0.040). This is due to the increase in temperature and melting of snow during spring, leading to a decrease in soil moisture, less precipitation, and windy conditions, which make the loose soil surface more susceptible to dust generation [1].
These results are consistent with those of another study [56], which indicates that the frequent dust events in spring and summer result in higher overall DAOD values. In winter, surface dust is less likely to be generated as the snow cover limits the exposure of the underlying surface, leading to lower overall DAOD values [57]. Consistent with the spatiotemporal distribution of the average monthly DAOD, the seasonal distribution of dust aerosols in East Asia also followed a decreasing trend from west to east.
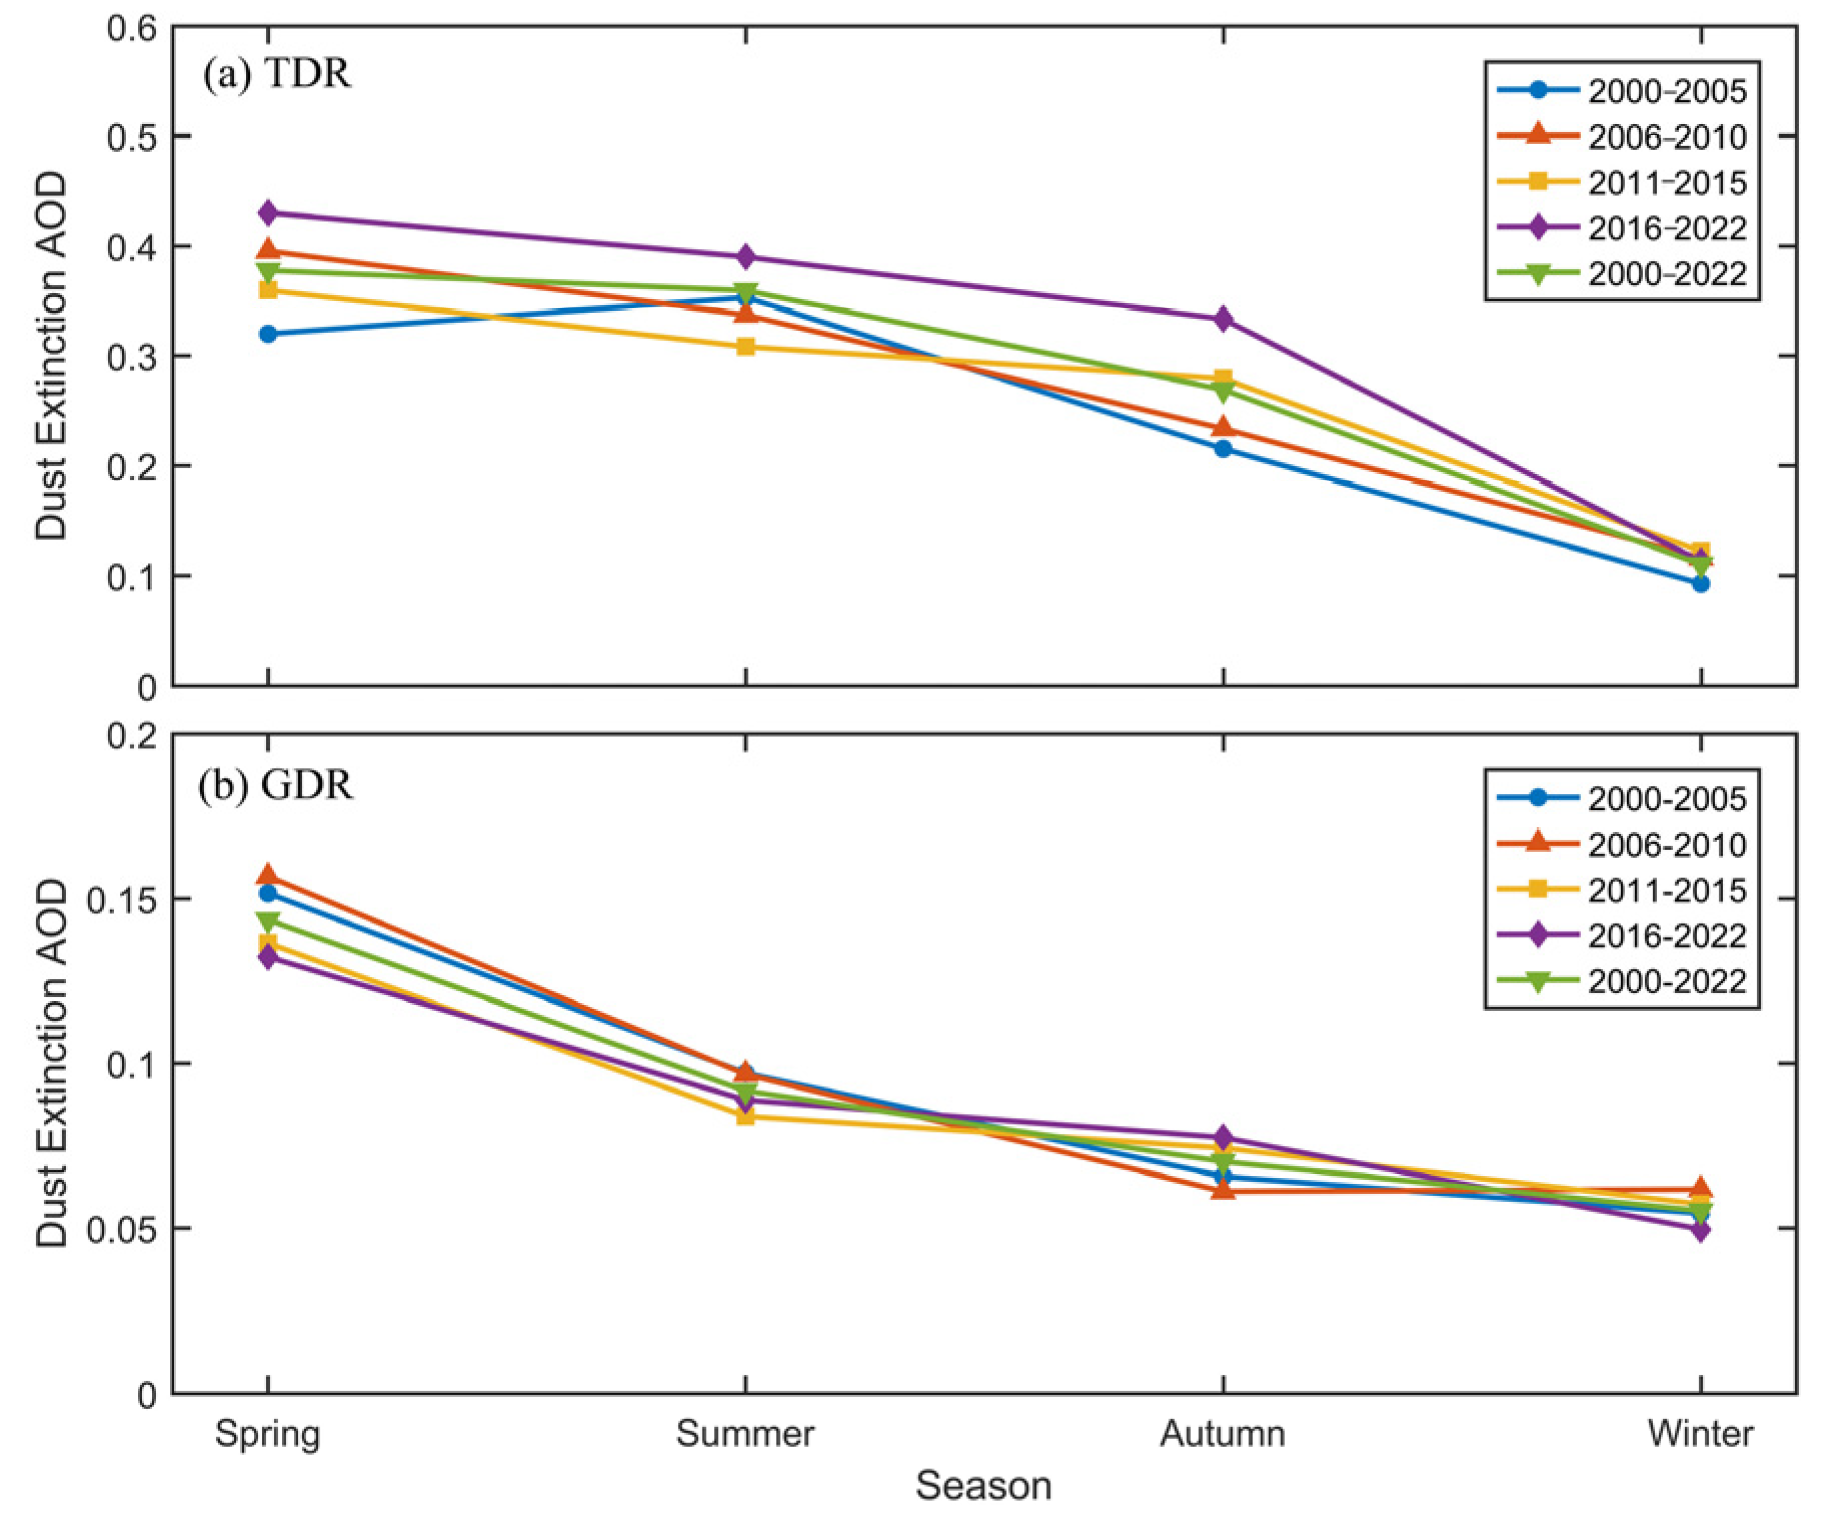
Figure 9 illustrates the seasonal variations in the average DAOD in the TDR and GDR in 2000–2005, 2006–2010, 2011–2015, 2016–2022, and 2000–2022. In the TDR, except for the summer of 2000–2005, the DAOD contribution in other years was highest in spring (0.377), followed by summer (0.360), autumn (0.269), and winter (0.110). On the other hand, in the GDR, the DAOD contribution decreased from spring to winter except for the winter of 2006–2010, with mean values of 0.143, 0.092, 0.070, and 0.055 for the different seasons, respectively. Apart from the distinct seasonal variation characteristics, the mean DAOD in the TDR was about two to three times higher than that in the GDR.

3.3. DAOD Influencing Factors and Their Trends

3.3.1. Meteorological Factors

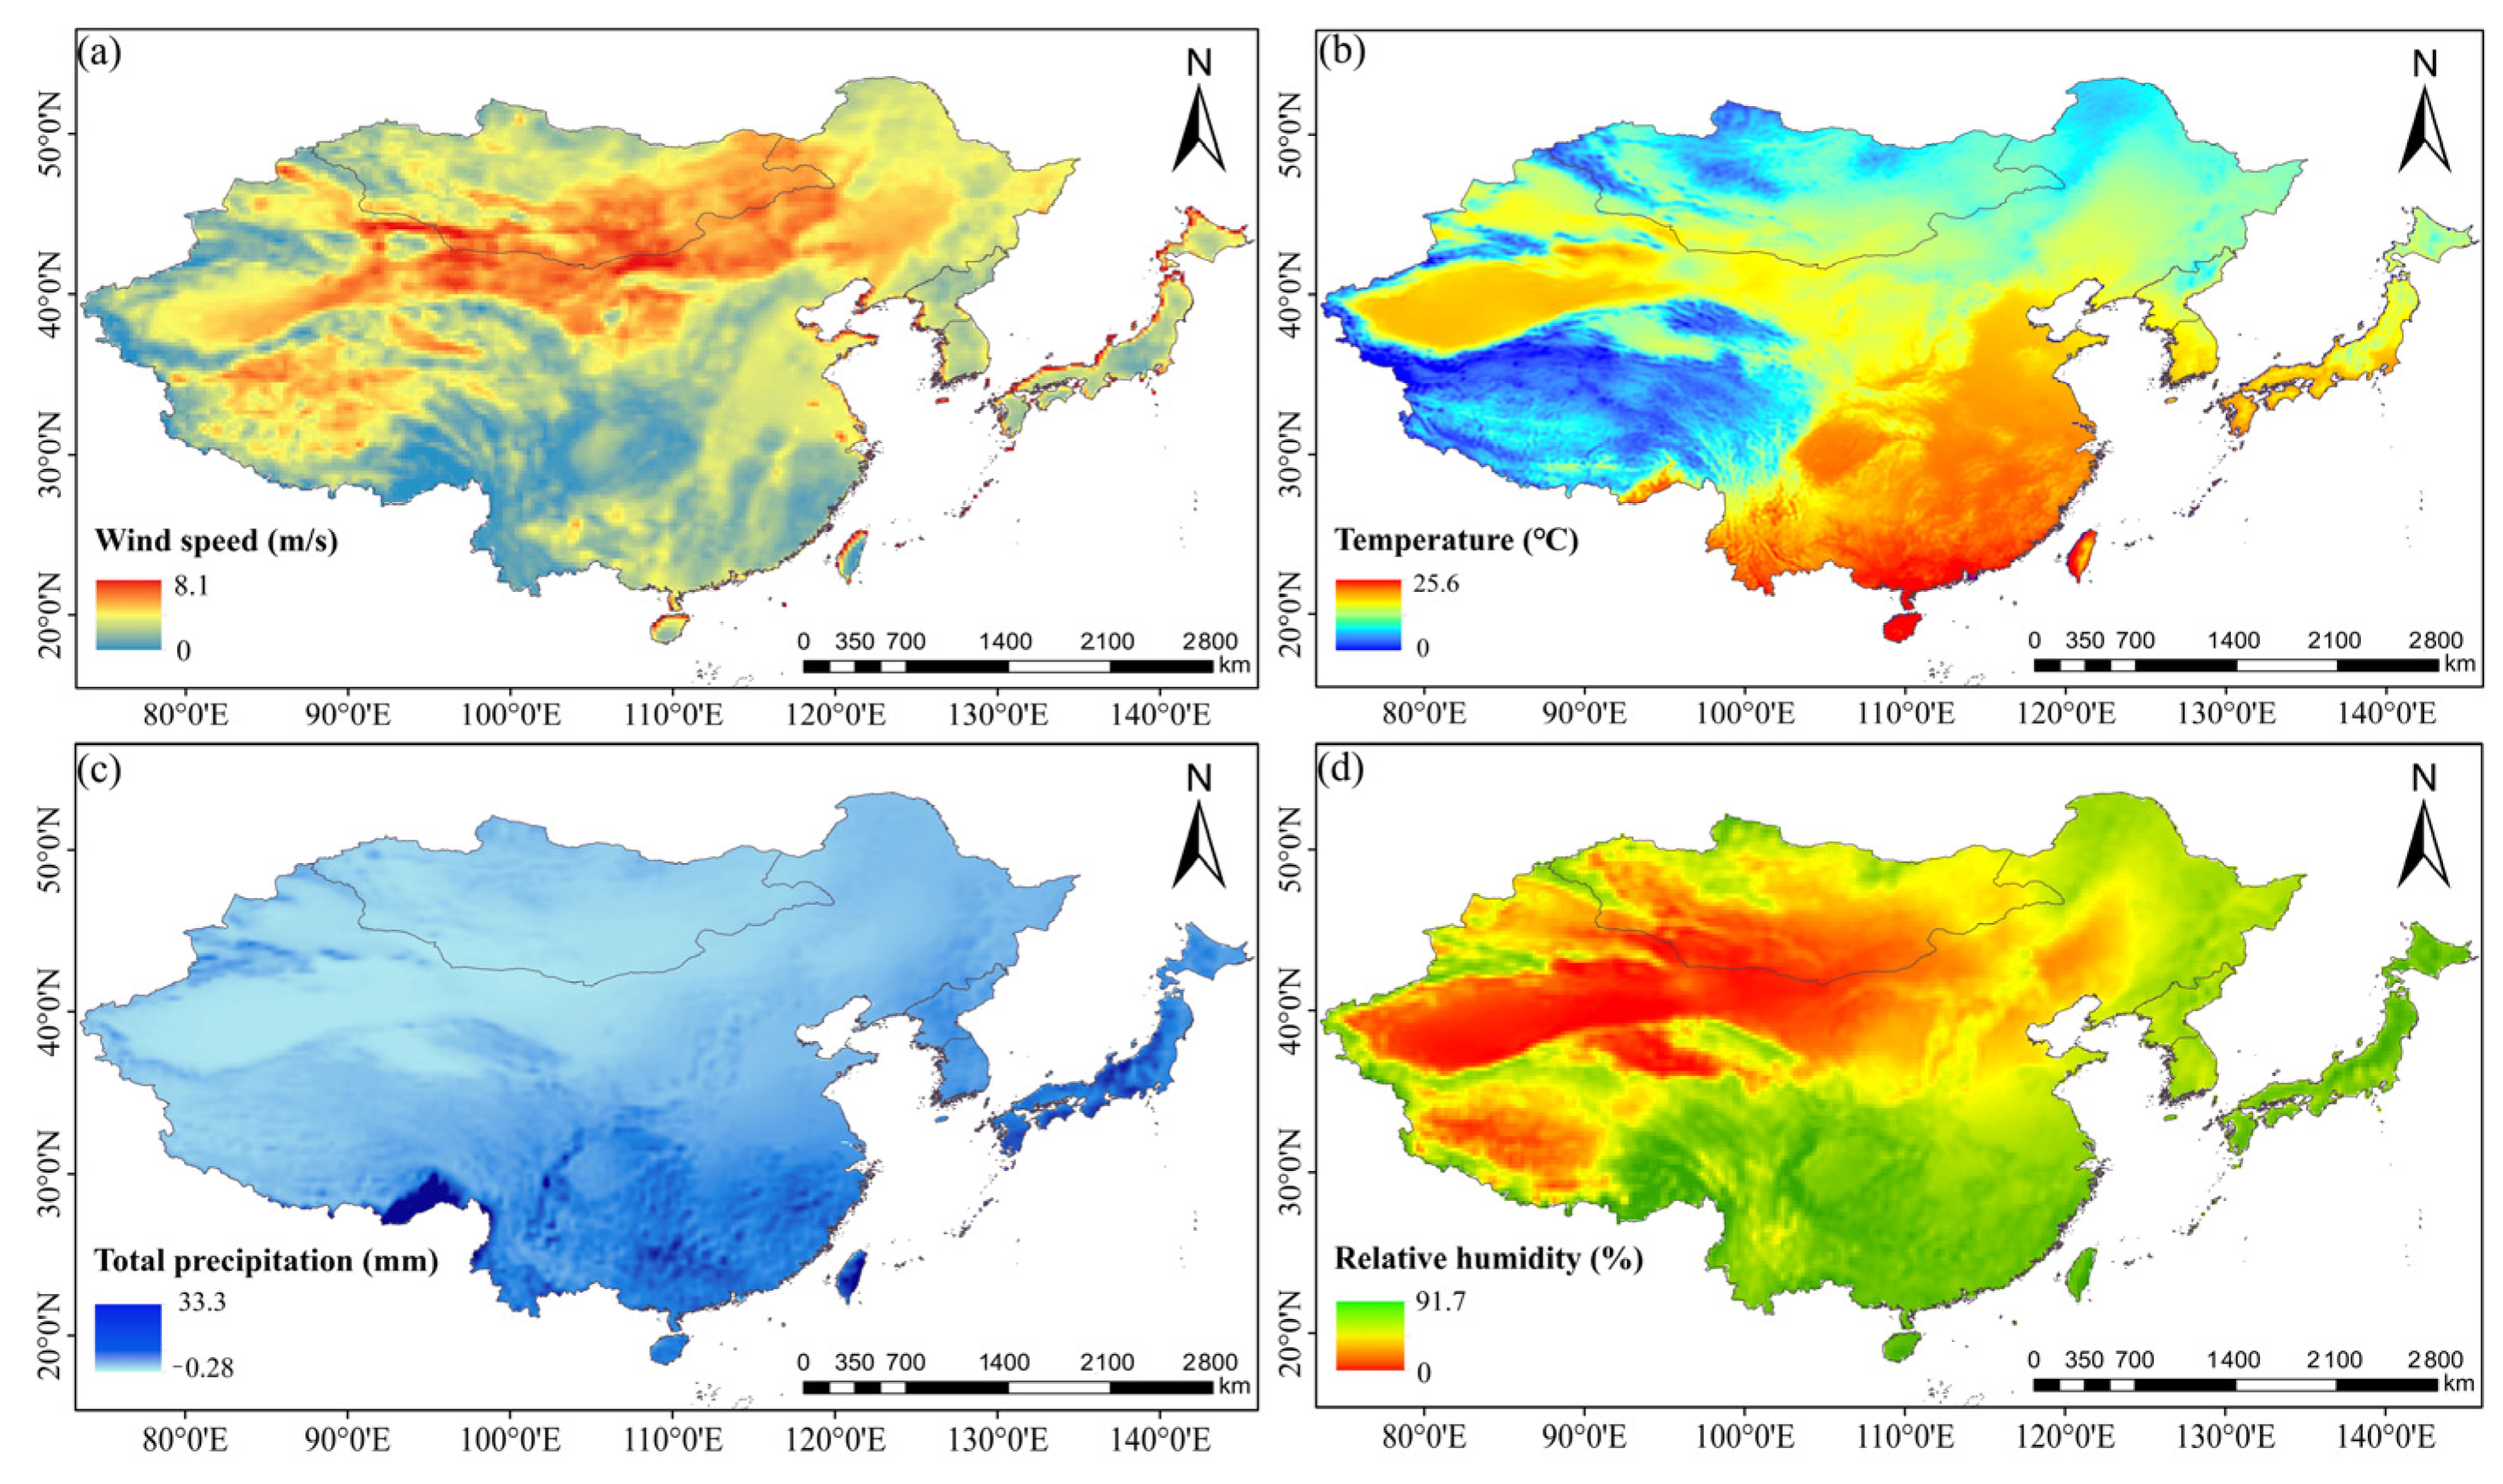
As depicted in Figure 10, the areas with higher wind speeds were mainly concentrated in northern China, including the Mongolian region, as well as near the TDR. Additionally, the Qinghai–Tibet Plateau, situated at a considerable altitude, exhibited high wind speeds. The spatial distribution of temperature in East Asia showed a distinct pattern, with higher temperatures observed in the southeast and lower temperatures in the northwest. This distribution was influenced by both altitude and latitude. Notably, the average annual temperature was lower in regions like Qinghai Province and Inner Mongolia, which are located at higher latitudes. Conversely, areas with desert terrain and the southeastern region, known for their warm and humid climates, exhibited higher temperatures. The distribution of precipitation displayed significant variability but followed a discernible pattern, with a decreasing trend from southeast to northwest. The dividing line for precipitation was around 30°N, with regions north of this line generally experiencing less precipitation compared to those in the south. This dividing line aligns with the distribution of relative humidity.
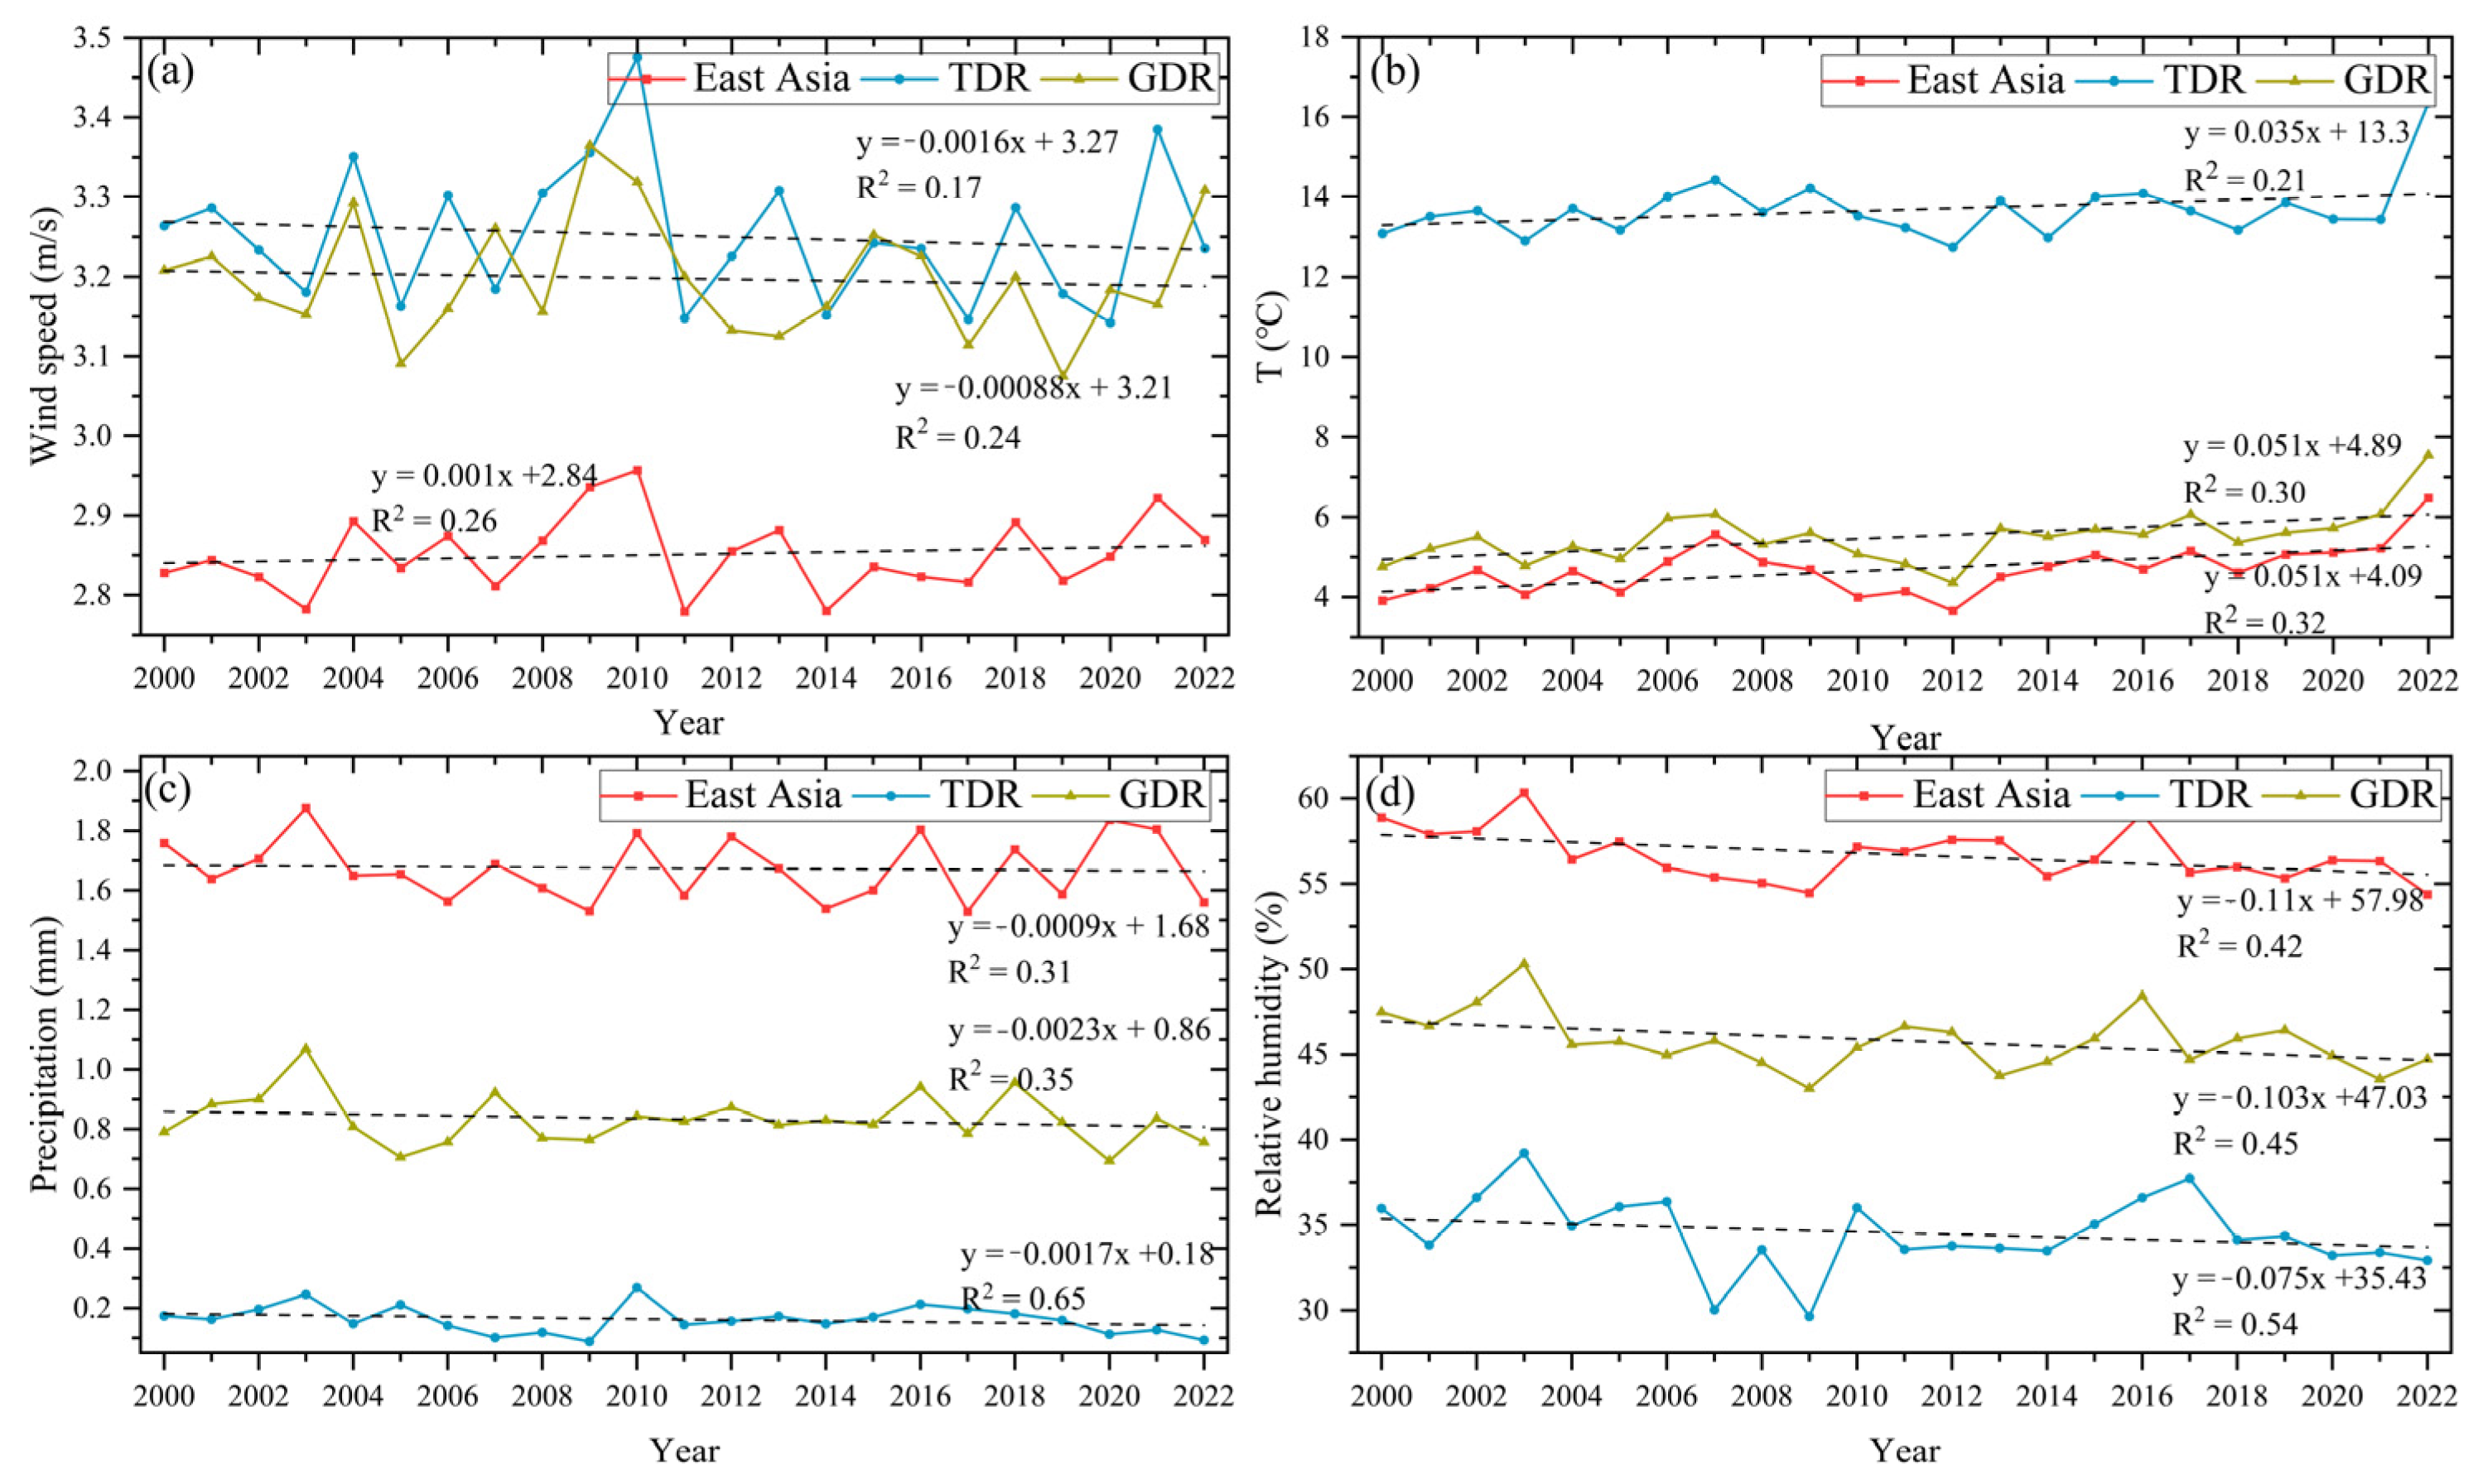
Examining the trends of the meteorological factors in Figure 11, a consistent pattern was observed in the distribution of these factors’ changes and the DAOD across East Asia, as well as in the TDR and GDR. Specifically, the GDR exhibited the highest wind speed values, while the TDR and East Asia as a whole had the lowest values. This trend aligns with the distribution of the DAOD, where the GDR exhibited the highest values, followed by the TDR, and East Asia as a whole had the lowest values. The multi-year trends for wind speed in the three regions exhibited remarkable similarities, particularly in the occurrence of high values around 2004, 2009, 2015, and 2018. In general, there was an increasing trend for wind speed and temperature, while precipitation and relative humidity demonstrated a decreasing trend in East Asia from 2000 to 2022. Similarly, for the TDR and GDR, wind speed, precipitation, and relative humidity exhibited a decreasing trend, while temperature showed an increasing trend.
Comparing these trends with Figure 5, it is evident that although there was an overall decreasing trend in dust aerosol across East Asia, the concurrent decrease in precipitation and relative humidity, as well as the increase in wind speed and temperature, did not result in an overall increase in DAOD for East Asia as a whole. Based on the regional results, it is evident that the TDR and GDR are the primary sources of dust in East Asia. The decreasing trend in precipitation and relative humidity in the TDR aligns with the increasing trend of the DAOD, suggesting a consistent pattern. However, the GDR exhibited a declining trend in both precipitation and relative humidity, while the overall trend in DAOD within the region also indicated a decrease. These observations indicate that the variation in dust aerosol concentration is influenced by complex mechanisms beyond solely meteorological factors. Other factors, such as land surface characteristics and human activities, likely contribute to the intricate dynamics of dust aerosols in East Asia.
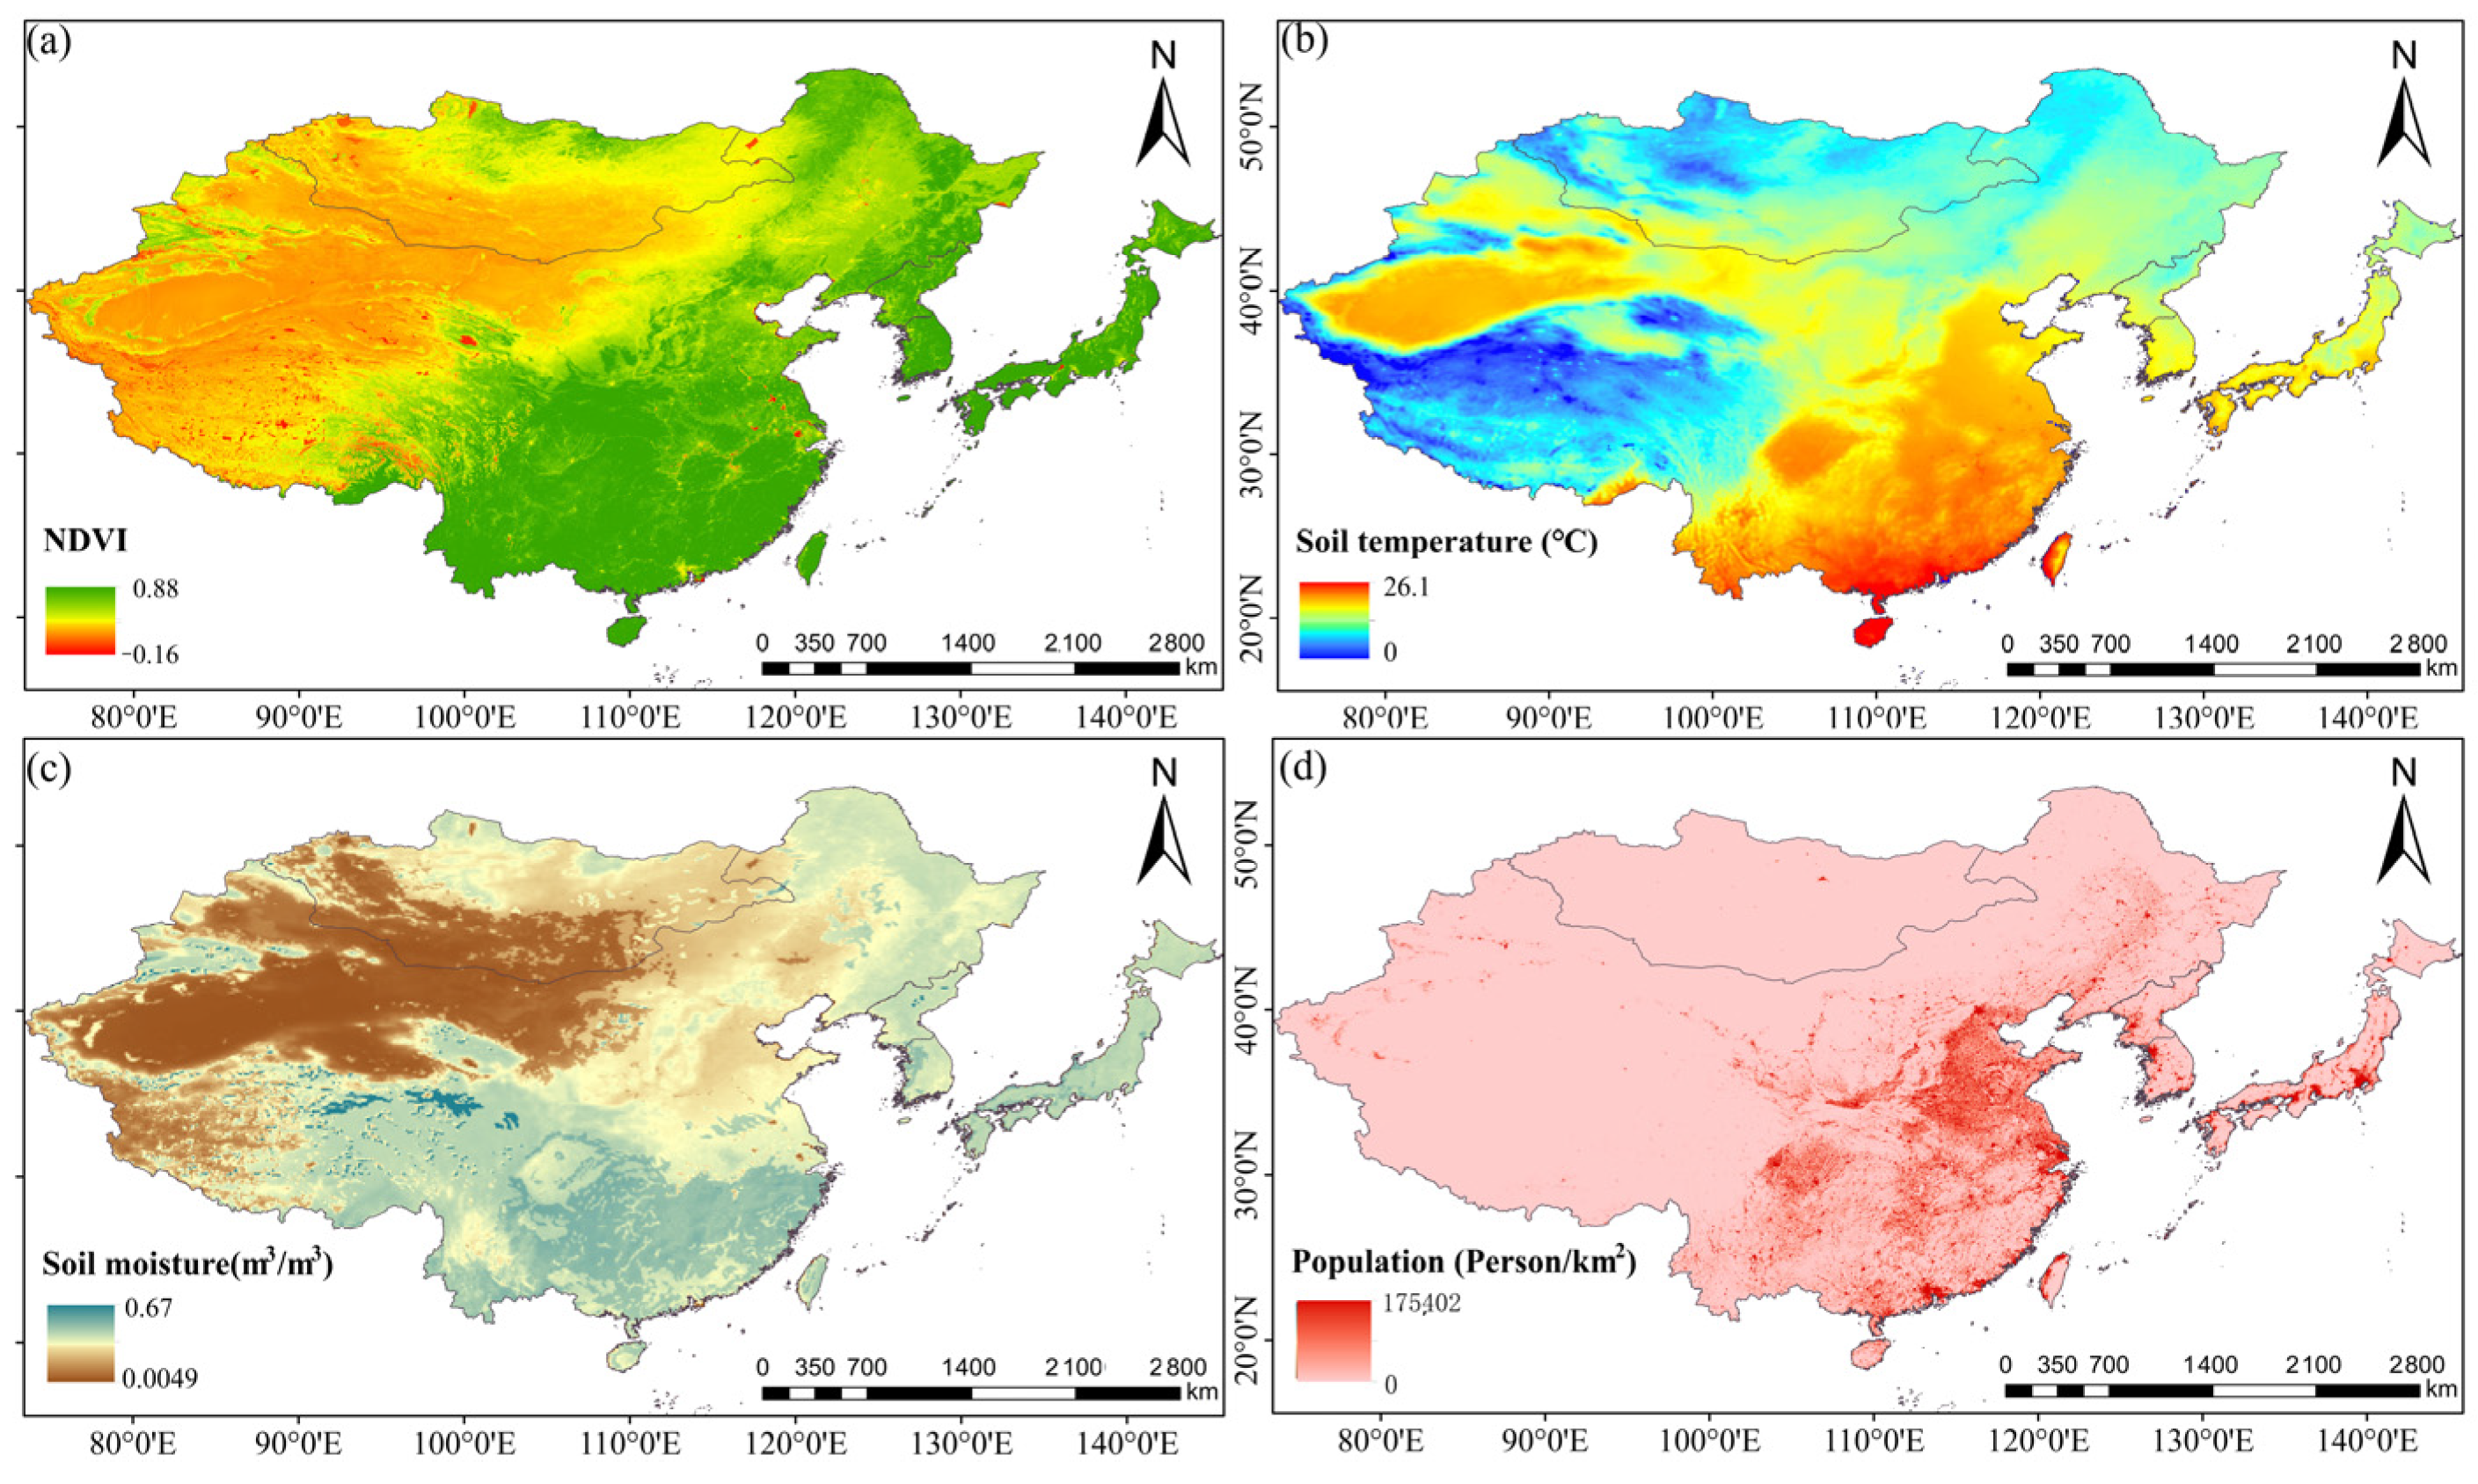
Figure 12 illustrates the multi-year average distribution of selected ground condition variables in East Asia from 2000 to 2022, with the population density distribution representing the human activity factor. NDVI serves as an effective indicator for assessing the state and changes in vegetation cover within a region. In the case of East Asia, the NDVI revealed a distinct pattern with generally low values in the northwest and high values in the southeast. The southeastern region exhibited significantly higher vegetation cover compared to the northwest. Notably, both the TDR and GDR are situated in areas characterized by low vegetation cover. This condition favors the transmission of ground dust and near-surface dust in these regions. The distribution of soil temperature exhibited similar patterns to that of air temperature, with high values predominantly found in the desert zone and the warm and humid southeastern region. Conversely, the soil moisture levels in the arid northwest region and the Qinghai–Tibet Plateau region remained very low.

3.3.2. Ground Conditions

From 2000 to 2022, the NDVI in East Asia, as well as in the TDR and GDR, demonstrated a consistent increasing trend, aligning with the findings of other researchers [58]. The NDVI in East Asia as a whole surpassed that of both desert regions, with a score approximately 0.16 higher than that of the TDR and approximately 0.1 higher than that of the GDR. The trend for NDVI in East Asia closely resembled that of the GDR, namely fluctuating upward patterns. Notably, the NDVI significantly decreased in 2005 and 2009–2011, which was followed by substantial increases after 2015. The NDVI in the TDR exhibited distinct wave-like patterns in 2005, 2010, and 2017. In general, there was an upward trend in vegetation cover enhancement across East Asia from 2000 to 2022, with an average increase of approximately 0.016 per decade. The minimum NDVI value of 0.26 was recorded in 2002, while the maximum value of 0.31 was observed in 2021. East Asia as a whole and the two desert regions exhibited a general trend characterized by significant temperature fluctuations and slight increases in average annual temperatures.
The soil temperature in the desert regions was notably higher compared to that of East Asia as a whole. The average annual soil temperature in East Asia as a whole remained relatively stable at around 6.5 °C, while the GDR experienced an average of approximately 7.2 °C, and the TDR exhibited the highest average soil temperature of around 13 °C. The results of the linear regression analysis indicated that there was no change in average soil moisture in East Asia as a whole, as well as in the two desert regions from 2000 to 2022. Additionally, the annual average soil moisture showed minimal variation. Although there was a fluctuating decreasing trend observed over the years, instances of higher soil moisture values occurred in 2003, 2016, and other years.

3.3.3. Human Activities

Population density serves as a useful indicator for assessing human activities. China, being the largest country in East Asia, exerts a dominant influence on the region’s population distribution. The Hu Huanyong line demarcates the fundamental pattern of population density in China, with a higher density in the eastern regions and sparser populations in the west (Figure 12d). Figure 13d illustrates that the overall population density in East Asia demonstrated a decreasing trend. This trend may contribute to a reduction in land degradation resulting from human activities, subsequently leading to a decrease in desertification and dust aerosol levels [59,60]. Notably, the population densities in the TDR and GDR displayed an increasing trend. By considering changes in population density, a potential association between population density and variations in dust aerosols can be observed. However, it is important to note that alterations in dust aerosol levels are influenced by multiple factors, extending beyond changes in population density alone.

3.4. DAOD Driver Analysis

3.4.1. Single-Factor Effect Analysis

The results from Table 3 reveal varying outcomes among different correlation analysis methods. The DAOD exhibited a strong negative correlation (correlation coefficient > 0.5) with relative humidity and soil moisture. Conversely, the correlation coefficients between DAOD and wind speed, temperature, NDVI, and soil temperature were relatively weak (ranging from 0.3 to 0.4). Additionally, the correlation between population density and DAOD was the lowest, with a coefficient of 0.16 (negative correlation). Compared to the Pearson correlation coefficients, the grey correlation analysis yielded higher correlations. The q-values, accounting for spatial heterogeneity, were significantly lower, indicating corrected correlation levels. In descending order, the q-values for the factors were relative humidity (0.40) > soil moisture (0.31) > temperature (0.28) > soil temperature (0.21) > NDVI (0.18) > precipitation (0.14) > wind speed (0.065) > population density (0.008). Relative humidity, soil moisture, and temperature were the primary driving factors for the DAOD in East Asia. The other factors had smaller impacts, with wind speed and population density having minimal effects (q-values < 0.1).
The dominant driving factors for the TDR and GDR differ greatly. In the TDR, the DAOD showed high correlations with various factors, with values above 0.5 for all factors except NDVI, soil moisture, and population density. Temperature, precipitation, and soil temperature had Pearson’s r values above 0.7, indicating significant linear relationships. Wind speed also showed a relatively high correlation. The limited impact of wind speed changes on dust aerosol concentration variations may stem from the time delay associated with aerosol dispersion after wind fluctuations [61]. However, the grey relational analysis yielded lower correlations, particularly for wind speed, temperature, and soil temperature, which exhibited pronounced temporal correlations. Relative humidity had the highest q-value of 0.88 in the TDR, indicating its dominant influence on the DAOD. The order of explanatory power for the remaining variables was as follows: precipitation (0.72) > temperature (0.70) > wind speed (0.60) > soil moisture (0.48) > soil temperature (0.39) > population density (0.30) > NDVI (0.26). Relative humidity, precipitation, temperature, and wind speed were the main driving factors influencing the DAOD in the TDR. In the GDR, the ranking of the q-values of the environmental factors are as follows: soil temperature (0.75) > temperature (0.72) > relative humidity (0.43) > NDVI (0.28) > soil moisture (0.25) > precipitation (0.16) > population density (0.15) > wind speed (0.14). This indicates that soil temperature, temperature, and relative humidity significantly contribute to DAOD variations in the GDR. In conclusion, relative humidity is a common driving factor for the DAOD in East Asia and the two major dust sources. Relative humidity’s impact on dust aerosols is intricate. While wind speed is typically viewed as the primary driver for DAOD, studies show that humidity also plays a significant role [62,63].

3.4.2. Two-Factor Interaction Analysis

The results of the interaction of each variable in East Asia, the TDR, and the GDR are shown in Figure 14.
The interaction analysis examined the influence of two environmental factors on the DAOD and found that the interaction between any two variables had a greater impact on the DAOD than the individual effects of a single variable. Among the various interacting variables in East Asia, temperature and precipitation, temperature and relative humidity, temperature and NDVI, temperature and soil moisture, soil temperature and precipitation, soil temperature and relative humidity, soil temperature and NDVI, and soil temperature and soil moisture showed significant synergistic effects. The interaction between soil temperature and relative humidity had the highest impact with a q-value of 0.896, indicating that the combined effect of soil temperature and relative humidity had the greatest influence on the spatial and temporal distribution of DAOD in East Asia as a whole.
For the TDR and GDR, most variables exhibited strong interactions with each other, particularly in the TDR. In the TDR, except for NDVI, soil temperature, soil moisture, and population density, which had relatively smaller interaction q-values, the interactions between the other variables consistently produced q-values above 0.7. While wind speed and population density exhibited nonlinear enhancements, the remaining variable pairs demonstrated bilinear synergistic effects. The strongest synergy was observed between relative humidity and population density (0.987). In the GDR, NDVI interacted with precipitation and relative humidity, with q-values above 0.7. Temperature and soil temperature showed bilinear synergistic effects with other variables, while NDVI, precipitation, and relative humidity displayed nonlinear enhancements. The interaction between soil temperature and precipitation had the highest q-value of 0.908.
In general, the DAOD in East Asia and the two major dust sources was influenced by interactive effects of different driving factors. The overall spatial distribution of the DAOD in East Asia exhibited a predominant pattern of nonlinear enhancement in interactions, while the DAOD spatial distributions in the TDR and GDR were characterized by bilinear synergistic interactions.

4. Conclusions

This study compared and validated the DAOD at 550 nm from the MERRA-2 dataset. The results indicate a strong correlation between the MERRA-2 DAOD dataset and monthly average AERONET AOD data. The R2 for the four selected stations in East Asia ranged from 0.62 to 0.81, with an RMSE ranging from 0.013 to 0.07. Therefore, the average monthly DAOD data from MERRA-2 demonstrates reliable accuracy and can be used for analyzing the spatial and temporal distribution of dust aerosols in East Asia.
The spatial distribution of the DAOD in East Asia exhibited significant seasonal variations, with the mean values in the four seasons following the order of spring (0.114) > summer (0.076) > autumn (0.055) > winter (0.040). The highest DAOD values were observed in spring. However, the peak months for dust aerosols differed between the two major dust sources in East Asia, the TDR and GDR. Specifically, for the TDR, the high values of dust aerosols in different years mostly occurred in May. As for the GDR, the high values of dust aerosols in different years all appeared in April.
There are different driving factors of DAOD in different regions. Relative humidity and soil moisture greatly impacted the spatial distribution of the DAOD in East Asia. For the TDR, factors such as relative humidity, precipitation, temperature, and wind speed played a key role, while for the GDR, soil temperature, temperature, and relative humidity were significant drivers. East Asia as a whole and the two dust sources were influenced by relative humidity. The results of the interaction analysis indicated that the interaction between any two variables had a greater impact on dust aerosols than the individual effect of a single variable. The geodetector analysis of the interaction q-value revealed that the overall interaction pattern of the DAOD spatial distribution in East Asia is primarily characterized by a nonlinear enhancement. The combined impact of soil temperature and relative humidity (0.896) emerged as the most influential factor on the spatiotemporal distribution of DAOD. In the TDR and GDR, the interaction pattern of the DAOD spatial distribution was predominantly characterized by a bilinear enhancement. The TDR’s DAOD was influenced by the interaction between relative humidity and population density (0.987), while in the GDR, the interaction between soil temperature and precipitation was a significant driver (0.908). This study analyzed the spatiotemporal variations, trends, and influencing factors of DAOD in East Asia and its two major dust sources from 2000 to 2022. The findings of this research contribute to a better understanding of the factors influencing DAOD, which can provide a theoretical basis for atmospheric pollution control in East Asia.

Author Contributions

Conceptualization: Y.W. and J.T.; Methodology: Y.W. and J.T.; Formal analysis: Y.W.; investigation: Y.W. and J.T.; Resources, W.W. and Z.W.; Data processing: J.W., S.L. and B.C.; Writing—original draft, Y.W.; Writing—review and editing, J.T., W.W., Z.W., J.W., S.L. and B.C.; Supervision, J.T.; Project administration, J.T.; Funding acquisition, J.T. All authors have read and agreed to the published version of the manuscript.

Funding

This work was jointly supported by the National Key Research and Development Program of China (No. 2020YFC1807102), and the Science and Technology Fundamental Resources Investigation Program (Grant No. 2022FY100102), both funded by the Ministry of Science and Technology of the People’s Republic of China. Additionally, support was provided by the Strategic Priority Research Program of the Chinese Academy of Sciences (XDA20050103).

Data Availability Statement

All data used in this study are publicly available.

Acknowledgments

We would like to thank the following agencies for providing data: MERRA-2 DAOD is provided by NASA’s Global Modeling and Assimilation Office (GMAO). The aerosol products are provided by AERONET networks. ECMWF for furnishing the ERA5 dataset, NASA for the provision of MODIS Vegetation Index Products, and WorldPop for providing population density data.

Conflicts of Interest

The authors declare no conflicts of interest.

References

  1. Zhou, Y.; Gao, X.; Meng, X.; Lei, J.; Halik, U. Characteristics of the Spatio-Temporal Dynamics of Aerosols in Central Asia and Their Influencing Factors. Remote Sens. 2022, 14, 2684. [Google Scholar] [CrossRef]
  2. Gandham, H.; Dasari, H.P.; Langodan, S.; Karumuri, R.K.; Hoteit, I. Major Changes in Extreme Dust Events Dynamics Over the Arabian Peninsula during 2003–2017 Driven by Atmospheric Conditions. J. Geophys. Res.-Atmos. 2020, 125, e2020JD032931. [Google Scholar] [CrossRef]
  3. Ku, B.; Park, R.J. Comparative inverse analysis of satellite (MODIS) and ground (PM10) observations to estimate dust emissions in East Asia. Asia-Pac. J. Atmos. Sci. 2013, 49, 3–17. [Google Scholar] [CrossRef]
  4. Li, J.; Han, Y.; Liu, W.; Cao, L.; Lu, Z. Contributions of gust under stationery weather conditions to the dust aerosol budget in northwestern China. Atmos. Res. 2023, 293, 106914. [Google Scholar] [CrossRef]
  5. Lin, C.-Y.; Chou, C.C.K.; Wang, Z.; Lung, S.-C.; Lee, C.-T.; Yuan, C.-S.; Chen, W.-N.; Chang, S.-Y.; Hsu, S.-C.; Chen, W.-C.; et al. Impact of different transport mechanisms of Asian dust and anthropogenic pollutants to Taiwan. Atmos. Environ. 2012, 60, 403–418. [Google Scholar] [CrossRef]
  6. Chappell, A.; Webb, N.P.; Hennen, M.; Schepanski, K.; Ciais, P.; Balkanski, Y.; Zender, C.S.; Tegen, I.; Zeng, Z.; Tong, D.; et al. Satellites reveal Earth’s seasonally shifting dust emission sources. Sci. Total Environ. 2023, 883, 163452. [Google Scholar] [CrossRef]
  7. Chen, W.; Meng, H.; Song, H.; Zheng, H. Progress in Dust Modelling, Global Dust Budgets, and Soil Organic Carbon Dynamics. Land 2022, 11, 176. [Google Scholar] [CrossRef]
  8. Nakashima, M.; Dagsson-Waldhauserova, P. A 60 Year Examination of Dust Day Activity and Its Contributing Factors From Ten Icelandic Weather Stations From 1950 to 2009. Front. Earth Sci. 2019, 6, 245. [Google Scholar] [CrossRef]
  9. Pinker, R.T.; Pandithurai, G.; Holben, B.N.; Dubovik, O.; Aro, T.O. A dust outbreak episode in sub-Sahel West Africa. J. Geophys. Res.-Atmos. 2001, 106, 22923–22930. [Google Scholar] [CrossRef]
  10. Song, H.; Zhang, K.; Piao, S.; Wan, S. Spatial and temporal variations of spring dust emissions in northern China over the last 30 years. Atmos. Environ. 2016, 126, 117–127. [Google Scholar] [CrossRef]
  11. VanCuren, R.A. Asian aerosols in North America: Extracting the chemical composition and mass concentration of the Asian continental aerosol plume from long-term aerosol records in the western United States. J. Geophys. Res.-Atmos. 2003, 108, 4623. [Google Scholar] [CrossRef]
  12. Wang, J.; Xia, X.G.; Wang, P.C.; Christopher, S.A. Diurnal variability of dust aerosol optical thickness and Angstrom exponent over dust source regions in China. Geophys. Res. Lett. 2004, 31, L08107.1–L08107.4. [Google Scholar] [CrossRef]
  13. Kaufman, Y.J.; Tanre, D.; Dubovik, O.; Karnieli, A.; Remer, L.A. Absorption of sunlight by dust as inferred from satellite and ground-based remote sensing. Geophys. Res. Lett. 2001, 28, 1479–1482. [Google Scholar] [CrossRef]
  14. Li, J.; Wong, M.S.; Lee, K.H.; Nichol, J.; Chan, P.W. Review of dust storm detection algorithms for multispectral satellite sensors. Atmos. Res. 2021, 250, 105398. [Google Scholar] [CrossRef]
  15. Xiong, J.; Zhao, T.; Han, Y.; Gong, S.L. A simulation of dust aerosols source and sink distributions and vertical profiles in East Asia over 1995~2004. China Environ. Sci. 2013, 33, 961–968. [Google Scholar]
  16. Zhang, X.Y.; Gong, S.L.; Zhao, T.L.; Arimoto, R.; Wang, Y.Q.; Zhou, Z.J. Sources of Asian dust and role of climate change versus desertification in Asian dust emission. Geophys. Res. Lett. 2003, 30, 2272. [Google Scholar] [CrossRef]
  17. Yumimoto, K.; Takemura, T. Long-term inverse modeling of Asian dust: Interannual variations of its emission, transport, deposition, and radiative forcing. J. Geophys. Res.-Atmos. 2015, 120, 1582–1607. [Google Scholar] [CrossRef]
  18. Filonchyk, M. Characteristics of the severe March 2021 Gobi Desert dust storm and its impact on air pollution in China. Chemosphere 2022, 287, 132219. [Google Scholar] [CrossRef]
  19. Stone, E.A.; Yoon, S.C.; Schauer, J.J. Chemical Characterization of Fine and Coarse Particles in Gosan, Korea during Springtime Dust Events. Aerosol Air Qual. Res. 2011, 11, 31–43. [Google Scholar] [CrossRef]
  20. Mori, I.; Nishikawa, M.; Quan, H.; Morita, M. Estimation of the concentration and chemical composition of kosa aerosols at their origin. Atmos. Environ. 2002, 36, 4569–4575. [Google Scholar] [CrossRef]
  21. Husar, R.B.; Tratt, D.M.; Schichtel, B.A.; Falke, S.R.; Li, F.; Jaffe, D.; Gasso, S.; Gill, T.; Laulainen, N.S.; Lu, F.; et al. Asian dust events of April 1998. J. Geophys. Res.-Atmos. 2001, 106, 18317–18330. [Google Scholar] [CrossRef]
  22. Meinander, O.; Dagsson-Waldhauserova, P.; Amosov, P.; Aseyeva, E.; Atkins, C.; Baklanov, A.; Baldo, C.; Barr, S.L.; Barzycka, B.; Benning, L.G.; et al. Newly identified climatically and environmentally significant high-latitude dust sources. Atmos. Chem. Phys. 2022, 22, 11889–11930. [Google Scholar] [CrossRef]
  23. Bory, A.J.M.; Biscaye, P.E.; Svensson, A.; Grousset, F.E. Seasonal variability in the origin of recent atmospheric mineral dust at NorthGRIP, Greenland. Earth Planet. Sci. Lett. 2002, 196, 123–134. [Google Scholar] [CrossRef]
  24. Kang, L.; Chen, S.; Huang, J.; Zhao, S.; Ma, X.; Yuan, T.; Zhang, X.; Xie, T. The Spatial and Temporal Distributions of Absorbing Aerosols over East Asia. Remote Sens. 2017, 9, 50. [Google Scholar] [CrossRef]
  25. Proestakis, E.; Amiridis, V.; Marinou, E.; Georgoulias, A.K.; Solomos, S.; Kazadzis, S.; Chimot, J.; Che, H.Z.; Alexandri, G.; Binietoglou, I.; et al. Nine-year spatial and temporal evolution of desert dust aerosols over South and East Asia as revealed by CALIOP. Atmos. Chem. Phys. 2018, 18, 1337–1362. [Google Scholar] [CrossRef]
  26. Gui, L.; Tao, M.H.; Wang, Y.; Wang, L.C.; Chen, L.F.; Lin, C.Q.; Tao, J.H.; Wang, J.; Yu, C. Climatology of aerosol types and their vertical distribution over East Asia based on CALIPSO lidar measurements. Int. J. Climatol. 2022, 42, 6042–6054. [Google Scholar] [CrossRef]
  27. Li, J.; He, Q.; Ge, X.; Abbas, A. Spatiotemporal distribution of aerosols over the Tibet Plateau and Tarim Basin (1980–2020). J. Clean. Prod. 2022, 374, 133958. [Google Scholar] [CrossRef]
  28. Che, H.; Gui, K.; Xia, X.; Wang, Y.; Holben, B.N.; Goloub, P.; Cuevas-Agullo, E.; Wang, H.; Zheng, Y.; Zhao, H.; et al. Large contribution of meteorological factors to inter-decadal changes in regional aerosol optical depth. Atmos. Chem. Phys. 2019, 19, 10497–10523. [Google Scholar] [CrossRef]
  29. Khan, M.; Tariq, S.; Ul Haq, Z. Variations in the aerosol index and its relationship with meteorological parameters over Pakistan using remote sensing. Environ. Sci. Pollut. Res. 2023, 30, 47913–47934. [Google Scholar] [CrossRef]
  30. Li, J.; He, Q.; Ge, X.; Abbas, A.; Jin, L. Spatio-temporal changes of AOD in Xinjiang of China from 2000 to 2019: Which factor is more influential, natural factor or human factor? PLoS ONE 2021, 16, e0253942. [Google Scholar] [CrossRef]
  31. Liu, J.; Ding, J.; Li, X.; Zhang, J.; Liu, B. Identification of dust aerosols, their sources, and the effect of soil moisture in Central Asia. Sci. Total Environ. 2023, 868, 161575. [Google Scholar] [CrossRef] [PubMed]
  32. Ma, W.; Ding, J.; Jin, X. Spatial heterogeneity and driving factors of aerosol in Western China: Analysis on multiangle implementation of atmospheric correction-aerosol optical depth in Xinjiang over 2001–2019. Int. J. Climatol. 2023, 43, 1993–2011. [Google Scholar] [CrossRef]
  33. Zheng, Y.; Wang, X.; Zhang, X.; Hu, G. Multi-spatiotemporal patterns of aerosol optical depth and influencing factors during 2000–2020 from two spatial perspectives: The entire Yellow River Basin region and its urban agglomerations. Int. J. Appl. Earth Obs. Geoinf. 2022, 106, 102643. [Google Scholar] [CrossRef]
  34. Jin, C.; Xue, Y.; Jiang, X.; Wu, S.; Sun, Y. Retrieval and validation of long-term aerosol optical depth from AVHRR data over China. Int. J. Digit. Earth 2022, 15, 1817–1832. [Google Scholar] [CrossRef]
  35. Seidel, F.C.; Kokhanovsky, A.A.; Schaepman, M.E. Fast retrieval of aerosol optical depth and its sensitivity to surface albedo using remote sensing data. Atmos. Res. 2012, 116, 22–32. [Google Scholar] [CrossRef]
  36. Wei, X.; Chang, N.-B.; Bai, K.; Gao, W. Satellite remote sensing of aerosol optical depth: Advances, challenges, and perspectives. Crit. Rev. Environ. Sci. Technol. 2020, 50, 1640–1725. [Google Scholar] [CrossRef]
  37. Xia, X.; Wang, P.; Wang, Y.; Li, Z.; Xin, J.; Liu, J.; Chen, H. Aerosol optical depth over the Tibetan Plateau and its relation to aerosols over the Taklimakan Desert. Geophys. Res. Lett. 2008, 35, L16804. [Google Scholar] [CrossRef]
  38. Xu, H.; Guang, J.; Xue, Y.; de Leeuw, G.; Che, Y.H.; Guo, J.; He, X.W.; Wang, T.K. A consistent aerosol optical depth (AOD) dataset over mainland China by integration of several AOD products. Atmos. Environ. 2015, 114, 48–56. [Google Scholar] [CrossRef]
  39. Zong, X.; Xia, X.; Che, H. Validation of aerosol optical depth and climatology of aerosol vertical distribution in the Taklimakan Desert. Atmos. Pollut. Res. 2015, 6, 239–244. [Google Scholar] [CrossRef]
  40. Aldabash, M.; Balcik, F.B.; Glantz, P. Validation of MODIS C6.1 and MERRA-2 AOD Using AERONET Observations: A Comparative Study over Turkey. Atmosphere 2020, 11, 905. [Google Scholar] [CrossRef]
  41. Yousefi, R.; Wang, F.; Ge, Q.S.; Shaheen, A. Long-term aerosol optical depth trend over Iran and identi fication of dominant aerosol types. Sci. Total Environ. 2020, 722, 137906. [Google Scholar] [CrossRef]
  42. Sabetghadam, S.; Alizadeh, O.; Khoshsima, M.; Pierleoni, A. Aerosol properties, trends and classification of key types over the Middle East from satellite-derived atmospheric optical data. Atmos. Environ. 2021, 246, 118100. [Google Scholar] [CrossRef]
  43. Berglee, R. World Regional Geography; University of Minnesota Libraries Publishing: Minneapolis, MN, USA, 2016. [Google Scholar]
  44. Holben, B.N.; Tanre, D.; Smirnov, A.; Eck, T.F.; Slutsker, I.; Abuhassan, N.; Newcomb, W.W.; Schafer, J.S.; Chatenet, B.; Lavenu, F.; et al. An emerging ground-based aerosol climatology: Aerosol optical depth from AERONET. J. Geophys. Res.-Atmos. 2001, 106, 12067–12097. [Google Scholar] [CrossRef]
  45. Muñoz Sabater, J. ERA5-Land Monthly Averaged Data from 1950 to Present. Copernicus Climate Change Service (C3S) Climate Data Store (CDS). 2006. Available online: https://cds.climate.copernicus.eu/cdsapp#!/dataset/10.24381/cds.68d2bb30?tab=overview (accessed on 20 October 2023).
  46. Baghbanan, P.; Ghavidel, Y.; Farajzadeh, M. Spatial analysis of spring dust storms hazard in Iran. Theor. Appl. Climatol. 2020, 139, 1447–1457. [Google Scholar] [CrossRef]
  47. Baghbanan, P.; Ghavidel, Y.; Farajzadeh, M. Temporal long-term variations in the occurrence of dust storm days in Iran. Meteorol. Atmos. Phys. 2020, 132, 885–898. [Google Scholar] [CrossRef]
  48. Yagbasan, O.; Demir, V.; Yazicigil, H. Trend Analyses of Meteorological Variables and Lake Levels for Two Shallow Lakes in Central Turkey. Water 2020, 12, 414. [Google Scholar] [CrossRef]
  49. Zhao, Y.; He, C.; Zhang, Q. Monitoring vegetation dynamics by coupling linear trend analysis with change vector analysis: A case study in the Xilingol steppe in northern China. Int. J. Remote Sens. 2012, 33, 287–308. [Google Scholar] [CrossRef]
  50. Tsai, M.-S.; Hsu, F.-Y. Application of Grey Correlation Analysis in Evolutionary Programming for Distribution System Feeder Reconfiguration. IEEE Trans. Power Syst. 2010, 25, 1126–1133. [Google Scholar] [CrossRef]
  51. Xu, J.; Liu, Z.; Yin, L.; Liu, Y.; Tian, J.; Gu, Y.; Zheng, W.; Yang, B.; Liu, S. Grey Correlation Analysis of Haze Impact Factor PM2.5. Atmosphere 2021, 12, 1513. [Google Scholar] [CrossRef]
  52. Cai, H.; Li, C.; Luan, X.; Ai, B.; Yan, L.; Wen, Z. Analysis of the spatiotemporal evolution of the coastline of Jiaozhou Bay and its driving factors. Ocean Coast. Manag. 2022, 226, 106246. [Google Scholar] [CrossRef]
  53. Yuan, L.; Peijun, D.U.; Li, W.; Huapeng, Z. Weighted IHS Fusion of Multi-source Remotely-Sensed Image Based on Edge Detection Using Grey Absolute Correlation Degree. Geogr. Geo.-Inf. Sci. 2008, 24, 11–15. [Google Scholar]
  54. Wang, J.; Xu, C. Geodetector: Principle and prospective. Acta Geogr. Sin. 2017, 72, 116–134. [Google Scholar]
  55. Wu, D.; Liu, J.; Wang, T.; Niu, X.; Chen, Z.; Wang, D.; Zhang, X.; Ji, M.; Wang, X.; Pu, W. Applying a dust index over North China and evaluating the contribution of potential factors to its distribution. Atmos. Res. 2021, 254, 105515. [Google Scholar] [CrossRef]
  56. Zhang, Z.; Ding, J.; Wang, J. Spatio-temporal variations and potential diffusion characteristics of dust aerosol originating from Central Asia. Acta Geogr. Sin. 2017, 72, 507–520. [Google Scholar]
  57. Zhao, D.; Chen, S.Y.; Chen, Y.; Gong, Y.Q.; Lou, G.T.; Cheng, S.L.; Bi, H.R. Influence of Dust Aerosols on Snow Cover Over the Tibetan Plateau. Front. Environ. Sci. 2022, 10, 839691. [Google Scholar] [CrossRef]
  58. Chen, C.; Park, T.; Wang, X.; Piao, S.; Xu, B.; Chaturvedi, R.K.; Fuchs, R.; Brovkin, V.; Ciais, P.; Fensholt, R.; et al. China and India lead in greening of the world through land-use management. Nat. Sustain. 2019, 2, 122–129. [Google Scholar] [CrossRef]
  59. Jaquet, S.; Schwilch, G.; Hartung-Hofmann, F.; Adhikari, A.; Sudmeier-Rieux, K.; Shrestha, G.; Liniger, H.P.; Kohler, T. Does outmigration lead to land degradation? Labour shortage and land management in a western Nepal watershed. Appl. Geogr. 2015, 62, 157–170. [Google Scholar] [CrossRef]
  60. Roy, P.; Pal, S.C.; Chakrabortty, R.; Saha, A.; Chowdhuri, I. A systematic review on climate change and geo-environmental factors induced land degradation: Processes, policy-practice gap and its management strategies. Geol. J. 2023, 58, 3487–3514. [Google Scholar] [CrossRef]
  61. Mallia, D.V.; Kochanski, A.; Wu, D.; Pennell, C.; Oswald, W.; Lin, J.C. Wind-Blown Dust Modeling Using a Backward-Lagrangian Particle Dispersion Model. J. Appl. Meteorol. Climatol. 2017, 56, 2845–2867. [Google Scholar] [CrossRef]
  62. Csavina, J.; Field, J.; Félix, O.; Corral-Avitia, A.Y.; Sáez, A.E.; Betterton, E.A. Effect of wind speed and relative humidity on atmospheric dust concentrations in semi-arid climates. Sci. Total Environ. 2014, 487, 82–90. [Google Scholar] [CrossRef]
  63. Liu, X.M.; Song, H.Q.; Lei, T.J.; Liu, P.F.; Xu, C.D.; Wang, D.; Yang, Z.L.; Xia, H.M.; Wang, T.H.; Zhao, H.P. Effects of natural and anthropogenic factors and their interactions on dust events in Northern China. Catena 2021, 196, 104919. [Google Scholar] [CrossRef]
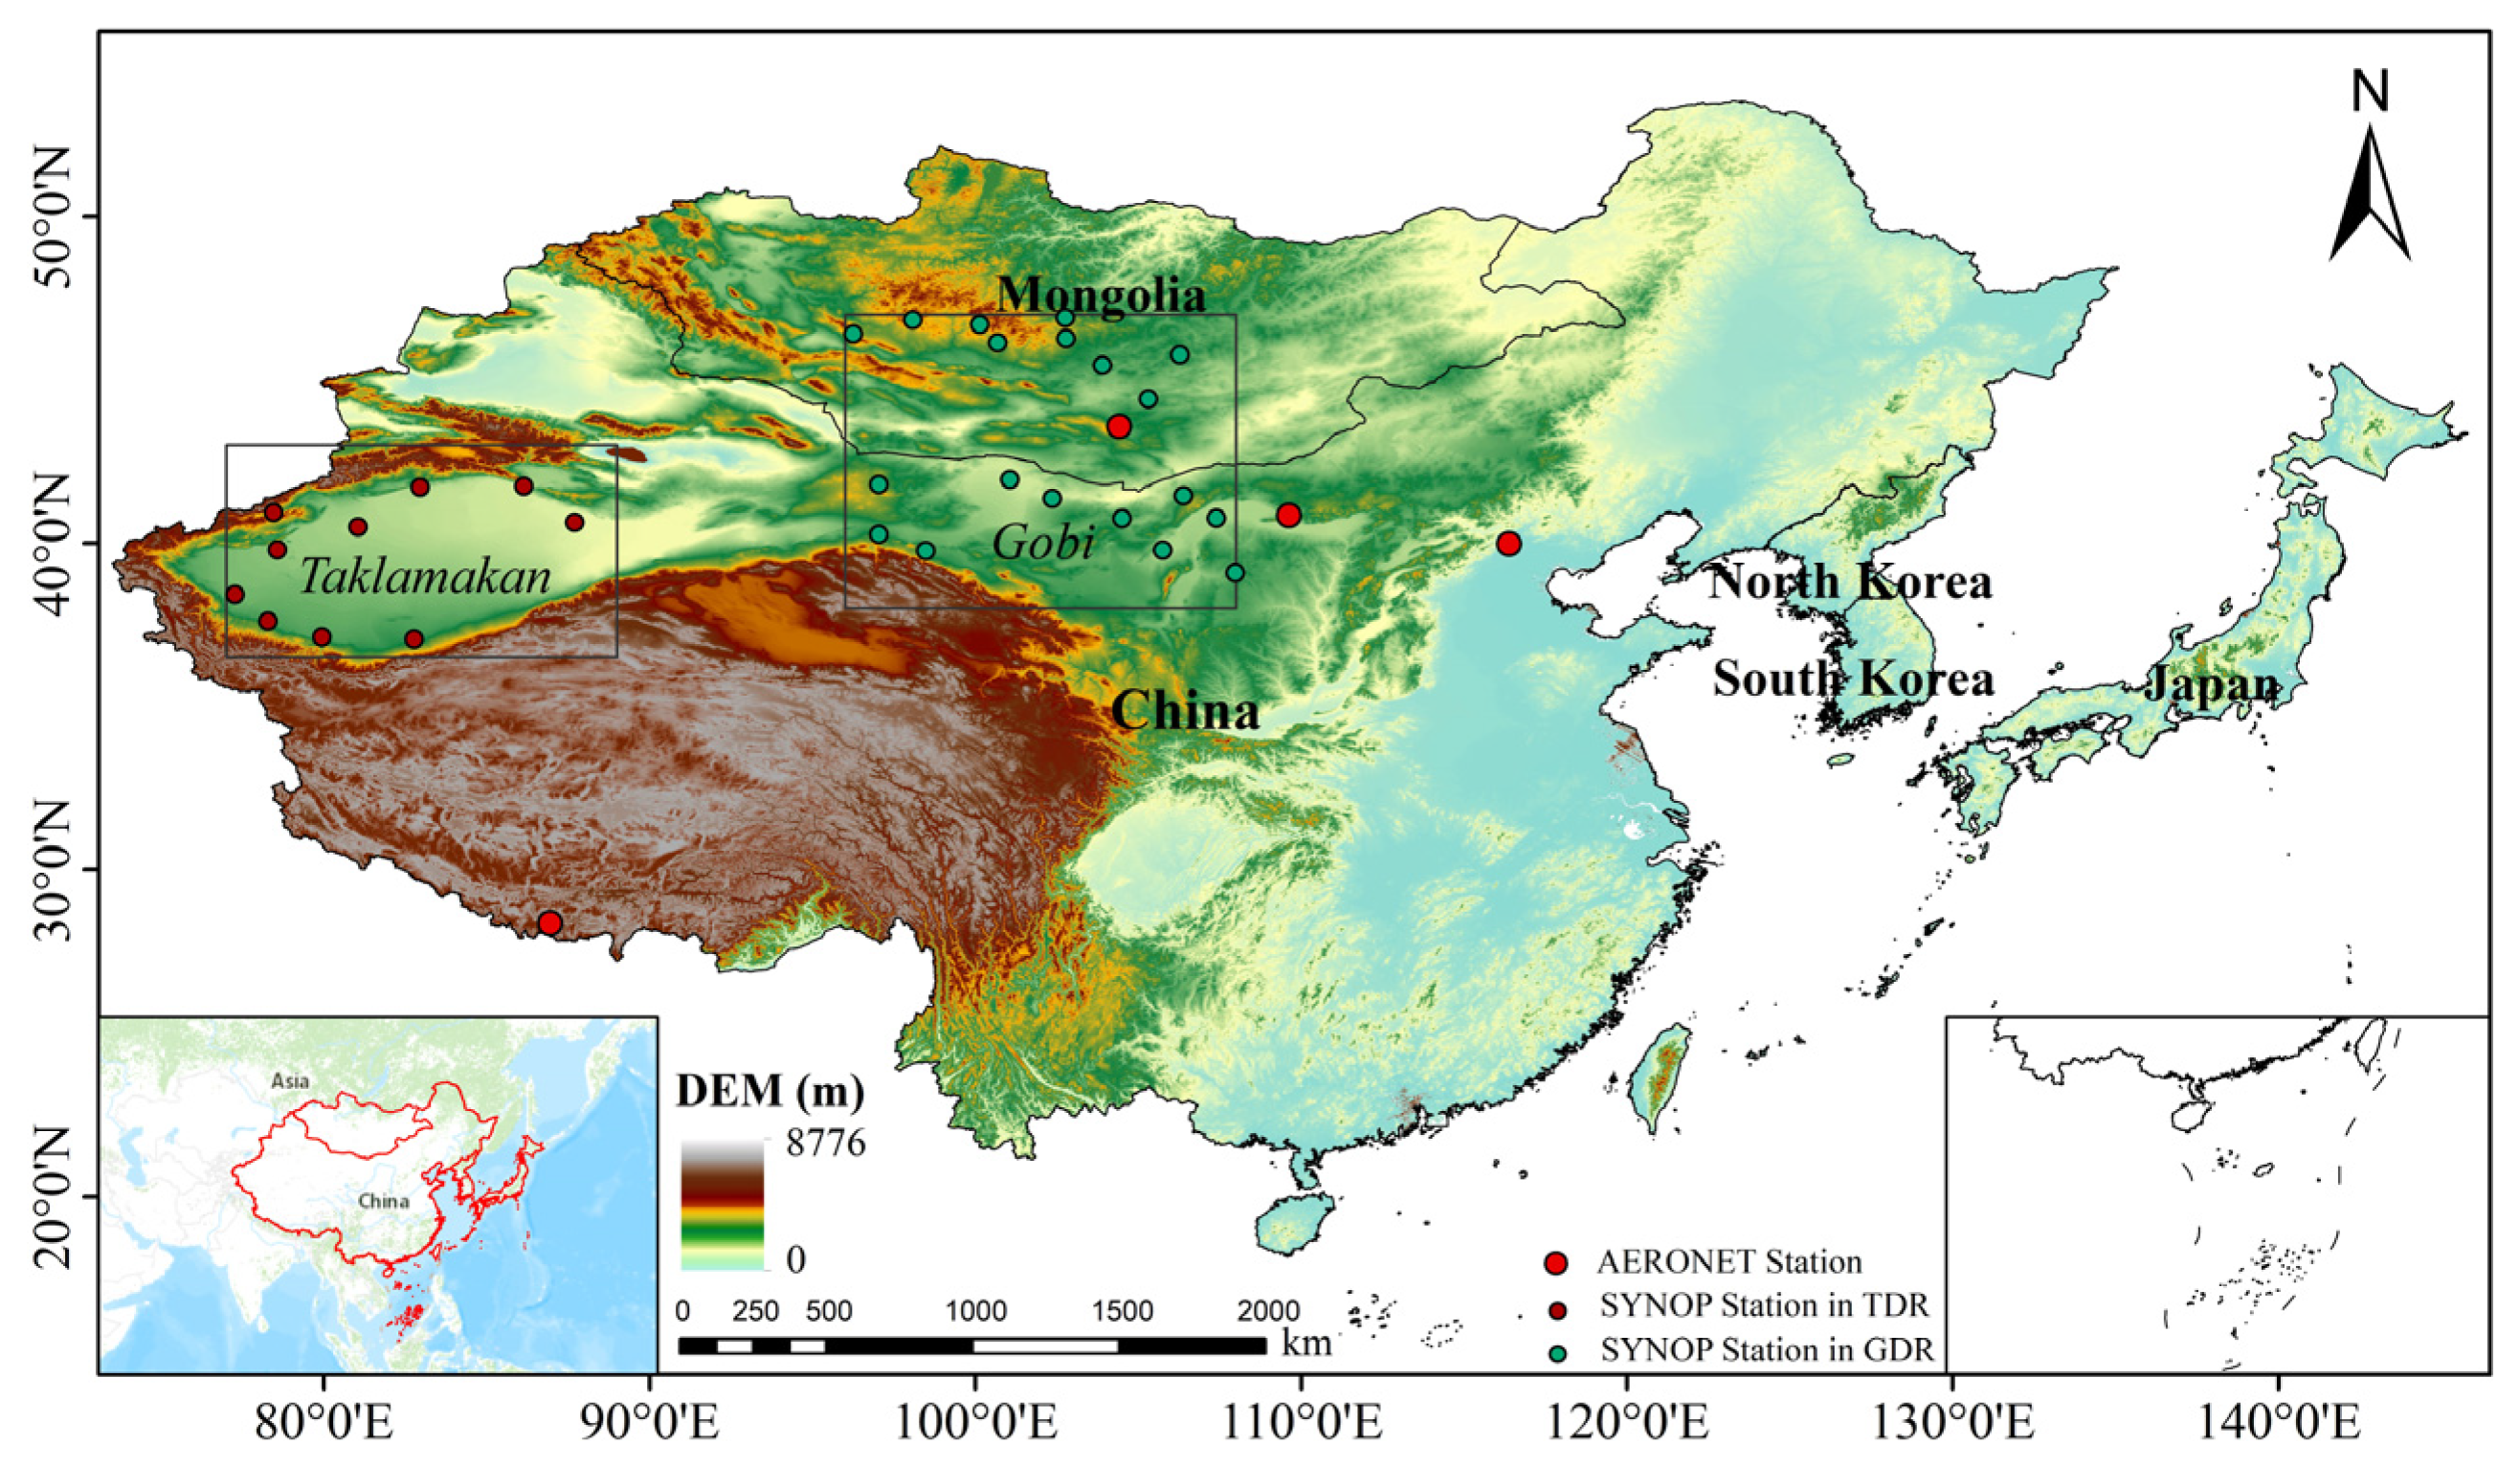
Figure 1. Location of the study area. (The red dots represent the locations of the AERONET sites utilized).
Remotesensing 16 00318 g001
Figure 2. Verification of MERRA-2 DAOD and AERONET AOD accuracy: (a) AOE_Baotou, (b) Beijing, (c) Dalanzadgad, (d) QOMS_CAS. (The red dashed lines represent the 1:1 reference, while the black solid lines correspond to the obtained fitted line).
Remotesensing 16 00318 g002
Figure 3. Annual mean distribution of dust extinction AOD in East Asia; (aw) represent the years 2000 to 2022, respectively.
Remotesensing 16 00318 g003
Figure 4. Spatial distribution of (a) multi–year average and (b) trends in East Asia from 2000 to 2022.
Remotesensing 16 00318 g004
Figure 5. Interannual trends of DAOD in East Asia, TDR, and GDR from 2000 to 2022. (The dotted lines are obtained by fitting).
Remotesensing 16 00318 g005
Figure 6. Monthly distribution of DAOD in East Asia, 2001–2022; (al) represent January to December, respectively.
Remotesensing 16 00318 g006
Figure 7. Monthly average variation in the dust AOD during 2000–2005, 2006–2010, 2011–2015, 2016–2022, and 2000–2022 in (a) TDR and (b) GDR.
Remotesensing 16 00318 g007
Figure 8. Average seasonal distribution of dust aerosol optical depth in East Asia, 2000–2022; (ad) represent spring to winter, respectively.
Remotesensing 16 00318 g008
Figure 9. Average seasonal distribution of dust aerosol optical depth in (a) TDR and (b) GDR, 2000–2022.
Remotesensing 16 00318 g009
Figure 10. Distribution of annual average of (a) 10 m surface wind speed, (b) temperature, (c) precipitation, and (d) relative humidity in East Asia from 2000 to 2022.
Remotesensing 16 00318 g010
Figure 11. Annual average of (a) 10 m surface wind speed, (b) temperature, (c) precipitation, and (d) relative humidity in East Asia from 2000 to 2022. (The dotted lines are obtained by fitting).
Remotesensing 16 00318 g011
Figure 12. Distribution of annual average of (a) NDVI, (b) soil temperature, (c) soil moisture, and (d) population in East Asia from 2000 to 2022.
Remotesensing 16 00318 g012
Figure 13. Annual average of (a) NDVI, (b) soil temperature, (c) soil moisture, and (d) population in East Asia from 2000 to 2022. (The dotted lines are obtained by fitting).
Remotesensing 16 00318 g013
Figure 14. Heat map of the interaction q-values: influence of two environmental factors combined. (* stands for nonlinear enhancement and ** for bilinear enhancement).
Remotesensing 16 00318 g014
Table 1. Factors influencing DAOD and their data sources.
Driving FactorVariableUnitSpatial ResolutionTemporal ResolutionData Source
Meteorological factors10 m wind speedm/s0.1°MonthlyEAR5
Temperature°C0.1°MonthlyEAR5
Precipitationmm0.1°MonthlyEAR5
Relative Humidity%0.1°MonthlyEAR5
Ground conditionsNDVI/1 km16 daysMODIS
Soil temperature°C0.1°MonthlyEAR5
Soil moisturem3/m30.1°MonthlyEAR5
Human activitiesPopulation densityPerson/km21 kmMonthlyWorldPop
Table 2. Interactions between explanatory variables.
CriterionInteraction Relation
q(X1∩X2) < Min(q(X1), q(X2))Nonlinear weakening
Min(q(X1), q(X1)) < q(X1∩X1) < Max(q(X1), q(X1))One-factor nonlinear weakening
q(X1∩X1) > Max(q(X1), q(X1))Two-factor enhancement
q(X1∩X1) = q(X1) + q(X1)Independent
q(X1∩X1) > q(X1) + q(X1)Nonlinear enhancement
Table 3. Results of Pearson correlation coefficient, grey correlation, and factor detection analyses in East Asia, TDR, and GDR.
ResultsVariable10 m Wind SpeedTemperaturePrecipitationRelative HumidityNDVISoil TemperatureSoil MoisturePopulation Density
Region
East AsiaPearson’s r0.33 0.40−0.48−0.61−0.400.38−0.58−0.16
GRA0.650.680.710.630.650.700.600.63
q-value0.0650.280.140.400.180.210.310.008
TDRPearson’s r0.670.80−0.89−0.78−0.450.81−0.47−0.36
GRA0.710.670.640.640.630.650.620.55
q-value0.600.700.720.880.260.390.480.30
GDRPearson’s r0.300.79−0.27−0.69−0.370.87−0.44−0.26
GRA0.670.750.700.650.710.770.680.70
q-value0.140.720.160.430.280.750.250.15
Disclaimer/Publisher’s Note: The statements, opinions and data contained in all publications are solely those of the individual author(s) and contributor(s) and not of MDPI and/or the editor(s). MDPI and/or the editor(s) disclaim responsibility for any injury to people or property resulting from any ideas, methods, instructions or products referred to in the content.