Article

Early Detection of Drought Stress in Durum Wheat Using Hyperspectral Imaging and Photosystem Sensing

1
Taylor Geospatial Institute, Saint Louis, MO 63108, USA
2
Department of Earth and Atmospheric Sciences, Saint Louis University, Saint Louis, MO 63104, USA
3
Department of Computer Science, Saint Louis University, Saint Louis, MO 63104, USA
4
United States Forest Service, Forest Health Protection, Missoula, MT 59804, USA
5
Department of Agricultural and Food Sciences, University of Bologna, 40127 Bologna, Italy
6
Arizona Experiment Station, University of Arizona, Tucson, AZ 85724, USA
7
Donald Danforth Plant Science Center, Saint Louis, MO 63132, USA
*
Author to whom correspondence should be addressed.
Remote Sens. 2024, 16(1), 155; https://doi.org/10.3390/rs16010155
Submission received: 27 November 2023 / Revised: 23 December 2023 / Accepted: 26 December 2023 / Published: 30 December 2023

Abstract

:
Wheat, being the third largest U.S. crop and the principal food grain, faces significant risks from climate extremes such as drought. This necessitates identifying and developing methods for early water-stress detection to prevent yield loss and improve water-use efficiency. This study investigates the potential of hyperspectral imaging to detect the early stages of drought stress in wheat. The goal is to utilize this technology as a tool for screening and selecting drought-tolerant wheat genotypes in breeding programs. Additionally, this research aims to systematically evaluate the effectiveness of various existing sensors and methods for detecting early stages of water stress. The experiment was conducted in a durum wheat experimental field trial in Maricopa, Arizona, in the spring of 2019 and included well-watered and water-limited treatments of a panel of 224 replicated durum wheat genotypes. Spectral indices derived from hyperspectral imagery were compared against other plant-level indicators of water stress such as Photosystem II (PSII) and relative water content (RWC) data derived from proximal sensors. Our findings showed a 12% drop in photosynthetic activity in the most affected genotypes when compared to the least affected. The Leaf Water Vegetation Index 1 (LWVI1) highlighted differences between drought-resistant and drought-susceptible genotypes. Drought-resistant genotypes retained 43.36% more water in leaves under well-watered conditions compared to water-limited conditions, while drought-susceptible genotypes retained only 15.69% more. The LWVI1 and LWVI2 indices, aligned with the RWC measurements, revealed a strong inverse correlation in the susceptible genotypes, underscoring their heightened sensitivity to water stress in earlier stages. Several genotypes previously classified based on their drought resistance showed spectral indices deviating from expectations. Results from this research can aid farmers in improving crop yields by informing early management practices. Moreover, this research offers wheat breeders insights into the selection of drought-tolerant genotypes, a requirement that is becoming increasingly important as weather patterns continue to change.

1. Introduction

Wheat plays a crucial role as one of the leading crops produced in the United States, sitting third only to corn and soybean [1] in both acreage and overall production [2]. Of particular importance is durum wheat, a tetraploid wheat that accounts for about 3–5 percent of total U.S. wheat production. Durum wheat grown in low-precipitation areas has higher yields compared to other wheats. It is predominantly used in pasta production, and under suitable irrigation conditions, such as those found in Arizona, durum wheat can generate a yield of 7 Mg/ha, a figure that is double the national average [3,4].
However, despite its significance and potential productivity, durum wheat production faces an imminent threat in the form of drought. Drought or water-deficit stress in plants is triggered when plants biochemically and physiologically respond to a deficiency of available water caused by either soil water deficit or the high evaporative demand of the atmosphere [5]. Water stress stands as one of the most detrimental abiotic stressors, affecting plant cells’ ability to maintain healthy water content levels [5], thereby hampering plant growth, reducing crop yield, and impacting food quality adversely [6,7]. In the Southwestern U.S., the severity and frequency of drought, coupled with the impact of increasing temperatures, imposes even greater constraints on durum wheat yields. The importance of crop drought tolerance extends beyond only producing high yields, especially for important staples like wheat [8]; it is also foundational for maintaining rural economies, ensuring food security, and fostering resilience in the face of unforeseen problems brought on by a changing climate. The demands on agricultural systems increase as the world’s population grows and urbanizes. Considering the escalating challenges posed by climate change, identifying genotypes that exhibit superior drought tolerance is paramount [9]. As the global climate becomes increasingly unpredictable, crops with inherent resilience to water stress will play a critical role in ensuring food security and sustaining agricultural economies. Given the looming reality of climate change, it is therefore imperative to focus on enhancing drought tolerance in crops [10]. To ensure food security and sustainability, the agricultural sector must innovate and develop strategies that can withstand the challenges of a changing climate.
The early detection of water stress facilitates mitigating the adverse impacts of drought, potentially saving crops from irreversible damage. The ability to identify water stress early, especially in important crops like durum wheat, has the potential to completely change how farmers manage their fields [11]. Farmers can actively manage their crops by maximizing irrigation and other interventions rather than responding to extreme drought conditions, which frequently cause irreparable damage. This proactive technique ensures that crops stay healthy and productive throughout their growth cycle in addition to conserving vital water resources [12]. Moreover, breeding programs can benefit from early detection methods like hyperspectral imaging. Breeders can hasten the creation of new wheat varieties that are better able to withstand water stress by identifying drought-tolerant genotypes at an early stage. These advancements, when combined with sustainable agricultural practices, can ensure that durum wheat continues to thrive, feeding millions and supporting economies even in the face of challenging environmental conditions.
Advanced techniques such as remote sensing can play an instrumental role in the early detection of water stress in plants, thereby facilitating timely intervention [13]. Remote sensing, particularly hyperspectral imagery, presents a viable and efficient way of monitoring plant responses to environmental stressors across large areas [13]. The high resolution of hyperspectral imaging, due to hundreds of contiguous narrow spectral bands, can provide detailed insights into the correlation between spectral features and plant conditions. Blackburn [14] and Im and Jensen [15] highlight its efficacy in measuring plant pigments and key vegetation metrics such as biomass and chlorophyll. Wong et al. [16] demonstrate its potential for phenotyping drought responses in beans. Mertens et al. [17] and Liu et al. [18] further advanced its applications through non-destructive phenotyping and spectral normalization, solidifying its crucial role in agriculture and environmental science. Various research works have demonstrated the capacity of spectral reflectance in the VNIR (visible and near-infrared) and SWIR (shortwave infrared) regions (350–2500 nm) to assess water status in plants [19,20,21,22,23]. Moreover, spectral indices developed through the NIR region (700–1300 nm) have shown a high correlation with the water status [24,25]. Previous studies have employed diverse analytical techniques, including multivariate analysis, decision trees, machine learning models, etc., to understand plants’ spectral response to varying stress levels [20,26,27].
While these studies indicate the vast potential of hyperspectral remote sensing in detecting and managing plant water stress, a gap exists specifically for wheat under mild drought-stress conditions. Although studies have been conducted on durum wheat using thermal and UAV-borne images [28,29,30,31], the potential of high-resolution hyperspectral imaging for the early detection of mild drought stress is yet to be comprehensively explored. While numerous active and passive sensors have been developed and employed for detecting drought or water stress, a comprehensive and systematic comparison remains lacking. A study by Becker and Schmidhalter [32] showed that the active sensors were more sensitive to drought-induced changes in plant water status and yield components compared to the passive hyperspectral sensor. However, this study focused on sensors that collect the reflectance and indices in the VNIR region, while multiple studies suggested shortwave infrared (SWIR) bands are efficient in detecting water content in vegetation [33,34,35]. Therefore, a review utilizing very-high-resolution hyperspectral images (VNIR and SWIR) along with a ground data collection sensor is imperative to shed light on the most effective sensors tailored specifically to the early detection of these environmental stressors, optimizing the decision-making process for practitioners and researchers alike.
It is essential to emphasize the lack of studies on wheat under mild drought stress in field conditions using gantry hyperspectral imaging techniques. While previous studies have utilized hyperspectral imaging for various crops and different stress levels, research focusing specifically on wheat under mild drought-stress conditions using gantry hyperspectral imaging techniques remains limited. Furthermore, most studies have focused on severe water-stress conditions. In contrast, understanding the spectral response and physiological changes under mild drought-stress conditions could allow for earlier interventions, potentially improving crop yields. For instance, hyperspectral data have been used to distinguish between well-watered and limited-water vines [20], yet similar studies focusing on the discrimination of well-watered and mildly water-stressed wheat are conspicuously absent.
Therefore, there is a pressing need for further research in this field to fill these gaps. This includes a systematic review of all available sensors, identifying which genotypes are more drought tolerant, and determining the best method for detecting early water-stress tolerance. The goal is to enhance durum wheat resilience against drought, particularly mild drought stress, using advanced hyperspectral imaging techniques. This will not only improve crop yields but also contribute significantly to food security under climate change. The primary objectives of this article are to: (1) Explore early signs that indicate late-season water-stress tolerance; (2) Identify differences in spectral signatures between well-watered and water-limited treatments of the same genotype; (3) Compare datasets from different sensors with ground truth data; and (4) Identify the best method for assessing drought tolerance.

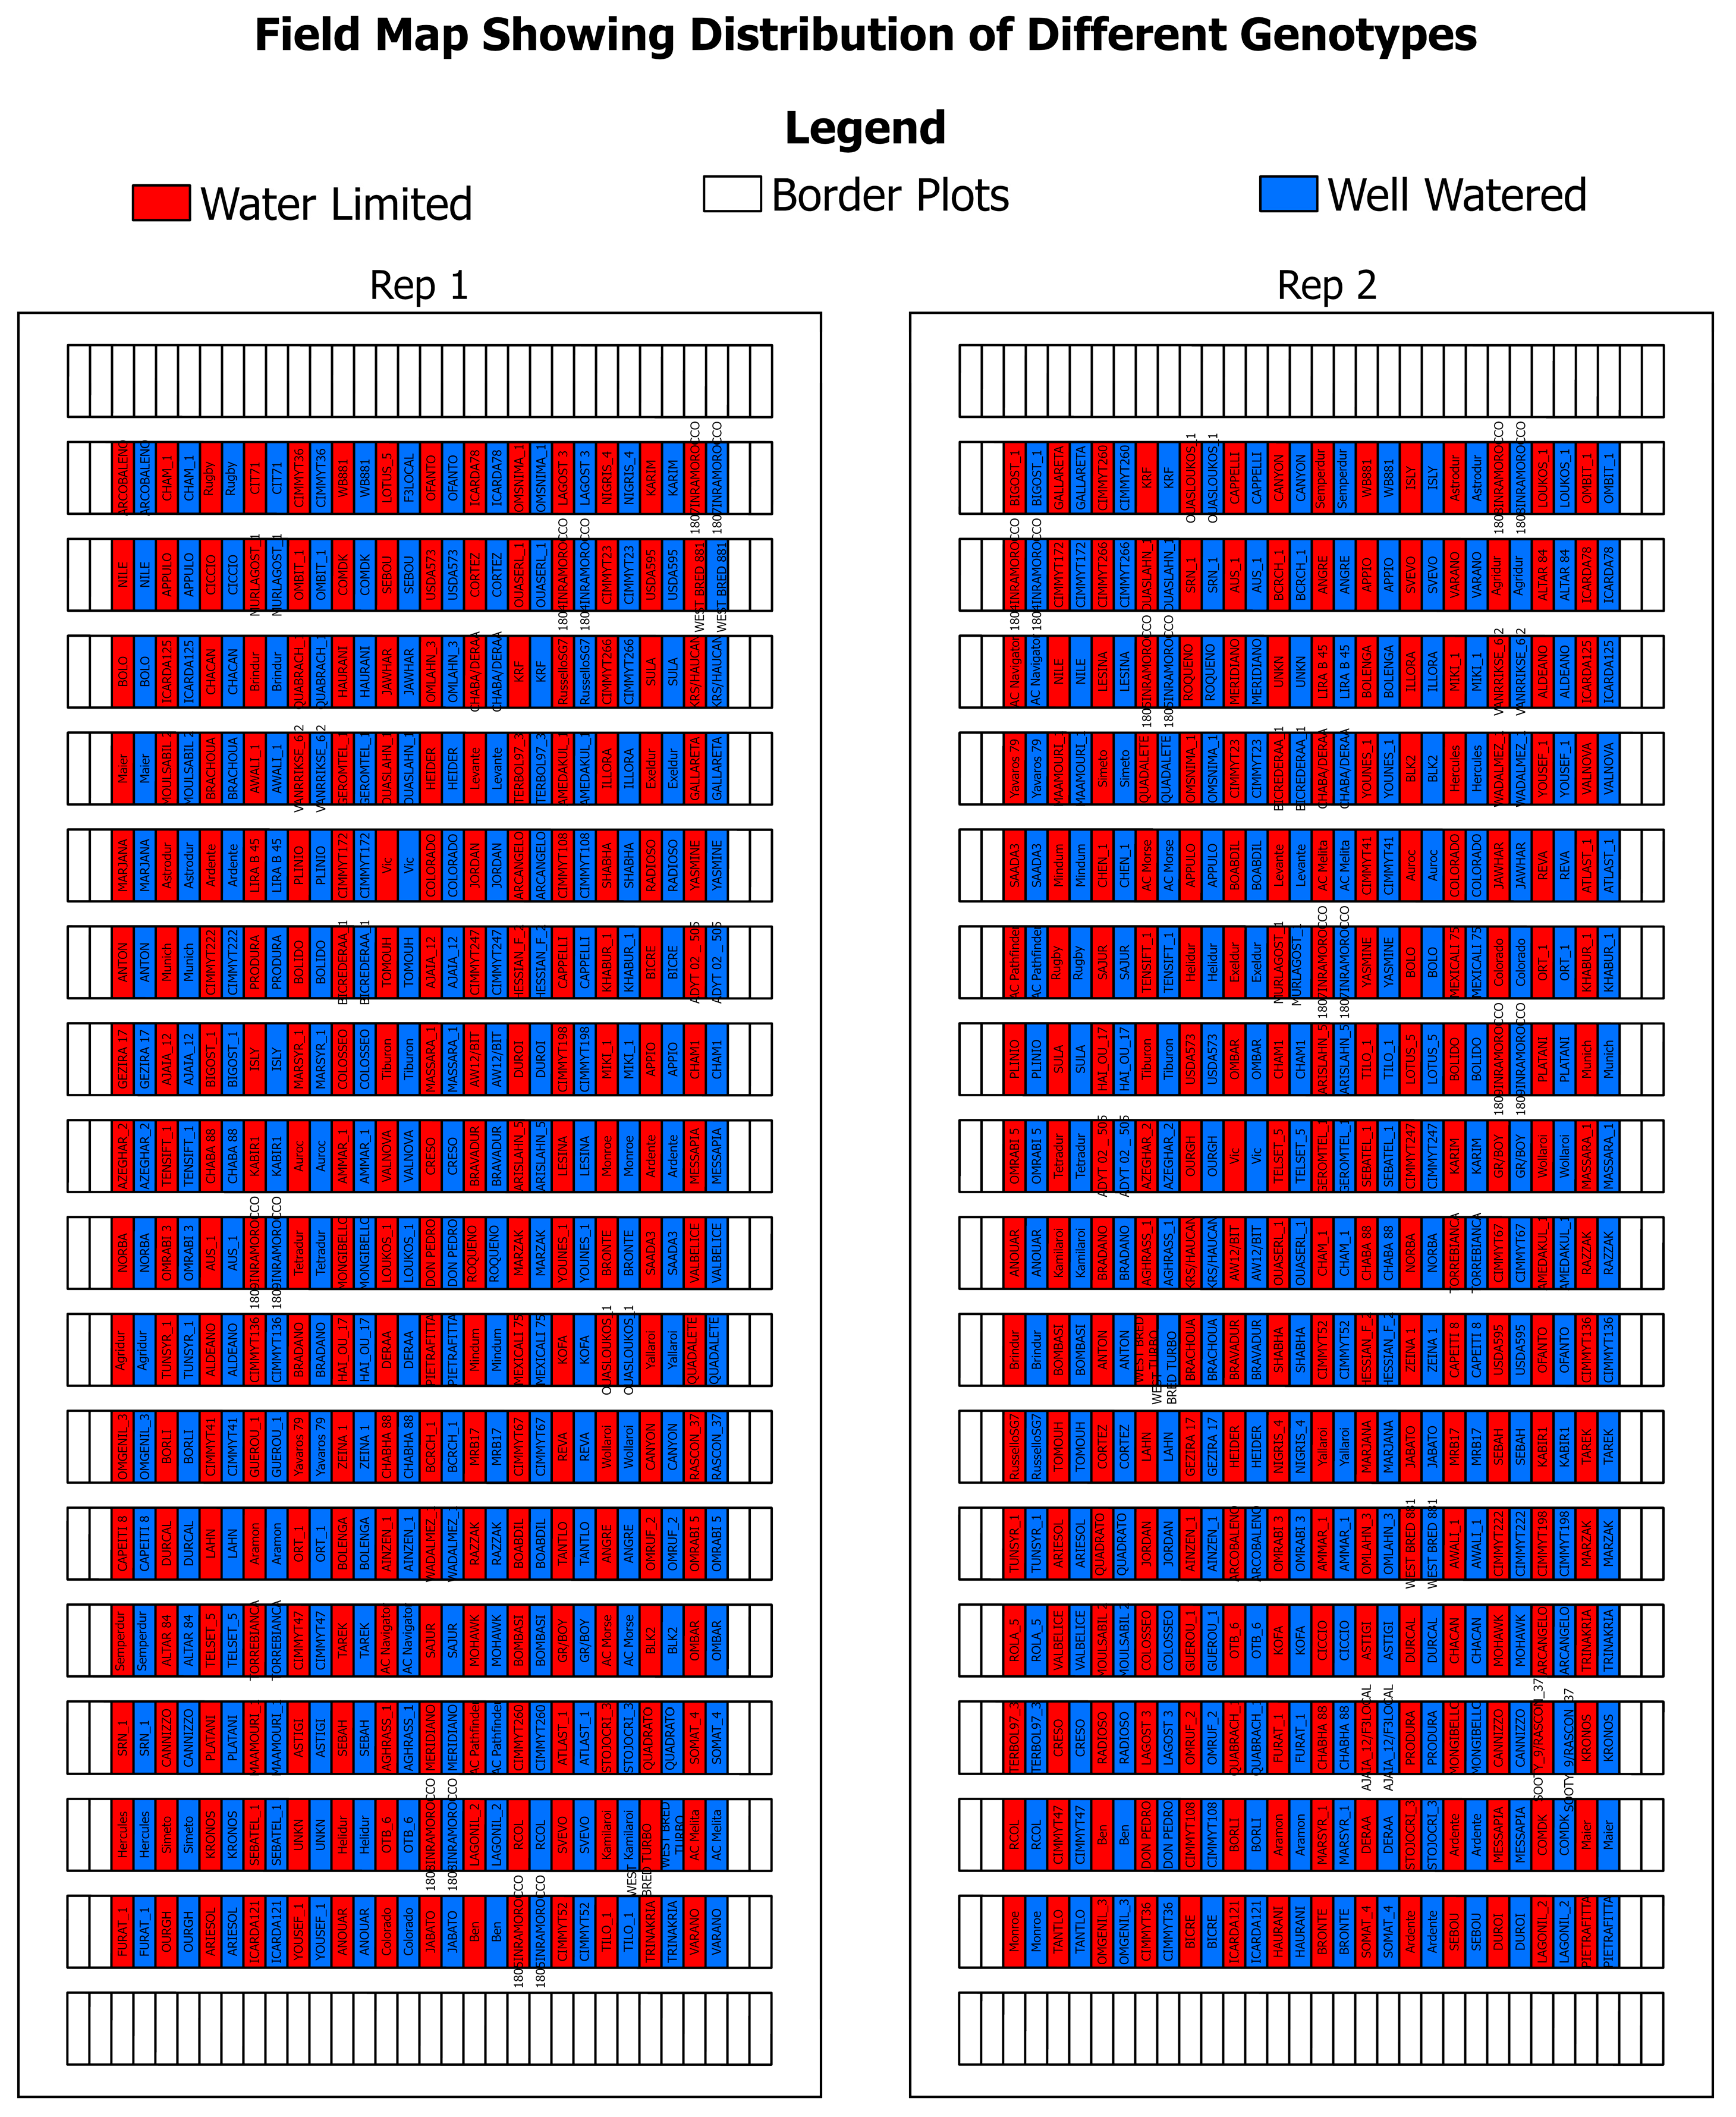
2. Experimental Setup and Data Collection

In this article, we systematically evaluated a combination of data from ground sensors and a very-high-resolution hyperspectral imager to assess early indicators of drought stress. In 2015, the U.S. Department of Energy initiated a program via the Advanced Research Projects Agency-Energy (ARPA-e) called Transportation Energy Resources from Renewable Agriculture (TERRA). The aim was to tackle pressing issues concerning sustainable bioenergy crop production. The focus was on leveraging advanced technologies to speed up plant breeding processes, enhancing yield and biomass characteristics. Recognizing that food and bioenergy crops benefit from plant breeding techniques that optimize water and nutrient efficiency, it is crucial to have precise data on phenotypic and corresponding genotypic traits. Enhancing the throughput, precision, and accessibility of field phenotyping data can lead to a better understanding and prediction of complex attributes such as yield and biomass [36,37]. Within the scope of the project, the Transportation Energy Resources from Renewable Agriculture Phenotyping Reference Platform (TERRA-REF), also known as the field scanner, was set up at the University of Arizona’s Maricopa Agricultural Center. From 2016 to 2019, it was operational for nine field trials, during which it collected public plant phenotype data on varied sorghum and durum wheat germplasm samples. The overhead ‘camera box’ on the field scanner is equipped with five main imaging systems: a 3D laser, thermal infrared, stereo RGB cameras, a camera for chlorophyll fluorescence, and a hyperspectral imaging system. The hyperspectral data, produced using two systems from Headwall Photonics, were considered essential reference material. This is because high-definition hyperspectral imaging was emerging as a pivotal technology for observing and assessing plant and plant-system physiological conditions, spanning scales from the microscopic to the ecosystem level [38].
The study area shown in Figure 1a is the Maricopa Agricultural Center, Maricopa, Arizona, USA (33.070°N, 111.974°W, elevation 360 m). A close view of the study area in Figure 1b shows the location of the two replicate fields, while Figure 1c shows the position of the plots (well-watered and water-limited). The TERRA-REF field scanner (Figure 1d) is the LemnaTec-built field scanner, which is equipped with a camera box (Figure 1g) that houses the 3D laser, thermal infrared, stereo RGB cameras, a camera for chlorophyll fluorescence, and a hyperspectral imaging system.
In this study, datasets derived from both proximal and remote sensing instruments were utilized. Data on chlorophyll content were obtained using the chlorophyll fluorescence sensor housed within the camera box. Additional physiological parameters, including Photosystem II (PSII), relative water content (RWC), and leaf rolling, were gathered in the field with proximal instruments. Data collection, both hyperspectral and ground truth, spanned four distinct temporal phases: (1) Before water stress (Pre-drought stress); (2) Early water stress; (3) Late water stress (Mid-drought stress); and (4) After water stress ended (Post-treatment stress). A more detailed explanation relative to datasets is described subsequently. A description of the sensors used for data collection in this study is in Table 1.

2.1. Gantry Hyperspectral System

The field scanner is housed at the University of Arizona Maricopa Agricultural Center in Maricopa, Arizona. Recognized globally as the pre-eminent field-crop phenotyping robot, this device boasts a hefty 30-ton steel structure. As it autonomously navigates two steel tracks, each two hundred meters in length, it diligently records images of the underlying crops through a variety of sensing equipment and cameras [39]. The TERRA-REF field scanner at the Maricopa Agricultural Center employs a hyperspectral imaging system, which includes two HyperSpec Inspector line-scanning cameras and associated spectroradiometers. These cameras cover the visible and near-infrared range (389 to 1000 nm) and the SWIR range (895 to 2501 nm). The system underwent maintenance and calibration changes over the years, leading to minor sensor and data output variations. The data captured require radiometric calibration to convert photon measurements into radiance or reflectance values. The VNIR camera specifics include a spectral resolution of 0.64 nm and an average dispersion of 98.4 nm/mm, while the SWIR camera has a spectral resolution of 5.9 nm and an average dispersion of 246.4 nm/mm. For further details on this field scanner imaging system, refer to the prior study [40].

2.2. Plant Physiological Data

To discern the early signs of drought stress in durum wheat, we utilized hyperspectral sensors and ground sensors to capture crucial physiological data. The Spectral Evolution PSR+3500 VNIR spectrometer, with its range of 350 to 800 nm, assisted in gauging the relative water content (RWC) of the plants, offering insights into their hydration status. Utilizing these sensors, we were able to construct a detailed physiological portrait in our durum wheat trials. Further information regarding the sensors is detailed by Burnette et al. [41].
In this research, 12 wheat genotypes out of the 224 planted were selected in the experiment for our analysis, each planted in duplicate within the research field (2 replicates). The choice of these specific genotypes was informed in part by a prior study conducted in the same field, which assessed their water content and osmotic potential under simulated drought conditions [42]. To investigate the drought impact, water-deficit treatments were implemented by maintaining the eastern rows of the research plots under well-watered (WW) conditions while subjecting the western rows to water-limited (WL) conditions. In detail, two primary fields—Rep 2 to the north and Rep 1 to the south—were planted in a grid, comprising sixteen ranges and sixteen columns, which we referred to as ‘plots’. Within each plot, durum wheat was planted in two rows, each 3.5 m long with 0.76 m between rows. Both treatments received irrigation by subsurface dripline during plant establishment until 77 days after planting. At that time, the treatments were implemented such that the eastern row of each plot continued to receive irrigation, while the western row of each plot experienced a progressive water deficit as irrigation was terminated. Our observations were categorized into four phases relating to drought stress. Initially, during the ‘Pre-stress’ phase, all rows received irrigation to maintain well-watered conditions. Then, on March 6 (77 days after planting), the treatments were implemented, and the experiment transitioned into the ‘Early drought’ stage when irrigation to the western rows was restricted. As we approached the height of the water stress in the ‘Mid drought’ phase, the eastern row maintained its regular irrigation schedule. Finally, by April 3, the ‘Post Treatment’ phase began, with all watering ceased for both rows across all plots in preparation for biomass harvest. Figure 2 shows the field map of the study area. This field map shows the distribution of each genotype and the water treatment on individual plots.
Table 2 denotes the data acquisition for each replicate throughout the study.
For our study, we selected twelve distinct types of durum wheat, all of which are detailed in Table 3. These specific selections emerged primarily from data on water-stress responses in a previous study based on their osmotic adjustment [42]. By selecting these varieties that represent contrasting drought responses, we have formed what is known as a ‘diversity panel’. This panel is crucial because it encompasses a broad range of drought reactions, from pronounced susceptibility to commendable resistance. To ensure the validity of our findings, the genotypes were planted in a replicated randomized trial (following a resolvable row–column experimental design). This setup confirms that the variability in responses we witness arises primarily from the genetic makeup of the wheat and not from differences in the field environment.

3. Methods

Outlined in Figure 3 is our structured approach to processing hyperspectral imagery. The workflow begins with the acquisition of raw images using hyperspectral sensors. Once we have these images, they undergo a series of methodical processing stages. First, we perform georeferencing to anchor each image within a precise spatial context. Next, we calibrate the images to convert digital numbers (DNs) into reflectance values—a crucial step for subsequent analyses. The images are then segmented to identify and isolate specific regions of interest. Finally, we extract significant features from the segmented images, aiming to capture the essential data for our research objectives. The following sections will provide an in-depth understanding of each of these stages, elucidating the methods and techniques we have employed.

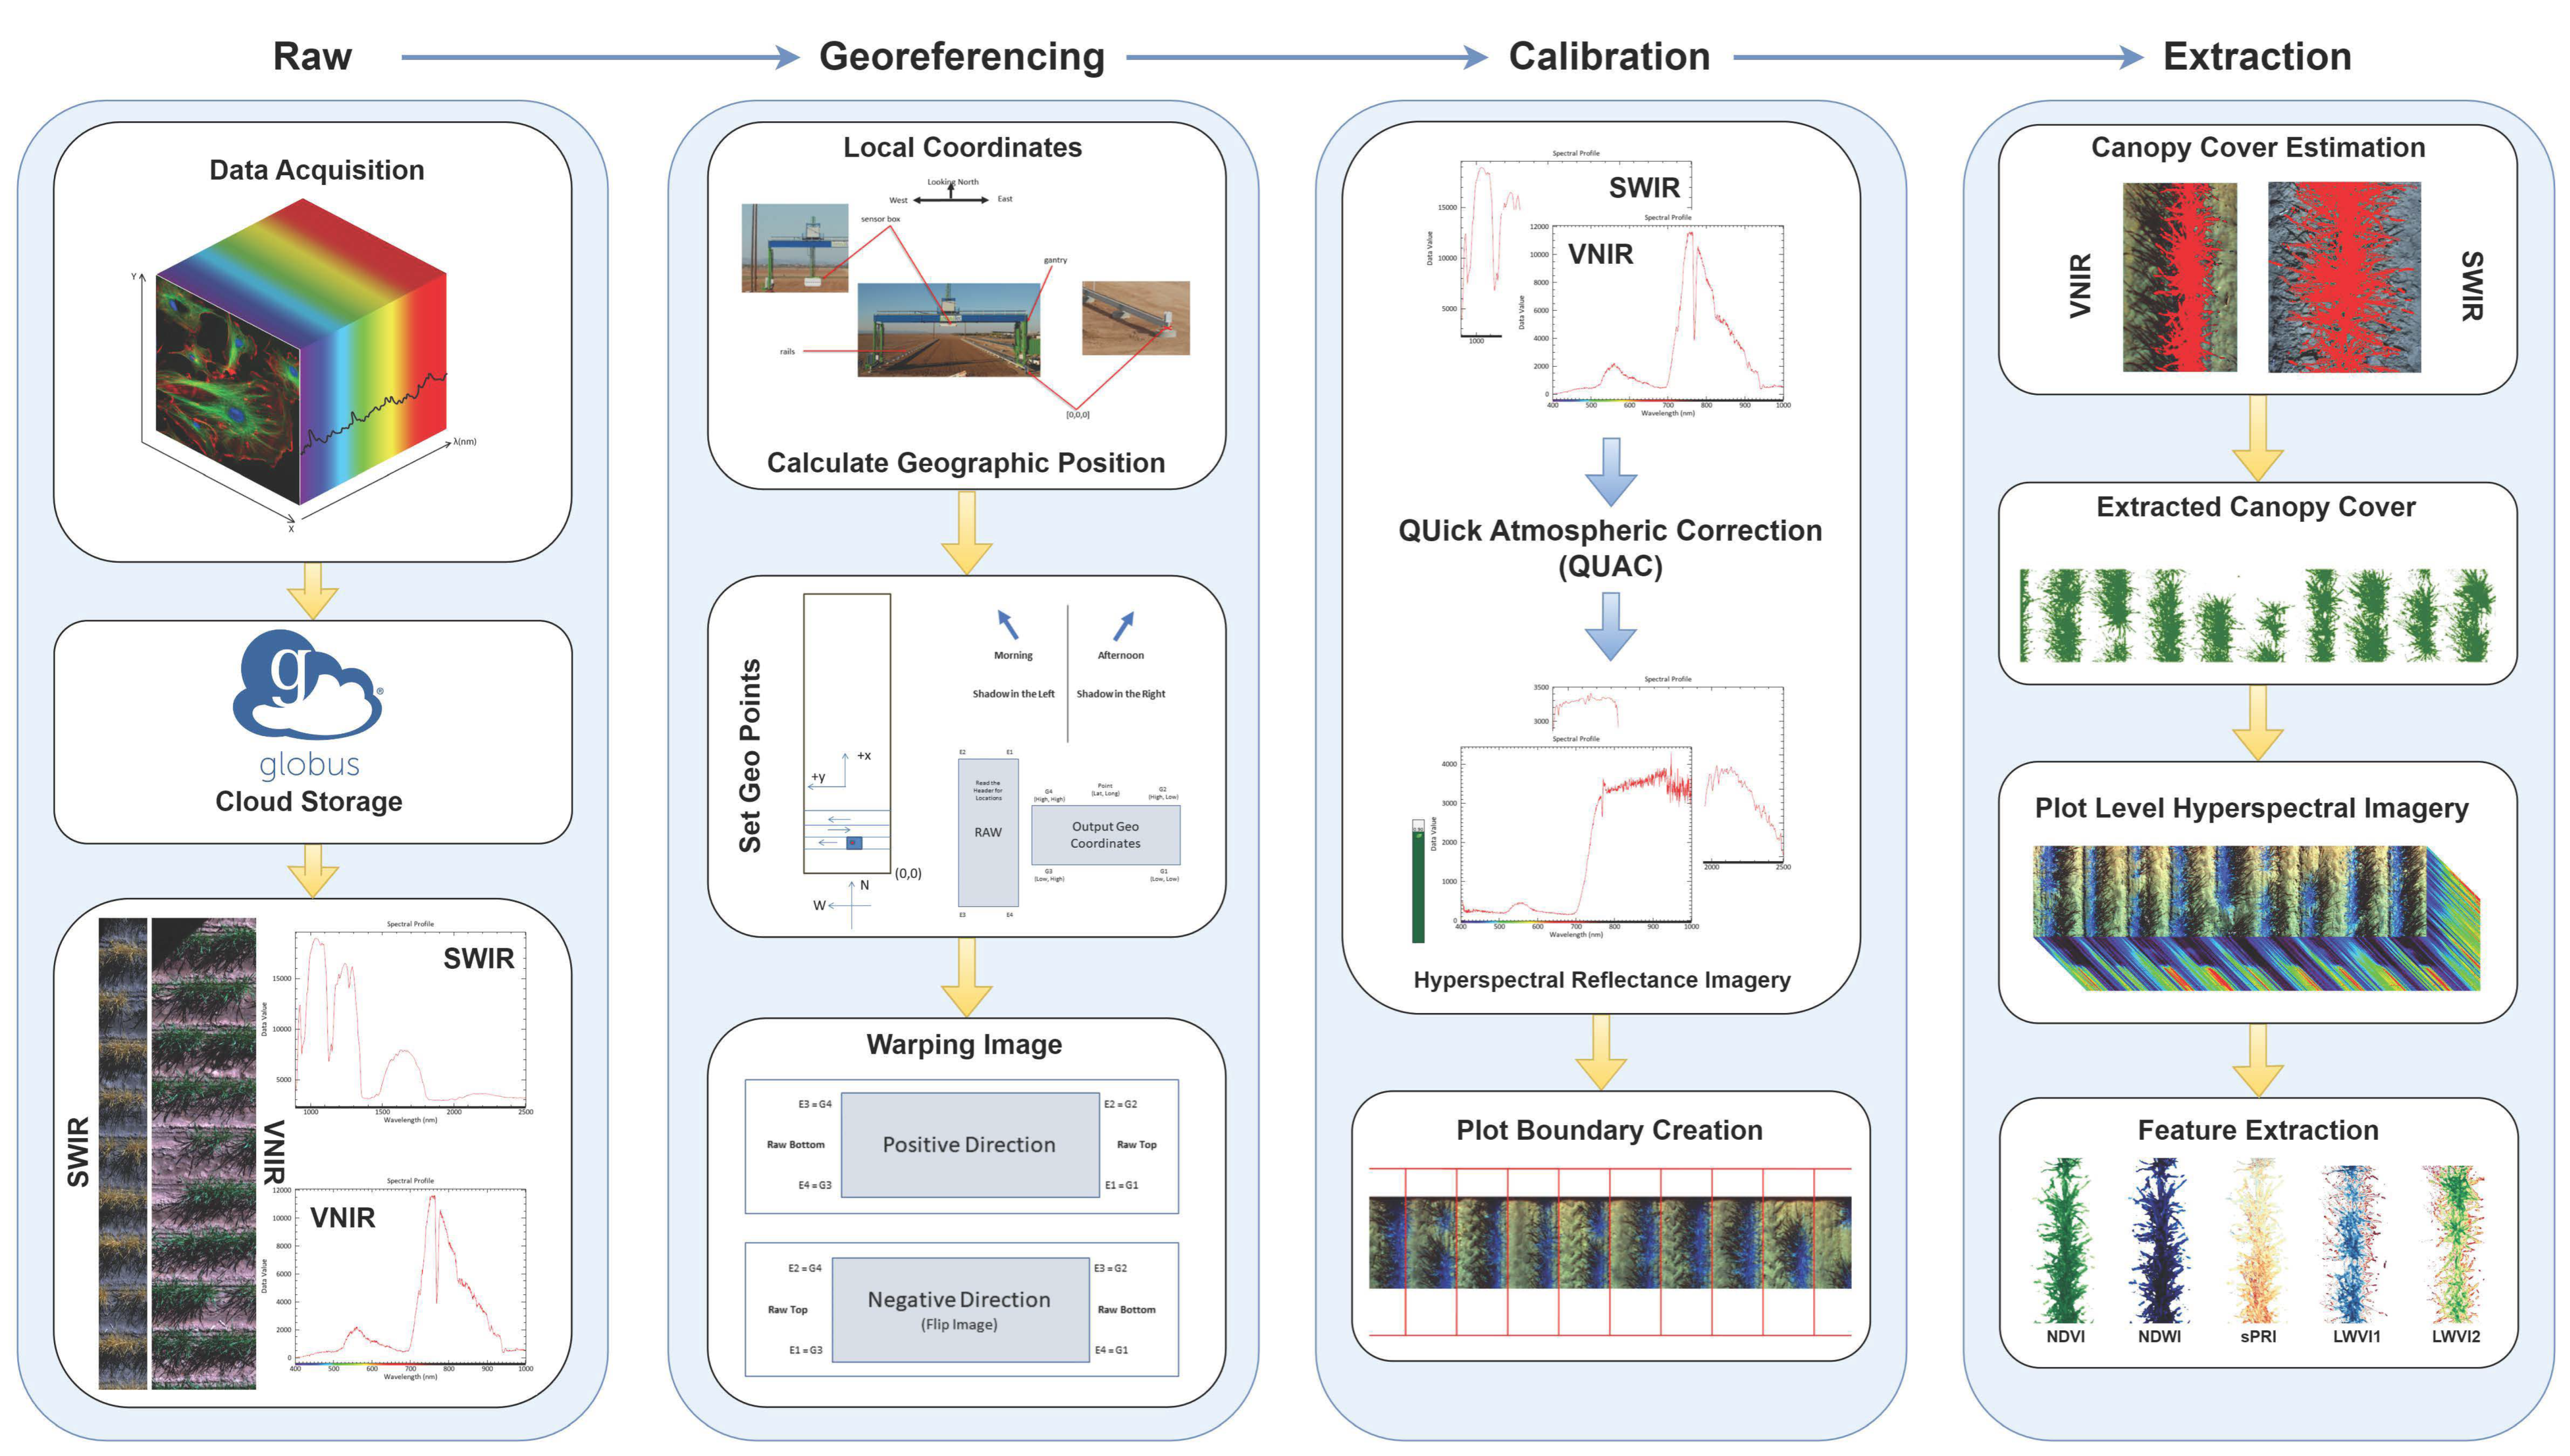
3.1. Hyperspectral Image Acquisition, Georeferencing, and Calibration

The hyperspectral sensors, integrated into the gantry system, capture raw imagery in the form of digital numbers (DNs) with a spatial resolution of 0.3 cm. After acquisition, raw DN data (which is classified as level 0 data) are transferred to the Globus cloud storage platform for preservation [43]. In this study, the gantry system did not capture the geographical coordinates for each image. However, it did accurately record each image’s relative position from its starting point. We converted these relative coordinates into the Universal Transverse Mercator (UTM) coordinate system using this relative position data. The gantry system’s reference, the southeast corner of the field, is used as the point (0,0). From this reference, the spatial movement of the camera box is monitored in meters, with each movement recorded as metadata for each scan. For scans in the north–south direction, the central pixel is positioned beneath the sensor’s midpoint, with adjacent pixel locations deduced based on the sensor’s pixel dimensions. In the gantry’s east–west scans, the position of each pixel is adjusted using its size from the initial scan as a reference. Additionally, due to the bidirectional scanning approach, images from left-to-right scans are inverted and labeled as the negative direction in our dataset. To enhance georeferencing accuracy, a subset of images was cross-checked using the sun’s position and corresponding shadow orientation on the capture day. Further details about the relative to UTM conversion were described in an earlier paper [39].
Following georeferencing, the images characterized by DN values are calibrated to extract hyperspectral reflectance. This calibration is achieved using the Quick Atmospheric Correction (QUAC) tool within the ENVI software suite (v 5.6.3). We opted for the QUAC method over other calibration techniques due to its efficiency and adaptability [44]. Notably, QUAC offers the advantage of real-time atmospheric correction without necessitating extensive knowledge about atmospheric conditions or ground reflectance measurements. Its consistency and reliability across varied hyperspectral datasets, regardless of the time of year or seasonal changes, stand as a testament to its capability to ensure accurate spectral reflectance values. Once the calibration process is completed, the reflectance values are converted into a float data type and subsequently scaled by a factor of ten thousand. This ensures a standardized reflectance range between 0 and 1.

3.2. Plot Segmentation and Canopy Cover Estimation

We ensured the output images were correct by comparing the vegetation spectra from our images to standard spectra. For further analysis, we produced boundaries for each genotype-specific plot and further segmented these plots into eastern and western rows. To extract the canopy cover, we employed a fully automated method. This method capitalizes on the distinct responses between soil and vegetation at specific wavelengths [45]. We applied the following Rule 1 for VNIR images and Rule 2 for SWIR images, where the wavelengths are expressed in nanometers. Mathematically, the rule-based method of canopy cover extraction is expressed as follows:
Rule 1: Ref550 > Ref650 and Ref550 > Ref450 and Ref550 < Ref865
Rule 2: Ref998 > Ref1502
The mean spectra were plotted for both water-limited and well-watered varieties across three stages, as illustrated in Figure 4. In the Pre stage, the VNIR region displays a percentage difference of −9.85% between WW and WL, transitioning to a 5.56% difference in the Mid stage, and further shifting to a −0.43% difference in the Post stage. This transition indicates a reversal in the VNIR reflectance characteristics from the Pre to the Mid stage, followed by a marginal decrease in the percentage difference by the Post stage. Conversely, the SWIR region presents a percentage difference of 5.61% in the Pre stage, which modestly transitions to 1.62% in the Mid stage, and then escalates to a notable 10.06% difference in the Post stage. This progression suggests a modest decrease in the percentage difference from the Pre to the Mid stage, followed by a significant increase in the Post stage.

3.3. Feature (Index) Extraction

After segmenting and calibrating the hyperspectral images, we extracted key spectral indices. These indices helped us detect early indicators of water stress in the plants. Using the mask produced by our rule-based extraction method, we clipped the reflectance-calibrated images to obtain the vegetation region only. For our analysis, we derived five spectral indices from these images, each aiming to provide unique insights into the plants’ health and status. The specifics of these indices, including their respective equations and references, are detailed in Table 4.

4. Results

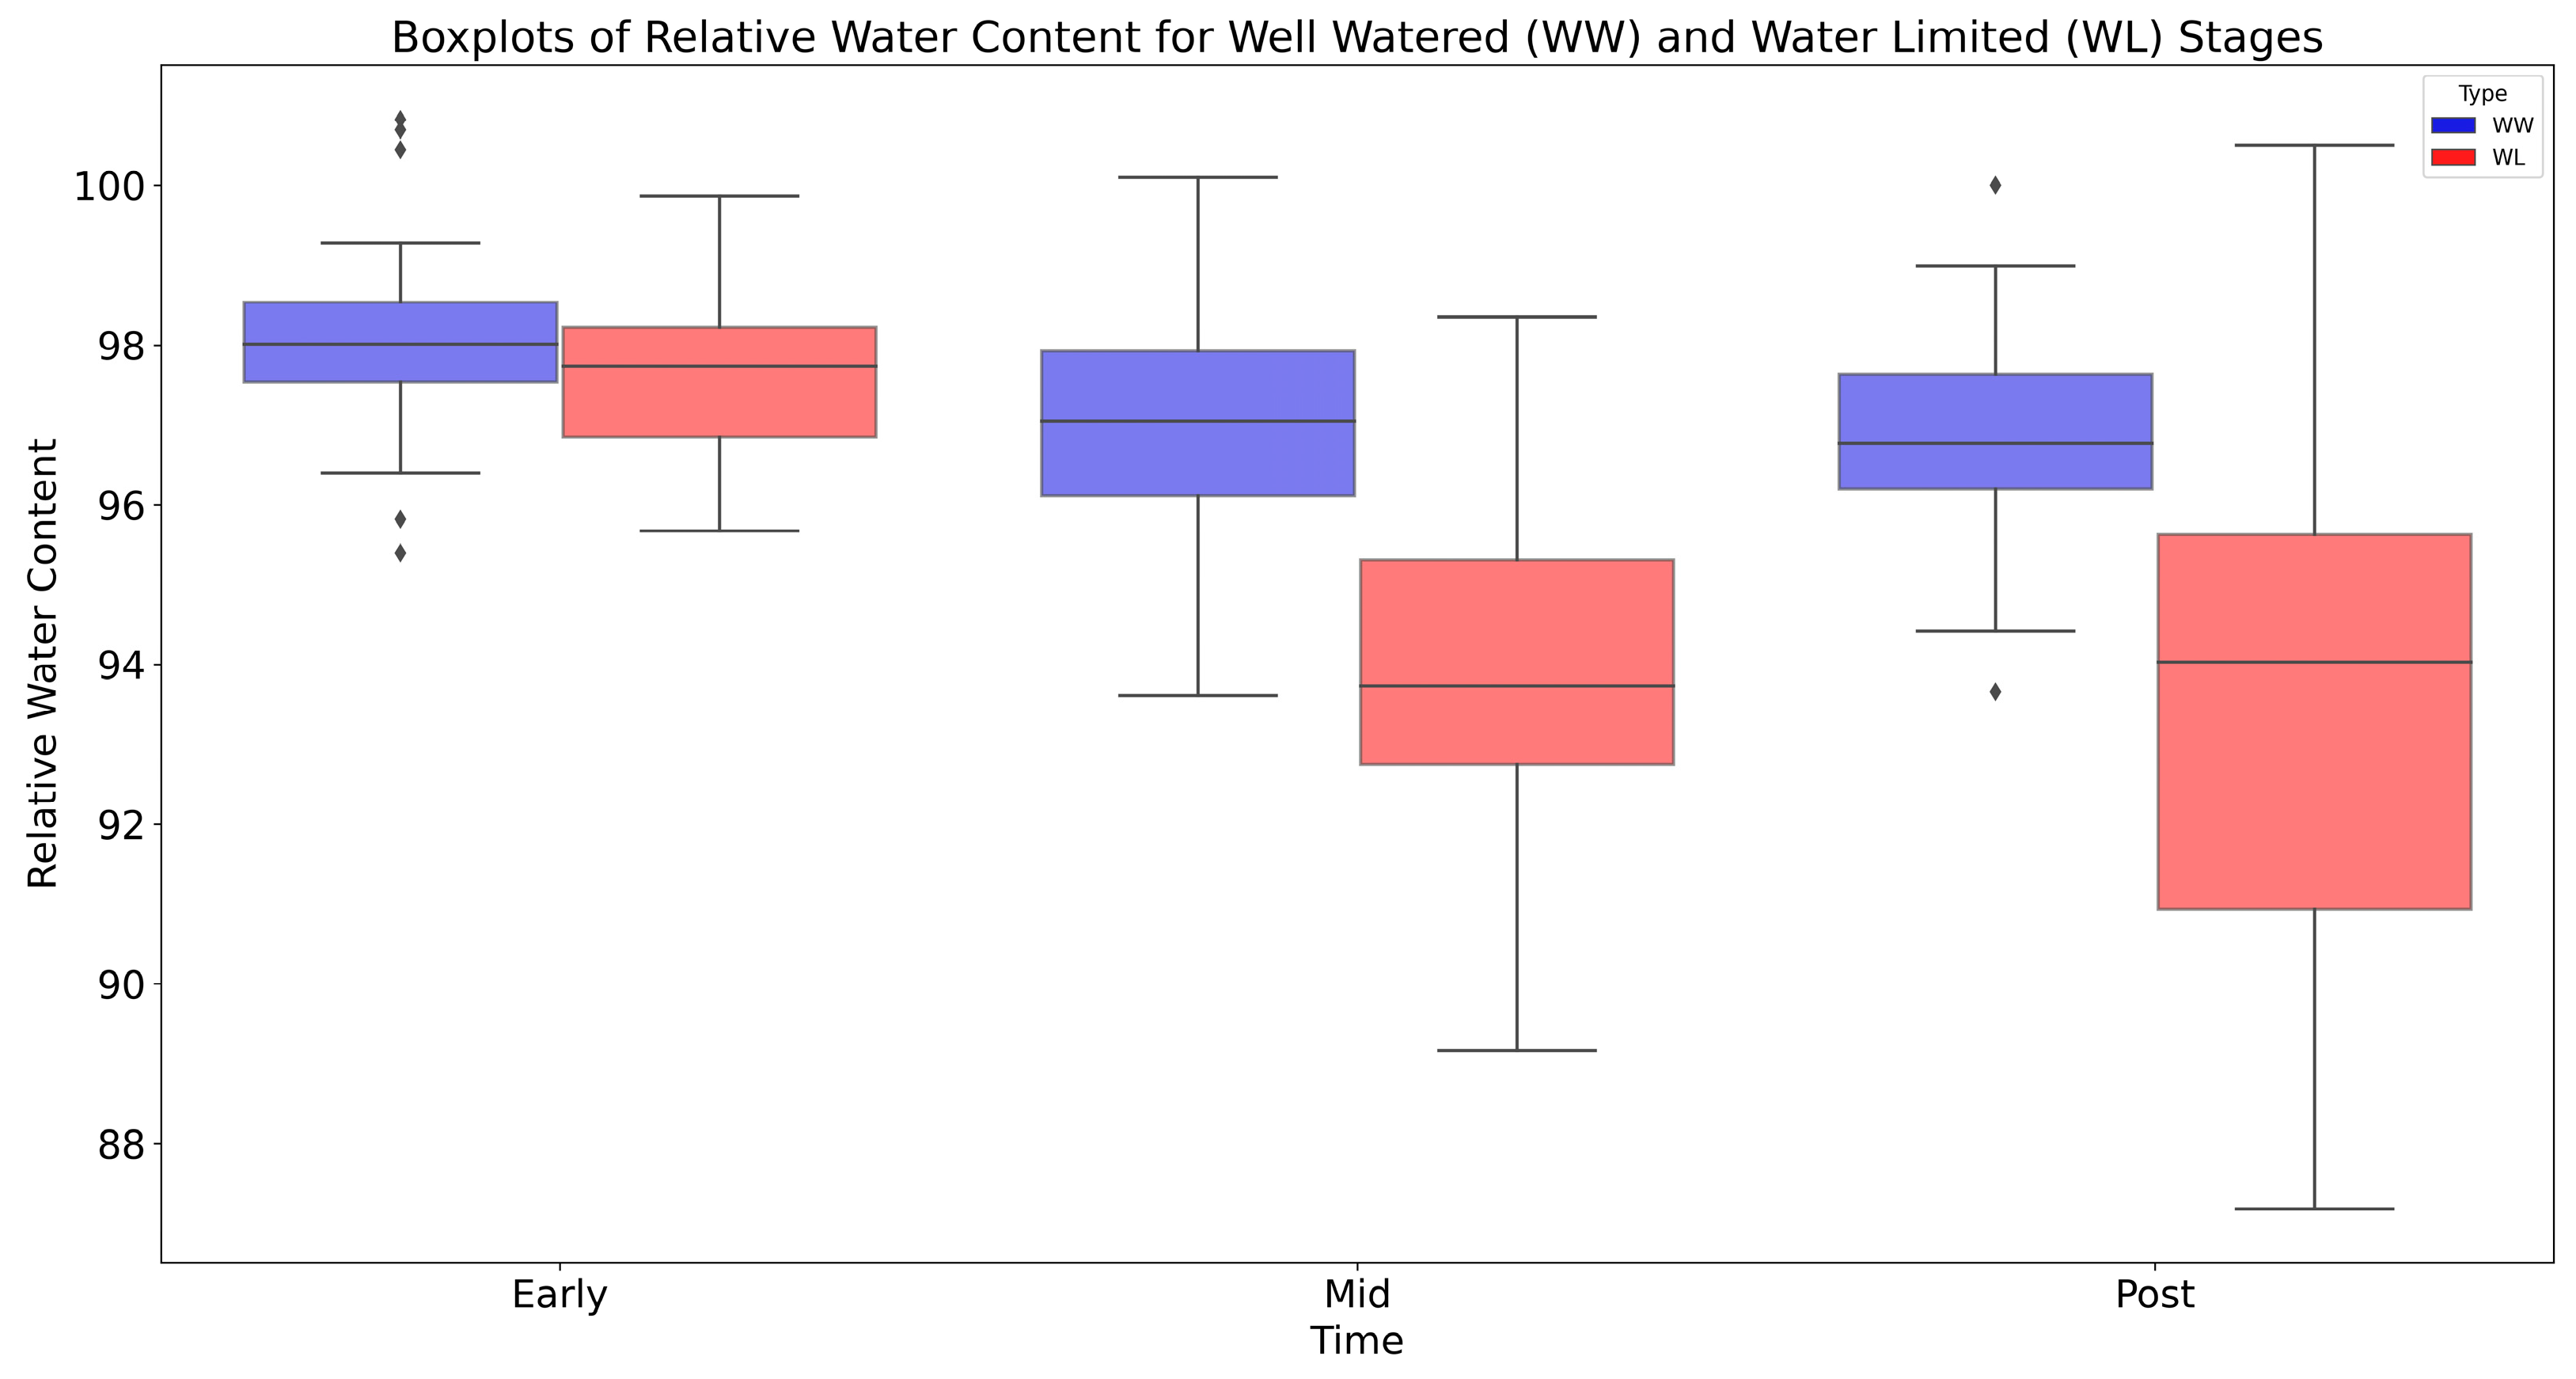
4.1. Changes in Relative Water Content (RWC)

Leaf-level relative water content (RWC) was measured on fully expanded leaves sampled at dawn and transported to the laboratory for processing, as described by Condorelli et al. (2022) [42]. Figure 5 illustrates the boxplots of RWC for both well-watered (WW) and water-limited (WL) conditions during the three main stress stages: Early, Mid, and Post. These boxplots provide an overview of RWC values, indicating the median, range, and any outliers. A clear observation from Figure 5 is that RWC values for the WW conditions are consistently higher than those for the WL conditions at every stage. The difference is especially noticeable from the Mid drought stage, highlighting the intense water stress during this time.
As the study progressed from the Early to Mid stages, there was a noticeable drop in RWC values for both WW and WL conditions, but by the Post-treatment stage, when all irrigation was stopped, the RWC values seemed to stabilize. The stability in RWC observed during the Post-treatment stage underscores the inherent adaptive mechanisms present in the durum wheat varieties. Resistant groups exhibit a more consistent RWC, suggesting robust mechanisms that allow them to cope effectively with drought conditions. In contrast, susceptible groups display a more pronounced variation in their RWC, underlining their heightened sensitivity to drought. Additionally, the range of values in the boxplots, particularly for the WL conditions, indicates differences in RWC among the different genotypes of durum wheat. The differential responses between these groups emphasize the genetic diversity within the panel and the crucial role of genetics in determining drought reactions. In summary, Figure 5 offers a clear picture of how RWC changes in durum wheat when subjected to different water conditions.

4.2. Statistical Analysis

Multiple statistical tests were used to thoroughly assess the variations in plant water content. Data consistency across groups was ensured by preliminary tests like the O’Brien, Brown–Forsythe, Levene, and Bartlett [50] tests, which laid the groundwork for further analyses; these results are summarized in Table 5. The overall differences in water content between the plant treatments were then determined using the F-test (ANOVA), which gave a thorough overview. The one-way ANOVA was used to delineate the data at each stage, which are summarized in Table 6 and provide a more detailed understanding of these disparities at study intervals. The pooled t-test directly compared the two treatments to conclude the analysis, providing a clear quantification of the differences in water content between them. Results for the pooled t-test for all stages are summarized in Table 7. This battery of tests ensured a comprehensive understanding of the study’s findings. Figure 6 shows the standard distribution of RWC for all development stages.
Table 5 reveals significant statistical variations in plant water content at different development stages. In the Early stage, the F-statistics for O’Brien and ANOVA tests are 2.94, with a p-value of 0.09, indicating minor variance differences between WW and WL treatments. However, in the Mid-stress stage, these tests show a pronounced increase in F-statistics (O’Brien: 38.59, ANOVA: 38.58) and a significant drop in p-values to less than 0.00001, highlighting substantial differences in water content variance. The late-stage trend continues, with F-statistics for O’Brien and ANOVA tests at 17.43, and similarly low p-values, confirming persistent disparities.
Table 6 presents the one-way ANOVA results of the differences in mean water content. In the Early stage, WW and WL treatments have close mean values (WW: 98.10, WL: 97.49), suggesting minimal initial disparity. The Mid stage shows a more significant gap (WW: 96.90, WL: 93.71), indicating increased water content variance under prolonged stress. The Post stage further highlights this difference, with WW treatment maintaining a higher mean water content (96.87) than WL (93.72). The standard errors (WW: 0.29, WL: 0.69 in the Post stage) and confidence intervals (e.g., WW: 96.25–97.50, WL: 92.28–95.15 in the Post stage) across stages underscore the increasing variability and impact of water stress.
Table 7 shows the pooled t-test results, directly comparing WW and WL treatments. The difference in mean RWC between the treatments increases from 0.61 in the Early stage to 3.18 and 3.15 in the Mid and Post stages, respectively. The standard error of these differences also rises (Early: 0.35, Mid: 0.51, Post: 0.75), reflecting growing disparity. The t-ratios (Early: 1.71, Mid: 6.21, Post: 4.17) and the confidence levels (all stages: 0.95) statistically support the long-term impact of water stress on the plants, with WW consistently showing higher RWC than WL.

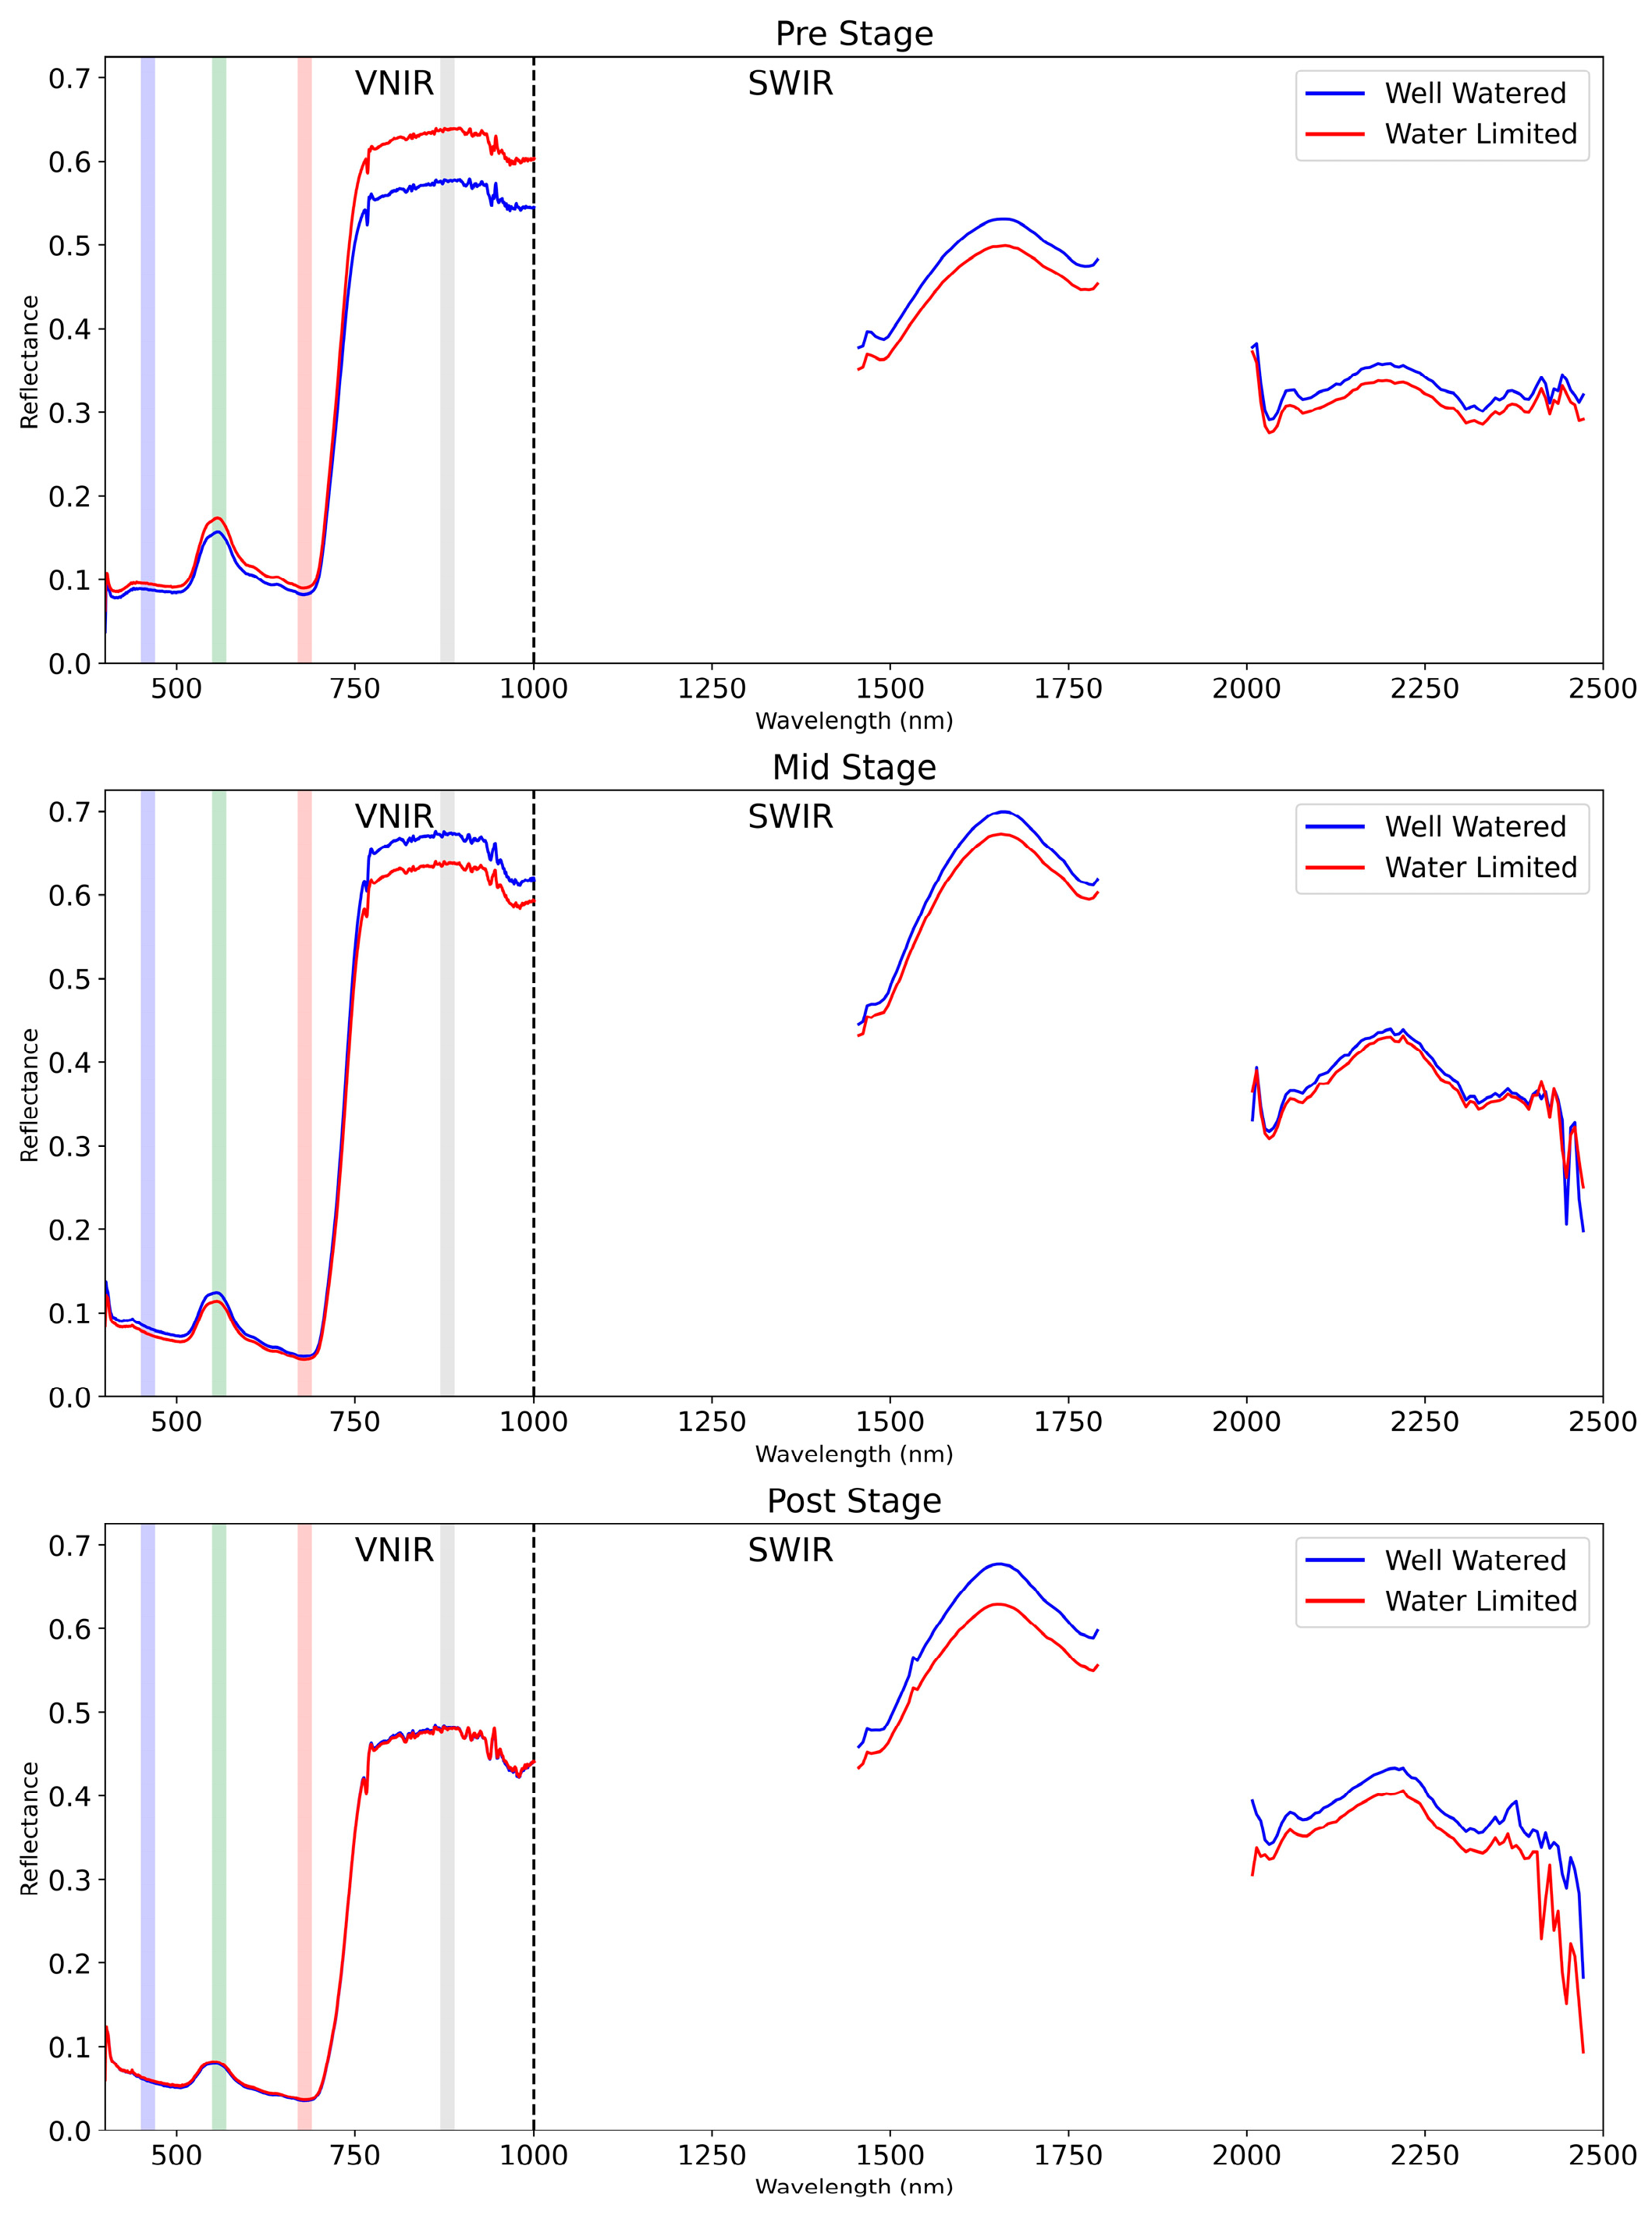
4.3. Spectral Vegetation and Water Indices

Derived from high-resolution hyperspectral images, indices such as NDVI, PRI, NDWI, LWVI1, and LWVI2 offer insights into plant physiological states under different water conditions. These indices serve as critical tools in assessing the performance of durum wheat genotypes under drought conditions [17]. Figure 7 vividly illustrates how drought-resistant and drought-prone genotypes responded to water stress, as measured by the given indices across the Pre-, Mid-, and Post-treatment stages.

5. Discussion

5.1. Changes in Relative Water Content (RWC)

The findings from the RWC measurements, especially the consistent higher RWC in WW conditions across all stages, highlight the critical role of water availability in maintaining plant health under drought conditions. The notable drop in RWC values from Early to Mid stages in both WW and WL conditions suggests that water stress affects all genotypes, but the extent of impact varies. The stabilization of RWC in the Post-treatment stage reflects the durum wheat varieties’ adaptive mechanisms, with resistant varieties showing more consistent RWC, indicating effective coping strategies under drought conditions. In contrast, the pronounced variation in RWC among susceptible groups points to their vulnerability to drought.
The results from the O’Brien, Brown–Forsythe, Levene, Bartlett, and ANOVA tests reveal significant disparities in water content between WW and WL treatments, particularly in the Mid-stress stage. This indicates the severe impact of water stress on the genotypes and underscores the importance of consistent water availability. The findings from these tests demonstrate that while the genotypes may start with a similar hydration baseline, as stress prolongs, their ability to retain water significantly diverges. These observations are crucial for understanding the adaptive capacities of different wheat genotypes under drought stress.
Table 5 indicates that, In the Early-stress stage, both the Well-Watered (WW) and Water Limited (WL) treatments exhibited similar relative water content (RWC) values, suggesting that there was no statistically significant disparity in the water content between the two treatments. In the earlier stage of water stress, both sets of plants started with a similar hydration baseline. However, once the water stress was prolonged, significant differences in RWC emerged in the Mid-stress stage. The O’Brien test clearly showed that the WW plants were retaining more water than the WL plants, which were now exhibiting the effects of the imposed water restriction. The ANOVA F-test findings were in line with this observation, further emphasizing the impact of the water stress on the two treatments. The data from this stage illustrate how essential consistent water availability is for plants, with the WW treatment being better equipped to combat the challenges of water stress compared to the WL treatment.
After the period of water stress concluded, the Post-treatment stage was assessed. The effects of the earlier water stress were still evident. The WW treatment plants consistently exhibited a higher RWC compared to the WL treatment. The 3.2% difference in their mean RWC values is evidence of the long-term effects of water stress on plant hydration. This difference was statistically supported by a t-ratio of 4.2. Moreover, the Brown–Forsythe, Levene, and Bartlett tests all reflected significant differences in RWC between the treatments during this final Post-treatment phase when all irrigation was terminated. This indicates that as water-deficit stress continued, the WL plants continued to show lower leaf water content compared to the WW plants after irrigation was terminated.
Our findings regarding the vital role of consistent water availability in maintaining plant health under drought conditions are supported by similar observations in recent studies. Research has shown that wheat genotypes exhibit varied responses to water stress, akin to our observation of higher RWC in well-watered conditions [51,52]. This is in line with studies demonstrating significant variability in the response of different wheat genotypes, including landraces and synthetic hexaploids, to drought stress [53]. Additionally, the impact of drought stress on wheat germination and growth, as seen in the notable RWC decline from the Early to Mid stages in our study, is corroborated by similar findings in other research [53]. On the other hand, our findings contrast with a study that found variable responses to PEG-induced drought stress among different bread wheat genotypes, suggesting there is no uniform response pattern across genotypes in the initial stages of stress [54]. This is complemented by another study [55], which shows that drought-tolerant wheat genotypes have developed more efficient adaptive strategies, such as deeper root systems and higher biomass, indicating a diverse range of drought responses extending beyond our initial observations.

5.2. Analysis of Spectral Vegetation and Water Indices

The spectral indices, including NDVI, PRI, NDWI, LWVI1, and LWVI2, provide a comprehensive view of the physiological state of the plants under varying water conditions. The normalized difference vegetation index (NDVI) is one of the oldest remote sensing applications that is widely used to evaluate plant health and greenness [56]. The mean normalized difference vegetation index (NDVI) exhibited distinct variations between the drought-resistant and drought-susceptible genotypes (Figure 7). At the outset, in the Pre-stress stage where both groups received consistent watering, the drought-resistant genotypes showed an average NDVI of 0.776, suggesting robust vegetative health. However, as water stress was introduced during the Mid stage, these values increased to an average of 0.867, indicating an adaptive response. By the Post-treatment stage, when all irrigation was halted, a slight reduction to 0.866 was observed. In contrast, the drought-susceptible genotypes started with an NDVI of 0.754 during the Pre-stress phase. As the water stress intensified in the Mid stage, the value rose to 0.855, hinting at a short-term coping mechanism. Yet, with the cessation of all watering in the Post stage, the values showed remarkable resilience, settling at 0.853. The decline in NDVI from the Pre stage to the Mid stage under water-limited conditions suggests a reduction in the plant’s photosynthetic capacity due to water stress. However, the stable NDVI in the Post-treatment stage, even when all irrigation was halted, signifies the inherent resilience of the drought-resistant genotypes. They seem capable of maintaining photosynthetic activity even under significant water stress. Conversely, the sharper decline in NDVI for drought-prone genotypes from Mid to Post stages highlights their susceptibility to prolonged water stress.
The Photochemical Reflectance Index (PRI) is the most sensitive to productivity indicators, followed by the NDVI [57]. The PRI serves as a physiological marker for drought stress and recovery, whereas the NDVI is less effective in detecting rapid plant photosynthetic changes due to environmental stressors [58]. The Photochemical Reflective Index (PRI) presented its own set of variations. In the well-watered conditions, the drought-resistant genotypes demonstrated an intriguing adaptation in their PRI. Commencing at the Pre-stress stage with an average PRI value of 0.466, there was an increase to 0.475 during the Mid-stress phase. Additionally, even upon the cessation of irrigation in the Post-treatment phase, this value further elevated to 0.486. This progression suggests that the resistant genotypes were enhancing their photosynthetic efficiency in response to evolving water scenarios. In contrast, the susceptible genotypes portrayed a more subdued response. Initiated with a slightly higher PRI of 0.468 during the Pre-stress stage, there was a marginal rise to 0.469 in the Mid-stress phase and finally to 0.476 in the Post-treatment phase. The restrained elevation in these values indicates that, although the susceptible genotypes initiated with marginally better photosynthetic efficiency, their adaptive response to changing water conditions was not as significant as the drought-resistant plants. Under the water-limited treatment, both genotypic categories exhibited an increment in PRI from the Pre-stress to the Post-treatment phase. However, the resistant genotypes consistently showed a higher photosynthetic efficiency, reaffirming their inherent drought resilience. Considering the tight proximity of the PRI values between the two groups, we might be missing nuances that are essential to understanding their distinct responses. A detailed look into individual genotypes could offer more clarity on their specific drought responses.
The normalized difference water index (NDWI) is particularly insightful for observing moisture content [59]. In the well-watered setup, the drought-resistant genotypes were initially recorded with an average NDWI of −0.214 during the Pre-stress phase. As the study progressed to the Mid stage and water stress was introduced, we observed this value drop to −0.295. In the Post-treatment phase, with no irrigation, the NDWI dipped further to an average of −0.382. This decline gives us a clear picture of how these plants adapted to increasing water stress, adjusting to the environmental shifts. In the water-limited scenario, the drought-resistant genotypes showed a continued decline in NDWI. They began with an NDWI of −0.214 in the Pre-stress period but saw it decline to −0.295 by the Mid stage. Once we stopped all irrigation in the Post stage, the NDWI slid down further to −0.382. This clearly illustrates the hurdles encountered by even the more resilient genotypes when water is in short supply. The susceptible genotypes in this water-limited treatment performed poorly. Starting at an NDWI of −0.232 during the Pre-stress phase, there was a significant dip to −0.283 by the Mid stage. When all irrigation stopped in the Post stage, we observed an NDWI of −0.424, highlighting their struggle and vulnerability when drought is prolonged. The drought-resistant genotypes consistently exhibited better NDWI values compared to the susceptible genotypes.
Leaf Water Vegetation Index (LWVI-1) provides insights into vegetation’s moisture content, crucial for understanding adaptability under varied water conditions [46]. For well-watered conditions, drought-resistant genotypes exhibited a consistent LWVI1 increase, starting at 0.239 in the Pre-stress stage and reaching 0.332 by the Post-treatment stage. This progression indicates their adeptness at water optimization amidst induced water stress. In contrast, drought-susceptible genotypes recorded an LWVI1 value of 0.264 during the Pre-stress phase and declined to 0.227 by the Post-treatment stage, signifying their water loss. Under water-limited conditions, drought-resistant genotypes initiated with an LWVI1 of 0.267, marginally increasing to 0.285 in the Mid-stress stage and further to 0.312 in the Post-treatment stage. Drought-prone genotypes, however, started at a higher 0.278 in the Pre-stress stage but saw a decline to 0.253 during the Mid-stress phase, and a further dip to 0.242 by the Post-treatment phase. For LWVI2, well-watered conditions saw drought-resistant genotypes consistently elevate their values, initiating at 0.058 during the Pre-stress stage and ending at 0.082 by the Post-treatment stage. This trend highlights their proficient water utilization. Drought-susceptible genotypes began at 0.049 in the Pre-stress stage, peaked at 0.062 during the Mid-stress stage, and then slightly declined to 0.060 in the Post-treatment stage. Under water-limited scenarios, drought-resistant genotypes began with an LWVI2 of 0.062, experienced a slight rise to 0.068 during the Mid-stress stage, and further increased to 0.075 by the Post-treatment stage. In contrast, drought-prone genotypes exhibited a decline from an initial 0.053 in the Pre-stress stage, dropping to 0.057 during the Mid-stress stage, and further to 0.056 in the Post-treatment period, emphasizing their restricted water retention capacity during prolonged drought conditions.
When comparing RWC with the NDVI, it becomes clear that the higher NDVI values of drought-resistant genotypes, particularly in the Post-treatment stage, are in line with their consistent RWC values, emphasizing the relationship between adequate hydration and sustained photosynthetic activity [60]. Similarly, the trends observed in the PRI for drought-resistant genotypes reinforce their consistent RWC values, suggesting that they maintain efficient photosynthesis when well-hydrated. This contrasts with the drought-prone genotypes, whose PRI values, despite initiating slightly higher, show limited adaptability in alignment with their variable RWC. The patterns observed in NDWI, a key indicator of plant moisture [59], further strengthen the insights derived from RWC. Specifically, the superior moisture retention of drought-resistant genotypes is reflected in both their NDWI and RWC measurements. In the context of LWVI1 and LWVI2, both indicative of plant moisture, the trends observed in drought-resistant genotypes align with their RWC patterns, highlighting their ability to manage water resources effectively. In contrast, the varying patterns exhibited by the drought-prone genotypes across these indices highlight their increased sensitivity to water stress. When comparing RWC with the NDVI, PRI, and NDWI, it is evident that while these indices do provide insights into plant health and water status, their ability to capture early signs of water stress is not as pronounced. The higher NDVI values of drought-resistant genotypes, especially in the Post-treatment stage, align with their consistent RWC values, emphasizing the relationship between hydration and photosynthesis. Similarly, the PRI trends for drought-resistant genotypes correlate with their RWC values, suggesting efficient photosynthesis when well-hydrated. However, it is the LWVI1 and LWVI2 that appear to offer a more refined lens to discern between drought-resistant and drought-prone genotypes across both water scenarios. These indices, being direct measures of plant moisture content, seem adept at capturing subtle differences in response to water stress, aligning well with RWC patterns.
To truly discern the nuances and effectiveness of each index, an analysis of the individual genotypes is necessary.

5.3. Genotypic Responses across Different Drought Stages

Figure 8, Figure 9 and Figure 10 illustrate the spectral indices across three treatment stages for each genotype in the wheat diversity panel investigation. Upon examination of the spectral indices, several genotypes, namely COLOSSEO, VALNOVA, and GEZIRA 17, stood out for their ability to maintain similar spectral values under both well-watered (WW) and water-limited (WL) conditions. Specifically, COLOSSEO exhibited strong resistance, with its WL NDVI, PRI, and LWVI values closely mirroring those under WW conditions across all stages. Both VALNOVA and GEZIRA 17, designated as resistant in 2019, further validated this classification with their indices, suggesting minimal stress impact under WL conditions.
Conversely, genotypes like BOLENGA, STOJOCRI_3, and AINZEN_1 delineate a distinct narrative, in contrast to the previously discussed resistant genotypes. During the Pre stage, which precedes the induction of water stress, these specific genotypes began to exhibit early signs of vulnerability. Their spectral indices at this initial phase already showed disparities between the WW and WL conditions, indicating an inherent susceptibility to stress. Transitioning to the Mid stage, following the onset of water stress, these disparities became more pronounced. The increasing divergence between their WW and WL indices not only reflects their sensitivity to drought but also suggests that these genotypes face significant challenges in maintaining optimal physiological functions under water-limited conditions. By the Post stage, these genotypes still demonstrated pronounced disparities in their spectral indices between WW and WL conditions. Such consistent variations further validate their classification as susceptible.
The NDVI, being a widely recognized index for vegetation health, proved to be a reliable indicator of drought resistance [61]. However, LWVI, particularly LWVI2, emerged as a potentially better predictor for early water stress. Genotypes with reduced LWVI2 values under WL conditions in the Pre stage often showed susceptibility in subsequent stages, emphasizing the index’s utility in early drought detection. There were instances where the spectral indices did not entirely align with the 2019 drought resistance classifications. For instance, OMRABI 3, classified as susceptible in 2019, displayed indices more characteristic of a drought-resistant genotype. Such discrepancies highlight the complexities of drought resistance and the potential influence of other environmental or genetic factors [62].

6. Conclusions

The comprehensive analysis in this study offers insights into drought resistance among wheat genotypes, using spectral indices to understand physiological responses to water stress. Key findings include:
  • NDVI is effective for assessing plant health, but LWVI, especially LWVI2, is more sensitive to early water stress, making it ideal for early-stage drought-stress analysis.
  • Early signs of water stress, noticeable in declines in NDWI and LWVI indices even in well-watered conditions, can predict genotypes’ late-season drought tolerance.
  • Comparisons of spectral data from hyperspectral sensors with ground truth measurements identified distinct spectral signatures of varying water-stress levels, enhancing understanding of genotypic drought resistance or susceptibility.
  • LWVI2, in conjunction with ground truth RWC data, emerged as the most reliable method for evaluating drought tolerance, aligning well with physiological responses, and effectively distinguishing between drought-resistant and drought-prone genotypes.
  • Hyperspectral imaging’s effectiveness in capturing spatial and temporal variability in drought response confirms its potential for the early detection and management of drought stress in agriculture.
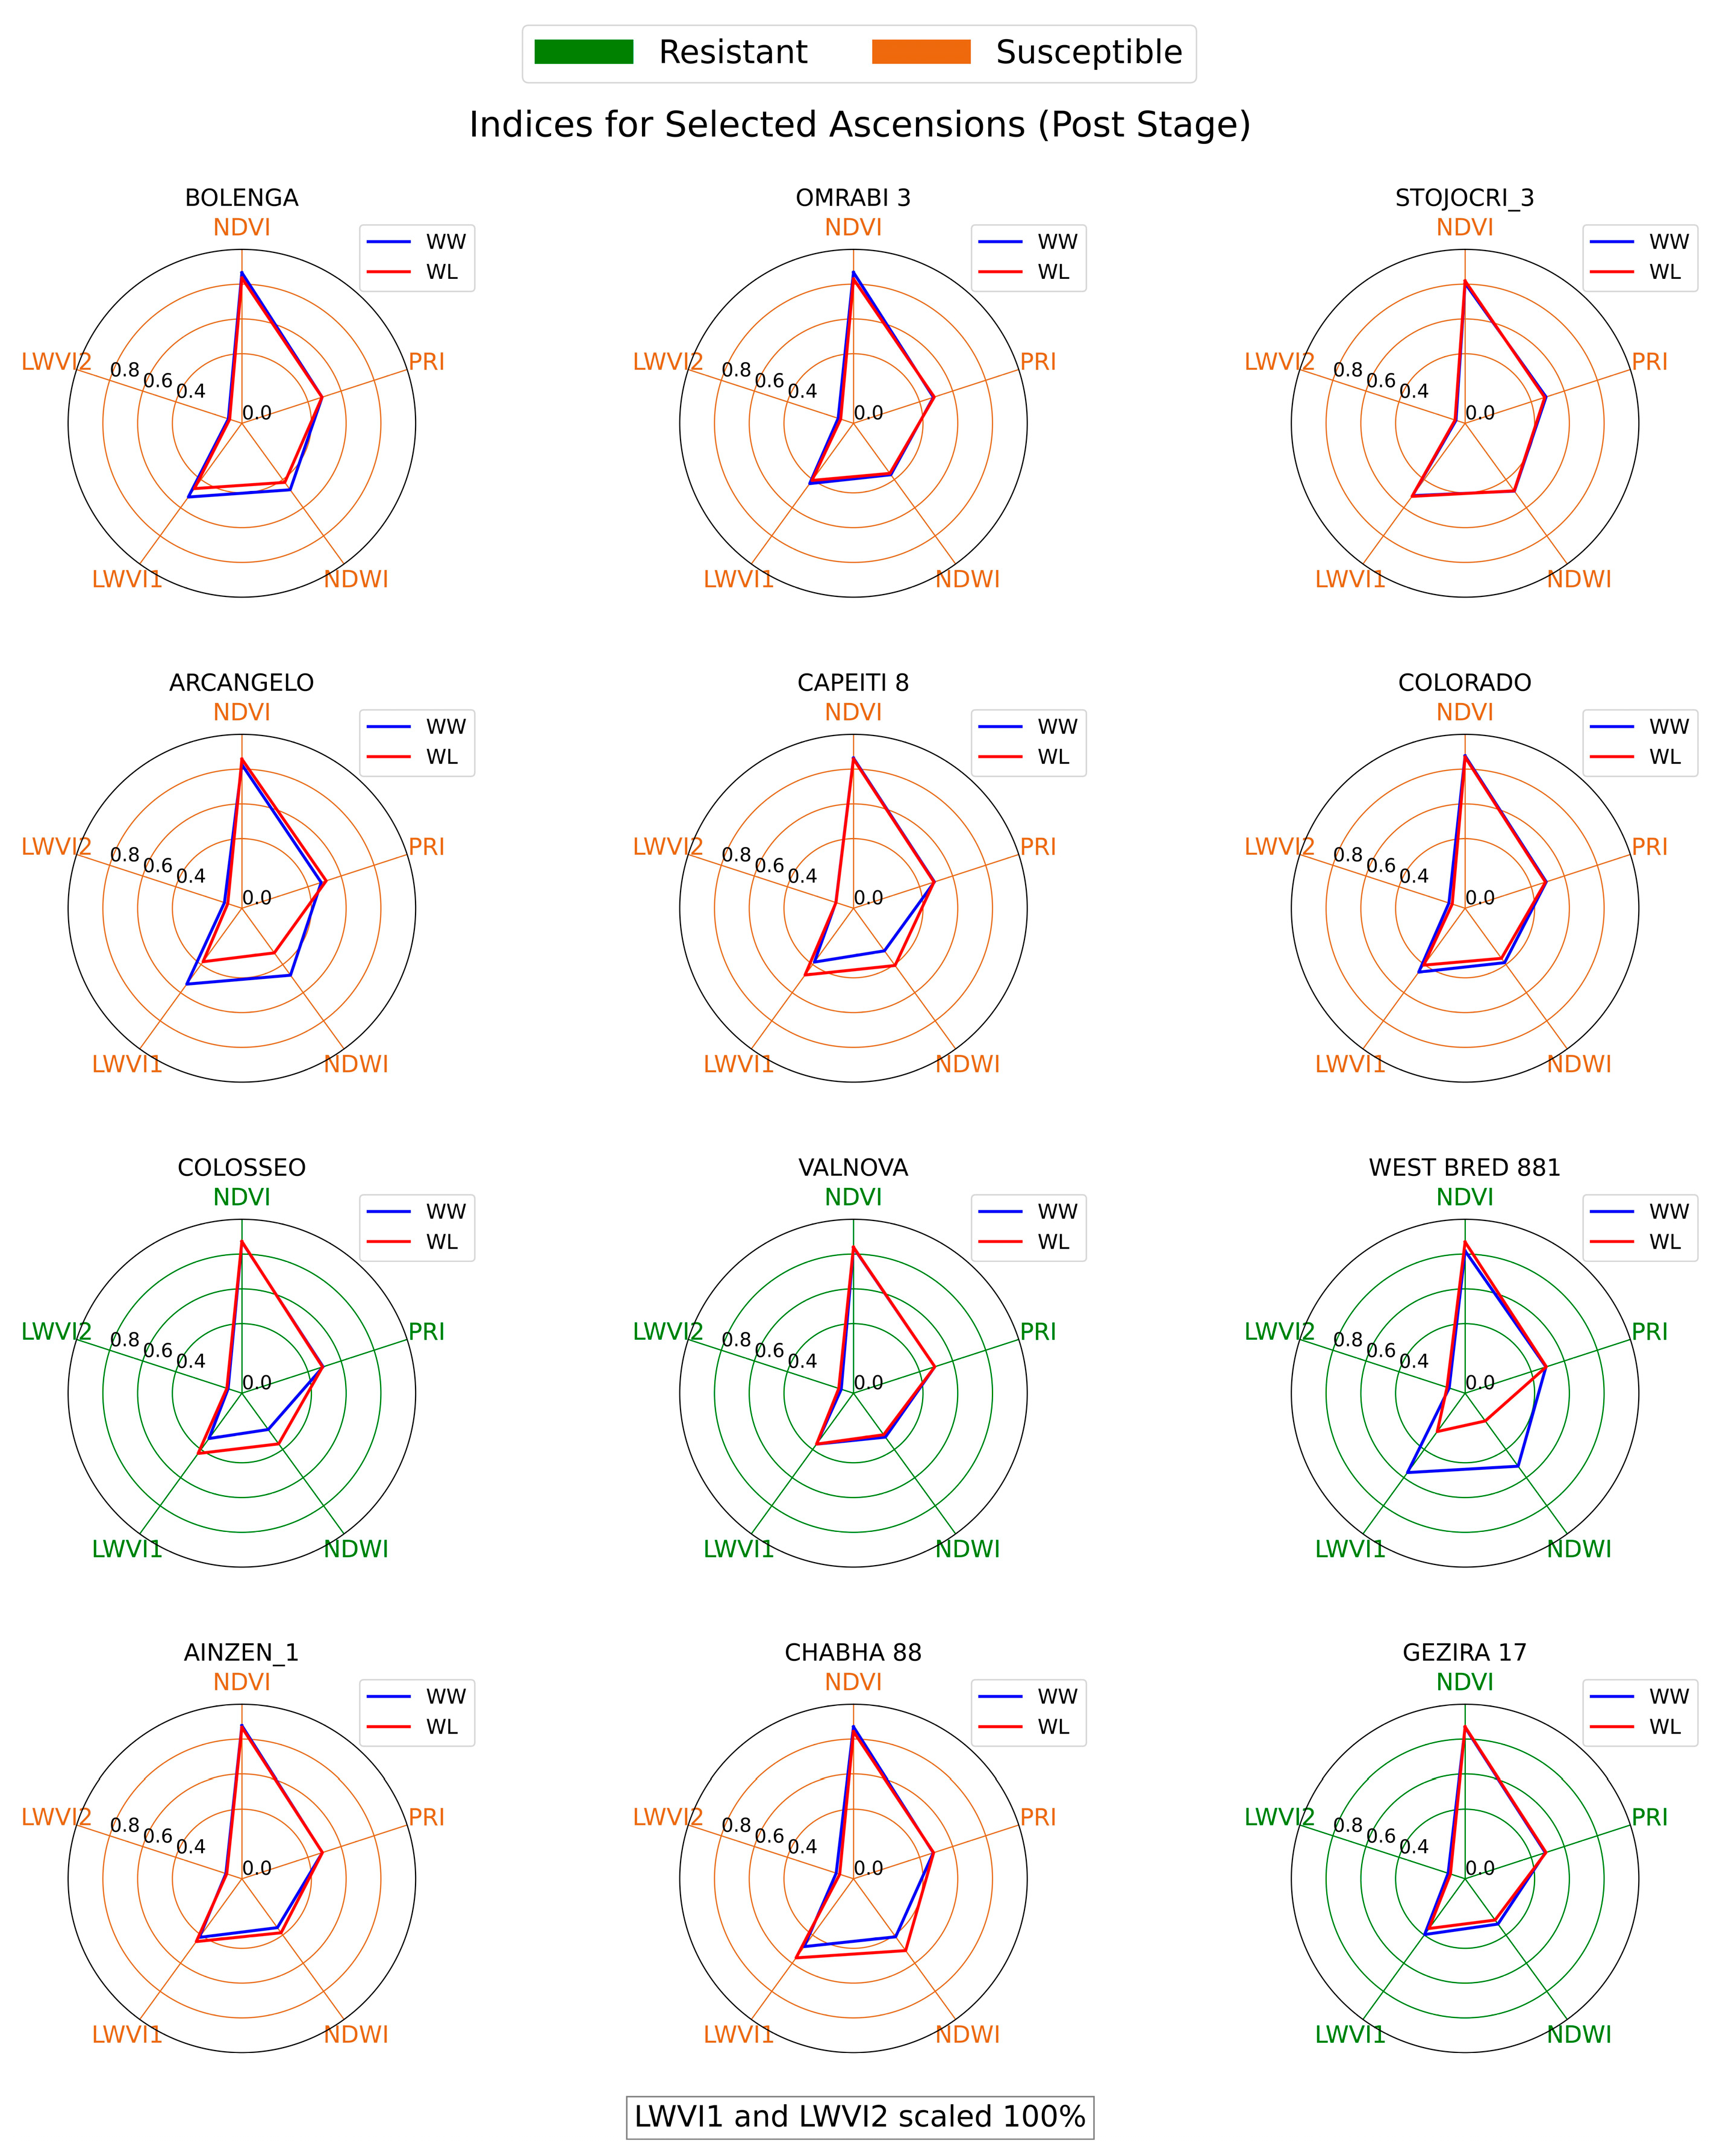
  • Genotypes like COLOSSEO, VALNOVA, and GEZIRA 17 demonstrated strong drought resistance, with their spectral indices under water-limited conditions closely resembling those in well-watered conditions, indicating robust drought tolerance.
These findings support a practical approach for early drought-stress detection, crucial for timely interventions and ensuring food security amid increasing climate challenges.

Author Contributions

Conceptualization, V.S., R.T., M.N. and N.S.; methodology, B.R., A.H. and V.S.; software, B.R. and A.H.; validation, A.H., B.R., M.N. and D.L.; formal analysis, B.R.; investigation, V.S.; resources, V.S.; data curation, B.R. and A.H.; writing—original draft preparation, B.R.; writing—review and editing, V.S., A.H., M.N., R.T., D.L. and N.S.; visualization, B.R.; supervision, V.S.; project administration, V.S., M.N. and D.L.; funding acquisition, N.S., D.L. and V.S. All authors have read and agreed to the published version of the manuscript.

Funding

This research was funded by the Advanced Research Projects Agency-Energy (ARPA-E) within the U.S. Department of Energy, under Award Number DE-AR0000594, NSF/USDA award under Grant Number: 2020-67021-31530, and the U.S. Geological Survey under Grant/Cooperative Agreement No. G23AP00683 (GY23-GY27).

Data Availability Statement

All the data are available at https://terraref.org (accessed on 22 November 2023).

Acknowledgments

The authors thank the members of the Remote Sensing Lab at Saint Louis University and the Maricopa Agricultural Research Center at the University of Arizona for providing data collection, curation, and analytics support.

Conflicts of Interest

The authors declare no conflicts of interest.

References

  1. Zhai, S.; Song, G.; Qin, Y.; Ye, X.; Lee, J. Modeling the Impacts of Climate Change and Technical Progress on the Wheat Yield in Inland China: An Autoregressive Distributed Lag Approach. PLoS ONE 2017, 12, e0184474. [Google Scholar] [CrossRef] [PubMed]
  2. Kusunose, Y.; Rossi, J.J.; Van Sanford, D.A.; Alderman, P.D.; Anderson, J.A.; Chai, Y.; Gerullis, M.K.; Jagadish, S.V.K.; Paul, P.A.; Tack, J.B.; et al. Sustaining productivity gains in the face of climate change: A research agenda for US wheat. Glob. Change Biol. 2022, 29, 926–934. [Google Scholar] [CrossRef] [PubMed]
  3. Bronson, K.F.; White, J.W.; Conley, M.M.; Hunsaker, D.J.; Thorp, K.R.; French, A.N.; Mackey, B.E.; Holland, K.H. Active Optical Sensors in Irrigated Durum Wheat: Nitrogen and Water Effects. Agron. J. 2017, 109, 1060–1071. [Google Scholar] [CrossRef]
  4. U.S. Department of Agriculture. Small Grains Annual Summary; USDA Economics, Statistics and Market Information System: Washington, DC, USA, 2022. [Google Scholar]
  5. Porporato, A.; Laio, F.; Ridolfi, L.; Rodriguez-Iturbe, I. Plants in water-controlled ecosystems: Active role in hydrologic processes and response to water stress: III. Vegetation water stress. Adv. Water Resour. 2001, 24, 725–744. [Google Scholar] [CrossRef]
  6. Hsiao, T.C.; Fereres, E.; Acevedo, E.; Henderson, D.W. Water Stress and Dynamics of Growth and Yield of Crop Plants. In Water and Plant Life: Problems and Modern Approaches; Lange, O.L., Kappen, L., Schulze, E.D., Eds.; Springer Berlin Heidelberg: Berlin/Heidelberg, Germany, 1976; pp. 281–305. [Google Scholar]
  7. Chaves, M.M.; Pereira, J.S.; Maroco, J.; Rodrigues, M.L.; Ricardo, C.P.P.; OsÓRio, M.L.; Carvalho, I.; Faria, T.; Pinheiro, C. How Plants Cope with Water Stress in the Field? Photosynthesis and Growth. Ann. Bot. 2002, 89, 907–916. [Google Scholar] [CrossRef] [PubMed]
  8. Sallam, A.; Alqudah, A.M.; Dawood, M.G.; Baenziger, P.S.; Börner, A. Drought Stress Tolerance in Wheat and Barley: Advances in Physiology, Breeding and Genetics Research. Int. J. Mol. Sci. 2019, 20, 3137. [Google Scholar] [CrossRef] [PubMed]
  9. Sall, A.A.; Chiari, T.; Legesse, W.; Seid-Ahmed, K.; Ortiz, R.; Ginkel, M.V.; Bassi, F.M. Durum Wheat (Triticum Durum Desf.): Origin, Cultivation and Potential Expansion in Sub-Saharan Africa. Agronomy 2019, 9, 263. [Google Scholar] [CrossRef]
  10. Hebrard, A.; Oulahna, D.; Galet, L.; Cuq, B.; Abecassis, J.; Fages, J. Hydration Properties of Durum Wheat Semolina: Influence of Particle Size and Temperature. Powder Technol. 2003, 130, 211–218. [Google Scholar] [CrossRef]
  11. Liu, H.; Searle, I.R.; Mather, D.E.; Able, A.J.; Able, J.A. Morphological, Physiological and Yield Responses of Durum Wheat to Pre-Anthesis Water-Deficit Stress Are Genotype-Dependent. Crop Pasture Sci. 2015, 66, 1024–1038. [Google Scholar] [CrossRef]
  12. Pascale, S.D.; Costa, L.; Vallone, S.; Barbieri, G.; Maggio, A. Increasing Water Use Efficiency in Vegetable Crop Production: From Plant to Irrigation Systems Efficiency. Horttechnology 2011, 21, 301–308. [Google Scholar] [CrossRef]
  13. Jones, H.G.; Vaughan, R.A. Remote Sensing of Vegetation: Principles, Techniques, and Applications, 1st ed.; Oxford University Press: Oxford, UK; New York, NY, USA, 2010. [Google Scholar]
  14. Blackburn, G.L. Hyperspectral Remote Sensing of Plant Pigments. J. Exp. Bot. 2006, 58, 855–867. [Google Scholar] [CrossRef] [PubMed]
  15. Im, J.; Jensen, J.T. Hyperspectral Remote Sensing of Vegetation. Geogr. Compass 2008, 2, 1943–1961. [Google Scholar] [CrossRef]
  16. Wong, C.Y.S.; Gilbert, M.J.; Pierce, M.A.; Parker, T.; Palkovic, A.; Gepts, P.; Magney, T.S.; Buckley, T.N. Hyperspectral Remote Sensing for Phenotyping the Physiological Drought Response of Common and Tepary Bean. Plant Phenomics 2023, 16, 0021. [Google Scholar] [CrossRef] [PubMed]
  17. Mertens, S.; Verbraeken, L.; Sprenger, H.; Demuynck, K.; Maleux, K.; Cannoot, B.; Block, J.D.; Maere, S.; Nelissen, H.; Bonaventure, G.; et al. Proximal Hyperspectral Imaging Detects Diurnal and Drought-Induced Changes in Maize Physiology. Front. Plant Sci. 2021, 12, 640914. [Google Scholar] [CrossRef] [PubMed]
  18. Liu, S.; Li, H.; Wang, X.F.; Liu, C.T.; Wang, Y.; Huang, P.M. A Hyperspectral Remote Sensing Fusion Technology Based on Spectral Normalization of Gf and Zy Series Satellites. Int. Arch. Photogramm. Remote Sens. Spat. Inf. Sci. 2022, 43, 509–514. [Google Scholar] [CrossRef]
  19. Xu, N.X.; Tian, J.; Tian, Q.J.; Xu, K.J.; Tang, S.F. Analysis of Vegetation Red Edge with Different Illuminated/Shaded Canopy Proportions and to Construct Normalized Difference Canopy Shadow Index. Remote Sens. 2019, 11, 1192. [Google Scholar] [CrossRef]
  20. Loggenberg, K.; Strever, A.; Greyling, B.; Poona, N. Modelling Water Stress in a Shiraz Vineyard Using Hyperspectral Imaging and Machine Learning. Remote Sens. 2018, 10, 202. [Google Scholar] [CrossRef]
  21. Maimaitiyiming, M.; Ghulam, A.; Bozzolo, A.; Wilkins, J.L.; Kwasniewski, M.T. Early Detection of Plant Physiological Responses to Different Levels of Water Stress Using Reflectance Spectroscopy. Remote Sens. 2017, 9, 745. [Google Scholar] [CrossRef]
  22. Zarco-Tejada, P.J.; Rueda, C.A.; Ustin, S.L. Water content estimation in vegetation with MODIS reflectance data and model inversion methods. Remote Sens. Environ. 2003, 85, 109–124. [Google Scholar] [CrossRef]
  23. Feret, J.B.; Francois, C.; Gitelson, A.; Asner, G.P.; Barry, K.M.; Panigada, C.; Richardson, A.D.; Jacquemoud, S. Optimizing spectral indices and chemometric analysis of leaf chemical properties using radiative transfer modeling. Remote Sens. Environ. 2011, 115, 2742–2750. [Google Scholar] [CrossRef]
  24. Stimson, H.C.; Breshears, D.D.; Ustin, S.L.; Kefauver, S.C. Spectral sensing of foliar water conditions in two co-occurring conifer species: Pinus edulis and Juniperus monosperma. Remote Sens. Environ. 2005, 96, 108–118. [Google Scholar] [CrossRef]
  25. Imanishi, J.; Sugimoto, K.; Morimoto, Y. Detecting drought status and LAI of two Quercus species canopies using derivative spectra. Comput. Electron. Agric. 2004, 43, 109–129. [Google Scholar] [CrossRef]
  26. Elvanidi, A.; Katsoulas, N.; Ferentinos, K.P.; Bartzanas, T.; Kittas, C. Hyperspectral machine vision as a tool for water stress severity assessment in soilless tomato crop. Biosyst. Eng. 2018, 165, 25–35. [Google Scholar] [CrossRef]
  27. Krishna, G.; Sahoo, R.N.; Singh, P.; Bajpai, V.; Patra, H.; Kumar, S.; Dandapani, R.; Gupta, V.K.; Viswanathan, C.; Ahmad, T.; et al. Comparison of various modelling approaches for water deficit stress monitoring in rice crop through hyperspectral remote sensing. Agric. Water Manag. 2019, 213, 231–244. [Google Scholar] [CrossRef]
  28. Gerhards, M.; Schlerf, M.; Mallick, K.; Udelhoven, T. Challenges and Future Perspectives of Multi-/Hyperspectral Thermal Infrared Remote Sensing for Crop Water-Stress Detection: A Review. Remote Sens. 2019, 11, 1240. [Google Scholar] [CrossRef]
  29. Kyratzis, A.C.; Skarlatos, D.P.; Menexes, G.C.; Vamvakousis, V.F.; Katsiotis, A. Assessment of Vegetation Indices Derived by UAV Imagery for Durum Wheat Phenotyping under a Water Limited and Heat Stressed Mediterranean Environment. Front. Plant Sci. 2017, 8, 1114. [Google Scholar] [CrossRef] [PubMed]
  30. Boulet, G.; Mougenot, B.; Lhomme, J.P.; Fanise, P.; Lili-Chabaane, Z.; Olioso, A.; Bahir, M.; Rivalland, V.; Jarlan, L.; Merlin, O.; et al. The SPARSE model for the prediction of water stress and evapotranspiration components from thermal infra-red data and its evaluation over irrigated and rainfed wheat. Hydrol. Earth Syst. Sci. 2015, 19, 4653–4672. [Google Scholar] [CrossRef]
  31. Jackson, R.D.; Reginato, R.J.; Idso, S.B. Wheat canopy temperature: A practical tool for evaluating water requirements. Water Resour. Res. 1977, 13, 651–656. [Google Scholar] [CrossRef]
  32. Becker, E.; Schmidhalter, U. Evaluation of Yield and Drought Using Active and Passive Spectral Sensing Systems at the Reproductive Stage in Wheat. Front. Plant Sci. 2017, 8, 379. [Google Scholar] [CrossRef]
  33. Gao, Y.; Walker, J.P.; Allahmoradi, M.; Monerris, A.; Ryu, D.; Jackson, T.J. Optical Sensing of Vegetation Water Content: A Synthesis Study. IEEE J. Sel. Top. Appl. Earth Obs. Remote Sens. 2015, 8, 1456–1464. [Google Scholar] [CrossRef]
  34. Sow, M.; Mbow, C.; Hély, C.; Fensholt, R.; Sambou, B. Estimation of Herbaceous Fuel Moisture Content Using Vegetation Indices and Land Surface Temperature From MODIS Data. Remote Sens. 2013, 5, 2617–2638. [Google Scholar] [CrossRef]
  35. Ghulam, A.; Li, Z.-L.; Qin, Q.; Tong, Q.; Wang, J.; Kasimu, A.; Zhu, L. A Method for Canopy Water Content Estimation for Highly Vegetated Surfaces-Shortwave Infrared Perpendicular Water Stress Index. Sci. China Earth Sci. 2007, 50, 1359–1368. [Google Scholar] [CrossRef]
  36. van Eeuwijk, F.A.; Bustos-Korts, D.; Millet, E.J.; Boer, M.P.; Kruijer, W.; Thompson, A.; Malosetti, M.; Iwata, H.; Quiroz, R.; Kuppe, C.; et al. Modelling strategies for assessing and increasing the effectiveness of new phenotyping techniques in plant breeding. Plant Sci. 2019, 282, 23–39. [Google Scholar] [CrossRef] [PubMed]
  37. Araus, J.L.; Kefauver, S.C.; Zaman-Allah, M.; Olsen, M.S.; Cairns, J.E. Translating High-Throughput Phenotyping into Genetic Gain. Trends Plant Sci. 2018, 23, 451–466. [Google Scholar] [CrossRef] [PubMed]
  38. Fu, P.; Meacham-Hensold, K.; Guan, K.Y.; Bernacchi, C.J. Hyperspectral Leaf Reflectance as Proxy for Photosynthetic Capacities: An Ensemble Approach Based on Multiple Machine Learning Algorithms. Front. Plant Sci. 2019, 10, 730. [Google Scholar] [CrossRef] [PubMed]
  39. TERRA-REF Sensing Platforms. Available online: https://terraref.org/data/sensing-components (accessed on 13 September 2023).
  40. Sagan, V.; Maimaitijiang, M.; Paheding, S.; Bhadra, S.; Gosselin, N.; Burnette, M.; Demieville, J.; Hartling, S.; LeBauer, D.; Newcomb, M.; et al. Data-Driven Artificial Intelligence for Calibration of Hyperspectral Big Data. IEEE Trans. Geosci. Remote Sens. 2022, 60, 1–20. [Google Scholar] [CrossRef]
  41. Burnette, M.; Kooper, R.; Maloney, J.D.; Rohde, G.S.; Terstriep, J.A.; Willis, C.; Fahlgren, N.; Mockler, T.; Newcomb, M.; Sagan, V.; et al. TERRA-REF Data Processing Infrastructure. In Proceedings of the Practice and Experience on Advanced Research Computing, Pittsburgh, PA, USA, 22–26 July 2018; p. 27. [Google Scholar]
  42. Condorelli, G.E.; Newcomb, M.; Groli, E.L.; Maccaferri, M.; Forestan, C.; Babaeian, E.; Tuller, M.; White, J.W.; Ward, R.; Mockler, T.; et al. Genome Wide Association Study Uncovers the QTLome for Osmotic Adjustment and Related Drought Adaptive Traits in Durum Wheat. Genes 2022, 13, 293. [Google Scholar] [CrossRef] [PubMed]
  43. LeBauer, D.; Burnette, M.; Demieville, J.; Fahlgren, N.; French, A.N.; Garnett, R.; Hu, Z.; Huynh, K.; Kooper, R.; Li, Z.; et al. TERRA-REF, An Open Reference Data Set from High Resolution Genomics, Phenomics, and Imaging Sensors. 2020. Available online: https://datadryad.org/stash/dataset/doi:10.5061/dryad.4b8gtht99 (accessed on 22 November 2023).
  44. Bernardo, N.; Watanabe, F.; Rodrigues, T.; Alcântara, E. Atmospheric correction issues for retrieving total suspended matter concentrations in inland waters using OLI/Landsat-8 image. Adv. Space Res. 2017, 59, 2335–2348. [Google Scholar] [CrossRef]
  45. Maimaitijiang, M.; Sagan, V.; Bhadra, S.; Nguyen, C.; Mockler, T.C.; Shakoor, N. A fully automated and fast approach for canopy cover estimation using super high-resolution remote sensing imagery. ISPRS Ann. Photogramm. Remote Sens. Spat. Inf. Sci. 2021, V-3-2021, 219–226. [Google Scholar] [CrossRef]
  46. Rouse, J.W.; Haas, R.H.; Schell, J.A.; Deering, D.W. Monitoring vegetation systems in the Great Plains with ERTS. NASA Spec. Publ. 1974, 351, 309. [Google Scholar]
  47. Maimaitiyiming, M.; Miller, A.J.; Ghulam, A. Discriminating Spectral Signatures Among and Within Two Closely Related Grapevine Species. Photogramm. Eng. Remote Sens. 2016, 82, 51–62. [Google Scholar] [CrossRef]
  48. Gao, B.-c. NDWI—A normalized difference water index for remote sensing of vegetation liquid water from space. Remote Sens. Environ. 1996, 58, 257–266. [Google Scholar] [CrossRef]
  49. Galvão, L.S.; Formaggio, A.R.; Tisot, D.A. Discrimination of sugarcane varieties in Southeastern Brazil with EO-1 Hyperion data. Remote Sens. Environ. 2005, 94, 523–534. [Google Scholar] [CrossRef]
  50. Hallett, P.D.; Gordon, D.C.; Bengough, A.G. Plant influence on rhizosphere hydraulic properties: Direct measurements using a miniaturized infiltrometer. New Phytol. 2003, 157, 597–603. [Google Scholar] [CrossRef] [PubMed]
  51. Abid, M.; Ali, S.; Qi, L.K.; Zahoor, R.; Tian, Z.; Jiang, D.; Snider, J.L.; Dai, T. Physiological and biochemical changes during drought and recovery periods at tillering and jointing stages in wheat (Triticum aestivum L.). Sci. Rep. 2018, 8, 4615. [Google Scholar] [CrossRef] [PubMed]
  52. Guizani, A.; Askri, H.; Amenta, M.L.; Defez, R.; Babay, E.; Bianco, C.; Rapaná, N.; Finetti-Sialer, M.; Gharbi, F. Drought responsiveness in six wheat genotypes: Identification of stress resistance indicators. Front. Plant Sci. 2023, 14, 1232583. [Google Scholar] [CrossRef] [PubMed]
  53. Ali, I.; Anwar, S.; Ali, A.; Ullah, Z.; Binjawhar, D.N.; Sher, H.; Abdel-Hameed, U.K.; Khan, M.A.; Majeed, K.; Jaremko, M. Biochemical and phenological characterization of diverse wheats and their association with drought tolerance genes. BMC Plant Biol. 2023, 23, 326. [Google Scholar] [CrossRef]
  54. Islam, M.A.; Shorna, M.N.A.; Islam, S.; Biswas, S.; Biswas, J.; Islam, S.; Dutta, A.K.; Uddin, M.S.; Zaman, S.; Akhtar-E-Ekram, M.; et al. Hydrogen-rich water: A key player in boosting wheat (Triticum aestivum L.) seedling growth and drought resilience. Sci. Rep. 2023, 13, 22521. [Google Scholar] [CrossRef]
  55. Faghani, E.; Gharechahi, J.; Komatsu, S.; Mirzaei, M.; Khavarinejad, R.A.; Najafi, F.; Farsad, L.K.; Salekdeh, G.H. Comparative physiology and proteomic analysis of two wheat genotypes contrasting in drought tolerance. J. Proteom. 2015, 114, 1–15. [Google Scholar] [CrossRef]
  56. Elhag, M.; Bahrawi, J.A. Soil salinity mapping and hydrological drought indices assessment in arid environments based on remote sensing techniques. Geosci. Instrum. Methods Data Syst. 2017, 6, 149–158. [Google Scholar] [CrossRef]
  57. Li, M.; Chu, R.H.; Yu, Q.; Islam, A.M.T.; Chou, S.R.; Shen, S.H. Evaluating Structural, Chlorophyll-Based and Photochemical Indices to Detect Summer Maize Responses to Continuous Water Stress. Water 2018, 10, 500. [Google Scholar] [CrossRef]
  58. D’Odorico, P.; Schönbeck, L.; Vitali, V.; Meusburger, K.; Schaub, M.; Ginzler, C.; Zweifel, R.; Velasco, V.M.E.; Gisler, J.; Gessler, A.; et al. Drone-based physiological index reveals long-term acclimation and drought stress responses in trees. Plant Cell Environ. 2021, 44, 3552–3570. [Google Scholar] [CrossRef] [PubMed]
  59. Gu, Y.; Brown, J.F.; Verdin, J.P.; Wardlow, B. A five-year analysis of MODIS NDVI and NDWI for grassland drought assessment over the central Great Plains of the United States. Geophys. Res. Lett. 2007, 34. [Google Scholar] [CrossRef]
  60. Sarlikioti, V.; Driever, S.M.; Marcelis, L.F.M. Photochemical reflectance index as a mean of monitoring early water stress. Ann. Appl. Biol. 2010, 157, 81–89. [Google Scholar] [CrossRef]
  61. Vélez, S.; Martínez-Peña, R.; Castrillo, D. Beyond Vegetation: A Review Unveiling Additional Insights into Agriculture and Forestry through the Application of Vegetation Indices. Multidiscip. Sci. J. 2023, 6, 421–436. [Google Scholar] [CrossRef]
  62. Yue, B.; Xue, W.; Xiong, L.; Yu, X.; Luo, L.; Cui, K.; Jin, D.; Xing, Y.; Zhang, Q. Genetic Basis of Drought Resistance at Reproductive Stage in Rice: Separation of Drought Tolerance from Drought Avoidance. Genetics 2006, 172, 1213–1228. [Google Scholar] [CrossRef]
Figure 1. Location of the study area and experimental setup. (a) Geographic location of the study area; (b) Location of the two test fields; (c) Field setup (one replicate); (d) The gantry hyperspectral system; (e) Durum wheat field before planting; (f) Durum wheat field during experiment and (g) Sensor positioning inside camera box.
Remotesensing 16 00155 g001
Figure 2. Field map showing the distribution of different genotypes and water treatments.
Remotesensing 16 00155 g002
Figure 3. Data Processing Workflow.
Remotesensing 16 00155 g003
Figure 4. Mean vegetation spectra of plants from two different treatments in three stages: Pre-stress stage (28 February); Mid-stress stage (22–23 March); and Post-stress stage (7–8 April). The blue, green, red, and NIR regions are delineated with corresponding colors, and a dotted line distinguishes between the VNIR and SWIR ranges.
Remotesensing 16 00155 g004
Figure 5. Relative water content of well-watered and water-limited plants in Early-stress (11 days after stress began), Mid-stress (20 days after stress began), and Post-treatment stages (33 days after stress began). Data points outside the whiskers, marked as dots, are considered outliers.
Remotesensing 16 00155 g005
Figure 6. Standard distribution curves for all development stages. The dotted lines represent mean value for each distribution.
Remotesensing 16 00155 g006
Figure 7. Results for different vegetation and water indices for drought-resistant and drought Susceptible plants.
Remotesensing 16 00155 g007
Figure 8. Radial chart of spectral indices for wheat genotypes at Pre stage.
Remotesensing 16 00155 g008
Figure 9. Radial chart of spectral indices for wheat genotypes at the Mid-stress stage.
Remotesensing 16 00155 g009
Figure 10. Radial chart of spectral indices for wheat genotypes at the Post-treatment stage.
Remotesensing 16 00155 g010
Table 1. Description of Sensors used for data collection.
TypeSensorFeatures
HyperspectralHeadwall VNIRSpectral Range: 380–1000 nm
Spatial Resolution: 0.66 nm
Headwall SWIRSpectral Range: 950–2500 nm
Spatial Resolution: 5.8 nm
Fluorescence
Intensity
LemnaTec PSII
(Manta G-235b)
Camera Resolution: 1936 × 1216
Center Wavelength: 710 nm
MoistureAcclima TDR-310H (SDI-12)Incident Wave Amplitude: 400 mV
Volumetric Water Content: 0% to 100%
Table 2. Data acquisition timeline (2019).
SensorsRemote SensingProximal Sensors
Hyperspectral ImagesRWC
StagesPre-Stress28 February (Both)-
Early Drought-17 March (Both)
Mid Drought22 March (Rep 1)
23 March (Rep 2)
26 March (Both)
Post Treatment7 April (Rep 1)
8 April (Rep 2)
7 April (Rep 1)
8 April (Rep 2)
Table 3. Description of the selected genotypes.
GenotypeOriginPlot ID (in Field)Drought Resistance (2019)
BOLENGAIRTA-SPAINDP_033Susceptible
OMRABI 3ICARDADP_070Susceptible
STOJOCRI_3ICARDADP_074Susceptible
ARCANGELOITALYDP_079Susceptible
CAPEITI 8ITALYDP_083Susceptible
COLORADODESERTDP_086Susceptible
COLOSSEOITALYDP_087Resistant
VALNOVAITALYDP_114Resistant
WEST BRED 881DESERTDP_116Resistant
AINZEN_1ICARDADP_119Susceptible
CHABHA 88ICARDADP_135Susceptible
GEZIRA 17ICARDADP_140Resistant
Table 4. Spectral Indices used in this study.
Spectral IndexEquation (in nm)Reference
Normalized Difference Vegetation Index (NDVI)(R750 − R705)/(R750 + R705)[46]
Photochemical Reflective Index (PRI)(R531 − R570)/(R531 + R570)[47]
Normalized Difference Water Index (NDWI)(R864 − R1245)/(R864 + R1245)[48]
Leaf Water Vegetation Index (LWVI-1)(R1094 − R893)/(R1094 + R893)[49]
Leaf Water Vegetation Index (LWVI-2)(R1094 − R1205)/(R1094 + R1205)[49]
Table 5. Comparison of F-statistics and p-values for various tests across different stages.
Test NameEarly StageMid StagePost Stage
F-Statisticsp-ValueF-Statisticsp-ValueF-Statisticsp-Value
O’Brien2.940.0938.59*17.43*
Brown–Forsythe0.230.631.430.239.97*
Levene0.230.631.430.239.97*
Bartlett1.080.301.670.1914.28*
F-Test (ANOVA)2.940.0938.58*17.43*
* 99% Confidence Level (<0.00001).
Table 6. Comparison one-way ANOVA: treatment means and confidence intervals across stages.
StageTreatmentMeanStd ErrorLower 95%Upper 95%
Early StageWW98.100.2797.5398.68
WL97.490.2297.0397.95
Mid StageWW96.900.3096.2597.54
WL93.710.4092.8794.56
Post StageWW96.870.2996.2597.50
WL93.720.6992.2895.15
Table 7. Pooled t-test results across developmental stages.
StageEarly StageMid StagePost Stage
Difference0.613.183.15
Std Error Difference0.350.510.75
Upper CL Diff1.314.184.64
Lower CL Diff−0.082.171.67
Confidence Level0.950.950.95
t-Ratio1.716.214.17
Disclaimer/Publisher’s Note: The statements, opinions and data contained in all publications are solely those of the individual author(s) and contributor(s) and not of MDPI and/or the editor(s). MDPI and/or the editor(s) disclaim responsibility for any injury to people or property resulting from any ideas, methods, instructions or products referred to in the content.

