Abstract
The Global Navigation Satellite System Occultation Sounder II (GNOS-II) payload onboard the Chinese Fengyun-3E (FY-3E) satellite is the world’s first operational spaceborne mission that can utilize reflected signals from multiple navigation systems for Earth remote sensing. The satellite was launched into an 836-km early-morning polar orbit on 5 July 2021. Different GNSS signals show different characteristics in the observations and thus require different calibration methods. With an average data latency of less than 3 h, many near real-time applications are possible. This article first introduces the FY-3E/GNOS-II mission and instrument design, then describes the extensive calibration methods for the multi-GNSS measurements, and finally presents application results in the remote sensing of ocean surface winds, land soil moisture and sea ice extent. Especially, the ocean surface wind product has been used in operational applications such as assimilation in the numerical weather prediction model and monitoring of tropical cyclones. Currently, GNOS-II has been carried by FY-3E, FY-3F (launched in August 2023) and FY-3G (launched in April 2023). It will be also carried by future follow-on FY series and a more complete multi-GNSS reflectometry constellation will be established.
1. Introduction
Fengyun (FY, “Wind and Cloud”) is the name for a series of Chinese operational meteorological satellites operated by the China Meteorological Administration (CMA), launched in 1988 [1,2,3]. The Global Navigation Satellite System Occultation Sounder (GNOS) is a Global Navigation Satellite System (GNSS) radio occultation (RO) sounder manufactured by the National Space Science Center (NSSC), Chinese Academy of Sciences, which can utilize GNSS signals from US GPS and China’s BeiDou [4,5]. NSSC has been collaborating with CMA for more than ten years in the field of GNSS remote sensing, obligated to design the GNSS RO sensors for the FY series. GNOS was carried by the third generation of FY satellites (FY-3) including FY-3C launched in 2013 and FY-3D launched in 2017 [6]. Its product including the profile of atmospheric refractivity, temperature and humidity as well as ionospheric parameters has been used for a large number of scientific studies [7,8,9] and assimilated by operational numerical weather prediction (NWP) systems such as the European Centre for Medium-Range Weather Forecasts (ECMWF) and China’s Global and Regional Assimilation and Prediction System (GRAPES) [10,11].
The GNOS-II is an updated instrument of GNOS. Inheriting previous precise orbit determination (POD) and GNSS RO features, GNOS-II added the new GNSS reflectometry (GNSS-R) capability and upgraded to an integrated GNSS remote sensor [12]. When GNSS RO uses refracted GNSS signals to measure the profile of atmospheric and ionospheric parameters, GNSS-R utilizes reflected GNSS signals to measure geophysical parameters on the Earth’s surface in a multistatic radar configuration [13,14]. With new measurements provided by the GNSS-R, GNOS-II can monitor the Earth’s weather in three dimensions.
GNOS-II was first carried by the FY-3E satellite launched on 5 July 2021 as one of its 11 payloads. As a “big” satellite, FY-3E has better stability in attitude and temperature control than small satellites. FY-3E is also the world’s first early morning polar orbit meteorological satellite [15]. Compared to previous spaceborne GNSS-R missions [16,17,18,19,20,21], there are five major uniquenesses of FY-3E/GNOS-II:
- The instrument combines GNSS RO and GNSS-R techniques.
- It is capable of receiving reflected signals from multiple GNSS systems including GPS, BeiDou (BDS) and Galileo (GAL), which can improve the spatial sampling for the Earth remote sensing.
- The satellite is in a polar orbit, providing measurements over high latitudes including polar regions.
- The average data latency is less than three hours, providing potential for real-time and near real-time operational applications such as assimilation in operational NWP models and monitoring of tropical cyclones.
- The instrument is working together with a scatterometer, WindRad [22], providing opportunities for intercalibration and data fusion.
As follow-on missions, FY-3F and FY-3G satellites (both were launched in 2023 and are in the commissioning phase) also carried the GNOS-II payload.
This article will summarize the FY-3E/GNOS-II GNSS-R mission, present the calibration method, the development of science products and applications over the ocean, land and sea ice from its first 1.5 years of in-orbit data, and provide a summary of the FY-3 GNSS-R constellation.
2. Overview of the GNOS-II Instrument and the FY-3E Mission
Major orbit and instrument parameters of FY-3E/GNOS-II are listed in Table 1. For comparison, the same parameters of the Cyclone GNSS (CYGNSS) mission [23] are listed together. The fundamental measurements, delay-Doppler map (DDM) of GNOS-II has a size with 122 delay bins times 20 Doppler bins. The GNOS-II was designed by an innovative signal processing scheme for spaceborne integrated GNSS remote sensors (SIGRS) which combines a POD, a GNSS RO and a GNSS-R module [12]. A block diagram of the modules is shown in Figure 1. The up-pointed POD antenna, side-pointed RO antennas and the nadir-pointed antenna together with the corresponding signal processing modules cooperate with each other, providing stable navigation, occultation and reflectometry measurements.

Table 1.
Orbit and instrument parameters of FY-3E/GNOS-II and CYGNSS.
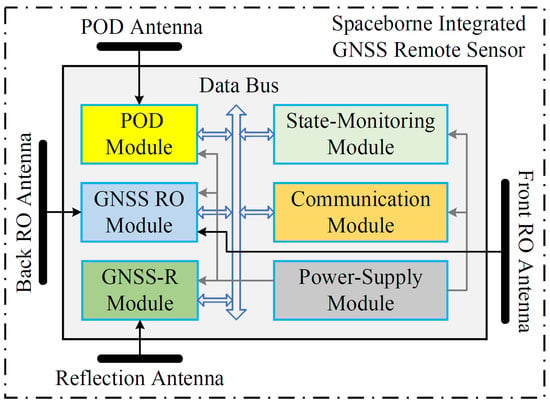
Figure 1.
A block diagram of the Spaceborne Integrated GNSS Remote Sensor (from [12]).
The operational GNSS-R product of FY-3E/GNOS-II includes the Level 1 (L1) data, Level 2 (L2) ocean surface winds, L2 land soil moisture and raw intermediate frequency (IF) data listed in Table 2. A distribution of the data latency of FY-3E/GNOS-II product is shown in Figure 2. Over 75% of the data have a latency of less than 3 h, which meets the requirement of operational use.

Table 2.
GNSS-R product and key variables of FY-3E GNOS-II.
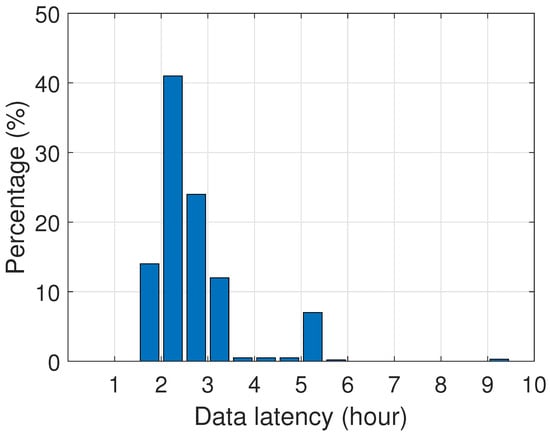
Figure 2.
Distribution of the data latency of FY-3E/GNOS-II product.
Figure 3 shows a timeline of the FY-3E/GNOS-II mission stage. Since its launch in July 2021, it was first in the in-orbit testing phase for the instrument calibration and model training, then turned to the operational testing phase in June 2022 for product evaluation and started the fully operational phase in November 2022. The Level 2 wind product was open to the public on 15 June 2022 and the Level 1 product was open to the public on 15 February 2023. Those data can be downloaded from the FENGYUN Satellite Data Center (http://data.nsmc.org.cn/, accessed on 30 May 2023).
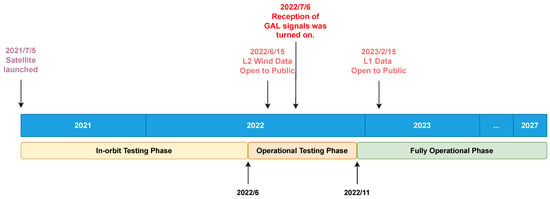
Figure 3.
Timeline of the FY-3E/GNOS-II mission stage.
The reception of GAL signals was first turned off in the first year. After the successful demonstration of GPS and BDS reflections, the reception of GAL signals was turned on on 6 July 2022 [24].
The raw IF data are available by application. It is mainly for scientific research. The receiver adopts an onboard automatic activation mode from which a total of 12 “illumination points” (Figure 4) are pre-configured in the receiver. When the specular point is close to any of them, the receiver will switch to the raw sampling mode and continue for 10 s. Figure 5 shows two DDMs generated from the raw IF data. The signal-to-noise ratio (SNR) is increased from 2.5 dB to 5.2 dB when the coherent integration time is increased from 1 ms to 2 ms.
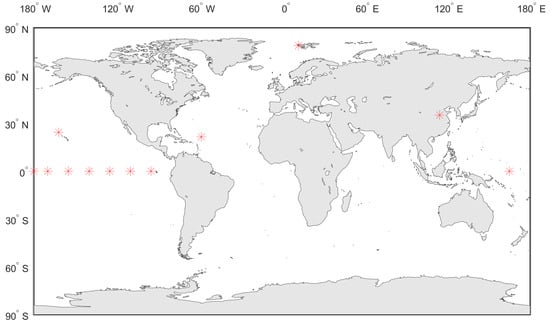
Figure 4.
Illumination points (red asterisks) of FY-3E/GNOS-II for the collection of raw sampling data.
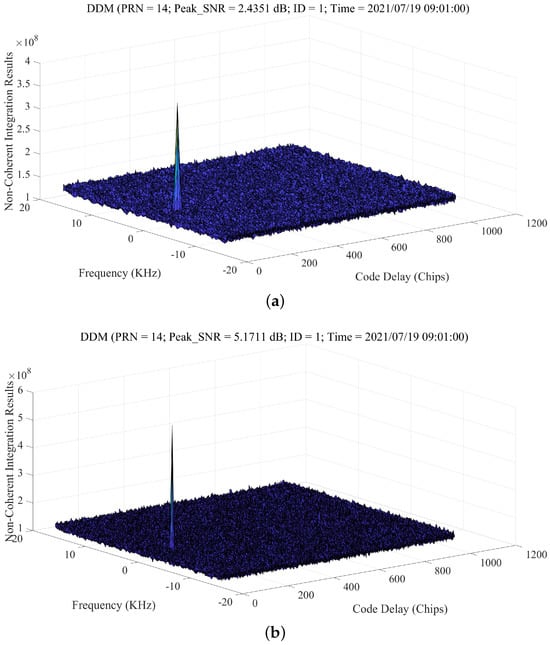
Figure 5.
Two DDMs generated from the raw IF data where the specular point is over land: (a) with a coherent integration time of 1 ms and incoherent integration time of 1 s and (b) with a coherent integration time of 2 ms and incoherent integration time of 1 s.
3. Calibration and Intercalibration of Multi-GNSS Reflectometry Data
3.1. Calibration for Each GNSS System over Ocean and Land
In the calibration of GNSS-R measurements, the first step is to calibrate DDM from raw counts to power,
where is the DDM in raw counts after subtracting noise floor, is DDM power and G is the total instrument gain.
When the specular point is over a rough ocean surface or heavily vegetated land, the reflection is mainly incoherent, where the major observable is the normalized bistatic radar cross section (NBRCS),
where is the signal wavelength, is the NBRCS, is the GNSS transmitter EIRP and is the receiver antenna pattern. and are distances from the specular point to the transmitter and receiver, respectively. and are the averaged observed DDM power and effective scattering area (ESA) at the specular point, respectively. On the other hand, if the specular point is over a smooth surface such as bare land, sea ice or inland waterbody, the reflection is dominated by coherent scattering, where the major observable is the reflectivity,
where is the reflectivity and is the DDM peak power.
Since the major observables over ocean and land are the normalized bistatic radar cross section (NBRCS) and reflectivity, respectively, the absolution calibration of measurements is important. This includes the calibration of the instrument gain, transmitter effective isotropic radiated power (EIRP), receiver antenna pattern and ESA. Since the signals of different GNSS systems and also block types within a GNSS system have different characteristics, the measurements of each system are calibrated separately and then intercalibrated [24,25]. The characteristics of signals from each GNSS system are listed in Table 3. The block types of each system are listed in Table 4. Methods for the calibration of each factor are listed in Table 5. It should be mentioned that the shape of DDM from different GNSS signals can be different depending on their chipping rate and modulation. However, it was found that the general calibration method could still be the same. The DDMs from different GNSS signals on FY-3E are shown in Figure 6.

Table 3.
Signal parameters for GPS, BDS and GAL on FY-3E/GNOS-II.

Table 4.
Block types for GPS, BDS and GAL.

Table 5.
Methods for the calibration of different factors.
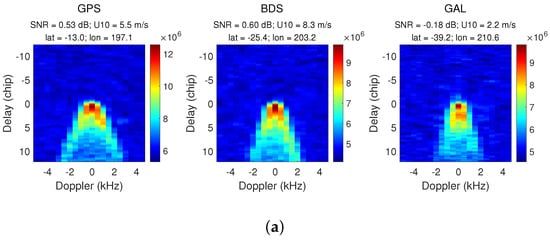
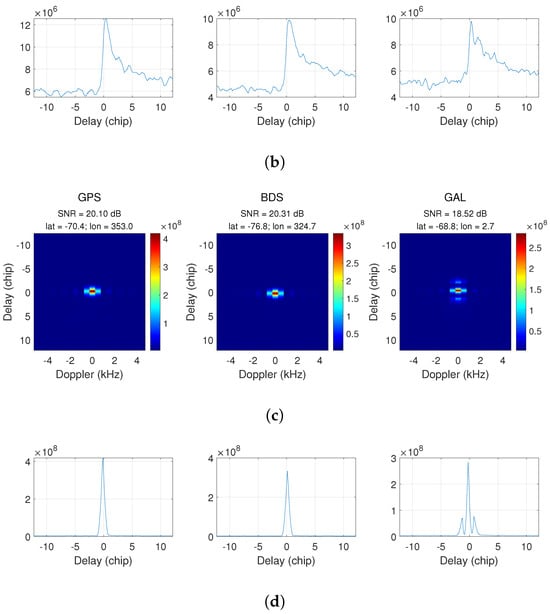
Figure 6.
DDMs and corresponding DMs in raw counts from GPS, BDS and GAL, respectively, over the ocean (a,b) and sea ice (c,d) (From [24]).
The instrument gain was measured by a prelaunch thermal cycling experiment [26]. Figure 7 shows the relationship between the total instrument gain and low-noise amplifier (LNA) temperature of GNOS-II. This method has been validated by in-orbit data and shows satisfactory performance.
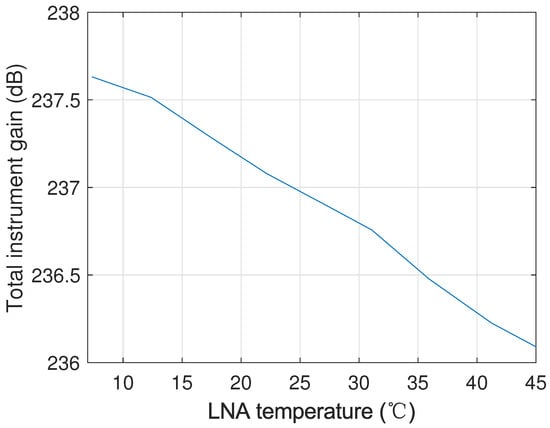
Figure 7.
Relationship between the total instrument gain and LNA temperature of GNOS-II measured by a prelaunch thermal cycling experiment (from [26]).
The receiver antenna pattern was measured in an anechoic chamber before launch. As BDS and GPS/GAL signals are in slightly different frequencies, their antenna patterns are measured separately.
The transmitter EIRP of all satellites from each GNSS system was measured by two static power monitors using the method described in [27]. Figure 8 shows an image of the power monitor. A look-up table (LUT) for the EIRP versus boresight angle with respect to the receiver was constructed for each GNSS satellite. Figure 9 shows the profiles of satellites from each GNSS system, where they are categorized by different block types. Note, that for GPS satellites, their complete profiles cannot be measured by a static power monitor because their overpass with respect to a location is relatively stationary, and thus some extrapolations were applied to generate the complete profile. However, there is no such issue for BDS and GAL. From Figure 9, we can also notice large differences among EIRP profiles from different block types, indicating that the calibration of EIRP for each satellite is extremely important. We also found that two GPS satellites (PRN 10 and 32, the two yellow lines on the top in Figure 9a) from Block II-F have EIRP much larger than the others, implying that they are possibly under the flex power event [28].
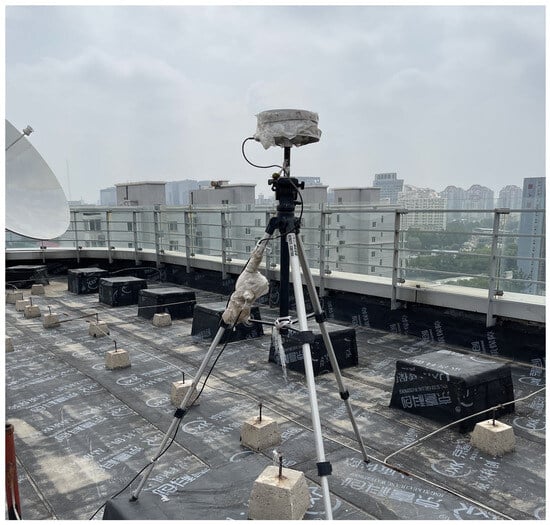
Figure 8.
The GNSS EIRP power monitor on the roof of NSSC building.
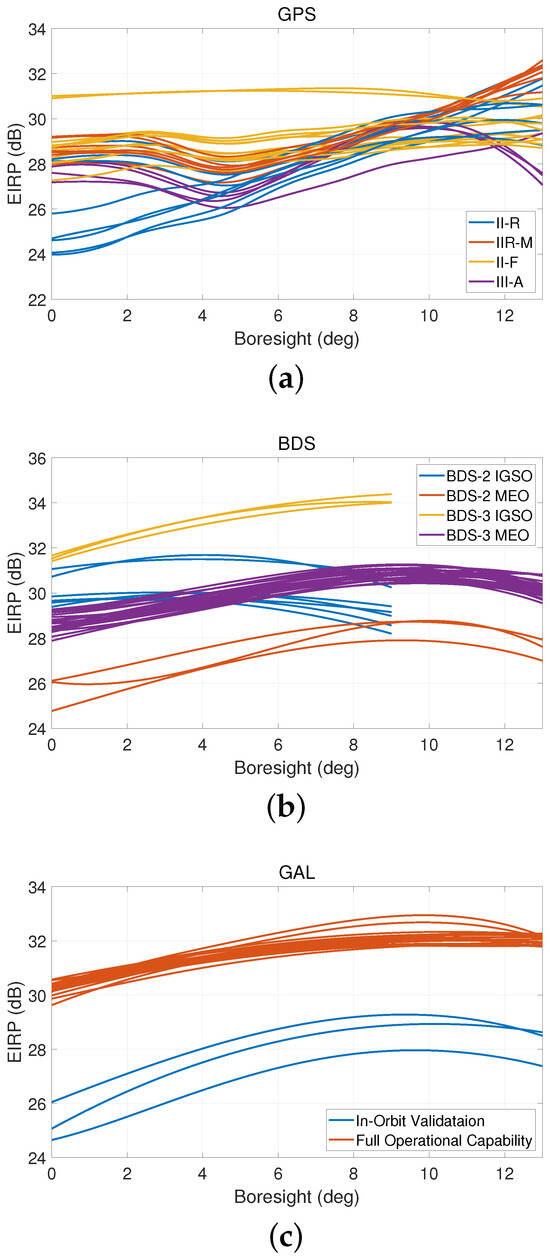
Figure 9.
The EIRP profiles of satellites from each GNSS system: (a) GPS, (b) BDS and (c) GAL. Each line stands for the profile of one satellite. Different color stands for different block types.
The ESA is related to the chipping rate and modulation of GNSS signals and thus is different for each GNSS system [25]. An empirical LUT was simulated and used for the real-time computation. The ESA at the DDM specular bin as a function of incidence angle for different GNSS signals is shown in Figure 10. We can conclude that a high chipping rate (BDS and GAL) results in lower ESA and BOC modulation (GAL) gets lower ESA than BPSK modulation (GPS and BDS).
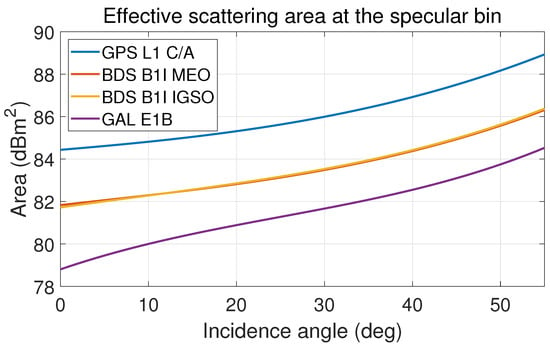
Figure 10.
The ESA at the DDM specular bin as a function of incidence anglefor different GNSS signals.
An additional radio frequency interference (RFI) mitigation method has also been applied to correct the instrument gain to mitigate interference from the ground and Satellite-Based Augmentation Systems (SBAS) [26].
Another difference between different GNSS signals is the spatial resolution. When the reflection is incoherent, the spatial resolution is determined by the Woodward ambiguity function [25], which is related to the chip length and modulation of the GNSS signal. The spatial resolution of each GNSS signal as a function of incidence angle is shown in Figure 11. On the other hand, when the reflection is coherent, the spatial resolution is determined by the first Fresnel Zone [29] which is almost the same for different GNSS signals because they all have similar signal wavelengths. Figure 12 shows the cross-track and parallel-track resolution of each GNSS signal as a function of incidence angle. The parallel-track resolution is much higher than the cross-track resolution because observations are averaged in the 1s incoherent integration which acts like a smearing along the parallel-track direction.
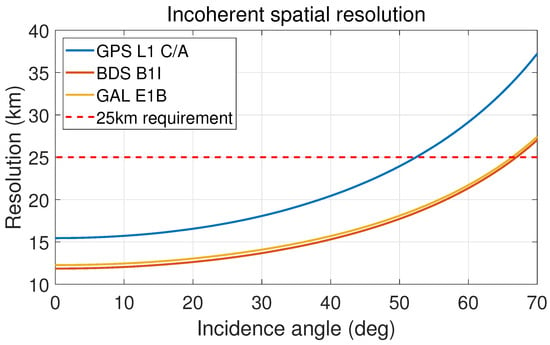
Figure 11.
Spatial resolution of observations from different GNSS signals under incoherent scattering.
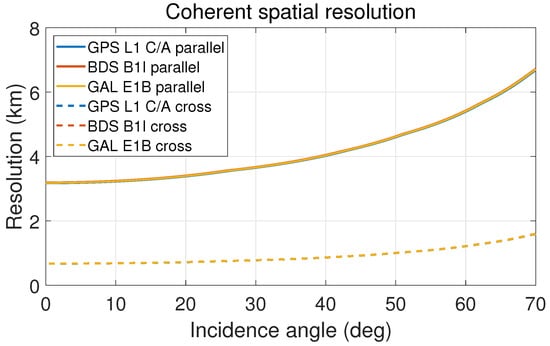
Figure 12.
Parallel-track and Cross-track spatial resolution of observations from different GNSS signals under coherent reflection.
3.2. Intercalibration
After the calibration of each GNSS system, the next step is intercalibration to ensure that observations between different systems are consistent. Observations of GPS are used as the reference, and engineering corrections of −0.44 dB and −0.5 dB are applied to the instrument gain in Equation (1) for BDS and GAL data, respectively. For data over the ocean, the relationship of NBRCS versus wind speed for the data from all systems is shown in Figure 13. The time series of NBRCS at collocated ECMWF wind speed of 6.5–7.5 m/s is shown in Figure 14. It can be observed that the NBRCSs from the three systems are generally consistent with each other and over time. The calibrated NBRCS from GNOS-II are also compared to those from the CYGNSS when measurements of the two missions collocated within 25 km in space and 1 h in time as shown in Figure 15 [25]. It can be observed that measurements from both systems agree well with each other.
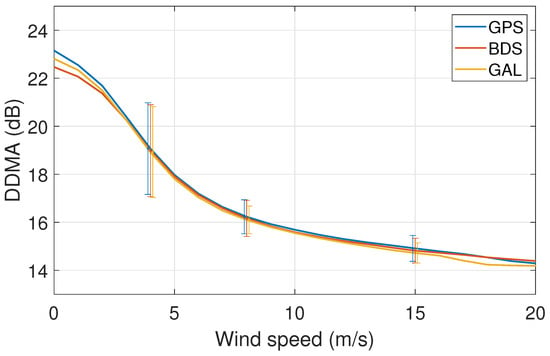
Figure 13.
Bin-averaged NBRCS from GPS, BDS and GAL versus collocated ECMWF wind speeds. The bin width is 1 m/s. The standard deviations of NBRCS at 4, 8 and 15 m/s are also shown as error bars (From [24]).

Figure 14.
Time series of monthly mean NBRCS at wind speed of 6.5–7.5 m/s for GPS, BDS and GAL observations from July 2021 to December 2022.
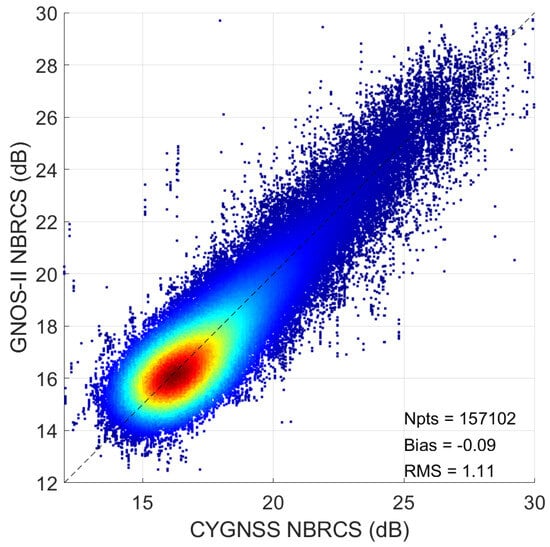
Figure 15.
Comparison of NBRCS between FY-3E and CYGNSS (v3.0 data) for observations over the ocean from 1 August 2021 to 31 October 2021 (From [25]).
When the data are over sea ice where the coherent reflection dominates, reflectivity observations from the three systems are compared to each other. Figure 16 shows the comparison of reflectivities over sea ice from different GNSS systems [30]. Data from any two systems were matched when they were located in the same ease grid of 9 km on the same day. It shows that the reflectivity observations from the three systems agree well with each other when the reflection is coherent. Then in the same way, reflectivity observations from the three systems are compared to each other when the data are over land, where the reflection is usually a combination of coherent reflection and incoherent scattering. The comparison of reflectivities over land from different GNSS systems is shown in Figure 17a. We noted that there is a bias between data from any two systems which is possibly because of the difference in the scattering area for the three systems as shown in Figure 10. In this study, we calibrate GPS and GAL data reflectivity over land using a linear correction using BDS data as the reference. The comparison of reflectivities after the calibration is shown in Figure 17b.
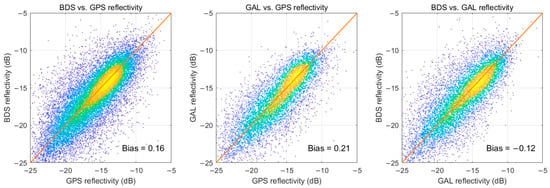
Figure 16.
Comparison of reflectivities from different GNSS systems for data over sea ice from 7 July to 31 October (From [30]).
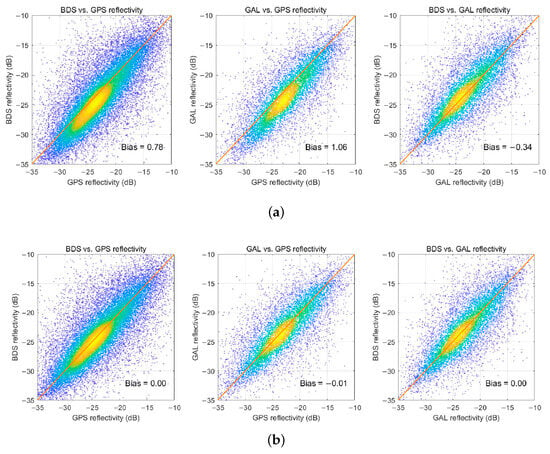
Figure 17.
Comparison of reflectivities from different GNSS systems for data over land from 7 July to 31 October: (a) before calibration; (b) after calibration (From [30]).
4. Development of Science Product and Applications
4.1. Ocean Surface Winds
Ocean surface wind is the major operational product of GNOS-II and it is an important dynamic parameter for NWP prediction and tropical cyclone monitoring. As GNSS-R observations show different sensitivities to wind speed under different sea states [31,32,33], two kinds of wind product are developed for FY-3E/GNOS-II: The global wind product and the cyclone wind product. The characteristics of the two products are listed as follows:
- Global wind product
- Mainly focus on wind speeds over the globe where the sea state of most areas is fully developed.
- The geophysical model function (GMF) was trained by the ECMWF ERA5 reanalysis.
- With best accuracy under 25 m/s.
- Mainly used for global numerical weather prediction (NWP) assimilation, climatology and related studies.
- Cyclone wind product
- Mainly focus on wind speeds over tropical and extratropical cyclones where the sea state is usually under limited fetch.
- The GMF was trained by the Hurricane Weather Research and Forecasting (HWRF) model data.
- With better accuracy at high wind speeds above 25 m/s than global wind product.
- Mainly used for regional NWP assimilation, monitoring of tropical cyclones and related studies.
Since the two products are released at the same time, the users can choose any of them depending on their applications.
4.1.1. Global Winds
Two observables, DDMA and LES are used to retrieve wind speeds and then combined by a minimum variance estimator for the global wind product. The details of the wind speed retrieval algorithm are described in [34,35]. Figure 18 shows an example of the monthly average of the wind speeds in October 2021. As the satellite is in a polar orbit, the wind product can provide global coverage including high-latitude areas.
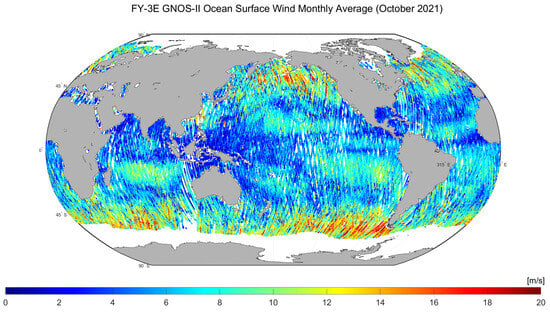
Figure 18.
A monthly average of the FY-3E/GNOS-II wind speeds in October 2021. The map is generated in 0.2 degree grid.
Figure 19 shows the density scatter plots and error statistics for the comparison of FY-3E/GNOS-II wind speeds versus ECMWF wind speeds for data of the three GNSS systems under 25 m/s. Time series of monthly wind speed bias and root-mean-square error (RMSE) for data of three systems from July 2021 to December 2022 are shown in Figure 20 and Figure 21, respectively. The accuracy of the global wind product meets the requirement of operational use and is stable over time. The accuracy of GPS data is slightly lower than the others mainly because the transmitting power of GPS satellites can vary over time and space due to the flex power event [35].

Figure 19.
Density scatter plots and error statistics for the comparison of FY-3E/GNOS-II wind speeds versus ECMWF wind speeds for GPS, BDS and GAL data under 25 m/s.

Figure 20.
Time series of monthly wind speed bias for GPS, BDS and GAL observations from July 2021 to December 2022.

Figure 21.
Time series of monthly wind speed RMSE for GPS, BDS and GAL observations from July 2021 to December 2022.
In an observing system experiment (OSE), the global wind product of FY-3E/GNOS-II was assimilated into CMA’s operational NWP model, GRAPES. Results showed that GNOS-II’s wind product has a neutral-positive effect on the model’s analyses and forecasts (not shown in this paper). After delicate evaluations, it has now been operationally assimilated into GRAPES since May 2023.
4.1.2. Cyclone Winds
The training of GMF for the cyclone wind product is similar to that for the global wind product except that the “ground truth” is wind speeds from the HWRF model. The analysis and 3-h forecast of the 2-km HWRF product was used, which was later smoothed into 25-km grids according to the resolution of GNOS-II winds. GNOS-II winds were collocated to HWRF when their time difference was less than 30 min and HWRF winds were then spatially interpolated to the specular points of each track of GNOS-II. Data of GNOS-II and HWRF over 200 overpasses across tropical cyclones in 2021 and 2022 have been used for the training. The maximum wind speed is larger than 30 m/s for around 40 overpasses.
Figure 22 shows the comparison of GNOS-II wind speeds and HWRF wind speeds of four tropical cyclone cases when GNOS-II specular point tracks passed through the center of the tropical cyclones. The four cases are Typhoon Nyatoh on 2 December 2021, Typhoon Tokage on 23 August 2022, Typhoon Hinnamnor on 31 August 2022 and Tropical Cyclone Darian on 24 December 2022. We can observe that the profiles of GNOS-II winds and HWRF winds generally match well. The density scatter plot (and error statistics) for the comparison between GNOS-II and HWRF wind speeds is shown in Figure 23. Note, that other than the error of GNOS-II winds, the RMSE also contains errors of the HWRF model and the collocation error (the change of tropical cyclone during the time difference between GNOS-II and HWRF model).
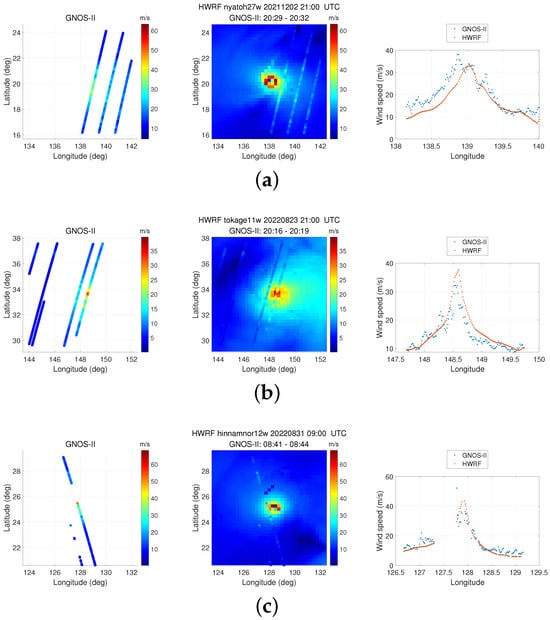
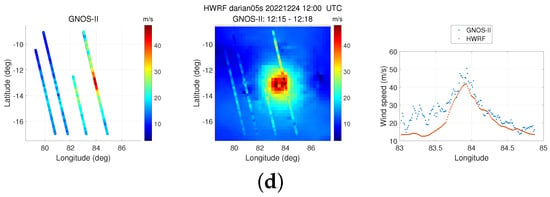
Figure 22.
The comparison of GNOS-II wind speeds and HWRF wind speeds of four tropical cyclone cases when GNOS-II specular point tracks passed through the center of the tropical cyclones. The four cases are Typhoon Nyatoh on 2 December 2021 (a), Typhoon Tokage on 23 August 2022 (b), Typhoon Hinnamnor on 31 August 2022 (c) and Tropical cyclone Darian on 24 December 2022 (d). For each case, the left panel is GNOS-II wind speeds, the middle panel is HWRF wind speeds overlapped by collocated GNOS-II wind speeds and the right panel is the GNOS-II and HWRF wind speed profiles for the track passing through the center of the cyclone.
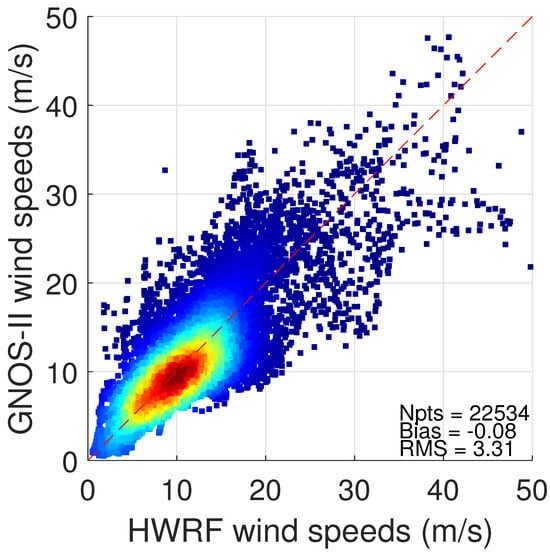
Figure 23.
Density scatter plots for the comparison between GNOS-II and HWRF wind speeds.
Since the product is released in near-real-time, it has another nowcast application in tropical cyclone monitoring. Every time a typhoon occurs, the forecaster of CMA can use the product together with other reference data (NWP model and other satellite observations) to determine the track and intensity of the typhoon. Figure 24 shows a case when FY-3E/GNOS-II winds overpassed Typhoon Mawar at around 20:15 UTC on 25 May 2023. It is also compared to wind speeds of the scatterometer (named WindRad) onboard the same satellite [36]. By comparing wind speeds from the two instruments, we can infer that one track of GNOS-II passed over the eye wall of the typhoon. The maximum wind speeds of GNOS-II and WindRad for this overpass are 60.1 and 40.0 m/s, respectively. The maximum wind speed of the typhoon reported by CMA is 62 m/s. The combination of active and passive remote sensing techniques helps forecasters make more accurate near-real-time forecasts of tropical cyclones.
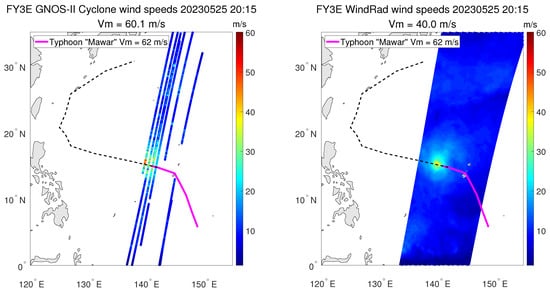
Figure 24.
Wind speeds of FY-3E/GNOS-II (left) and FY-3E/WindRad (right) when they passed over Typhoon Mawar at around 20:15 UTC on 25 May 2023. The track of the typhoon reported by CMA is shown as dash line. The maximum wind speeds of GNOS-II and WindRad for this overpass are 60.1 and 40.0 m/s, respectively. The maximum wind speed of the typhoon reported by CMA is 62 m/s (shown in the legend).
4.2. Land Soil Moisture
Soil moisture information is important for agriculture, flood monitoring and weather forecasting. When the GNSS-R specular point is over land, the major observable is the reflectivity, from which land surface soil moisture can be retrieved [37,38,39,40]. A map of reflectivity observations from FY-3E/GNOS-II is shown in Figure 25. Currently there is no digital elevation map pre-configured in the receiver, the specular point estimated onboard is not accurate at high-altitude areas and thus no data were obtained over those areas such as the Tibet Plateau and Antarctica. However, the digital elevation map has been deployed in follow-on missions (FY-3F, FY-3G, etc.) After the calibration and intercalibration as described in Section 3, a linear empirical relationship between the observed reflectivity and collocated Soil Moisture Active Passive (SMAP) [41] soil moisture was trained for data in each 36-km ease grid. A correction based on 16 land cover classifications has also been applied [30]. The global map of retrieved soil moisture is shown in Figure 26. RMSE and correction coefficients compared to collocated SMAP soil moisture for data from the three systems are shown in Table 6. The RMSE of data from the three systems is under 0.05 cm/cm, meeting the operational requirement.
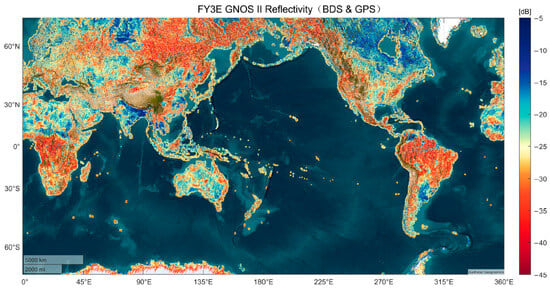
Figure 25.
FY-3E/GNOS-II land reflectivity observations for data from 10 July to 9 September 2021 (From [30]).
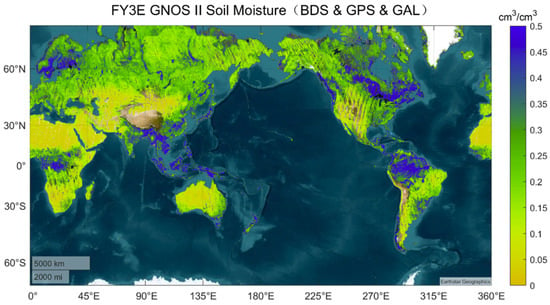
Figure 26.
Retrieved soil moisture from FY-3E/GNOS-II for data from 7 July to 6 August 2022 (From [30]).

Table 6.
RMSE and correction coefficients of FY-3E/GNOS-II soil moisture compared to SMAP soil moisture (from [30]).
4.3. Sea Ice Extent
Sea ice plays s significant role in the monitoring of climate change and ship routing. GNSS-R observations respond to sea ice with high spatial resolution [42,43,44]. Especially, the incoherent scattering of GNSS signals over the rough sea surface will translate to clear coherent scattering when there is sea ice in the glistening area. Three observables, DDM peak power ratio (PPR), DDM kurtosis and DDM skewness are selected to detect the coherence of DDM and thus to distinguish between sea water and sea ice. The DDM peak power ratio is defined as the sum of 3 × 5 pixels near the DDM peak divided by the sum of all pixels. The DDM kurtosis and skewness are defined as the kurtosis and skewness of all pixel values in the DDM, respectively. Figure 27 shows the PDF of DDM PPR for GPS-R data over seawater and sea ice where the ground truth data are from the OSI SAF Global Sea Ice Concentration (SIC) product [45] (sea ice is defined as SIC > 15%). It can be observed that the observable shows a different distribution when it is over seawater and sea ice. Similar patterns can also be observed for other observable and for data from each GNSS system. Therefore, a threshold was trained for each observable, each GNSS system and each hemisphere for the detection of sea ice. The comparison between retrieved sea ice extent and corresponding OSI SAF SIC in July 2022 is shown in Figure 28. The patterns of sea ice extent from the two products agree well with each other. The detection rate and false alarm rate for the sea ice detection are shown in Table 7.
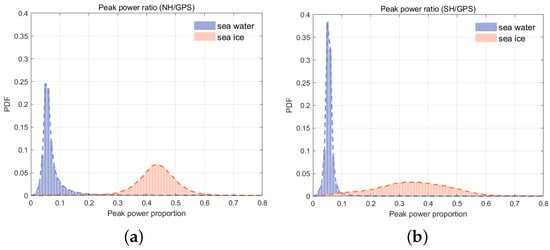
Figure 27.
The PDF of DDM PPR for GPS-R data over sea water and sea ice: (a) north hemisphere, (b) south hemisphere.
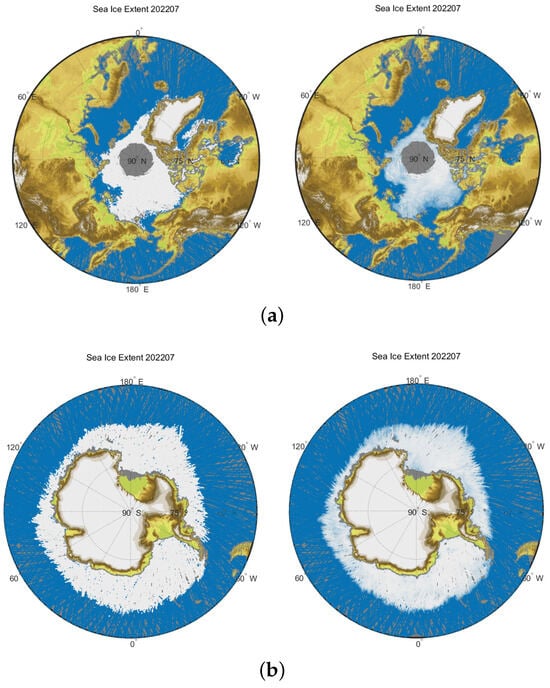
Figure 28.
Sea ice extent retrieved by FY-3E/GNOS-II (left) in July 2022 compared to OSI SAF Global SIC product (right): (a) north hemisphere, (b) south hemisphere. The blue color stands for sea water and white color stands for sea ice extent or SIC.

Table 7.
The detection rate and false alarm rate for retrieved sea ice extent from FY-3E/GNOS-II in July 2022, compared to OSI SAF sea ice product.
5. Cooperation between GNSS-R and GNSS RO
Another uniqueness of FY-3E/GNOS-II is that the instrument combines both GNSS RO and GNSS-R. Thus, its product includes geophysical parameters on the Earth’s surface (wind speed, soil moisture, sea ice) and profiles of atmospheric and ionospheric parameters at different altitudes. Figure 29 shows the global distribution of GNSS-R ocean surface winds, land soil moisture and GNSS RO events from FY-3E/GNOS-II in one day. There are in total 45,368 samples of ocean surface winds, 90,234 samples of land soil moisture and 2340 profiles of atmospheric parameters in one day. The combination of GNSS-R and GNSS RO can depict the Earth in three dimensions.
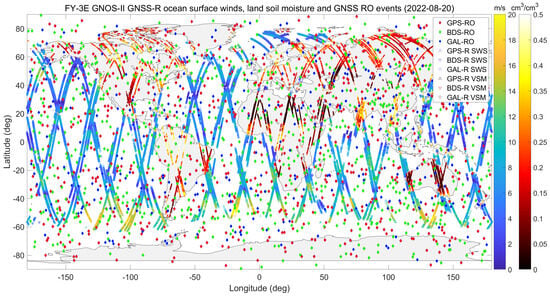
Figure 29.
Global distribution GNSS-R sea surface winds (SWS), land volumetric soil moisture (VSM) and GNSS RO events from FY-3E/GNOS-II on 20 August 2022.
Some science investigations on the combination of GNSS-R and GNSS RO include grazing angle phase altimetry [46], improving GNSS RO data quality using GNSS-R measurements [47] and monitoring of ionospheric anomalies [48].
6. Conclusions and Future Perspective
This review paper gives a summary of the instrument design and development of science products for the FY-3/GNOS-II GNSS-R mission. The importance of calibration and intercalibration for the multi-GNSS reflection measurements is highlighted as different GNSS signals have different characteristics. The quality of the science product of FY-3E is similar to that of the CYGNSS mission [49,50,51]. The accuracy of the ocean surface wind product is around 1.4–1.5 m/s and is stable over time. With short data latency, it has already been used in the CMA’s NWP system and typhoon monitoring. Furthermore, the results of retrieved land soil moisture and sea ice extent are all promising, meeting the requirement of operational use.
Followed by FY-3E, FY-3F and FY-3G were launched in 2023. The launch day and orbit of the three satellites are listed in Table 8. Both FY-3E and FY-3F are in sunsynchronous orbit where FY-3E is in the early-morning orbit and FY-3F is in the morning orbit. FY-3G is in a low-altitude drifting orbit. The GNOS-II instruments on the three satellites will constitute a GNSS-R constellation and provide observations over the Earth with higher temporal resolution. Figure 30 shows the specular points of the three satellites in one day. FY-3F and FY-3G are currently in the commissioning phase. Future missions such as FY-3H, FY-3I, etc. are also in the mission preparation stage.

Table 8.
The launch days and orbit information of FY-3E, FY-3F and FY-3G.
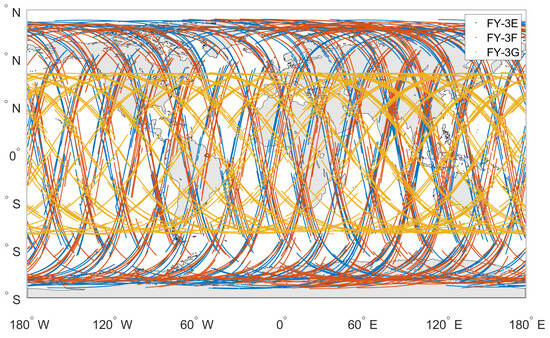
Figure 30.
Specular points of FY-3E, FY-3F and FY-3G in one day.
The group from NSSC is the one that both manufactures the GNOS-II instrument and also develops the ground data processing system for the science product. Thanks to the collaborations and communications between the instrument team and the science team, the instrument can be improved and upgraded from the direct feedback of the science team, and the science algorithm can be designed considering all detailed features of the instrument. Also thanks to the National Satellite Meteorological Centre (NSMC), CMA for the general mission operation, providing stable and low-latency data.
Future possible upgrades of the GNOS-II include real-time calibration of the transmitter EIRP, adding more reflection channels, multi-frequency and multi-polarization measurements, and advanced antennas.
Author Contributions
Conceptualization, Y.S. and W.B.; methodology, F.H., J.X., C.Y. and Y.L.; software, C.L. (Cheng Liu), D.W., T.Q., Y.T., F.L., X.M., C.L. (Congliang Liu), G.T., P.H. and R.W.; data curation, X.W., Y.C. and L.D.; writing—original draft preparation, F.H. and C.Y.; writing—review and editing, J.X. and W.B.; project administration, Y.S., Q.D., W.L., G.Y., X.Z. and N.X.; funding acquisition, X.H. and D.S.; All authors have read and agreed to the published version of the manuscript.
Funding
This work was supported by National Natural Science Foundation of China (42074042 and 42104032) and in part by the Youth Cross Team Scientific Research Project of the Chinese Academy of Sciences (JCTD-2021-10) and in part by the Key Program of Joint Fund of the National Natural Science Foundation of China and Shandong Province under Grant U22A20586.
Data Availability Statement
The ECMWF ERA5 reanalysis data are available at: https://cds.climate.copernicus.eu. The HWRF model data are available at: https://www.nco.ncep.noaa.gov/pmb/products/hur/. The SMAP wind data are available at: https://www.remss.com/measurements/wind/. The OSI SAF sea ice data are available at: https://osi-saf.eumetsat.int/products/sea-ice-products.
Acknowledgments
The authors would like to acknowledge Copernicus Climate Change Service for providing the ECMWF ERA5 reanalysis data, National Oceanic and Atmospheric Administration for providing the HWRF model data, NASA NSIDC for providing the SMAP data, and OSI SAF for providing the sea ice concentration data.
Conflicts of Interest
The authors declare no conflict of interest.
References
- Yang, J.; Zhang, P.; Lu, N.; Yang, Z.; Shi, J.; Dong, C. Improvements on global meteorological observations from the current Fengyun 3 satellites and beyond. Int. J. Digit. Earth 2012, 5, 251–265. [Google Scholar] [CrossRef]
- Yang, J.; Zhang, Z.; Wei, C.; Lu, F.; Guo, Q. Introducing the new generation of Chinese geostationary weather satellites, Fengyun-4. Bull. Am. Meteorol. Soc. 2017, 98, 1637–1658. [Google Scholar] [CrossRef]
- Xian, D.; Zhang, P.; Gao, L.; Sun, R.; Zhang, H.; Jia, X. Fengyun meteorological satellite products for earth system science applications. Adv. Atmos. Sci. 2021, 38, 1267–1284. [Google Scholar] [CrossRef]
- Yang, Y.; Li, J.; Wang, A.; Xu, J.; He, H.; Guo, H.; Shen, J.; Dai, X. Preliminary assessment of the navigation and positioning performance of BeiDou regional navigation satellite system. Sci. China Earth Sci. 2014, 57, 144–152. [Google Scholar] [CrossRef]
- Yang, Y.; Gao, W.; Guo, S.; Mao, Y.; Yang, Y. Introduction to BeiDou-3 navigation satellite system. Navigation 2019, 66, 7–18. [Google Scholar] [CrossRef]
- Sun, Y.; Bai, W.; Liu, C.; Liu, Y.; Du, Q.; Wang, X.; Yang, G.; Liao, M.; Yang, Z.; Zhang, X.; et al. The FengYun-3C radio occultation sounder GNOS: A review of the mission and its early results and science applications. Atmos. Meas. Tech. 2018, 11, 5797–5811. [Google Scholar] [CrossRef]
- Jin, S.; Gao, C.; Li, J. Atmospheric sounding from Fengyun-3C GPS radio occultation observations: First results and validation. Adv. Meteorol. 2019, 2019, 4780143. [Google Scholar] [CrossRef]
- Xu, X.; Luo, J.; Wang, H.; Liu, H.; Hu, T. Morphology of sporadic E layers derived from Fengyun-3C GPS radio occultation measurements. Earth Planets Space 2022, 74, 1–13. [Google Scholar] [CrossRef]
- Li, W.; Zhao, D.; He, C.; Shen, Y.; Hu, A.; Zhang, K. Application of a multi-layer artificial neural network in a 3-D global electron density model using the long-term observations of COSMIC, Fengyun-3C, and Digisonde. Space Weather 2021, 19, e2020SW002605. [Google Scholar] [CrossRef]
- Bormann, N.; Duncan, D.; English, S.; Healy, S.; Lonitz, K.; Chen, K.; Lawrence, H.; Lu, Q. Growing operational use of FY-3 data in the ECMWF system. Adv. Atmos. Sci. 2021, 38, 1285–1298. [Google Scholar] [CrossRef]
- Jin-cheng, W.; Jian-dong, G.; Wei, H. The Impact of Assimilating FY-3C GNOS GPS Radio Occultation Observations on GRAPES Forecasts. J. Trop. Meteorol. 2020, 26, 390–401. [Google Scholar] [CrossRef]
- Qiu, T.; Wang, X.; Sun, Y.; Li, F.; Wang, Z.; Xia, J.; Du, Q.; Bai, W.; Cai, Y.; Wang, D.; et al. An Innovative Signal Processing Scheme for Spaceborne Integrated GNSS Remote Sensors. Remote. Sens. 2023, 15, 745. [Google Scholar] [CrossRef]
- Jin, S.; Cardellach, E.; Xie, F. GNSS Remote Sensing; Springer: Berlin/Heidelberg, Germany, 2014; Volume 16. [Google Scholar]
- Zavorotny, V.U.; Gleason, S.; Cardellach, E.; Camps, A. Tutorial on remote sensing using GNSS bistatic radar of opportunity. IEEE Geosci. Remote. Sens. Mag. 2014, 2, 8–45. [Google Scholar] [CrossRef]
- Zhang, P.; Hu, X.; Lu, Q.; Zhu, A.; Lin, M.; Sun, L.; Chen, L.; Xu, N. FY-3E: The first operational meteorological satellite mission in an early morning orbit. Adv. Atmos. Sci. 2021, 39, 1–8. [Google Scholar] [CrossRef]
- Foti, G.; Gommenginger, C.; Jales, P.; Unwin, M.; Shaw, A.; Robertson, C.; Rosello, J. Spaceborne GNSS reflectometry for ocean winds: First results from the UK TechDemoSat-1 mission. Geophys. Res. Lett. 2015, 42, 5435–5441. [Google Scholar] [CrossRef]
- Ruf, C.S.; Atlas, R.; Chang, P.S.; Clarizia, M.P.; Garrison, J.L.; Gleason, S.; Katzberg, S.J.; Jelenak, Z.; Johnson, J.T.; Majumdar, S.J.; et al. New ocean winds satellite mission to probe hurricanes and tropical convection. Bull. Am. Meteorol. Soc. 2016, 97, 385–395. [Google Scholar] [CrossRef]
- Clarizia, M.; Gommenginger, C.; Gleason, S.; Srokosz, M.; Galdi, C.; Di Bisceglie, M. Analysis of GNSS-R delay-Doppler maps from the UK-DMC satellite over the ocean. Geophys. Res. Lett. 2009, 36, L02608. [Google Scholar] [CrossRef]
- Jing, C.; Niu, X.; Duan, C.; Lu, F.; Di, G.; Yang, X. Sea Surface Wind Speed Retrieval from the First Chinese GNSS-R Mission: Technique and Preliminary Results. Remote. Sens. 2019, 11, 2013. [Google Scholar] [CrossRef]
- Chew, C.; Lowe, S.; Parazoo, N.; Esterhuizen, S.; Oveisgharan, S.; Podest, E.; Zuffada, C.; Freedman, A. SMAP radar receiver measures land surface freeze/thaw state through capture of forward-scattered L-band signals. Remote. Sens. Environ. 2017, 198, 333–344. [Google Scholar] [CrossRef]
- Munoz-Martin, J.F.; Fernandez, L.; Perez, A.; Ruiz-de Azua, J.A.; Park, H.; Camps, A.; Domínguez, B.C.; Pastena, M. In-Orbit Validation of the FMPL-2 Instrument—The GNSS-R and L-Band Microwave Radiometer Payload of the FSSCat Mission. Remote Sens. 2021, 13, 121. [Google Scholar] [CrossRef]
- Li, Z.; Stoffelen, A.; Verhoef, A.; Wang, Z.; Shang, J.; Yin, H. Higher-order calibration on WindRAD (Wind Radar) scatterometer winds. Atmos. Meas. Tech. 2023, 16, 4769–4783. [Google Scholar] [CrossRef]
- Ruf, C.; Unwin, M.; Dickinson, J.; Rose, R.; Rose, D.; Vincent, M.; Lyons, A. CYGNSS: Enabling the future of hurricane prediction [remote sensing satellites]. IEEE Geosci. Remote Sens. Mag. 2013, 1, 52–67. [Google Scholar] [CrossRef]
- Huang, F.; Xia, J.; Yin, C.; Zhai, X.; Yang, G.; Bai, W.; Sun, Y.; Du, Q.; Wang, X.; Qiu, T.; et al. Spaceborne GNSS Reflectometry With Galileo Signals on FY-3E/GNOS-II: Measurements, Calibration, and Wind Speed Retrieval. IEEE Geosci. Remote. Sens. Lett. 2023, 20, 1–5. [Google Scholar] [CrossRef]
- Huang, F.; Xia, J.; Yin, C.; Bai, W.; Sun, Y.; Du, Q.; Wang, X.; Cai, Y.; Duan, L. Characterization and Calibration of Spaceborne GNSS-R Observations Over the Ocean From Different BeiDou Satellite Types. IEEE Trans. Geosci. Remote Sens. 2022, 60, 1–11. [Google Scholar] [CrossRef]
- Huang, F.; Yin, C.; Xia, J.; Wang, X.; Sun, Y.; Bai, W.; Qiu, T.; Du, Q.; Yang, G.; Zheng, Q. Analysis and Mitigation of Radio Frequency Interference in Spaceborne GNSS Ocean Reflectometry Data. IEEE Trans. Geosci. Remote Sens. 2023, 61, 5801712. [Google Scholar] [CrossRef]
- Wang, T.; Ruf, C.S.; Block, B.; McKague, D.S.; Gleason, S. Design and performance of a GPS constellation power monitor system for improved CYGNSS L1B calibration. IEEE J. Sel. Top. Appl. Earth Obs. Remote Sens. 2018, 12, 26–36. [Google Scholar] [CrossRef]
- Steigenberger, P.; Thölert, S.; Montenbruck, O. Flex power on GPS block IIR-M and IIF. GPS Solut. 2019, 23, 8. [Google Scholar] [CrossRef]
- Camps, A. Spatial resolution in GNSS-R under coherent scattering. IEEE Geosci. Remote Sens. Lett. 2019, 17, 32–36. [Google Scholar] [CrossRef]
- Yin, C.; Huang, F.; Xia, J.; Bai, W.; Sun, Y.; Yang, G.; Zhai, X.; Xu, N.; Hu, X.; Zhang, P.; et al. Soil Moisture Retrieval from Multi-GNSS Reflectometry on FY-3E GNOS-II by Land Cover Classification. Remote Sens. 2023, 15, 1097. [Google Scholar] [CrossRef]
- Ruf, C.S.; Balasubramaniam, R. Development of the CYGNSS Geophysical Model Function for Wind Speed. IEEE J. Sel. Top. Appl. Earth Obs. Remote Sens. 2018, 12, 66–77. [Google Scholar] [CrossRef]
- Balasubramaniam, R.; Ruf, C. Azimuthal Dependence of GNSS-R Scattering Cross-Section in Hurricanes. J. Geophys. Res. Ocean. 2020, 125, e2020JC016167. [Google Scholar] [CrossRef]
- Hwang, P.A. Azimuthal Variation of L-Band Tilting Roughness Inside Tropical Cyclones. IEEE Geosci. Remote Sens. Lett. 2022, 19, 1–5. [Google Scholar] [CrossRef]
- Clarizia, M.P.; Ruf, C.S.; Jales, P.; Gommenginger, C. Spaceborne GNSS-R minimum variance wind speed estimator. IEEE Trans. Geosci. Remote Sens. 2014, 52, 6829–6843. [Google Scholar] [CrossRef]
- Huang, F.; Xia, J.; Yin, C.; Zhai, X.; Xu, N.; Yang, G.; Bai, W.; Sun, Y.; Du, Q.; Liao, M.; et al. Assessment of FY-3E GNOS-II GNSS-R global wind product. IEEE J. Sel. Top. Appl. Earth Obs. Remote Sens. 2022, 15, 7899–7912. [Google Scholar] [CrossRef]
- Li, Z.; Verhoef, A.; Stoffelen, A.; Shang, J.; Dou, F. First Results from the WindRAD Scatterometer on Board FY-3E: Data Analysis, Calibration and Wind Retrieval Evaluation. Remote Sens. 2023, 15, 2087. [Google Scholar] [CrossRef]
- Camps, A.; Park, H.; Pablos, M.; Foti, G.; Gommenginger, C.P.; Liu, P.W.; Judge, J. Sensitivity of GNSS-R spaceborne observations to soil moisture and vegetation. IEEE J. Sel. Top. Appl. Earth Obs. Remote Sens. 2016, 9, 4730–4742. [Google Scholar] [CrossRef]
- Yueh, S.H.; Shah, R.; Chaubell, M.J.; Hayashi, A.; Xu, X.; Colliander, A. A Semiempirical Modeling of Soil Moisture, Vegetation, and Surface Roughness Impact on CYGNSS Reflectometry Data. IEEE Trans. Geosci. Remote Sens. 2022, 60, 1–17. [Google Scholar] [CrossRef]
- Wan, W.; Liu, B.; Guo, Z.; Lu, F.; Niu, X.; Li, H.; Ji, R.; Cheng, J.; Li, W.; Chen, X.; et al. Initial Evaluation of the First Chinese GNSS-R Mission BuFeng-1 A/B for Soil Moisture Estimation. IEEE Geosci. Remote Sens. Lett. 2022, 19, 1–5. [Google Scholar] [CrossRef]
- Chew, C.; Small, E. Soil moisture sensing using spaceborne GNSS reflections: Comparison of CYGNSS reflectivity to SMAP soil moisture. Geophys. Res. Lett. 2018, 45, 4049–4057. [Google Scholar] [CrossRef]
- Entekhabi, D.; Njoku, E.G.; O’neill, P.E.; Kellogg, K.H.; Crow, W.T.; Edelstein, W.N.; Entin, J.K.; Goodman, S.D.; Jackson, T.J.; Johnson, J.; et al. The soil moisture active passive (SMAP) mission. Proc. IEEE 2010, 98, 704–716. [Google Scholar] [CrossRef]
- Cartwright, J.; Banks, C.J.; Srokosz, M. Sea ice detection using GNSS-R data from TechDemoSat-1. J. Geophys. Res. Ocean. 2019, 124, 5801–5810. [Google Scholar] [CrossRef]
- Yan, Q.; Huang, W. Sea ice thickness measurement using spaceborne GNSS-R: First results with TechDemoSat-1 data. IEEE J. Sel. Top. Appl. Earth Obs. Remote Sens. 2020, 13, 577–587. [Google Scholar] [CrossRef]
- Rodriguez-Alvarez, N.; Holt, B.; Jaruwatanadilok, S.; Podest, E.; Cavanaugh, K.C. An Arctic sea ice multi-step classification based on GNSS-R data from the TDS-1 mission. Remote Sens. Environ. 2019, 230, 111202. [Google Scholar] [CrossRef]
- OSI SAF. Global Sea ICE Concentration (netCDF)—DMSP, EUMETSAT SAF on Ocean and Sea Ice; EUMETSAT SAF on Ocean and Sea Ice: De Bilt, The Netherlands, 2017. [Google Scholar]
- Nguyen, V.A.; Nogués-Correig, O.; Yuasa, T.; Masters, D.; Irisov, V. Initial GNSS phase altimetry measurements from the spire satellite constellation. Geophys. Res. Lett. 2020, 47, e2020GL088308. [Google Scholar] [CrossRef]
- Wang, K.N.; Ao, C.O.; de la Torre Juárez, M. GNSS-RO refractivity bias correction under ducting layer using surface-reflection signal. Remote Sens. 2020, 12, 359. [Google Scholar] [CrossRef]
- Molina, C.; Semlali, B.B.; González-Casado, G.; Park, H.; Camps, A. Ionospheric scintillation anomalies associated with the 2021 La Palma volcanic eruption detected with GNSS-R and GNSS-RO observations. In Proceedings of the IGARSS 2022–2022 IEEE International Geoscience and Remote Sensing Symposium, IEEE, Kuala Lumpur, Malaysia, 17–22 July 2022; pp. 7445–7448. [Google Scholar]
- Ruf, C.S.; Gleason, S.; McKague, D.S. Assessment of CYGNSS Wind Speed Retrieval Uncertainty. IEEE J. Sel. Top. Appl. Earth Obs. Remote Sens. 2018, 12, 87–97. [Google Scholar] [CrossRef]
- Ruf, C.; Asharaf, S.; Balasubramaniam, R.; Gleason, S.; Lang, T.; McKague, D.; Twigg, D.; Waliser, D. In-orbit performance of the constellation of CYGNSS hurricane satellites. Bull. Am. Meteorol. Soc. 2019, 100, 2009–2023. [Google Scholar] [CrossRef]
- Chew, C.; Small, E. Description of the UCAR/CU soil moisture product. Remote Sens. 2020, 12, 1558. [Google Scholar] [CrossRef]
Disclaimer/Publisher’s Note: The statements, opinions and data contained in all publications are solely those of the individual author(s) and contributor(s) and not of MDPI and/or the editor(s). MDPI and/or the editor(s) disclaim responsibility for any injury to people or property resulting from any ideas, methods, instructions or products referred to in the content. |
© 2023 by the authors. Licensee MDPI, Basel, Switzerland. This article is an open access article distributed under the terms and conditions of the Creative Commons Attribution (CC BY) license (https://creativecommons.org/licenses/by/4.0/).