Communication

Preliminary Results in Innovative Solutions for Soil Carbon Estimation: Integrating Remote Sensing, Machine Learning, and Proximal Sensing Spectroscopy

1
School of Agriculture and Food Sustainability, The University of Queensland, St. Lucia, QLD 4072, Australia
2
Centre for Planetary Health and Food Security, School of Environment and Science, Griffith University, Nathan, Brisbane, QLD 4111, Australia
3
College of Resources and Environment, University of Chinese Academy of Sciences, Beijing 100049, China
4
Indian Council of Forestry Research & Education, Dehradun 248006, India
5
Ziltek Pty. Ltd., 8 Tooronga Avenue, Edwardstown, SA 5039, Australia
6
Farmlab Pty. Ltd., Unit 4/121 Allingham St, Armidale, NSW 2350, Australia
7
AgriCircle, 8808 Pfäffikon, Switzerland
*
Author to whom correspondence should be addressed.
Remote Sens. 2023, 15(23), 5571; https://doi.org/10.3390/rs15235571
Submission received: 20 October 2023 / Revised: 26 November 2023 / Accepted: 27 November 2023 / Published: 30 November 2023
(This article belongs to the Special Issue Recent Advances in Remote Sensing of Soil Science)

Abstract

:
This paper explores the application and advantages of remote sensing, machine learning, and mid-infrared spectroscopy (MIR) as a popular proximal sensing spectroscopy tool in the estimation of soil organic carbon (SOC). It underscores the practical implications and benefits of the integrated approach combining machine learning, remote sensing, and proximal sensing for SOC estimation and prediction across a range of applications, including comprehensive soil health mapping and carbon credit assessment. These advanced technologies offer a promising pathway, reducing costs and resource utilization while improving the precision of SOC estimation. We conducted a comparative analysis between MIR-predicted SOC values and laboratory-measured SOC values using 36 soil samples. The results demonstrate a strong fit (R² = 0.83), underscoring the potential of this integrated approach. While acknowledging that our analysis is based on a limited sample size, these initial findings offer promise and serve as a foundation for future research. We will be providing updates when we obtain more data. Furthermore, this paper explores the potential for commercialising these technologies in Australia, with the aim of helping farmers harness the advantages of carbon markets. Based on our study’s findings, coupled with insights from the existing literature, we suggest that adopting this integrated SOC measurement approach could significantly benefit local economies, enhance farmers’ ability to monitor changes in soil health, and promote sustainable agricultural practices. These outcomes align with global climate change mitigation efforts. Furthermore, our study’s approach, supported by other research, offers a potential template for regions worldwide seeking similar solutions.

1. Introduction

Soil organic carbon (SOC) is a key component of the global carbon cycle [1,2,3] and stores more carbon than the atmosphere and biosphere combined [4]. Soil organic carbon (SOC) is not only composed of plant residues and animal wastes, but also includes organic matter that has been transformed by a diverse array of soil microorganisms, such as fungi and bacteria. While cyanobacteria are an exception, most of these organisms primarily utilise carbon derived from plants. They play a vital role in the soil ecosystem, contributing their living biomass and the products of decomposition to the SOC pool, thereby facilitating the recycling and modification of plant-originated carbon [5,6,7,8,9]. The global carbon balance is significantly affected by even small changes in SOC [3]. SOC profoundly affects the physical, chemical, and biological properties of the soil [7] and therefore has a direct contribution to agricultural productivity and soil fertility [8]. For example, increasing concentrations of SOC enhance the soil’s water-holding capacity and promote the formation of a stable soil structure. Furthermore, the decomposition of SOC by soil microorganisms releases essential nutrients, which are then available for plant uptake. SOC also serves as a vital food source for these soil micro-organisms [9].
Despite widespread recognition of the importance of SOC, challenges remain in measuring and monitoring its concentration in soil [10,11]. Traditional methods of measuring SOC, such as wet chemical analysis and dry combustion [12,13], require extensive laboratory analysis of numerous soil samples, which is resource-intensive [14]. In addition, a limitation of the traditional approach is its inability to assess and monitor changes in SOC concentrations over spatio-temporal scales [15]. With advances in remote sensing technique and machine learning, researchers have begun to explore integrated methods of SOC measurement [16,17,18,19,20]. These new methods of SOC estimation facilitate the development of spatial strata, thereby reducing the number of sampling profiles needed to produce high-resolution SOC maps, leading to effectively reducing the cost of measuring SOC [16,21]. Additionally, researchers have used Mid-infrared spectroscopy (MIR) as a popular proximal sensing tool for SOC prediction [22,23], thus integrating the MIR with remote sensing and machine learning to provide incentives for resource efficiency.
The integration of techniques aims to overcome the limitations of traditional methods and provide cost-effective, accurate, and scalable solutions for SOC measurement [24,25]. Remote sensing allows for the collection of large-scale, spatially explicit data on soil properties, including SOC, by utilizing various sensors mounted on satellites or aircraft [20,25]. Machine learning algorithms, such as random forests and support vector machines, effectively analyze and interpret, enabling the prediction and mapping of SOC with high precision [26]. MIR spectra provide valuable information about the physical structure and chemical composition of soils, including SOC [27,28]. By analyzing MIR spectra collected from soil samples profiles, machine learning models can be trained to accurately predict SOC, eliminating the need for costly and time-consuming laboratory analysis [29]. These approaches not only reduces the cost of SOC measurement but also allows for rapid and non-destructive assessment of SOC in large areas [30].
To address the current limitations in accurately measuring SOC within Australian soils, we propose an innovative approach that combines remote sensing, machine learning, and MIR spectroscopy [16,23,27]. This integration aims to refine SOC estimation methods, achieving higher resolution (10 m × 10 m) SOC maps at a reduced cost of AUD 3/ha/yr. The current carbon project in Australia will validate these two complimentary SOC estimation methods not yet fully validated for Australian conditions.
In summary, this report aimed to shed light on the integration of remote sensing, machine learning, and MIR in SOC measurement. By addressing the limitations of traditional methods, these technologies offer resource efficient and scalable solutions for assessing and monitoring SOC across the spatio-temporal scale. The potential for the commercial application in Australia, combined with its benefits leading to sustainable farming and climate change mitigation, make the approach a promising avenue for future research and implementation. Embracing these novel approaches allows for a better understanding and management of SOC, contributing to sustainable agriculture and aligning with Sustainable Development Goals (SDGs).

2. Application of Remote Sensing and Machine Learning in Soil Organic Carbon Measurement

2.1. Remote Sensing and Soil Organic Carbon

Remote sensing and machine learning have emerged as important tools in modern environmental sciences and have shown great promise in the field of SOC measurement [20]. Remote sensing presents the advantage of collecting information for a wider spatial coverage and frequent temporal repeatability [31]. Various satellites such as the Landsat program [32,33], the Sentinel series [34,35] and the Moderate Resolution Imaging Spectroradiometer (MODIS) offer a wide range of spectral data that are being used for SOC estimation [19,36]. Spectral indices derived from these remote sensing data, such as the Normalised Difference Vegetation Index (NDVI) and the Soil-Adjusted Vegetation Index (SAVI), have been found to correlate with SOC concentration [20,37], as vegetation cover is often directly related to the SOC concentration [38]. Thus, these indices provide a very useful clue for predicting SOC concentrations in soils. In addition, multispectral and hyperspectral imaging has the ability to capture soil reflectance information that can be used to predict SOC [39]. These techniques not only provide data with high spatial resolution, but also provide more detailed information for the estimation of SOC concentrations. In summary, remote sensing techniques provide powerful tools for SOC concentration estimation through their broad spatial coverage and temporal repeatability, as well as the availability of multiple spectral data. These tools, such as NDVI, SAVI, and multispectral and hyperspectral imaging, not only contribute to the understanding of the distribution and variability of SOC in soil, but also have potentially important applications in sustainable land management and environmental protection.
Remote sensing can provide valuable insights into SOC concentrations, but the accuracy of predictions depends on several factors, including the specific remote sensing technology, spatial resolution, and the use of robust machine learning models [17,40]. Ground validation is crucial to ensure the reliability of SOC estimates obtained through remote sensing. SOC concentration affects the spectral properties of the soil, and spectral reflectance from certain wavelengths of light can be correlated with SOC concentration. The variances among machine learning models also contribute to the discrimination of SOC values [41]. Machine learning algorithms, including regression models and deep learning models, can be trained on spectral data along with ground-truth SOC measurements. These models can then predict SOC concentrations across large areas based on the spectral information. The spatial resolution of remote sensing data is crucial. Higher-resolution data can provide more accurate predictions of SOC concentrations at a finer scale [42]. For example, data with a spatial resolution of 10 m × 10 m can provide more detailed information compared to coarser-resolution data [43]. However, there is the detection limit (MDL) in remote sensing [44]. The MDL varies depending on the specific sensor and spectral bands used. It is essential to understand the MDL of the remote sensing system being employed to assess its suitability for a given application. To ensure the reliability of SOC predictions, it is essential to validate remote sensing-derived estimates with ground-based measurements of SOC [45]. This involves collecting soil samples from various locations and measuring SOC concentrations using laboratory methods. The remote sensing estimates can then be compared to these ground-truth measurements to assess accuracy. Remote sensing data can capture changes in SOC concentrations over time. Repeated data acquisition allows for monitoring changes in SOC due to factors such as land use, climate, and management practices [46,47].

2.2. Machine Learning in Soil Organic Carbon Measurement

Machine learning techniques have revolutionised interpretation and analysis of large data sets [48]. In the context of SOC estimation, machine learning algorithms such as Random Forests [49,50,51], Support Vector Machines [51] and Artificial Neural Networks [52] have been used extensively. These algorithms can model complex and non-linear relationships between remotely sensed spectral data and SOC [51]. Recently, more advanced machine learning techniques such as deep learning have also been applied [16]. Convolutional Neural Networks (CNNs), a type of deep learning model, have demonstrated their ability to handle high-dimensional spectral data with increased precision of SOC prediction [53].

2.3. Integration of Remote Sensing and Machine Learning

The synergy between remote sensing and machine learning leverages the distinct strengths of each technique [17]. Remote sensing provides a wide-reaching, high-resolution view of the Earth’s surface, capturing valuable spectral data. Meanwhile, machine learning algorithms excel at processing vast datasets and extracting intricate patterns and insights. When combined, remote sensing data enriches machine learning models with comprehensive environmental information, enabling precise analysis and prediction [17]. The multiple, spatially extensive spectral data from remote sensing serve as input to the machine learning models, leading to model the complex relationships for SOC estimations [24]. This approach can reduce the cost of measuring SOC by reducing the number of sampling profiles required for estimation of SOC, therefore providing a more cost-effective and scalable solution for large-scale SOC mapping [17,18,51,54].

2.4. Limitation of Remote Sensing and Machine Learning Model

Remote sensing and machine learning offer powerful tools for estimating SOC levels, but they are accompanied by several potential limitations and constraints [17]. One primary limitation is the spatial resolution, which may impede their ability to capture fine-scale variations in SOC, particularly in regions with complex terrain or significant land use changes. Additionally, the presence of cloud cover and atmospheric conditions can adversely affect the quality and availability of remote sensing data. Clouds can obstruct the view of the ground, while atmospheric conditions may introduce errors. Various data preprocessing and correction steps, such as atmospheric correction and land cover classification, can add uncertainty and require specialised expertise. The ground validation of SOC estimates poses a challenge, involving labor-intensive and costly soil sampling and laboratory analysis. Furthermore, inconsistencies can exist between different remote sensing sensors and data sources, and the cost of high-resolution remote sensing data may be a limiting factor in certain applications. Importantly, the performance of machine learning models hinges on the quality and quantity of training data, as well as the selection of features and algorithms. Inappropriate models or training data can lead to inaccurate estimates. Considering these challenges and limitations, it is imperative to complement remote sensing with ground-based observations to enhance the accuracy and reliability of SOC estimation.

3. Application of Mid-Infrared Spectroscopy in Predicting Soil Organic Carbon

3.1. Principle and Advantages of MIR in Soil Organic Carbon Prediction

MIR has shown high potential in the prediction of SOC due to its cost-effectiveness and high and predictive accuracy ability. MIR is a spectroscopic method that involves the use of mid-infrared light, typically in the range of 2.5–25 µm. The interaction of MIR light with the molecules in the soil sample causes the molecules to vibrate at specific frequencies, generating a unique spectral pattern or “fingerprint” [28,55]. While MIR remote sensing has a longer wavelength compared to traditional optical remote sensing, it is important to note that ground penetration capabilities depend on the wavelength and soil conditions. Generally, the penetration depth is about half the wavelength. Therefore, while MIR can provide some level of subsurface information, its penetration depth may not be as significant as that of longer wavelengths, such as those in the microwave range. This spectral information is used to predict various soil properties, including SOC concentration [56], and bulk density [57]; hence, the estimation of SOC stocks (SOC concentration × bulk density × soil depth). There are numerous advantages of MIR to estimate concentrations of SOC. Firstly, it is a rapid and non-destructive method [30], and requires minimal sample preparation [22,58]. Secondly, it is capable of providing continuous and real-time measurements, which can be particularly useful in monitoring changes in SOC over time [57,59]. Consequently, MIR can analyse multiple soil properties simultaneously [58,60], making it a versatile tool for soil analysis.

3.2. MIR and Machine Learning in Soil Organic Carbon Prediction

The spectral data derived from MIR is typically high-dimensional and complex. Therefore, advanced statistical or machine learning models are required to extract meaningful information from the spectral data and predict the SOC concentration [61]. Partial Least Squares Regression (PLSR), Support Vector Machines (SVM), and Artificial Neural Networks (ANN) are commonly used for modelling the complex and non-linear relationships between MIR spectra and SOC concentration [62]. The deep learning techniques such as Convolutional Neural Networks (CNNs) have been applied to MIR data for SOC prediction [60]. These methods have improved the prediction and precision of SOC compared to that of traditional machine learning method [63]. This demonstrates the potential of applying MIR in combination with advanced machine learning techniques for SOC concentration and stock prediction.

3.3. Integration of MIR, Remote Sensing, and Machine Learning

The combination of MIR, remote sensing and machine learning techniques provides a comprehensive approach to SOC prediction and mapping. MIR can provide highly accurate, local-scale SOC predictions [30], while remote sensing data can provide broader, landscape-scale information [17]. Machine learning techniques, on the other hand, can integrate these different types of data and handle their complex relationships to provide more accurate and spatially comprehensive SOC predictions [54]. Overall, the approach may facilitate a speedy, precise, and low-resource base approach.
To delve deeper into the integration of these methods, let us examine some successful research examples. Forkuor et al. (2017) [64] conducted high-resolution SOC measurements of soil samples using MIR. Subsequently, they employed satellite remote sensing data to acquire information about land cover and vegetation indices in the corresponding regions [64]. Finally, they applied machine learning algorithms, such as Random Forest, to amalgamate these datasets and generate high-resolution SOC maps. Similarly, Tziolas et al. (2020) [65] adopted a comprehensive approach, combining ground-based MIR measurements with satellite remote sensing data to predict SOC in different regions. They harnessed deep learning techniques, including Convolutional Neural Networks (CNNs), to process remote sensing imagery while leveraging the high accuracy of MIR for calibration and improved model precision [17,66]. This integrated approach not only aids in precise SOC estimation but can also be employed for decision support in sustainable land management [66]. For instance, agricultural sectors can utilize these high-resolution SOC maps to guide land-use planning, thereby enhancing crop productivity, reducing soil erosion, and promoting sustainable agricultural practices. By delving into these case studies of integrated methods, we gain a clearer understanding of how they combine MIR, remote sensing, and machine learning to achieve SOC prediction and mapping, offering valuable insights and inspiration for future research.

3.4. Limitation of MIR

MIR holds significant promise in predicting SOC due to its cost-effectiveness and high predictive accuracy. However, along with its advantages, it is important to recognise several potential limitations in its application [22,23]. MIR spectral data can be complex and high-dimensional, necessitating advanced statistical or machine learning models for accurate SOC prediction. The technique’s accuracy is highly dependent on sample quality and microscale representation, and soil water content. MIR often involves near-distance soil sample collection, limiting its application in remote or challenging-to-access areas. Lastly, costs associated with instrument acquisition and sample analysis should not be overlooked. To address these limitations, the integration of remote sensing and machine learning techniques, alongside ground validation, offers a comprehensive approach to SOC prediction and mapping. This combined approach can yield precise and cost-effective results, making it valuable for various applications in soil science and environmental management.

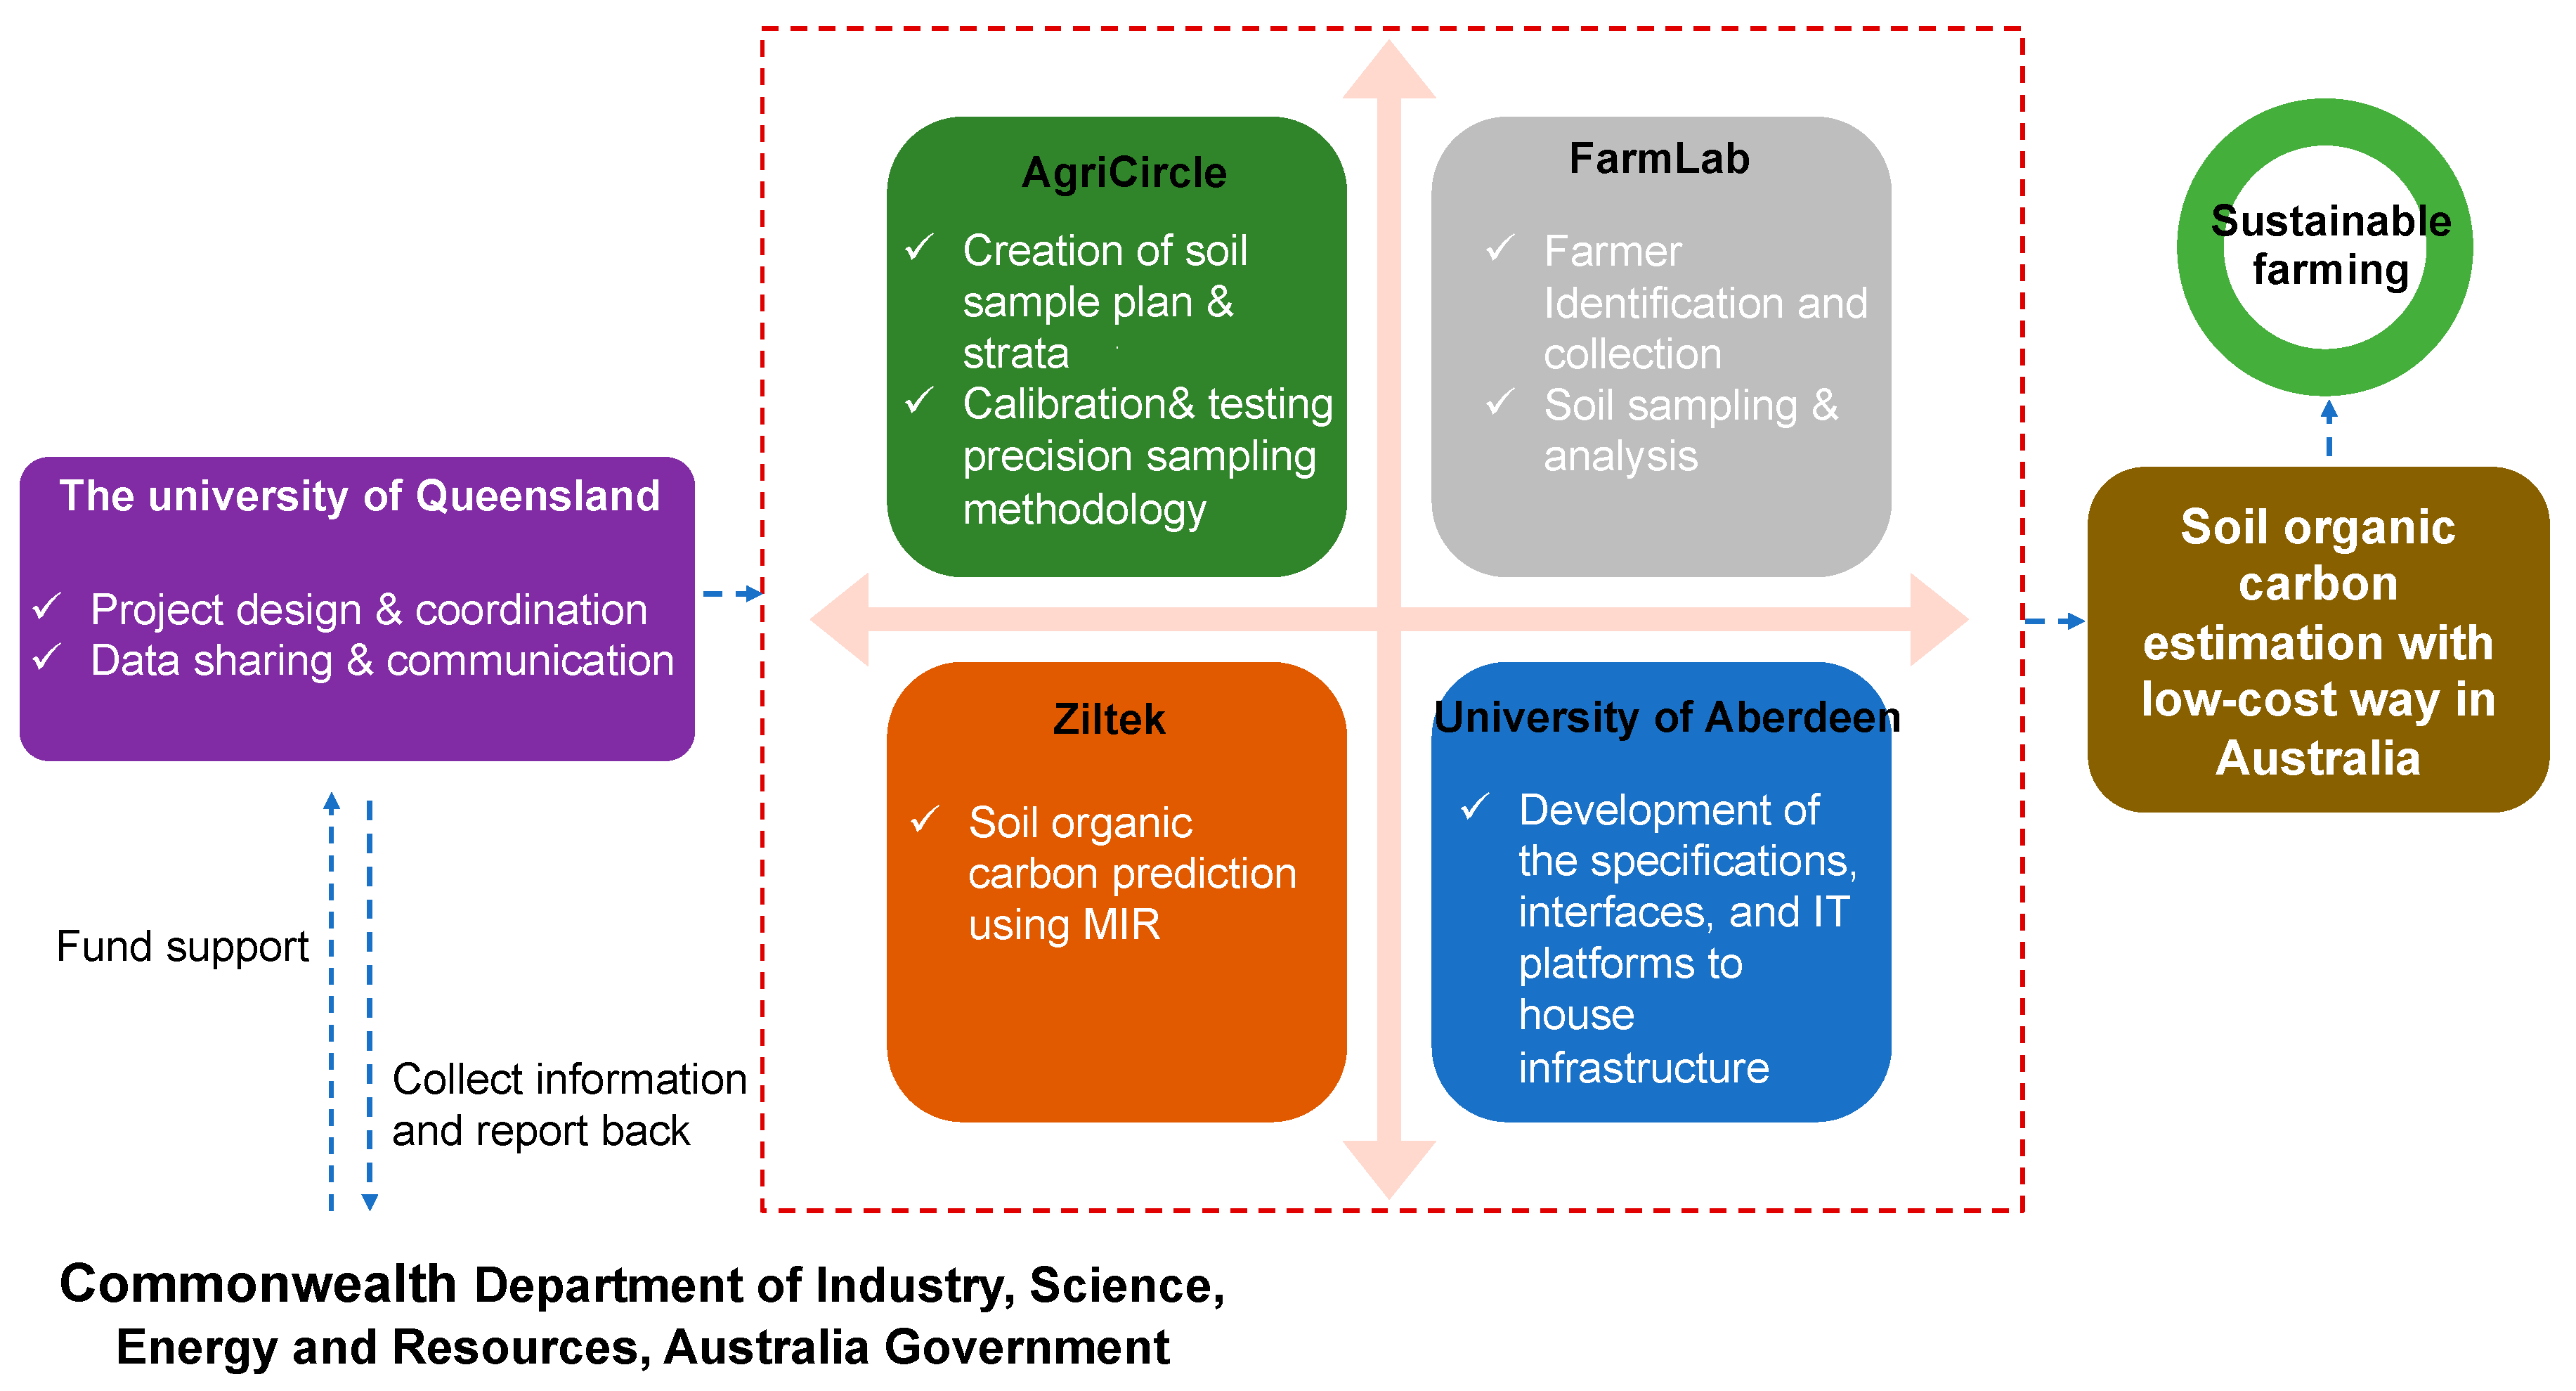
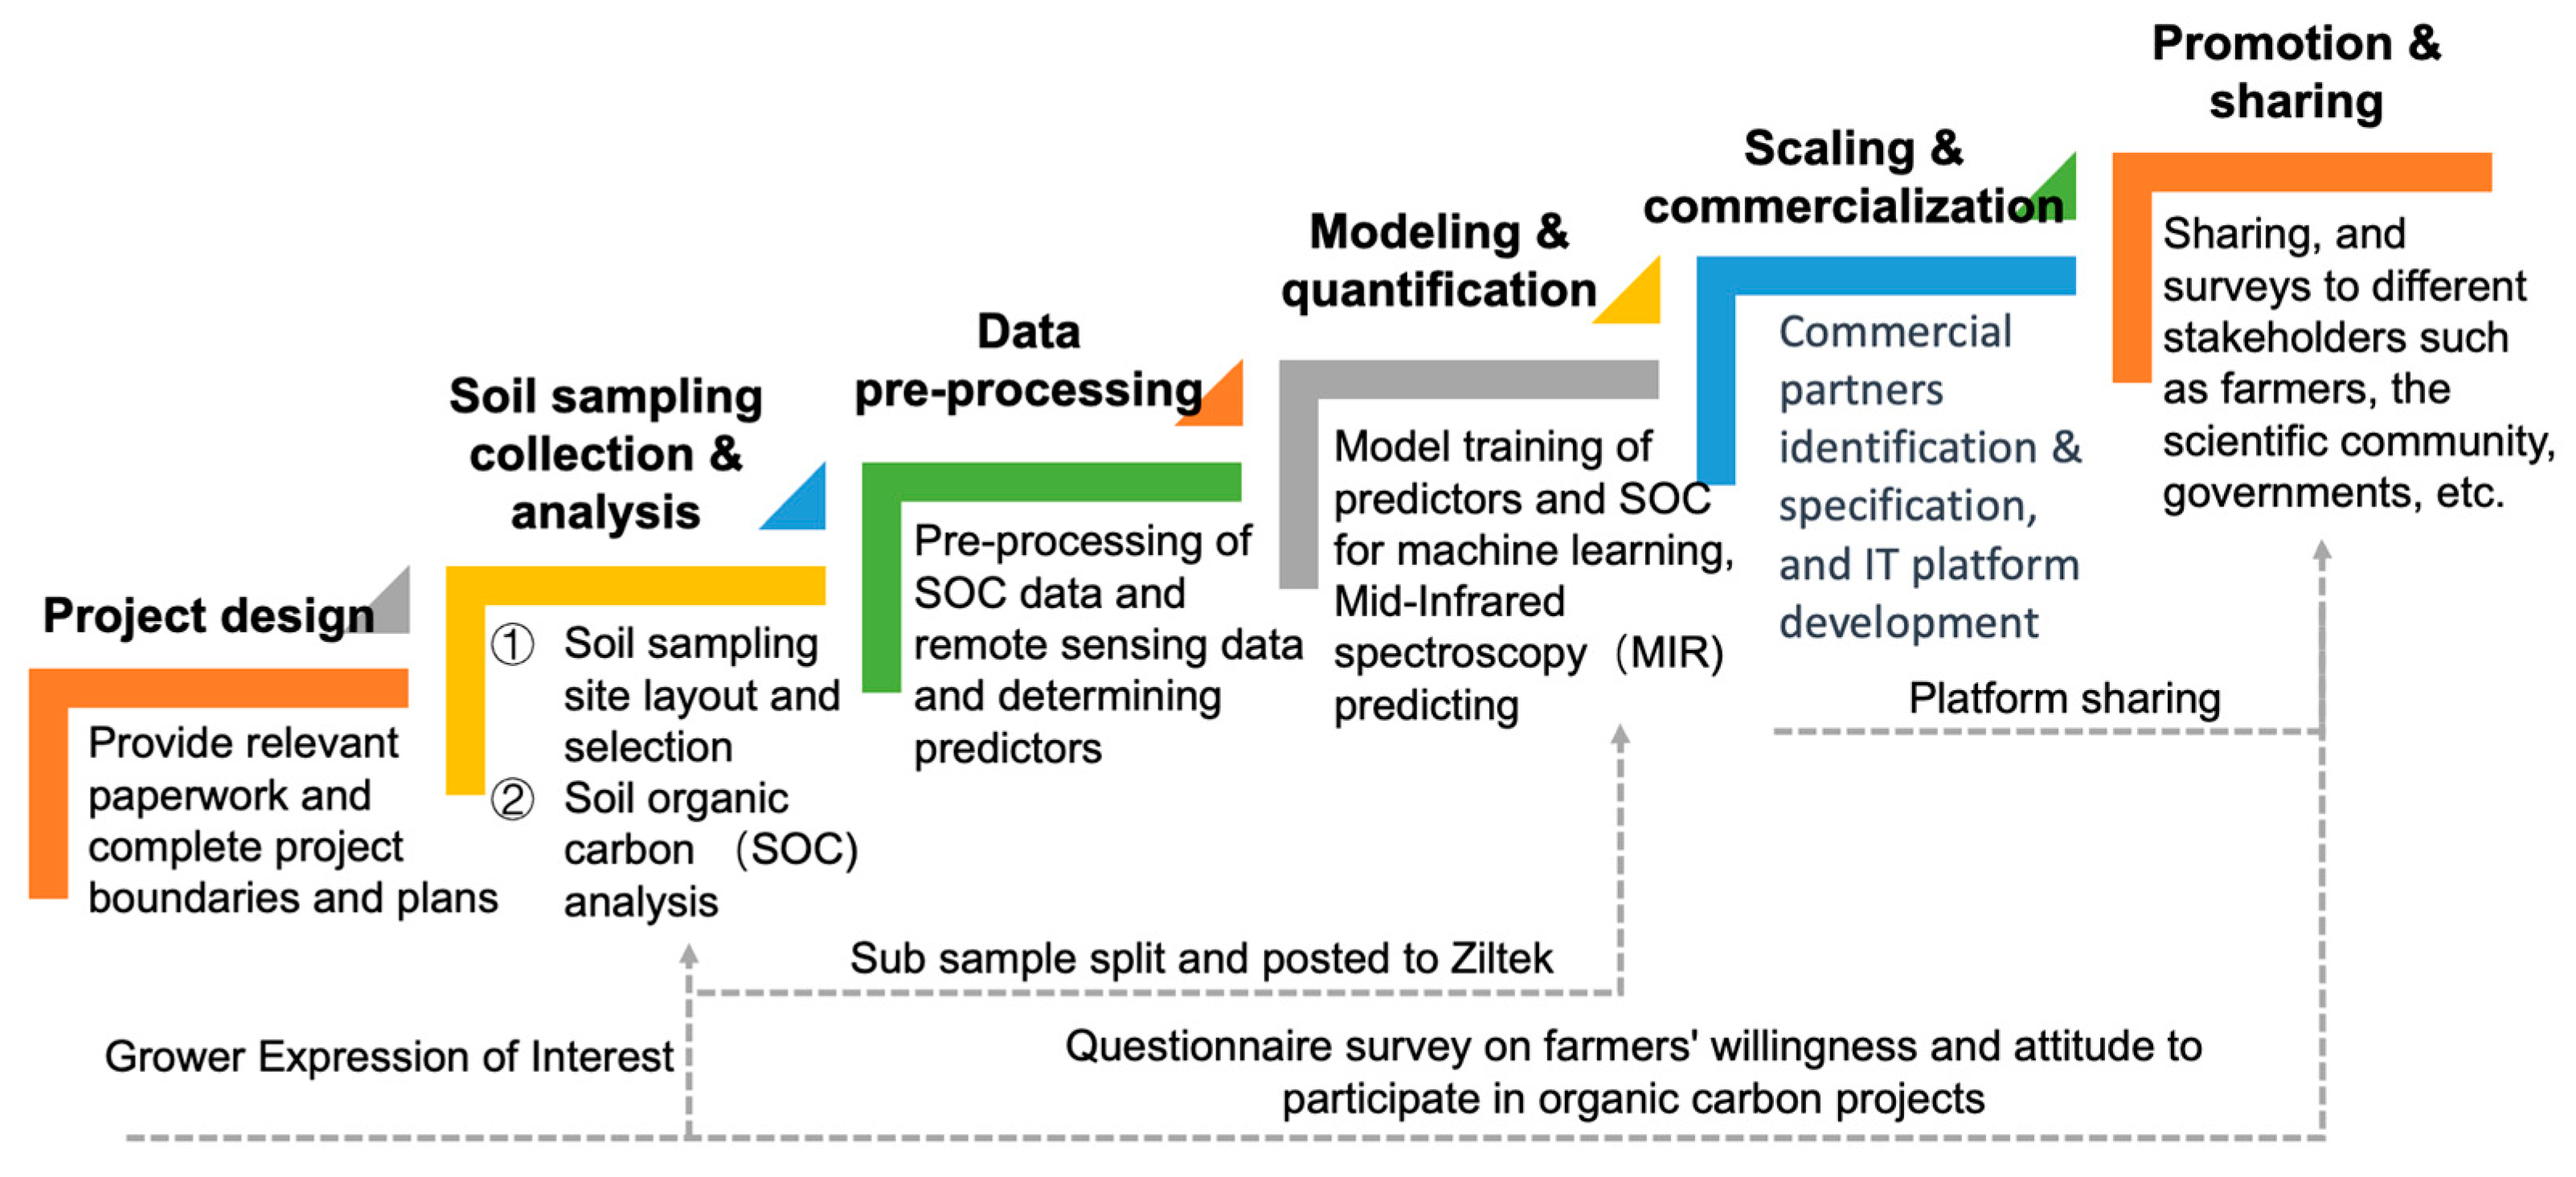
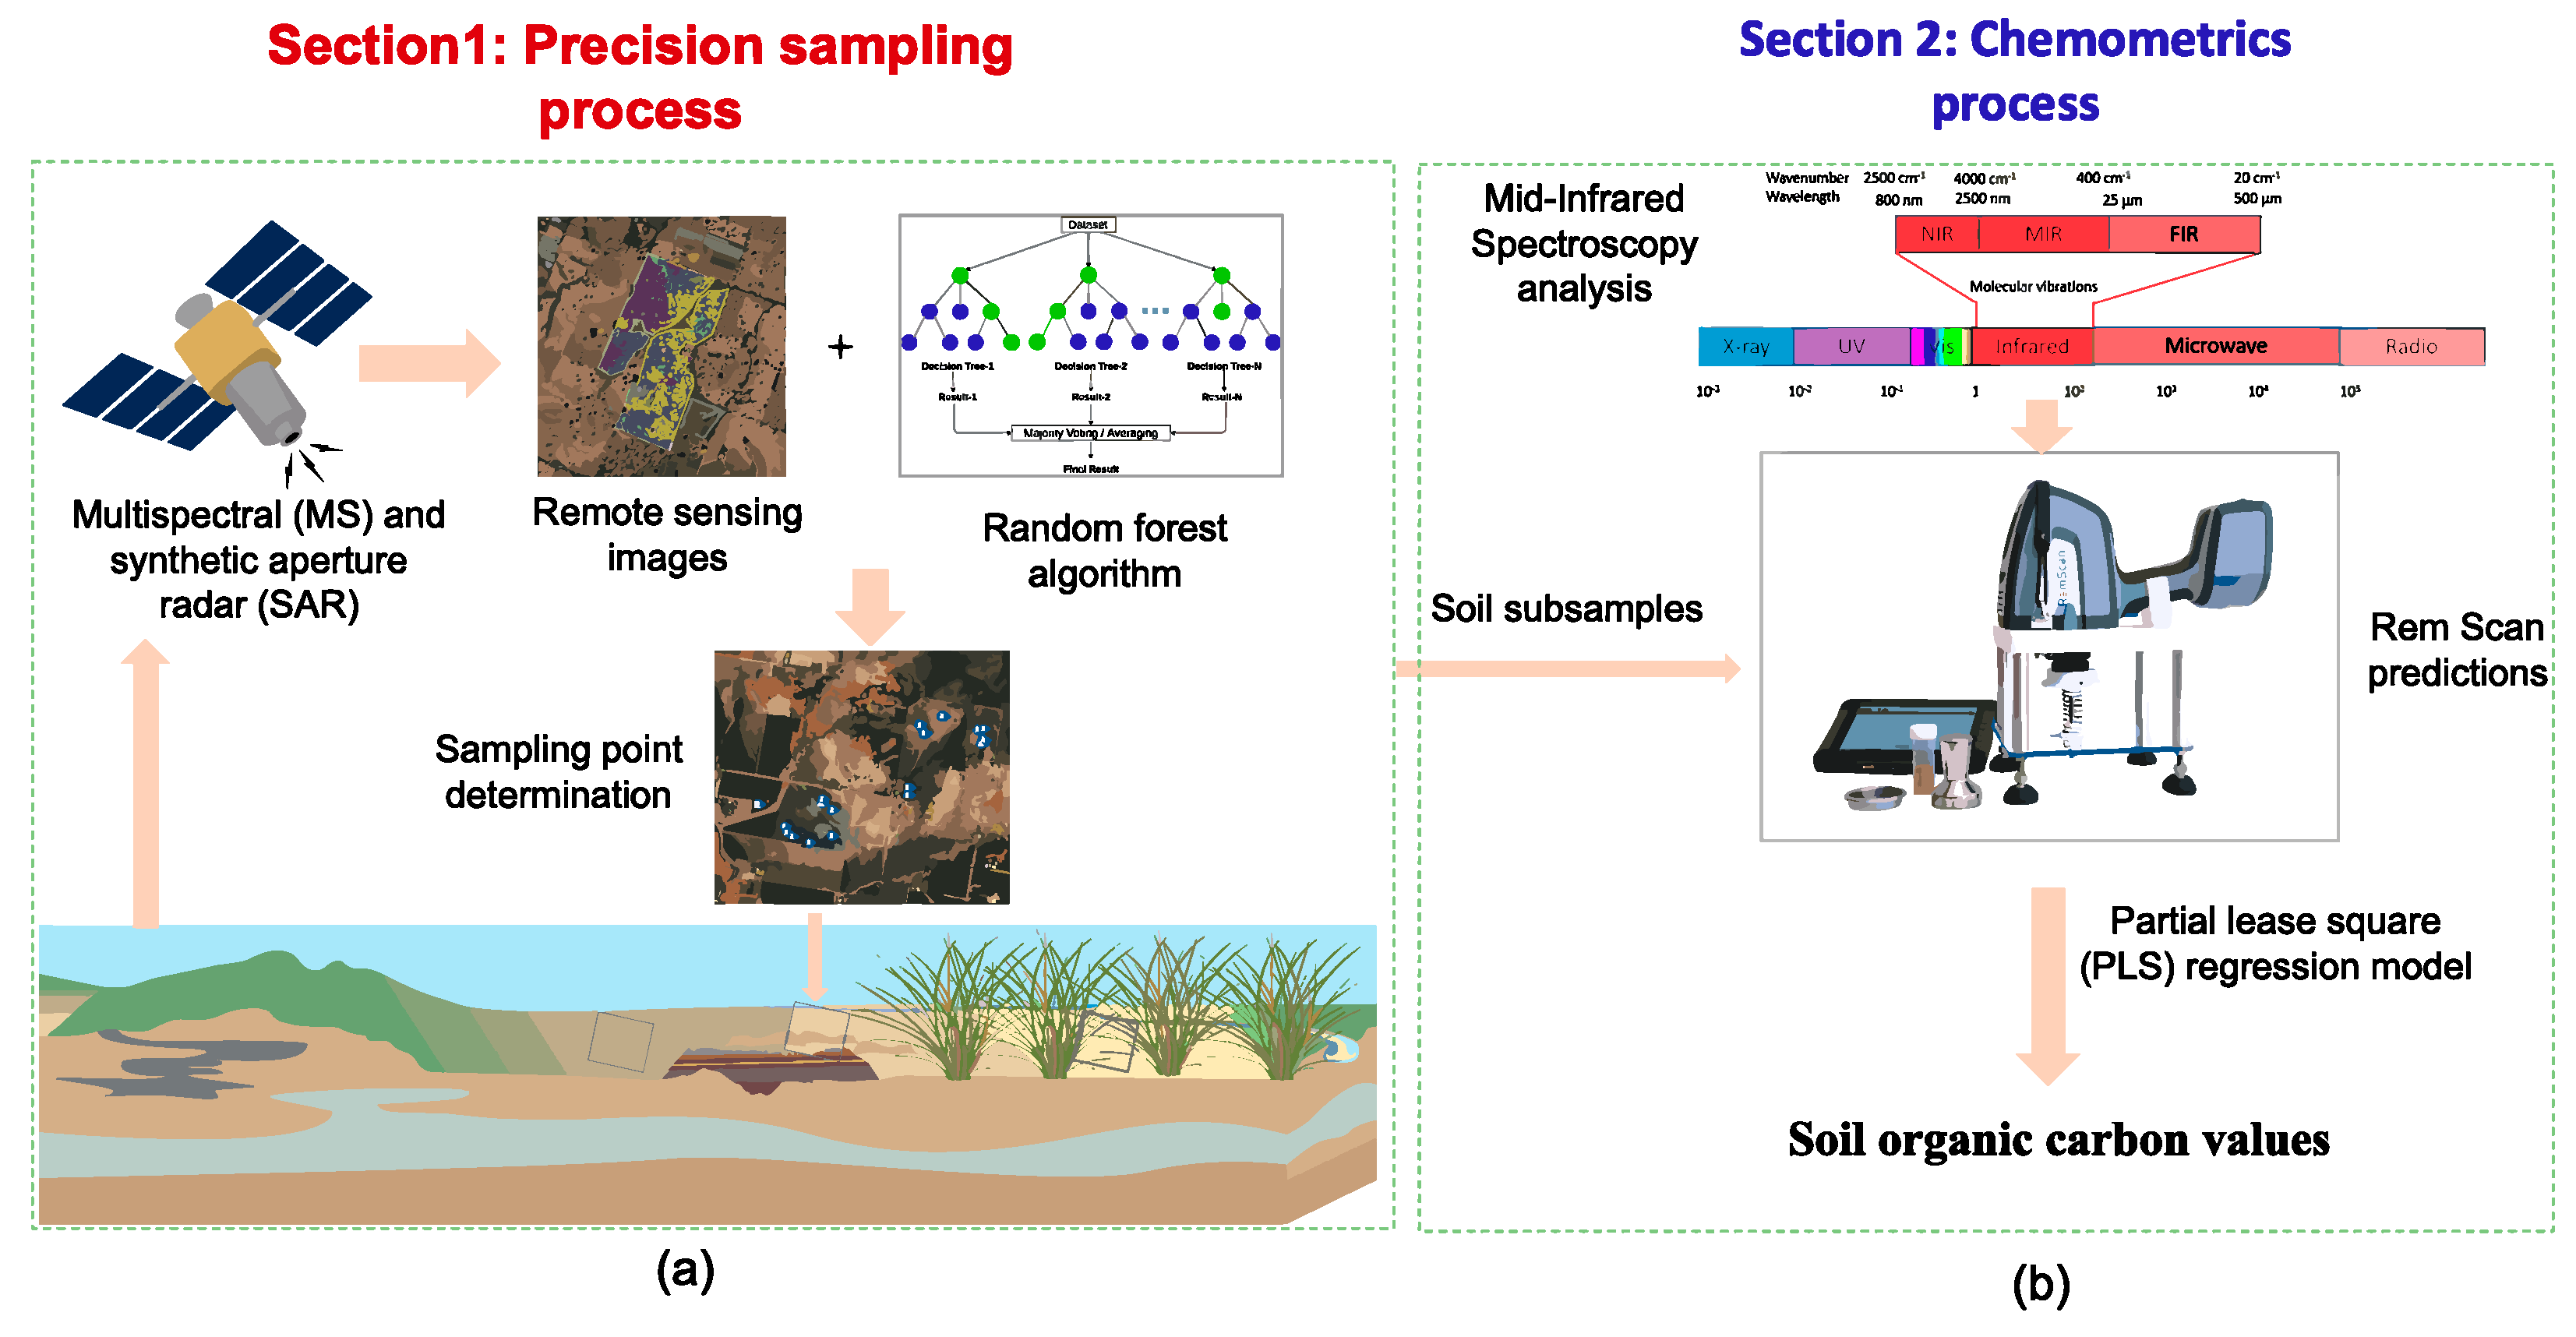
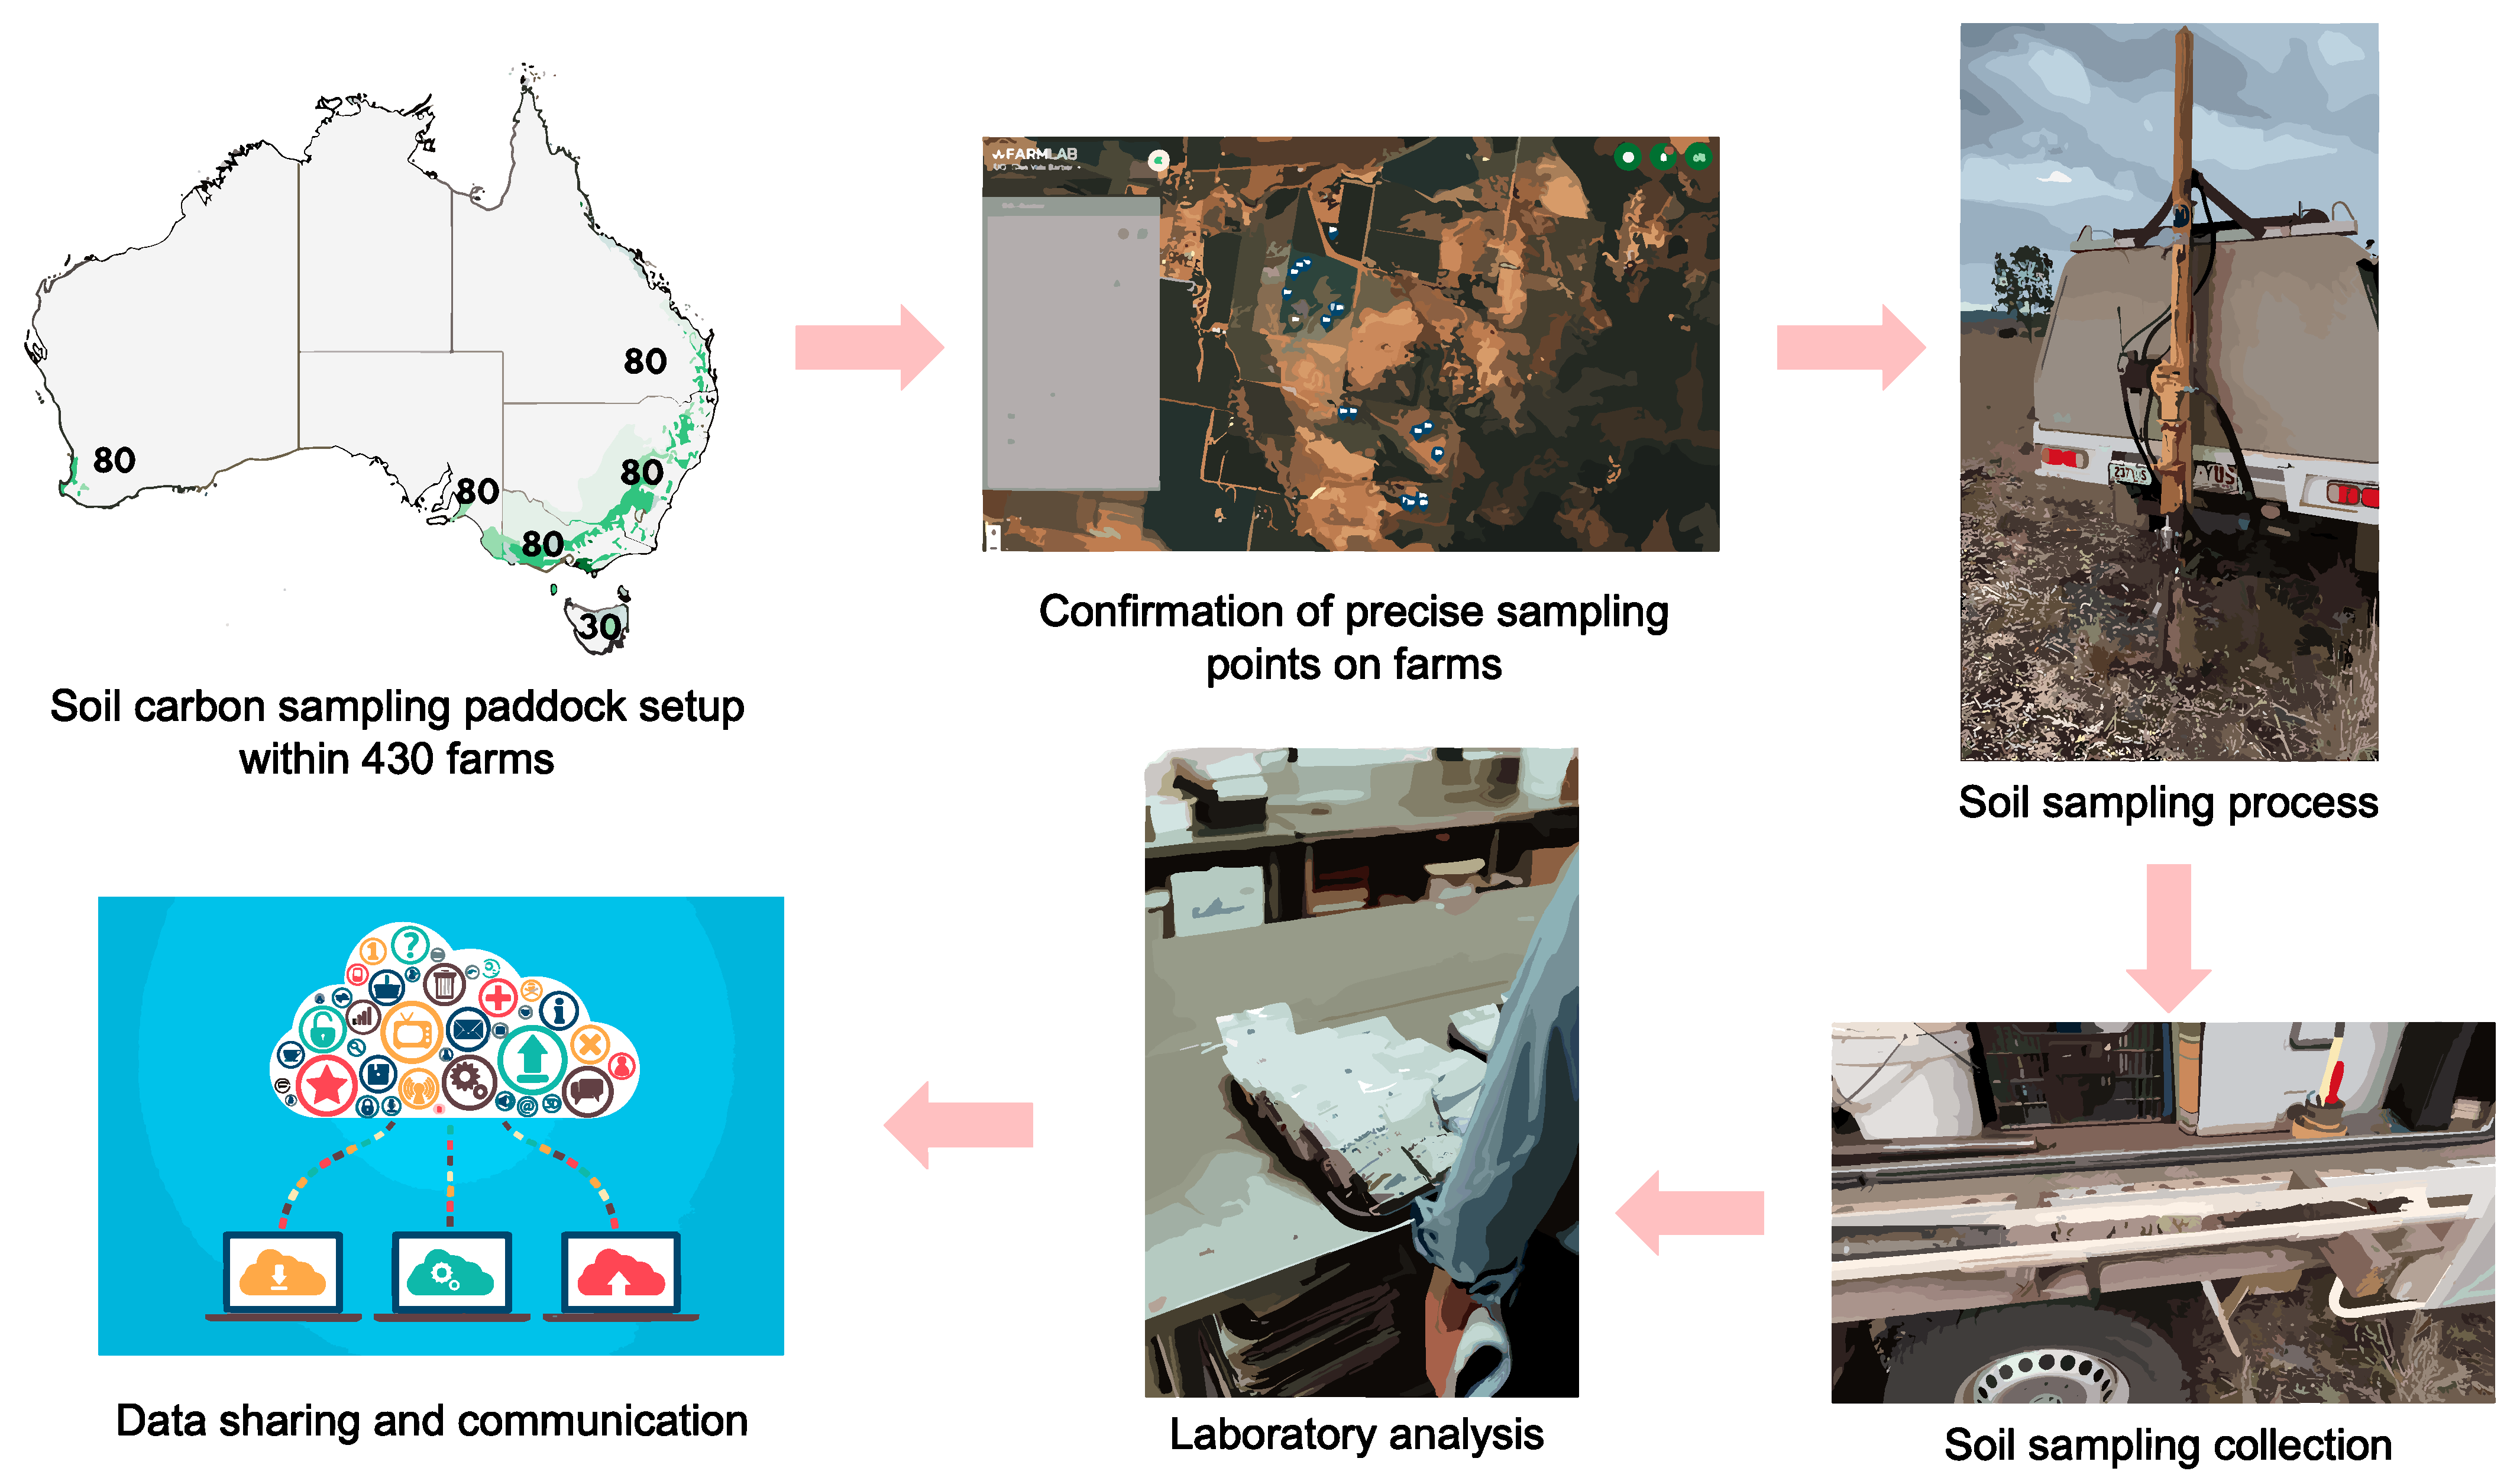
4. The Application of Integrating Remote Sensing, Machine Learning, and MIR Techniques to the Precise Assessment of Soil Organic Carbon in Australia

In this section, we present an in-depth overview of a pivotal project aimed at optimising the measurement of SOC concentrations and estimation of SOC stocks in Australia. The project is funded by the Commonwealth Department of Industry, Science, Energy and Resources (Australia), and constitutes a collaborative effort involving multiple scientific disciplines. Key partners in this endeavor include the University of Queensland, FarmLab, AgriCircle, the University of Aberdeen, and Ziltek, (Figure 1).
The overarching objective of this groundbreaking initiative was to substantially reduce the cost associated with SOC measurement while concurrently enhancing the accuracy and efficiency of estimating SOC in Australian soils. To achieve this, the project deploys an innovative fusion of remote sensing, machine learning, and MIR. By synergising remote sensing with advanced machine learning algorithms, our project aims to refine the stratification of carbon estimation zones, ultimately reducing the number of sampling points needed to generate high-resolution SOC maps. Moreover, the integration of MIR with the remote sensing and machine learning methodology leads to a more cost-effective alternative to traditional laboratory analysis, thereby further reducing the overall analysis expenditure including reducing the efforts of scientific manpower. This approach empowers the stakeholders to make more accurate predictions regarding SOC concentration and stock in soil.
In addition, we have conducted a comprehensive examination of the uncertainty of SOC estimation in Australia, as depicted in Figure 2. This figure provides a striking visual representation of the prevailing challenge, portraying an uncertainty map of SOC of the country, with varying color intensities denoting uncertainty level. Notably, the map uncovers alarmingly high uncertainty levels across Australia, particularly in the central and western regions. Given this pressing international context and the critical need to address these challenges, our research aims not only to attain the accuracy of SOC estimation but also to significantly reduce associated costs and resources. In this global context, our dedication to research efforts in SOC estimation and cost-effectiveness is significant.
Precision sampling was used in this project. AgriCircle, one of the participating units (Figure 3), has developed a novel methodology that utilises multi-dimensional statistical methods to process remote sensing data and recommends representative sampling locations, which are then combined with the outputs of the machine learning models to increase the predictive accuracy of SOC estimation. This method primarily utilises multispectral (MS) and synthetic aperture radar (SAR) images from the Copernicus mission, predominantly collected during periods of sparse vegetation in agricultural fields, capturing high-resolution satellite imagery containing soil-related data [67]. The central focus of the research lies in predicting the spatial distribution of soil zoning and topsoil properties, such as Soil Organic Matter (SOM), within the agricultural fields using a random forest algorithm. To achieve this goal, a comprehensive survey was conducted on samples collected from 120 different fields. Following model training, the prediction accuracy for SOM was 83%. This received strong support from a high level of agreement with observations made by farmers [67]. This approach significantly reduces the number of required sampling points compared to traditional methods while maintaining high prediction accuracies. The optimisation and validation of this methodology will be conducted based on the results obtained from extensive site identification and sampling activities across different regions in Australia. Ziltek, another participating unit, specialises in MIR and has developed custom calibrations for SOC prediction (Figure 4). The current SOC model is built exclusively on South Australian agricultural soils. All of these samples are surface measurements (0–30 cm) and were analysed using the Walkey–Black method. This is significantly different from the dry combustion method used in the current study. As such, we expect there to be some systematic differences in the predictions. The calibrations have shown promising precision levels in initial testing. However, further data collection and calibration are necessary to test a broader range of soils and land uses, ensuring the applicability and robustness of the MIR method under Australian conditions.
Furthermore, the project also includes activities related to scaling and commercialising the measurement services developed. AgriCircle will collaborate with FarmLab and other partners, such as Nestlé, to build an open platform that connects farmers with carbon schemes. This platform will facilitate data collection, credit allocation, and engagement of landholders in SOC monitoring. Throughout the project, the University of Queensland and the University of Aberdeen provide expertise in project management, the validation of methodologies and platforms, and the communication of project findings to the scientific community. Overall, this project represents a significant effort to optimise SOC measurement in Australia by leveraging the potential of remote sensing, machine learning, and MIR (Figure 3). By reducing measurement costs, with less technical manpower and improving prediction accuracy, and facilitating the integration of farmers into carbon schemes, the project aims to enhance knowledge of Australian soils and improve their productivity.
In addition, the project will identify two SOC estimation areas per site at 430 locations spanning Western Australia (WA), South Australia (SA), Tasmania (TAS), Victoria (VIC), New South Wales (NSW), and Queensland (QLD). These sites will encompass major soil types found in cropping and grazing regions. At each site, we will provide landholders with the opportunity to assess SOC levels in two distinct areas characterised by different land management practices or land uses. Figure 5 demonstrates the process of soil sample collection during the course of the project. This approach allows us to examine the impact of varying management strategies on SOC and serves as an effective tool to engage landholders and promote active SOC monitoring.

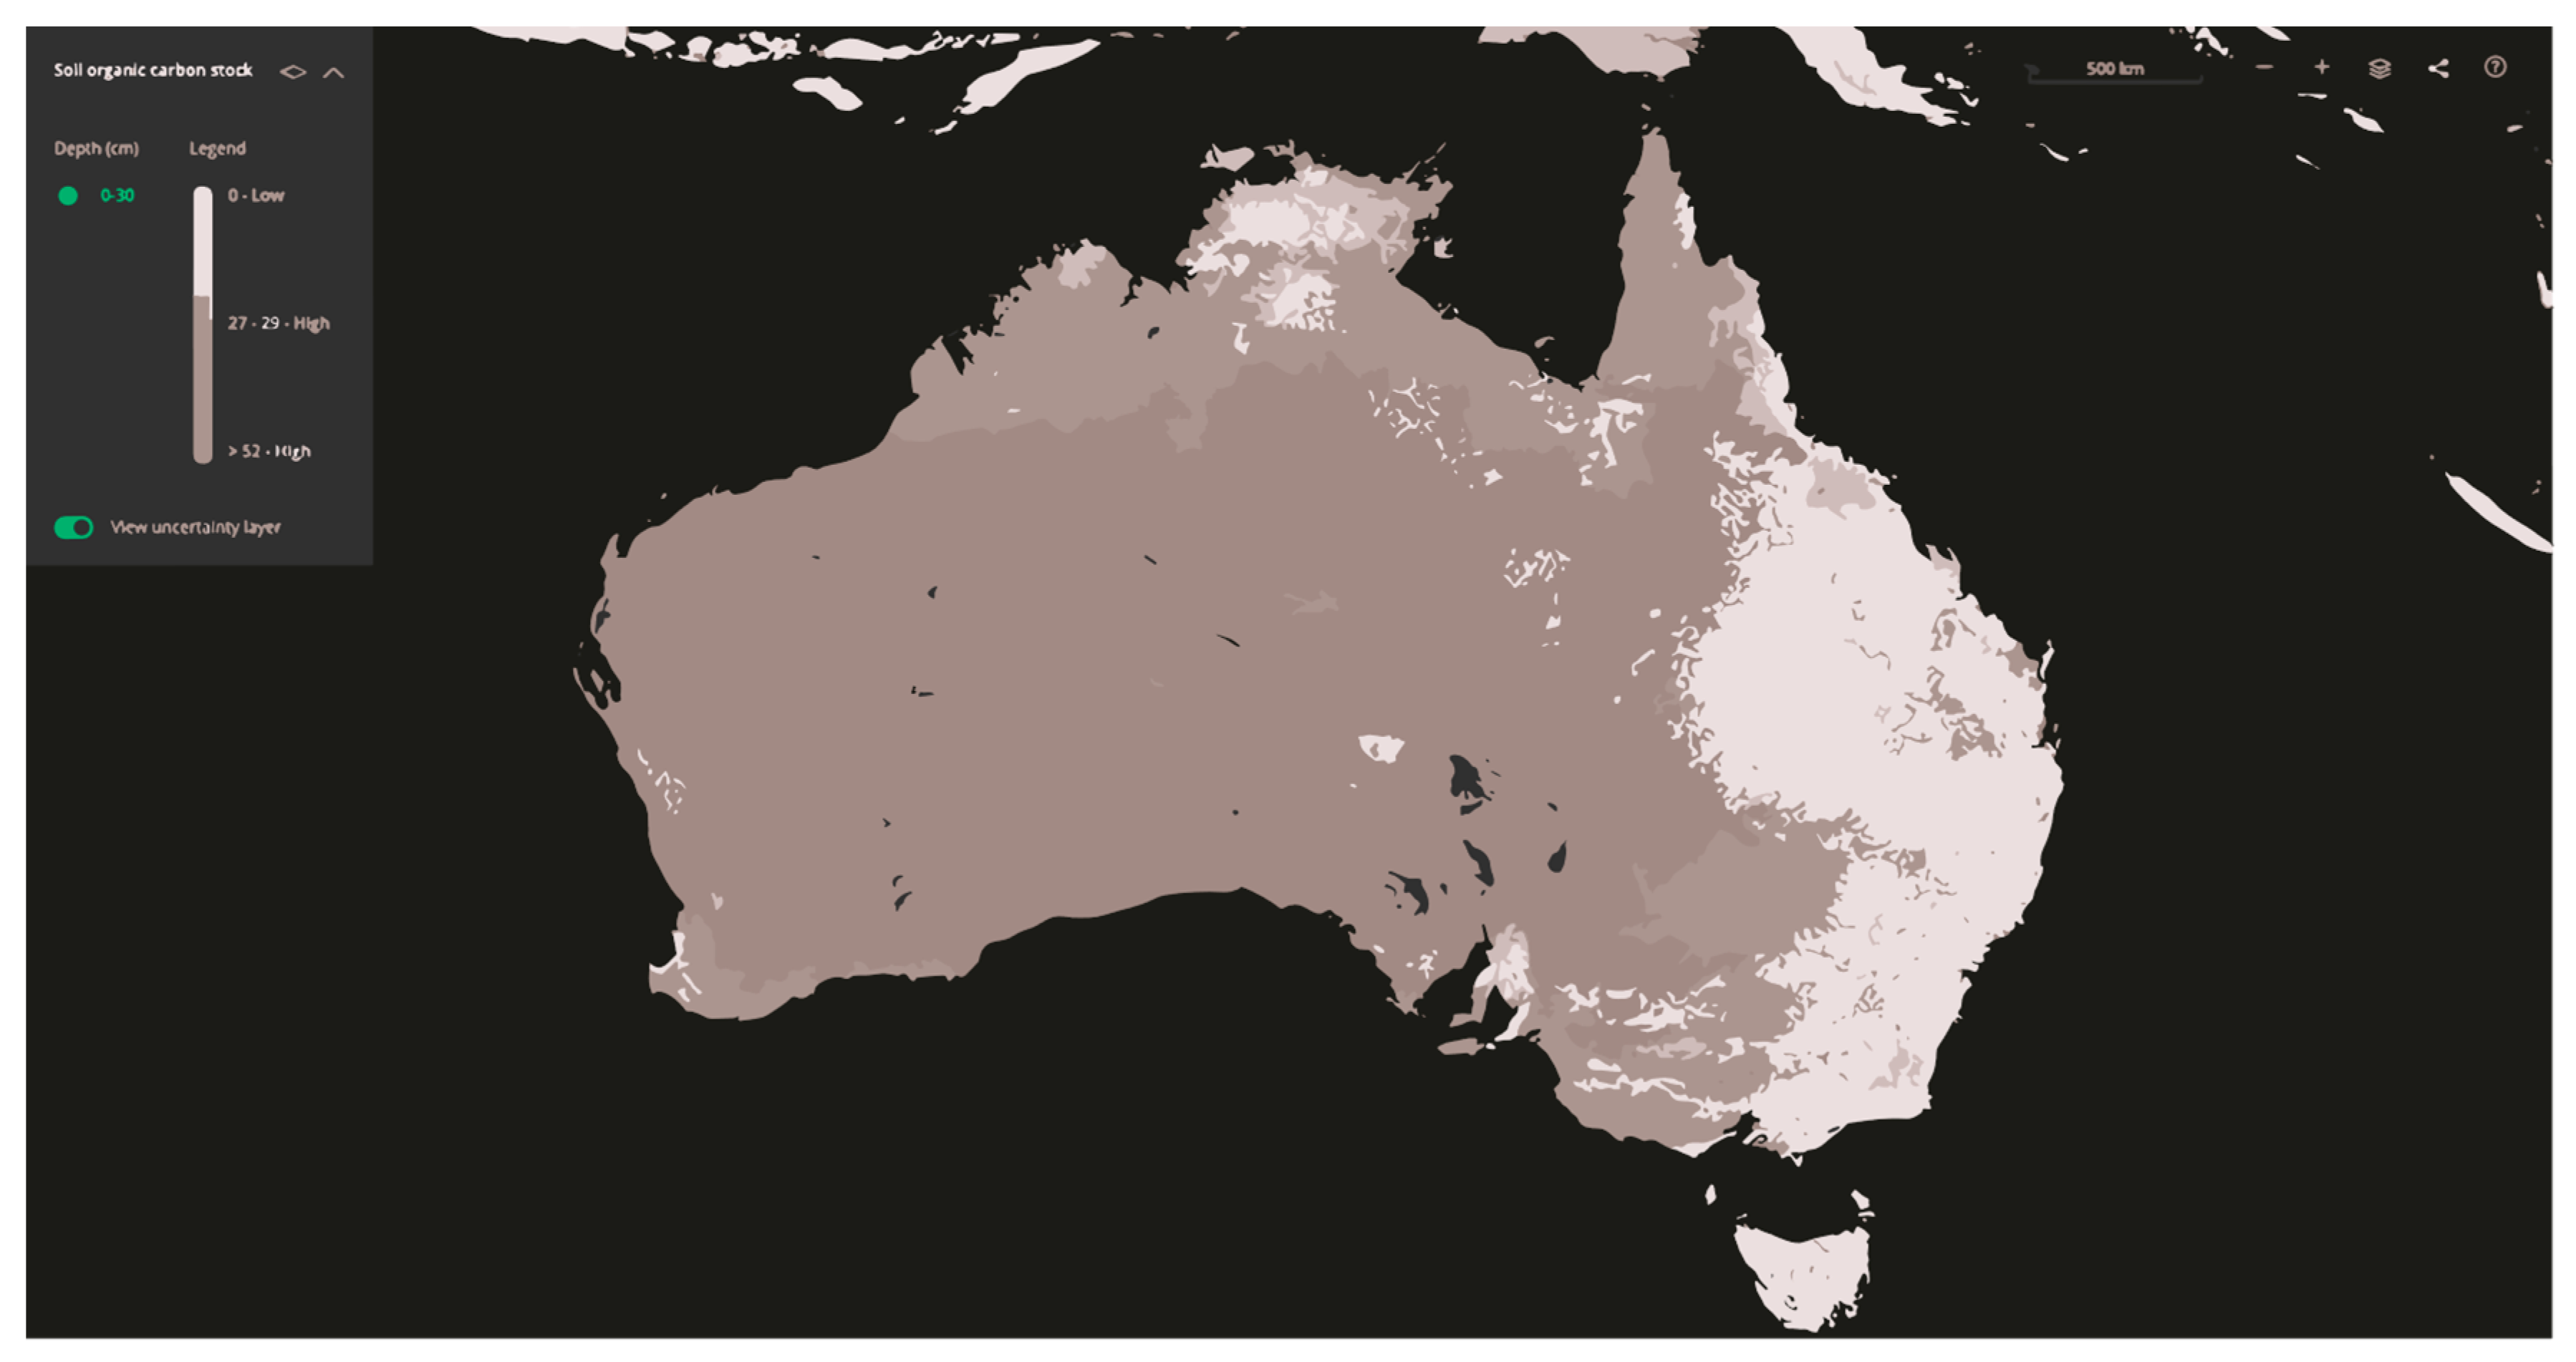
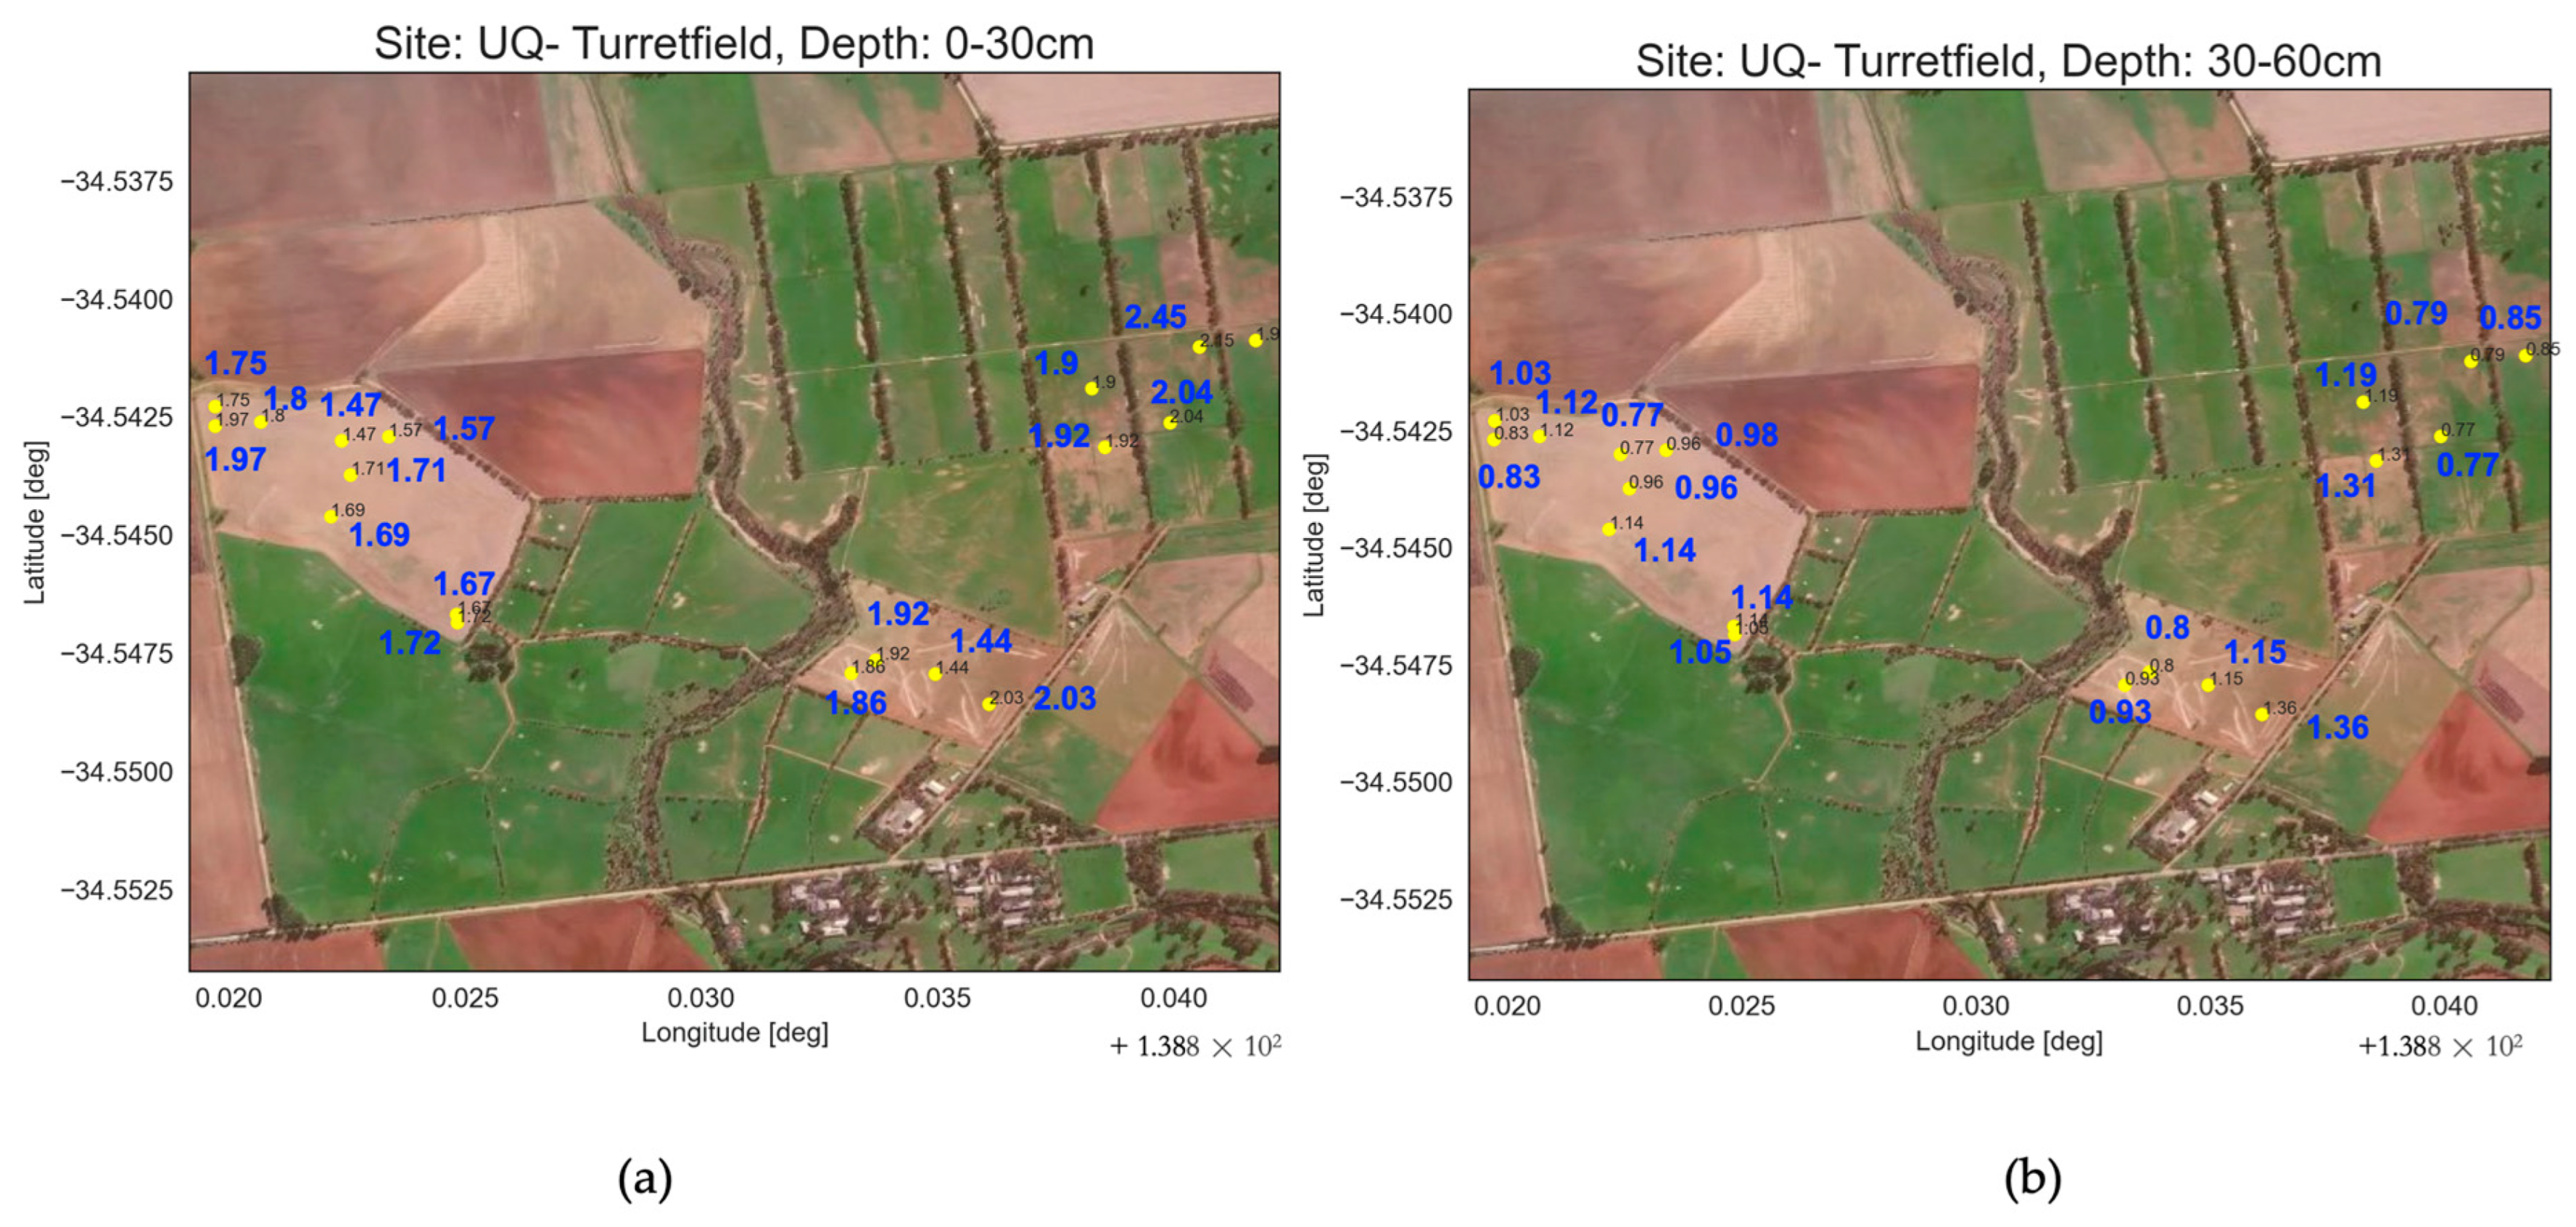
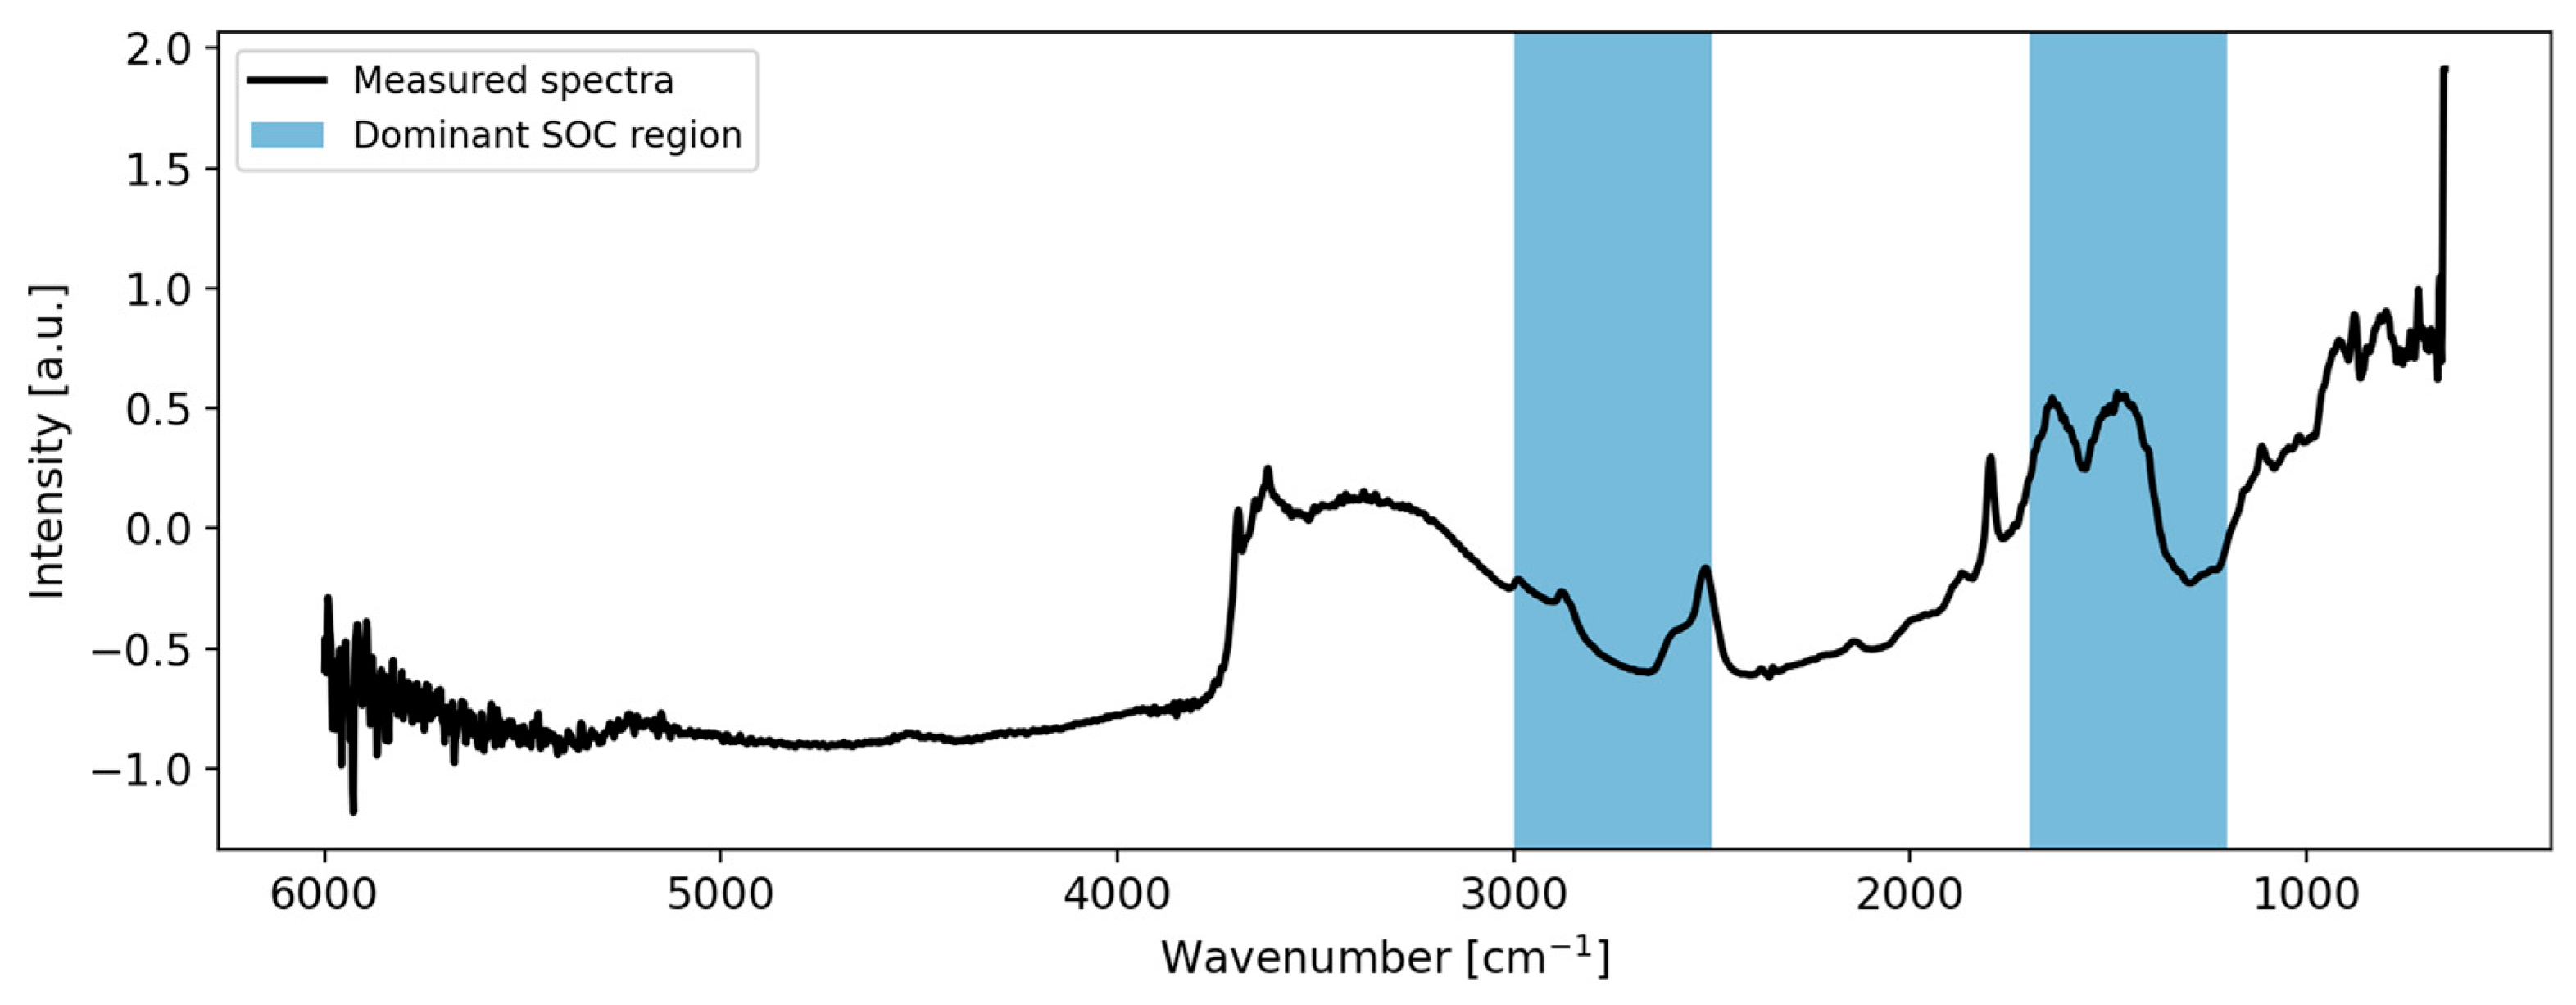
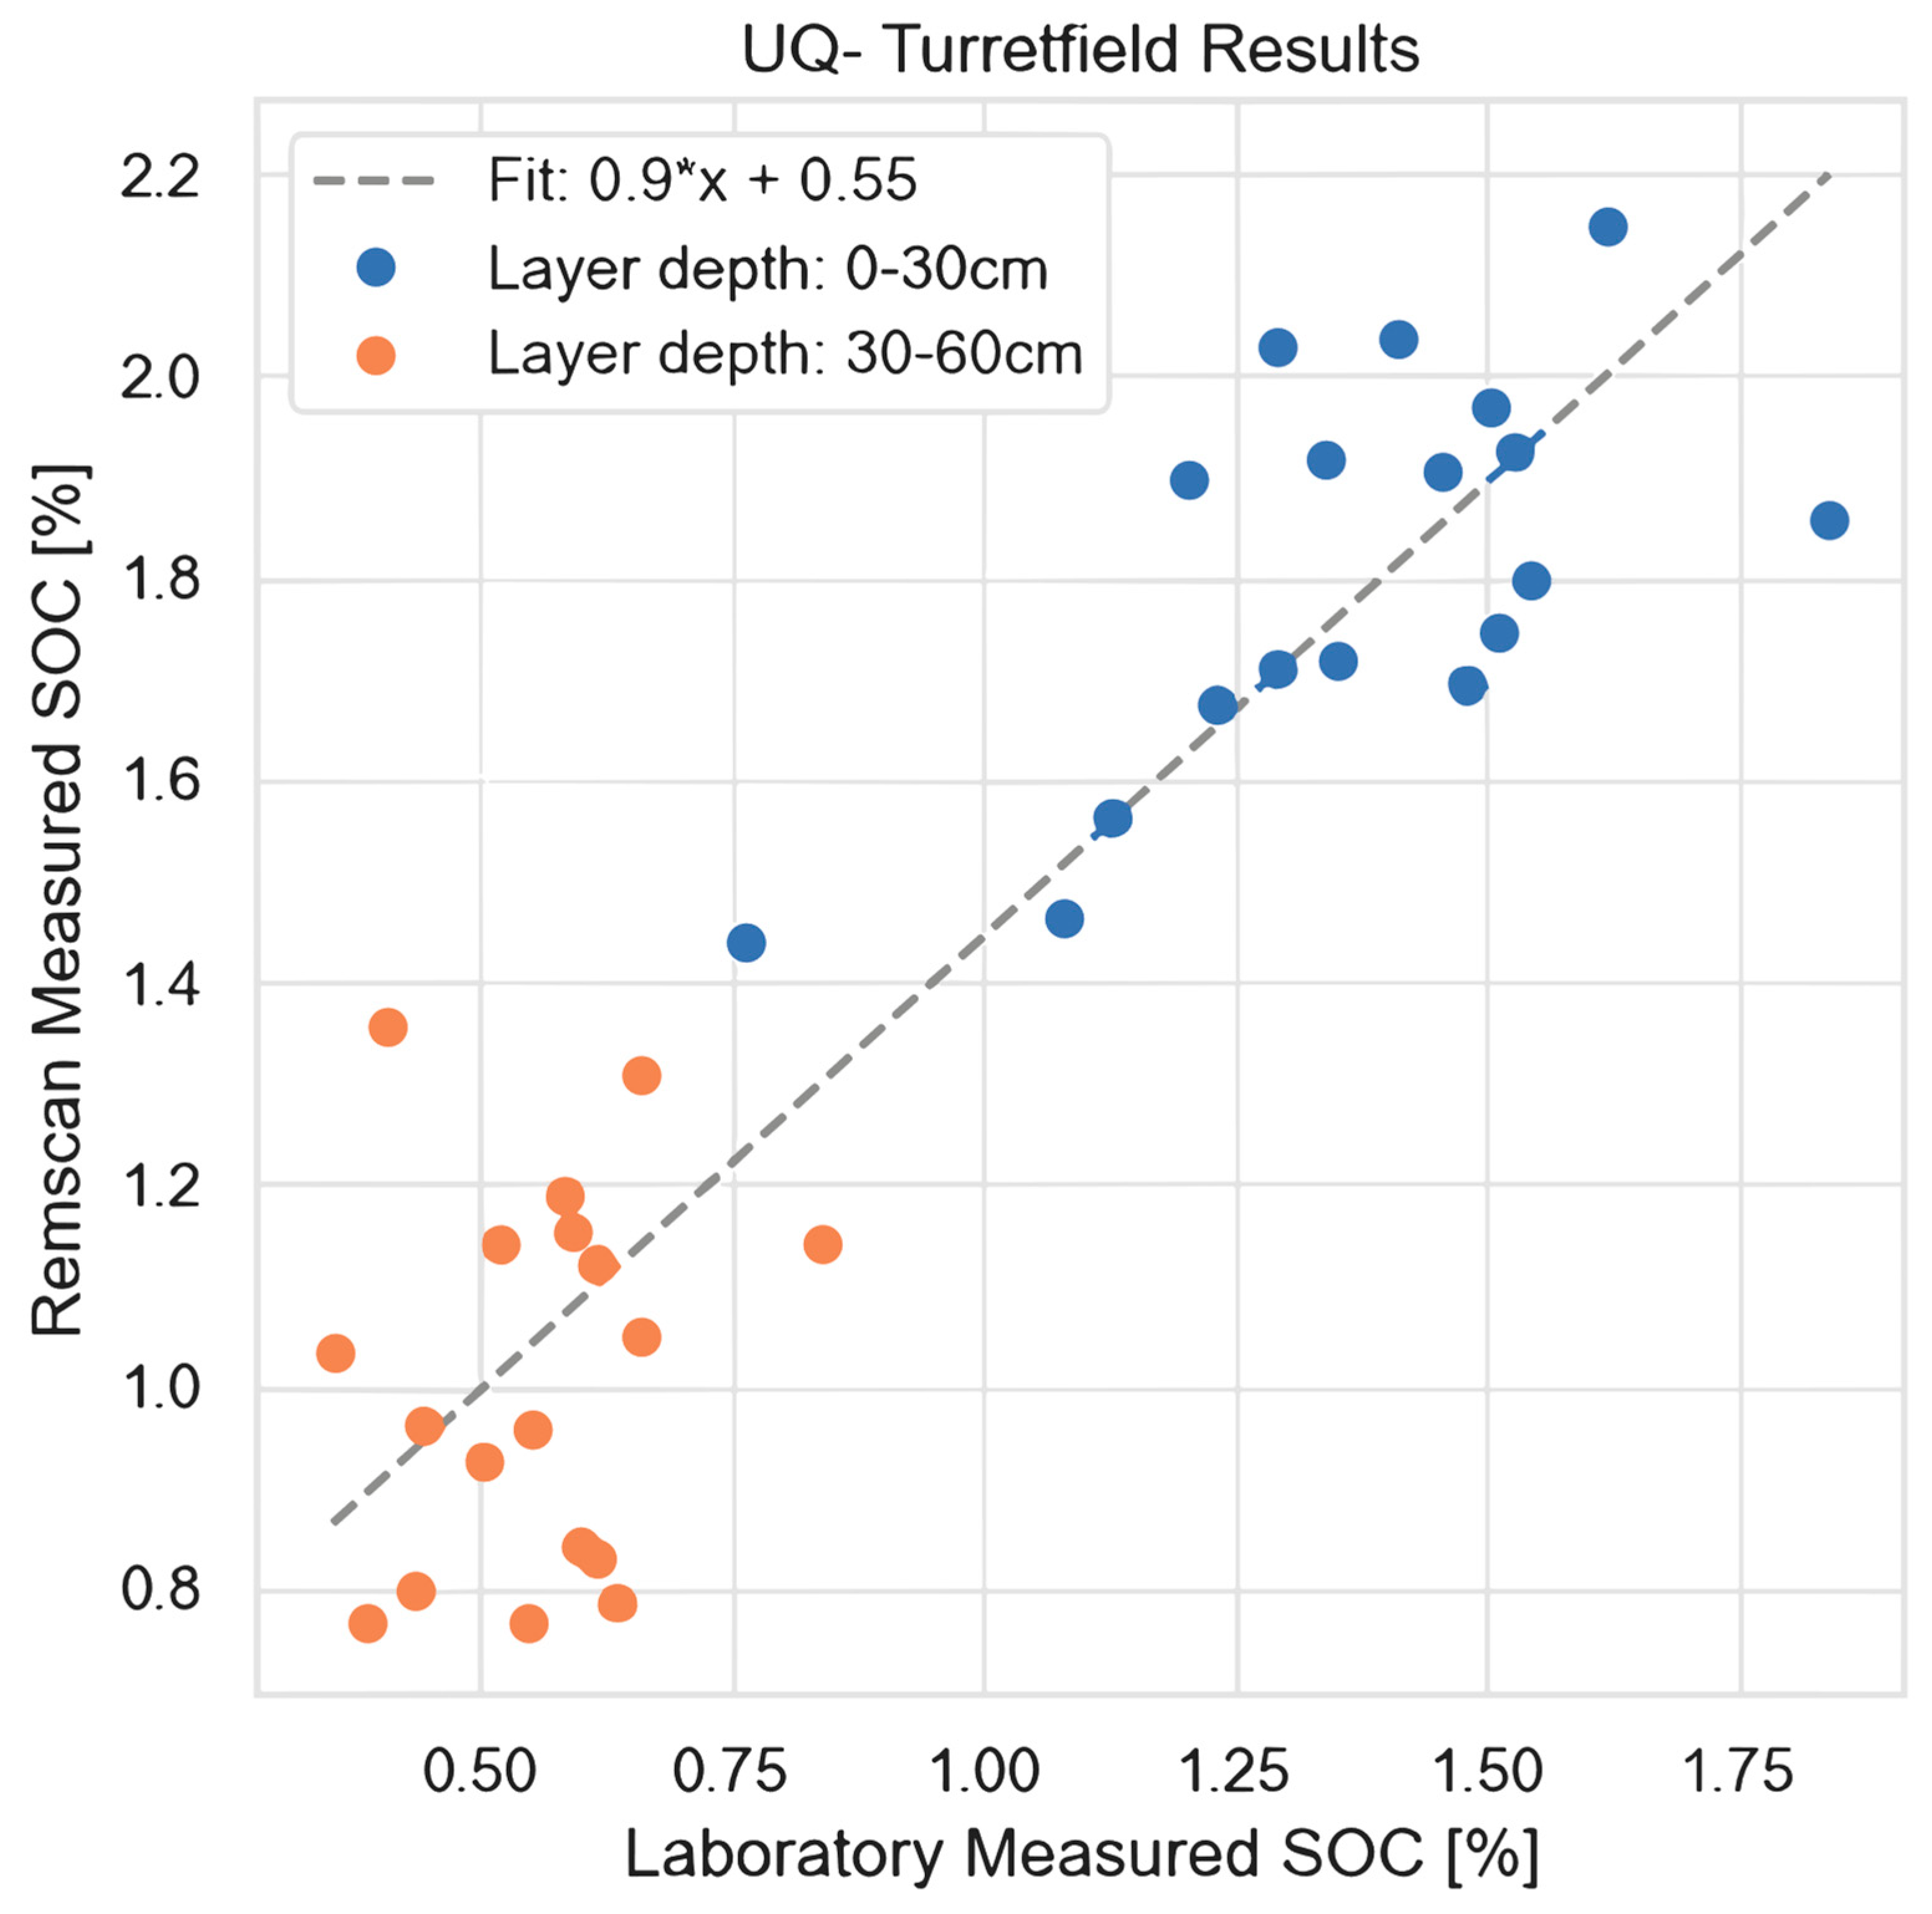
5. Preliminary Results and Discussion

A total of 36 samples were collected from two distinct soil depth intervals (0–30 cm and 30–60 cm) to capture a representative profile of the site’s SOC variability. The sampling locations, as depicted in Figure 6, were chosen based on the precision sampling method by AgriCircle to ensure comprehensive coverage of the geographical heterogeneity present at the site. We have conducted a detailed analysis of soil samples from the Turretfield reseach site (farm) using MIR. All samples were promptly scanned in situ using the RemScan (a portable MIR spectrometer, Manufacturer is Ziltek, Adelaide, Australia), which offers a spectral range for the MIR is 2 μm to 13 μm, and the resolution is 8 cm−1, providing immediate spectral data indicative of SOC content. Subsequently, these samples were also sent to an accredited laboratory for SOC analysis using the dry combustion method, which is a standard procedure for SOC quantification due to its accuracy and reliability. This dual approach allows for a robust comparison between rapid, field-based MIR readings and conventional laboratory measurements.
In Figure 7, we present the comparison between Rem Scan-predicted SOC values and laboratory-measured SOC values. The line of best fit is also overlaid on top and indicates a good fit (R2 = 0.83). Table 1 shows SOC density varies with depth: higher (1.44–2.15 g/cm³) at 0–30 cm with more variation, and lower (0.767–1.36 g/cm³) at 30–60 cm with less variation. We want to clarify that the PLSR model used in our study is a pre-trained model. However, we applied additional steps to optimize its performance, as outlined below. The pre-trained model was constructed using an agronomy database, consisting of approximately 246 training samples and 106 testing samples. The division of data into training and testing sets was carried out using the Kennard Stone algorithm. Here, we need to point out that the current preliminary results do not separate samples based on depths. The current SOC model is built exclusively on South Australian agricultural soils. All of these samples are surface measurements (0–30 cm) and were analysed using the Walkey–Black method. This is significantly different from the dry combustion method used in the current study. As such, we expect there to be some systematic differences in the predictions. With this in mind, the Supplementary Materials includes some additional information about the Ziltek Walkey–Black SA SOC model currently used for SOC predictions (R2 = 0.91).
To enhance the model’s predictive accuracy, we applied a linear baseline correction to remove any underlying trends in the data. The training data was then subjected to a leave-one-out cross-validation approach within the PLSR framework. This iterative process helped us evaluate the model’s performance and select the optimal configuration that minimizes the mean square error.
Regarding Figure 8, it illustrates the dominant SOC region employed by the PLSR model for predicting SOC concentrations. This information is derived from the Variable Importance in Projection (VIP) scores. The VIP scores represent the importance of each variable (wavelength) in the model. Higher VIP scores indicate variables that significantly contribute to the prediction, while lower scores are less influential. To optimise the performance of our PLS regression model, we employed leave-one-out cross-validation, ensuring that each data point contributed to validating the model’s accuracy. In Figure 8, we present the Variable Importance in Projection (VIP) scores derived from the PLS model. This visualisation highlights the variables that play a crucial role in the model, thus providing insights into the key drivers of SOC variability.

6. Commercialization and Potential Application in Australia

The commercialization of SOC measurement technology based on an integrated methodology approach holds substantial promise for Australian agriculture, particularly in the context of carbon markets and sustainable farming. This promise stems from several key factors. Firstly, precise SOC measurement is essential for participation in carbon markets, allowing farmers to quantify and verify their carbon sequestration efforts, potentially increasing their revenue through carbon credits or offsets. Secondly, integrated SOC measurement aids in implementing sustainable farming practices by providing accurate assessments of SOC concentration and stock and its spatial distribution. This informs decisions on soil management, crop rotation, and organic matter turnover, resulting in more sustainable and productive agriculture. Additionally, it helps farmers comply with environmental regulations and demonstrates their commitment to environmental stewardship. Furthermore, the commercialization of this technology can drive research and development, fostering innovations in remote sensing, machine learning, and data analytics.
These innovations benefit not only Australian agriculture but also global climate change mitigation efforts. Finally, the integrated approach’s economic viability makes it accessible to a wide range of farmers, promoting its adoption and supporting the transition to sustainable and carbon-conscious agricultural practices. In essence, the commercialization of integrated SOC measurement technology aligns with carbon markets, enhances sustainability, ensures compliance, fosters innovation, and offers cost-effective solutions, benefiting both individual farmers and broader environmental and economic goals. By integrating remote sensing, machine learning, and MIR, the cost of SOC measurement can be significantly reduced, making it more accessible to farmers and potentially revolutionizing carbon trading markets.

6.1. Decreasing the Cost of Carbon Monitoring

The decreased cost of carbon monitoring and the systematic approach to measuring SOC over time is essential for Australian farmers [68]. By optimizing AgriCircle’s precision sampling techniques across a broad spectrum of soil types and land uses in Australia, and coupling this with MIR, the cost of SOC measurement can be decreased significantly [67]. Precision sampling and MIR, once calibrated for a site, can also significantly reduce the cost of sampling over time, thus enabling more frequent monitoring at a significantly reduced cost.

6.2. Facilitating Entry to Carbon Markets

This technology also has the potential to decrease barriers for farmer entry into carbon markets and increase economic opportunities by building confidence among farmers with science-based technological information [69]. With further validation and testing to reach a high Technology Readiness Level (TRL), the plan is to run trials with carbon developers and large food and beverage corporations like Nestlé Australia. Similar projects in Europe are in advanced stages, with Nestlé compensating farmers for carbon sequestered in their soils [70]. There is a clear opportunity to adapt this platform to the Australian emissions trading system, utilising cost-effective soil sampling solutions to help farmers obtain credits while assisting companies in meeting their sustainability targets.

6.3. Increasing Farmer Engagement

SOC measurement technology can also drive farmer engagement and interest in SOC measurement with less effort and technological requirements, leading to generating high confidence. As part of the project, farmers will be encouraged to test soils from contrasting management and land uses on their farms, exploring the impact on SOC stocks [71]. This would engage their interest in SOC measurement, driving demand for tools to monitor soil health and participate in carbon farming initiatives [72] leading to strengthening their economic capabilities.

6.4. Economic Stimulation of Regional Communities

Regional communities across Australia stand to benefit economically from the soil sampling needed for this project. Contracting regional companies for soil sampling creates employment opportunities, thus stimulating regional economies. It will also facilitate as a demonstration plot, thus leading to an increase in the opportunities for technical training for farmers besides increasing their knowledge and ability to protect the storage of SOC [73]. In addition, by measuring SOC stock in diverse climatic regions, soil types, and land uses, this project will contribute valuable data to national soil databases, aligning with the National Soils Strategy and providing long-term public benefits [74].

6.5. Formation of Collaborative Partnerships

The project fosters collaborative partnerships between research organizations, agricultural solutions companies, industry suppliers of carbon measurement services, companies seeking to purchase carbon credits, and farmers. This broad collaboration will ensure the development of scientifically rigorous, innovative, and practical measurement solutions that are well-designed and will have high acceptance by their intended end users. It offers a cost-effective solution for carbon monitoring, facilitating entry to carbon markets, fostering sustainable farming, stimulating regional economies, and encouraging collaborative efforts in the agricultural sector. Precisely, the commercial application of integrated technologies-based SOC measurement has significant potential in Australia.

7. Conclusions and Outlook

The integration of remote sensing, machine learning, and MIR represents a promising approach to measuring SOC concentration and estimate SOC stock with improved precision and reduced costs. This triad of advanced technologies offers cost-effective, speedy, and scalable solutions, addressing the need for accurate SOC measurement techniques as we strive towards sustainable agricultural practices. In Australia, the potential of these technologies has already been demonstrated preliminarily, with optimized precision sampling techniques and the utilization of MIR showing significant reductions in SOC measurement costs for farmers. Moreover, these technologies enable more frequent and precise monitoring of SOC, allowing farmers to effectively track changes in soil health over time. This integration not only enhances our understanding of SOC dynamics but also promotes sustainable land management practices, contributing to both environmental stewardship and agricultural productivity. However, in this paper, we present an analysis of 36 sample datasets, which should be considered preliminary. As more data become available, we intend to update our findings accordingly. At this stage, the limited sample size precludes the development of distinct models for varying depths and does not yet support a detailed per-farm analysis.
Preliminary analysis of the data and the proposal of the project show that the commercialisation of SOC measurement technologies can lower barriers for farmers to enter carbon markets and create new economic opportunities through building confidence, being a technology-based measurement technique. Initial collaborations with carbon developers and large corporations have shown a strong interest in these technologies, indicating promising prospects for their application within Australia’s emissions trading system. The regional economic stimulation resulting from employment opportunities and the incorporation of valuable data into national soils databases further highlights the wide-ranging benefits of these technologies. By fostering collaborations among research organisations, agricultural solutions companies, farmers, and carbon credit purchasers, innovative and practical SOC measurement solutions can be developed. Ultimately, the integration of remote sensing, machine learning, and MIR holds great potential to revolutionise SOC measurement, drive sustainable farming practices, enhance economic opportunities, and contribute to the global fight against climate change.

Supplementary Materials

The following supporting information can be downloaded at: https://www.mdpi.com/article/10.3390/rs15235571/s1, The details of the existing mode.

Author Contributions

Conceptualisation, T.L., Y.P.D., R.C.D. and T.I.M.; Literature collection, T.L., H.L. and A.X.; Funding acquisition, Y.P.D.; Methodology, T.L., A.X. and Y.P.D.; Resources, Y.P.D.; Software, T.L., D.B., S.M., G.T., S.C. and H.L.; Supervision, Y.P.D.; Writing—original draft, T.L.; Writing—review and editing, T.L., H.L., A.X., Z.X., T.I.M., O.Y., N.F., R.C.D., Y.P.D., O.M., C.S., S.D., P.R. and F.R.; Academic editing, Z.X., R.P., T.I.M., R.C.D. and Y.P.D. All authors have read and agreed to the published version of the manuscript.

Funding

This research was funded by Commonwealth Department of Industry, Science, Energy and Resources, grant number SCICDD00002.

Data Availability Statement

The data presented in this study are available on request from the corresponding author with a reasonable request. The data are not publicly available due to privacy restrictions.

Acknowledgments

The authors acknowledge the comments and suggestions from anonymous reviewers, the academic editor, and the managing editor. We extend our gratitude to Fragment Films for providing some of the photos. We would like to express our gratitude to all our project collaborators for their support and assistance during soil sampling process.

Conflicts of Interest

Oli Madgett, Sam Duncan, Peter Rasmussen, and Florian Ruhnke are affiliated with Farmlab Pty. Ltd., while Sean Manning, Deeksha Beniwal, Georgios Tsiminis, and Chaya Smith are with Ziltek Pty. Ltd. Onur Yüzügüllü and Noura Fajraoui are part of AgriCircle company. The remaining authors declare that the research was conducted in the absence of any commercial or financial relationships that could be construed as a potential conflict of interest.

References

  1. Bohn, H.L. Estimate of organic carbon in world soils. Soil Sci. Soc. Am. J. 1976, 40, 468–470. [Google Scholar] [CrossRef]
  2. Grace, J. Understanding and managing the global carbon cycle. J. Ecol. 2004, 92, 189–202. [Google Scholar] [CrossRef]
  3. Heimann, M.; Reichstein, M. Terrestrial ecosystem carbon dynamics and climate feedbacks. Nature 2008, 451, 289–292. [Google Scholar] [CrossRef] [PubMed]
  4. Hari, M.; Tyagi, B. Terrestrial carbon cycle: A tipping edge of climate change between atmosphere and biosphere ecosystems. Environ. Sci. Atmos. 2022, 2, 867–890. [Google Scholar] [CrossRef]
  5. Chen, Z.; Shuai, Q.; Shi, Z.; Arrouays, D.; Richer-de-Forges, A.C.; Chen, S. National-scale mapping of soil organic carbon stock in France: New insights and lessons learned by direct and indirect approaches. Soil Environ. Health 2023, 1, 100049. [Google Scholar] [CrossRef]
  6. Hayes, M.H.; Swift, R.S. Vindication of humic substances as a key component of organic matter in soil and water. Adv. Agron. 2020, 163, 1–37. [Google Scholar]
  7. Wani, O.A.; Kumar, S.S.; Hussain, N.; Wani, A.I.A.; Subhash, B.; Parvej, A.; Rashid, M.; Popescu, S.M.; Mansoor, S. Multi-scale processes influencing global carbon storage and land-carbon-climate nexus: A critical review. Pedosphere 2023, 33, 250–267. [Google Scholar] [CrossRef]
  8. Mondal, S. Impact of climate change on soil fertility. In Climate Change and the Microbiome: Sustenance of the Ecosphere; Springer: Cham, Switzerland, 2021; pp. 551–569. [Google Scholar]
  9. Feller, C.; Manlay, R.J.; Swift, M.J.; Bernoux, M. Functions, services and value of soil organic matter for human societies and the environment: A historical perspective. Geol. Soc. Lond. Spec. Publ. 2006, 266, 9–22. [Google Scholar] [CrossRef]
  10. Lorenz, K.; Lal, R.; Ehlers, K. Soil organic carbon stock as an indicator for monitoring land and soil degradation in relation to U nited N ations’ S ustainable D evelopment G oals. Land Degrad. Dev. 2019, 30, 824–838. [Google Scholar] [CrossRef]
  11. Smith, P.; Soussana, J.F.; Angers, D.; Schipper, L.; Chenu, C.; Rasse, D.P.; Batjes, N.H.; Van Egmond, F.; McNeill, S.; Kuhnert, M. How to measure, report and verify soil carbon change to realize the potential of soil carbon sequestration for atmospheric greenhouse gas removal. Glob. Chang. Biol. 2020, 26, 219–241. [Google Scholar] [CrossRef]
  12. Li, S.; Viscarra Rossel, R.A.; Webster, R. The cost-effectiveness of reflectance spectroscopy for estimating soil organic carbon. Eur. J. Soil Sci. 2022, 73, e13202. [Google Scholar] [CrossRef]
  13. Poulter, B.; Frank, D.; Ciais, P.; Myneni, R.B.; Andela, N.; Bi, J.; Broquet, G.; Canadell, J.G.; Chevallier, F.; Liu, Y.Y.; et al. Contribution of semi-arid ecosystems to interannual variability of the global carbon cycle. Nature 2014, 509, 600–603. [Google Scholar] [CrossRef] [PubMed]
  14. Ward, K.J.; Chabrillat, S.; Brell, M.; Castaldi, F.; Spengler, D.; Foerster, S. Mapping soil organic carbon for airborne and simulated EnMAP imagery using the LUCAS soil database and a local PLSR. Remote Sens. 2020, 12, 3451. [Google Scholar] [CrossRef]
  15. Nayak, A.K.; Rahman, M.M.; Naidu, R.; Dhal, B.; Swain, C.K.; Nayak, A.D.; Tripathi, R.; Shahid, M.; Islam, M.R.; Pathak, H. Current and emerging methodologies for estimating carbon sequestration in agricultural soils: A review. Sci. Total Environ. 2019, 665, 890–912. [Google Scholar] [CrossRef] [PubMed]
  16. Odebiri, O.; Odindi, J.; Mutanga, O. Basic and deep learning models in remote sensing of soil organic carbon estimation: A brief review. Int. J. Appl. Earth Obs. Geoinf. 2021, 102, 102389. [Google Scholar] [CrossRef]
  17. Angelopoulou, T.; Tziolas, N.; Balafoutis, A.; Zalidis, G.; Bochtis, D. Remote sensing techniques for soil organic carbon estimation: A review. Remote Sens. 2019, 11, 676. [Google Scholar] [CrossRef]
  18. Wang, S.; Guan, K.; Zhang, C.; Lee, D.; Margenot, A.J.; Ge, Y.; Peng, J.; Zhou, W.; Zhou, Q.; Huang, Y. Using soil library hyperspectral reflectance and machine learning to predict soil organic carbon: Assessing potential of airborne and spaceborne optical soil sensing. Remote Sens. Environ. 2022, 271, 112914. [Google Scholar] [CrossRef]
  19. Chen, D.; Chang, N.; Xiao, J.; Zhou, Q.; Wu, W. Mapping dynamics of soil organic matter in croplands with MODIS data and machine learning algorithms. Sci. Total Environ. 2019, 669, 844–855. [Google Scholar] [CrossRef]
  20. Kumar, M.; Kumar, A.; Thakur, T.K.; Sahoo, U.K.; Kumar, R.; Konsam, B.; Pandey, R. Soil organic carbon estimation along an altitudinal gradient of chir pine forests in the Garhwal Himalaya, India: A field inventory to remote sensing approach. Land Degrad. Dev. 2022, 33, 3387–3400. [Google Scholar] [CrossRef]
  21. Nguyen, T.T.; Pham, T.D.; Nguyen, C.T.; Delfos, J.; Archibald, R.; Dang, K.B.; Hoang, N.B.; Guo, W.; Ngo, H.H. A novel intelligence approach based active and ensemble learning for agricultural soil organic carbon prediction using multispectral and SAR data fusion. Sci. Total Environ. 2022, 804, 150187. [Google Scholar] [CrossRef]
  22. Sanderman, J.; Savage, K.; Dangal, S.R.; Duran, G.; Rivard, C.; Cavigelli, M.A.; Gollany, H.T.; Jin, V.L.; Liebig, M.A.; Omondi, E.C. Can Agricultural Management Induced Changes in Soil Organic Carbon Be Detected Using Mid-Infrared Spectroscopy? Remote Sens. 2021, 13, 2265. [Google Scholar] [CrossRef]
  23. Sanderman, J.; Savage, K.; Dangal, S.R. Mid-infrared spectroscopy for prediction of soil health indicators in the United States. Soil Sci. Soc. Am. J. 2020, 84, 251–261. [Google Scholar] [CrossRef]
  24. Zhou, Y.; Zhao, X.; Guo, X.; Li, Y. Mapping of soil organic carbon using machine learning models: Combination of optical and radar remote sensing data. Soil Sci. Soc. Am. J. 2022, 86, 293–310. [Google Scholar] [CrossRef]
  25. Zhu, X.B.; He, H.L.; Ma, M.G.; Ren, X.L.; Zhang, L.; Zhang, F.W.; Li, Y.N.; Shi, P.L.; Chen, S.P.; Wang, Y.F.; et al. Estimating Ecosystem Respiration in the Grasslands of Northern China Using Machine Learning: Model Evaluation and Comparison. Sustainability 2020, 12, 17. [Google Scholar] [CrossRef]
  26. Meng, B.P.; Liang, T.G.; Yi, S.H.; Yin, J.P.; Cui, X.; Ge, J.; Hou, M.J.; Lv, Y.Y.; Sun, Y. Modeling Alpine Grassland Above Ground Biomass Based on Remote Sensing Data and Machine Learning Algorithm: A Case Study in East of the Tibetan Plateau, China. IEEE J. Sel. Top. Appl. Earth Observ. Remote Sens. 2020, 13, 2986–2995. [Google Scholar] [CrossRef]
  27. Tinti, A.; Tugnoli, V.; Bonora, S.; Francioso, O. Recent applications of vibrational mid-Infrared (IR) spectroscopy for studying soil components: A review. J. Cent. Eur. Agric. 2015, 16, 1–22. [Google Scholar] [CrossRef]
  28. Wang, J.; Liu, T.; Zhang, J.; Yuan, H.; Acquah, G.E. Spectral variable selection for estimation of soil organic carbon content using mid-infrared spectroscopy. Eur. J. Soil Sci. 2022, 73, e13267. [Google Scholar] [CrossRef]
  29. Chen, S.; Arrouays, D.; Mulder, V.L.; Poggio, L.; Minasny, B.; Roudier, P.; Libohova, Z.; Lagacherie, P.; Shi, Z.; Hannam, J. Digital mapping of GlobalSoilMap soil properties at a broad scale: A review. Geoderma 2022, 409, 115567. [Google Scholar] [CrossRef]
  30. Allo, M.; Todoroff, P.; Jameux, M.; Stern, M.; Paulin, L.; Albrecht, A. Prediction of tropical volcanic soil organic carbon stocks by visible-near-and mid-infrared spectroscopy. CATENA 2020, 189, 104452. [Google Scholar] [CrossRef]
  31. Li, T.; Cui, L.; Xu, Z.; Hu, R.; Joshi, P.K.; Song, X.; Tang, L.; Xia, A.; Wang, Y.; Guo, D.; et al. Quantitative Analysis of the Research Trends and Areas in Grassland Remote Sensing: A Scientometrics Analysis of Web of Science from 1980 to 2020. Remote Sens. 2021, 13, 1279. [Google Scholar] [CrossRef]
  32. Bouasria, A.; Namr, K.I.; Rahimi, A.; Ettachfini, E.M. Soil organic matter estimation by using Landsat-8 pansharpened image and machine learning. In Proceedings of the 2020 Fourth International Conference On Intelligent Computing in Data Sciences (ICDS), Fez, Morocco, 21–23 October 2020; pp. 1–8. [Google Scholar]
  33. Wang, X.; Zhang, Y.; Atkinson, P.M.; Yao, H. Predicting soil organic carbon content in Spain by combining Landsat TM and ALOS PALSAR images. Int. J. Appl. Earth Obs. Geoinf. 2020, 92, 102182. [Google Scholar] [CrossRef]
  34. Odebiri, O.; Mutanga, O.; Odindi, J. Deep learning-based national scale soil organic carbon mapping with Sentinel-3 data. Geoderma 2022, 411, 115695. [Google Scholar] [CrossRef]
  35. Dvorakova, K.; Heiden, U.; Pepers, K.; Staats, G.; van Os, G.; van Wesemael, B. Improving soil organic carbon predictions from a Sentinel–2 soil composite by assessing surface conditions and uncertainties. Geoderma 2023, 429, 116128. [Google Scholar] [CrossRef]
  36. Peón, J.; Fernández, S.; Recondo, C.; Calleja, J.F. Evaluation of the spectral characteristics of five hyperspectral and multispectral sensors for soil organic carbon estimation in burned areas. Int. J. Wildland Fire 2017, 26, 230–239. [Google Scholar] [CrossRef]
  37. Zhang, Y.; Guo, L.; Chen, Y.; Shi, T.; Luo, M.; Ju, Q.; Zhang, H.; Wang, S. Prediction of soil organic carbon based on Landsat 8 monthly NDVI data for the Jianghan Plain in Hubei Province, China. Remote Sens. 2019, 11, 1683. [Google Scholar] [CrossRef]
  38. Rawat, M.; Arunachalam, K.; Arunachalam, A.; Alatalo, J.; Pandey, R. Associations of plant functional diversity with carbon accumulation in a temperate forest ecosystem in the Indian Himalayas. Ecol. Indic. 2019, 98, 861–868. [Google Scholar] [CrossRef]
  39. Yan, Y.; Li, B.; Rossel, R.V.; Sun, F.; Huang, Y.; Shen, C.; Shi, Z.; Ji, W. Optimal soil organic matter mapping using an ensemble model incorporating moderate resolution imaging spectroradiometer, portable X-ray fluorescence, and visible near-infrared data. Comput. Electron. Agric. 2023, 210, 107885. [Google Scholar] [CrossRef]
  40. Diaz-Gonzalez, F.A.; Vuelvas, J.; Correa, C.A.; Vallejo, V.E.; Patino, D. Machine learning and remote sensing techniques applied to estimate soil indicators–review. Ecol. Indic. 2022, 135, 108517. [Google Scholar] [CrossRef]
  41. Rasel, S.M.; Groen, T.A.; Hussin, Y.A.; Diti, I.J. Proxies for soil organic carbon derived from remote sensing. Int. J. Appl. Earth Obs. Geoinf. 2017, 59, 157–166. [Google Scholar] [CrossRef]
  42. Li, X.; Liu, B.; Zheng, G.; Ren, Y.; Zhang, S.; Liu, Y.; Gao, L.; Liu, Y.; Zhang, B.; Wang, F. Deep-learning-based information mining from ocean remote-sensing imagery. Natl. Sci. Rev. 2020, 7, 1584–1605. [Google Scholar] [CrossRef]
  43. Gergel, S.E.; Stange, Y.; Coops, N.C.; Johansen, K.; Kirby, K.R. What is the value of a good map? An example using high spatial resolution imagery to aid riparian restoration. Ecosystems 2007, 10, 688–702. [Google Scholar] [CrossRef]
  44. Gomez, C.; Rossel, R.A.V.; McBratney, A.B. Soil organic carbon prediction by hyperspectral remote sensing and field vis-NIR spectroscopy: An Australian case study. Geoderma 2008, 146, 403–411. [Google Scholar] [CrossRef]
  45. Heumann, B.W. The multiple comparison problem in empirical remote sensing. Photogramm. Eng. Remote Sens. 2015, 81, 921–926. [Google Scholar] [CrossRef]
  46. Mashala, M.J.; Dube, T.; Mudereri, B.T.; Ayisi, K.K.; Ramudzuli, M.R. A Systematic Review on Advancements in Remote Sensing for Assessing and Monitoring Land Use and Land Cover Changes Impacts on Surface Water Resources in Semi-Arid Tropical Environments. Remote Sens. 2023, 15, 3926. [Google Scholar] [CrossRef]
  47. Cheng, C.; Zhang, F.; Shi, J.; Kung, H.-T. What is the relationship between land use and surface water quality? A review and prospects from remote sensing perspective. Environ. Sci. Pollut. Res. 2022, 29, 56887–56907. [Google Scholar] [CrossRef] [PubMed]
  48. Sarker, I.H. Machine learning: Algorithms, real-world applications and research directions. SN Comput. Sci. 2021, 2, 160. [Google Scholar] [CrossRef] [PubMed]
  49. Zhang, H.; Wu, P.; Yin, A.; Yang, X.; Zhang, M.; Gao, C. Prediction of soil organic carbon in an intensively managed reclamation zone of eastern China: A comparison of multiple linear regressions and the random forest model. Sci. Total Environ. 2017, 592, 704–713. [Google Scholar] [CrossRef] [PubMed]
  50. Pouladi, N.; Møller, A.B.; Tabatabai, S.; Greve, M.H. Mapping soil organic matter contents at field level with Cubist, Random Forest and kriging. Geoderma 2019, 342, 85–92. [Google Scholar] [CrossRef]
  51. Wang, B.; Waters, C.; Orgill, S.; Gray, J.; Cowie, A.; Clark, A.; Li Liu, D. High resolution mapping of soil organic carbon stocks using remote sensing variables in the semi-arid rangelands of eastern Australia. Sci. Total Environ. 2018, 630, 367–378. [Google Scholar] [CrossRef] [PubMed]
  52. Morais, T.G.; Tufik, C.; Rato, A.E.; Rodrigues, N.R.; Gama, I.; Jongen, M.; Serrano, J.; Fangueiro, D.; Domingos, T.; Teixeira, R.F. Estimating soil organic carbon of sown biodiverse permanent pastures in Portugal using near infrared spectral data and artificial neural networks. Geoderma 2021, 404, 115387. [Google Scholar] [CrossRef]
  53. Shen, Z.; Viscarra Rossel, R. Automated spectroscopic modelling with optimised convolutional neural networks. Sci. Rep. 2021, 11, 208. [Google Scholar] [CrossRef] [PubMed]
  54. Odebiri, O.; Mutanga, O.; Odindi, J.; Naicker, R.; Masemola, C.; Sibanda, M. Deep learning approaches in remote sensing of soil organic carbon: A review of utility, challenges, and prospects. Environ. Monit. Assess. 2021, 193, 802. [Google Scholar] [CrossRef] [PubMed]
  55. Türker-Kaya, S.; Huck, C.W. A review of mid-infrared and near-infrared imaging: Principles, concepts and applications in plant tissue analysis. Molecules 2017, 22, 168. [Google Scholar] [CrossRef] [PubMed]
  56. Dudek, M.; Kabała, C.; Łabaz, B.; Mituła, P.; Bednik, M.; Medyńska-Juraszek, A. Mid-infrared spectroscopy supports identification of the origin of organic matter in soils. Land 2021, 10, 215. [Google Scholar] [CrossRef]
  57. Matamala, R.; Jastrow, J.D.; Calderón, F.J.; Liang, C.; Fan, Z.; Michaelson, G.J.; Ping, C.-L. Predicting the decomposability of arctic tundra soil organic matter with mid infrared spectroscopy. Soil Biol. Biochem. 2019, 129, 1–12. [Google Scholar] [CrossRef]
  58. Sanderman, J.; Smith, C.; Safanelli, J.C.; Morgan, C.L.S.; Ackerman, J.; Looker, N.; Keating, R.; Kumar, A.K. Diffuse reflectance mid-infrared spectroscopy is viable without fine milling. Soil Secur. 2023, 13, 100104. [Google Scholar] [CrossRef]
  59. Chen, C.; Dong, D.; Li, Z.; Wang, X. A novel soil nutrient detection method based on combined ATR and DRIFT mid-infrared spectra. Anal. Methods 2017, 9, 528–533. [Google Scholar] [CrossRef]
  60. Ng, W.; Minasny, B.; Montazerolghaem, M.; Padarian, J.; Ferguson, R.; Bailey, S.; McBratney, A.B. Convolutional neural network for simultaneous prediction of several soil properties using visible/near-infrared, mid-infrared, and their combined spectra. Geoderma 2019, 352, 251–267. [Google Scholar] [CrossRef]
  61. Sanderman, J.; Baldock, J.A.; Dangal, S.R.S.; Ludwig, S.; Potter, S.; Rivard, C.; Savage, K. Soil organic carbon fractions in the Great Plains of the United States: An application of mid-infrared spectroscopy. Biogeochemistry 2021, 156, 97–114. [Google Scholar] [CrossRef]
  62. Yang, M.; Xu, D.; Chen, S.; Li, H.; Shi, Z. Evaluation of Machine Learning Approaches to Predict Soil Organic Matter and pH Using vis-NIR Spectra. Sensors 2019, 19, 263. [Google Scholar] [CrossRef]
  63. Wadoux, A.M.J.C.; Padarian, J.; Minasny, B. Multi-source data integration for soil mapping using deep learning. Soil 2019, 5, 107–119. [Google Scholar] [CrossRef]
  64. Forkuor, G.; Hounkpatin, O.K.; Welp, G.; Thiel, M. High resolution mapping of soil properties using remote sensing variables in south-western Burkina Faso: A comparison of machine learning and multiple linear regression models. PLoS ONE 2017, 12, e0170478. [Google Scholar] [CrossRef] [PubMed]
  65. Garosi, Y.; Ayoubi, S.; Nussbaum, M.; Sheklabadi, M.; Nael, M.; Kimiaee, I. Use of the time series and multi-temporal features of Sentinel-1/2 satellite imagery to predict soil inorganic and organic carbon in a low-relief area with a semi-arid environment. Int. J. Remote Sens. 2022, 43, 6856–6880. [Google Scholar] [CrossRef]
  66. Xu, L.; Wu, Z.; Zhang, Z.; Wang, X. Forest classification using synthetic GF-1/WFV time series and phenological parameters. J. Applied Remote Sens. 2021, 15, 042413. [Google Scholar] [CrossRef]
  67. Yuzugullu, O.; Lorenz, F.; Fröhlich, P.; Liebisch, F. Understanding Fields by Remote Sensing: Soil Zoning and Property Mapping. Remote Sens. 2020, 12, 1116. [Google Scholar] [CrossRef]
  68. Minasny, B.; Malone, B.P.; McBratney, A.B.; Angers, D.A.; Arrouays, D.; Chambers, A.; Chaplot, V.; Chen, Z.-S.; Cheng, K.; Das, B.S.; et al. Soil carbon 4 per mille. Geoderma 2017, 292, 59–86. [Google Scholar] [CrossRef]
  69. Fleming, A.; Stitzlein, C.; Jakku, E.; Fielke, S. Missed opportunity? Framing actions around co-benefits for carbon mitigation in Australian agriculture. Land Use Policy 2019, 85, 230–238. [Google Scholar] [CrossRef]
  70. Gramig, B.M.; Widmar, N.J.O. Farmer Preferences for Agricultural Soil Carbon Sequestration Schemes. Appl. Econ. Perspect. Policy 2018, 40, 502–521. [Google Scholar] [CrossRef]
  71. Buck, H.J.; Palumbo-Compton, A. Soil carbon sequestration as a climate strategy: What do farmers think? Biogeochemistry 2022, 161, 59–70. [Google Scholar] [CrossRef]
  72. Kragt, M.E.; Dumbrell, N.P.; Blackmore, L. Motivations and barriers for Western Australian broad-acre farmers to adopt carbon farming. Environ. Sci. Policy 2017, 73, 115–123. [Google Scholar] [CrossRef]
  73. Liu, Y.; Ruiz-Menjivar, J.; Zhang, L.; Zhang, J.; Swisher, M.E. Technical training and rice farmers’ adoption of low-carbon management practices: The case of soil testing and formulated fertilization technologies in Hubei, China. J. Clean. Prod. 2019, 226, 454–462. [Google Scholar] [CrossRef]
  74. Orgiazzi, A.; Ballabio, C.; Panagos, P.; Jones, A.; Fernández-Ugalde, O. LUCAS Soil, the largest expandable soil dataset for Europe: A review. Eur. J. Soil Sci. 2018, 69, 140–153. [Google Scholar] [CrossRef]
Figure 1. Project participating units and designated tasks.
Remotesensing 15 05571 g001
Figure 2. Uncertainty map of soil organic carbon stocks in Australia (Source at https://soilgrids.org/, accessed on 10 October 2023).
Remotesensing 15 05571 g002
Figure 3. Project process flow for SOC estimation and monitoring with integration of farmers.
Remotesensing 15 05571 g003
Figure 4. Sampling and chemometrics synergy workflow: remote sensing section (a) and mid-infrared spectroscopy (b).
Remotesensing 15 05571 g004
Figure 5. Schematic diagram of the main process of soil organic carbon sample collection and analysis.
Remotesensing 15 05571 g005
Figure 6. The location of the MIR-scanned samples overlaid on the geographical map of the site. The RemScan predicted SOC values are also reported for each measurement. Left (a): measurements for the top layer (0–30 cm); right (b): measurements for bottom layer (30–60 cm). The yellow dots in the figure represent the sampling points. The numbers represent the organic carbon content values for each point. In addition, due to the small font size of the black values, we purposely enlarged them using blue font.
Remotesensing 15 05571 g006
Figure 7. The RemScan-predicted SOC values vs. laboratory (dry combustion)-measured SOC values. The dots show the measured values while the red line shows the line of best fit. R2 = 0.83; Mean Absolute Error (MAE) = 0.45; Mean Squared Error (MSE) = 0.24; Root Mean Squared Error (RMSE) = 0.49.
Remotesensing 15 05571 g007
Figure 8. MIR spectrum of the sample with largest lab (dry combustion)-measured SOC concentration. The two bands indicate the regions used by the PLS model to predict the SOC concentration, the blue highlighted regions in the spectrum indicate the dominant SOC region.
Remotesensing 15 05571 g008
Table 1. SOC content statistics for the 36 samples.
Depth
(cm)
Min
(g/cm³)
Max
(g/cm³)
Q1
(g/cm³)
Q2
(g/cm³)
Q3
(g/cm³)
Std
(/)
0–301.442.151.701.831.920.196
30–600.7671.360.8350.9981.140.187
Disclaimer/Publisher’s Note: The statements, opinions and data contained in all publications are solely those of the individual author(s) and contributor(s) and not of MDPI and/or the editor(s). MDPI and/or the editor(s) disclaim responsibility for any injury to people or property resulting from any ideas, methods, instructions or products referred to in the content.

