

CycleGAN-Based SAR-Optical Image Fusion for Target Recognition


Abstract
:
1. Introduction
- A method for bidirectional translation of SAR-optical images is demonstrated by utilizing the bidirectional generation ability of CycleGAN. The feasibility of this data-fusion method in solving the difficulty of feature extraction and the scarcity of training datasets in SAR ATR is verified.
- A joint loss function that takes into account both the whole and local factors for S2O translation is proposed by comparing the impacts of various supervised and unsupervised losses. Through a combination of human vision and numerical evaluation, it has been validated that the joint loss function improves the translation results.
- A new dataset, SPH8, comprising SAR images and the simulated optical images of eight types of ground aircraft targets, is created. It includes both paired and unpaired SAR-optical target images, making it suitable for supporting SAR-optical data fusion, SAR ATR, SAR data generation, and other research, both supervised and unsupervised.
2. Related Works
2.1. SAR ATR
2.2. SAR-Optical Image Fusion
2.3. SAR Data Generation
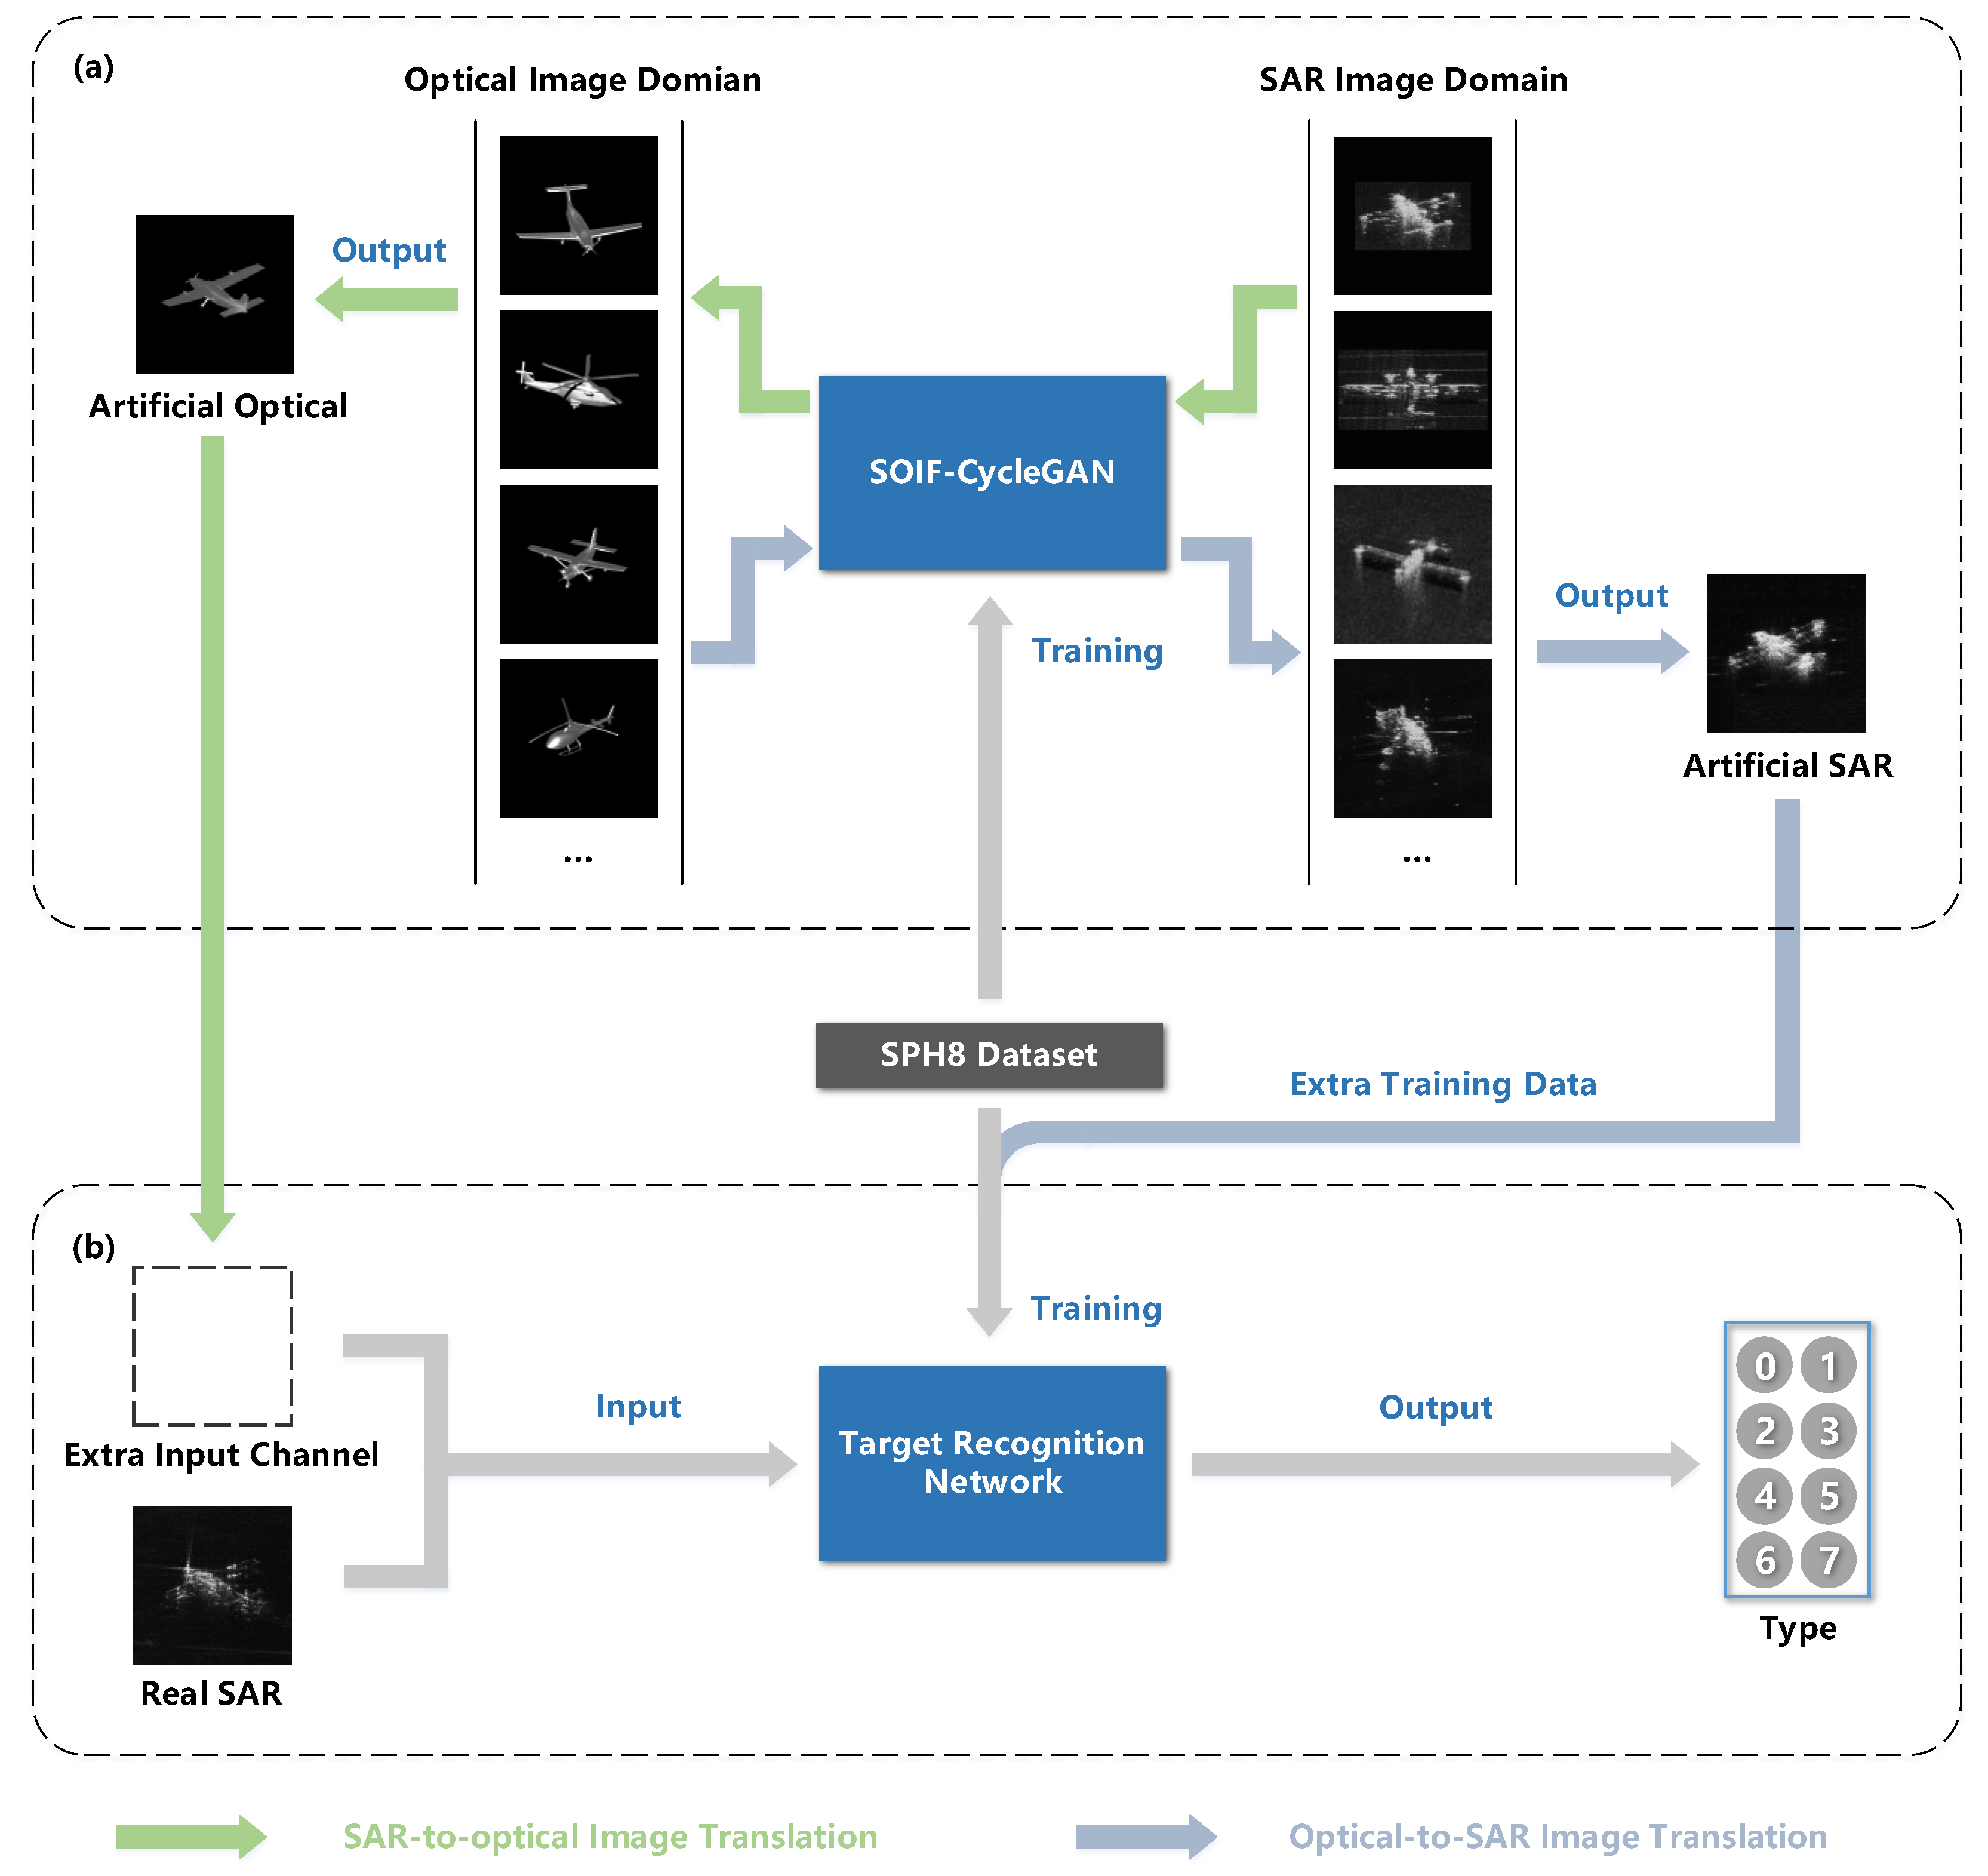
3. Methods
3.1. Bidirectional Translation Network
3.1.1. Network Architecture
3.1.2. Loss Function
3.2. Recognition Network
4. Experiments
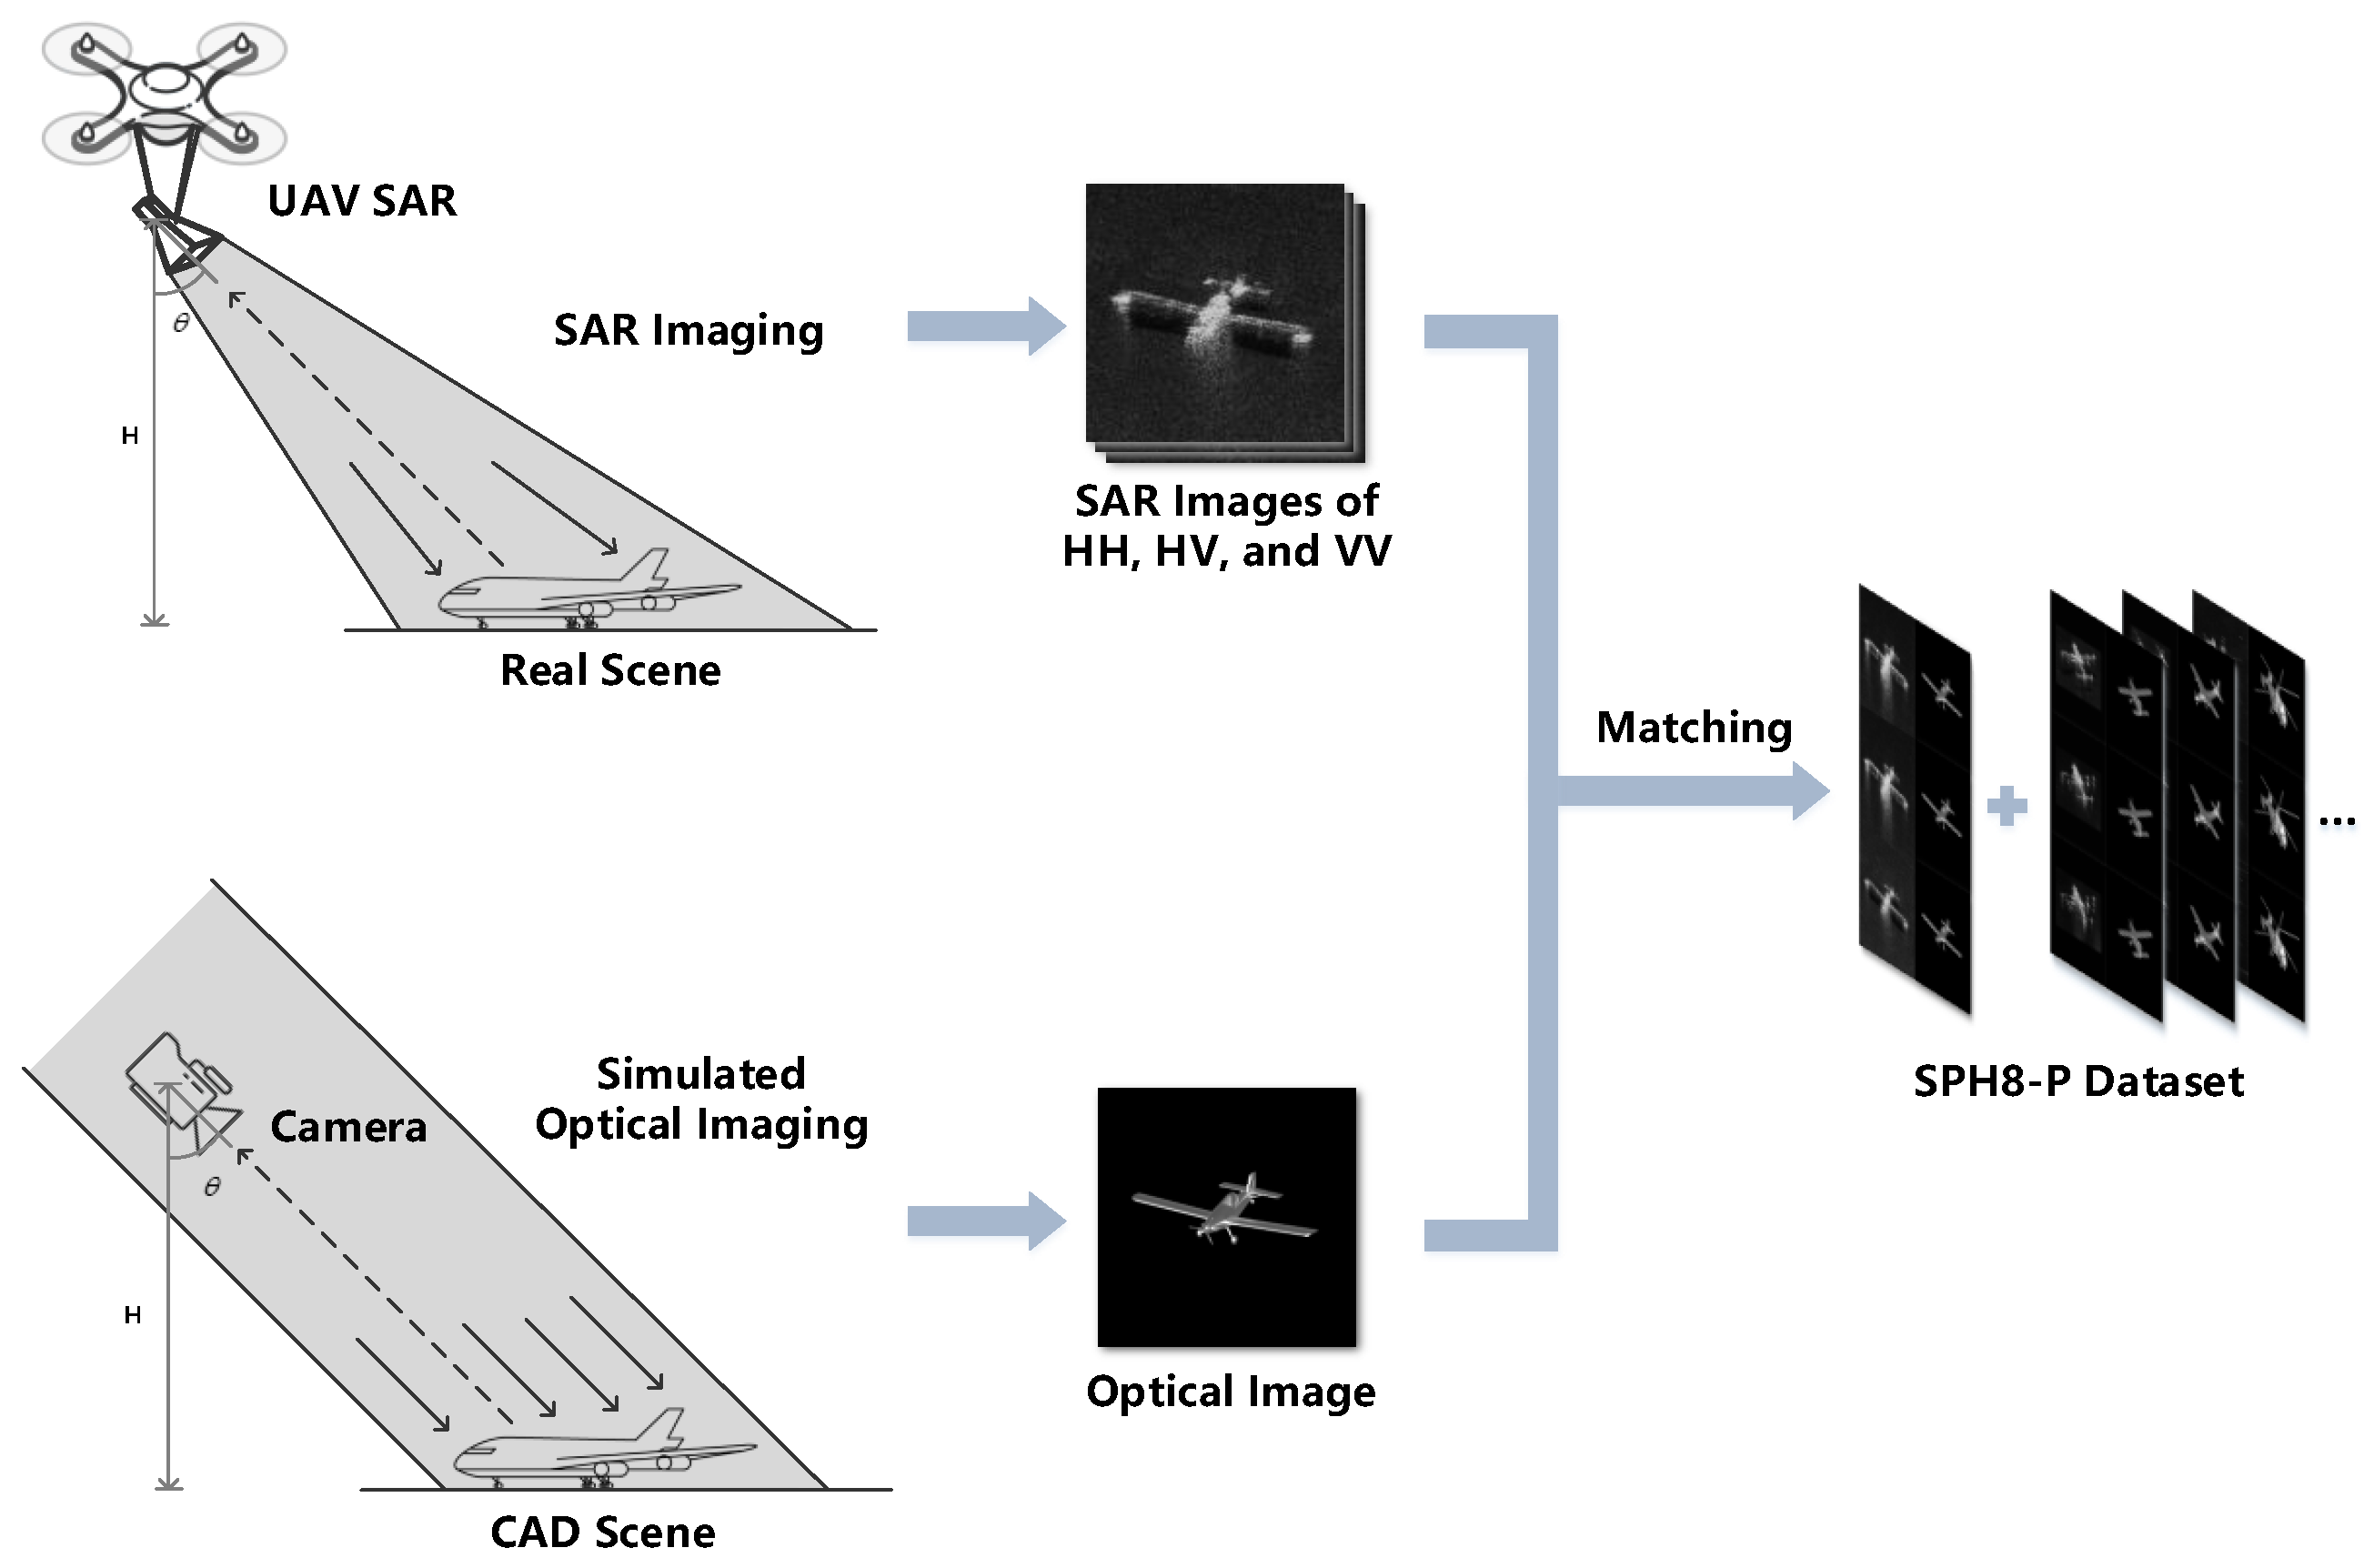
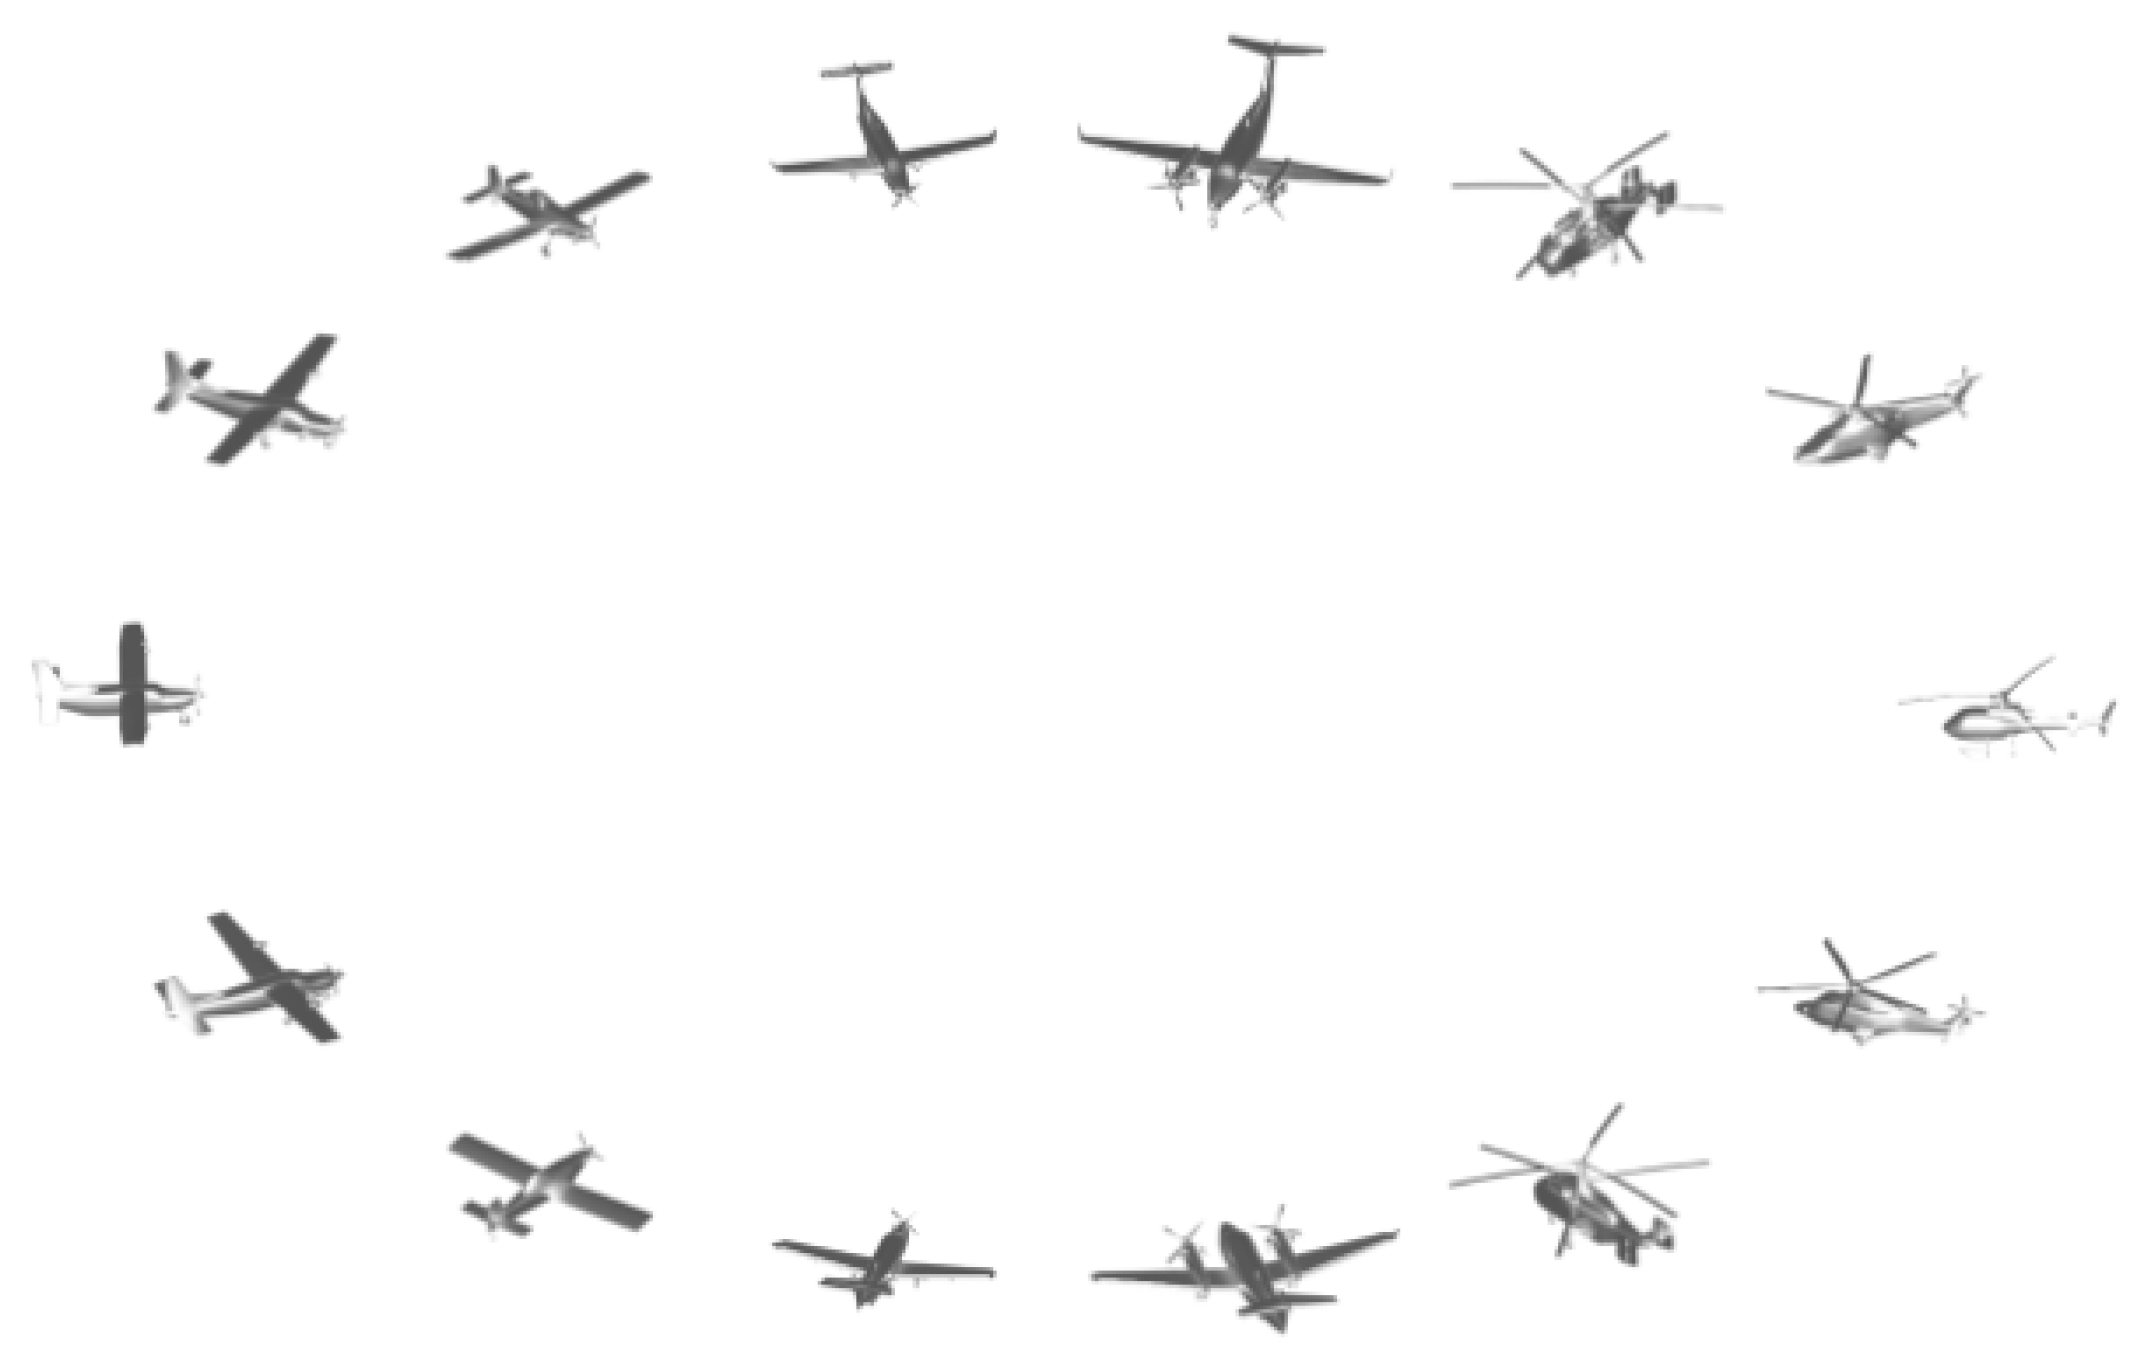
4.1. Dataset
4.2. Implement Details
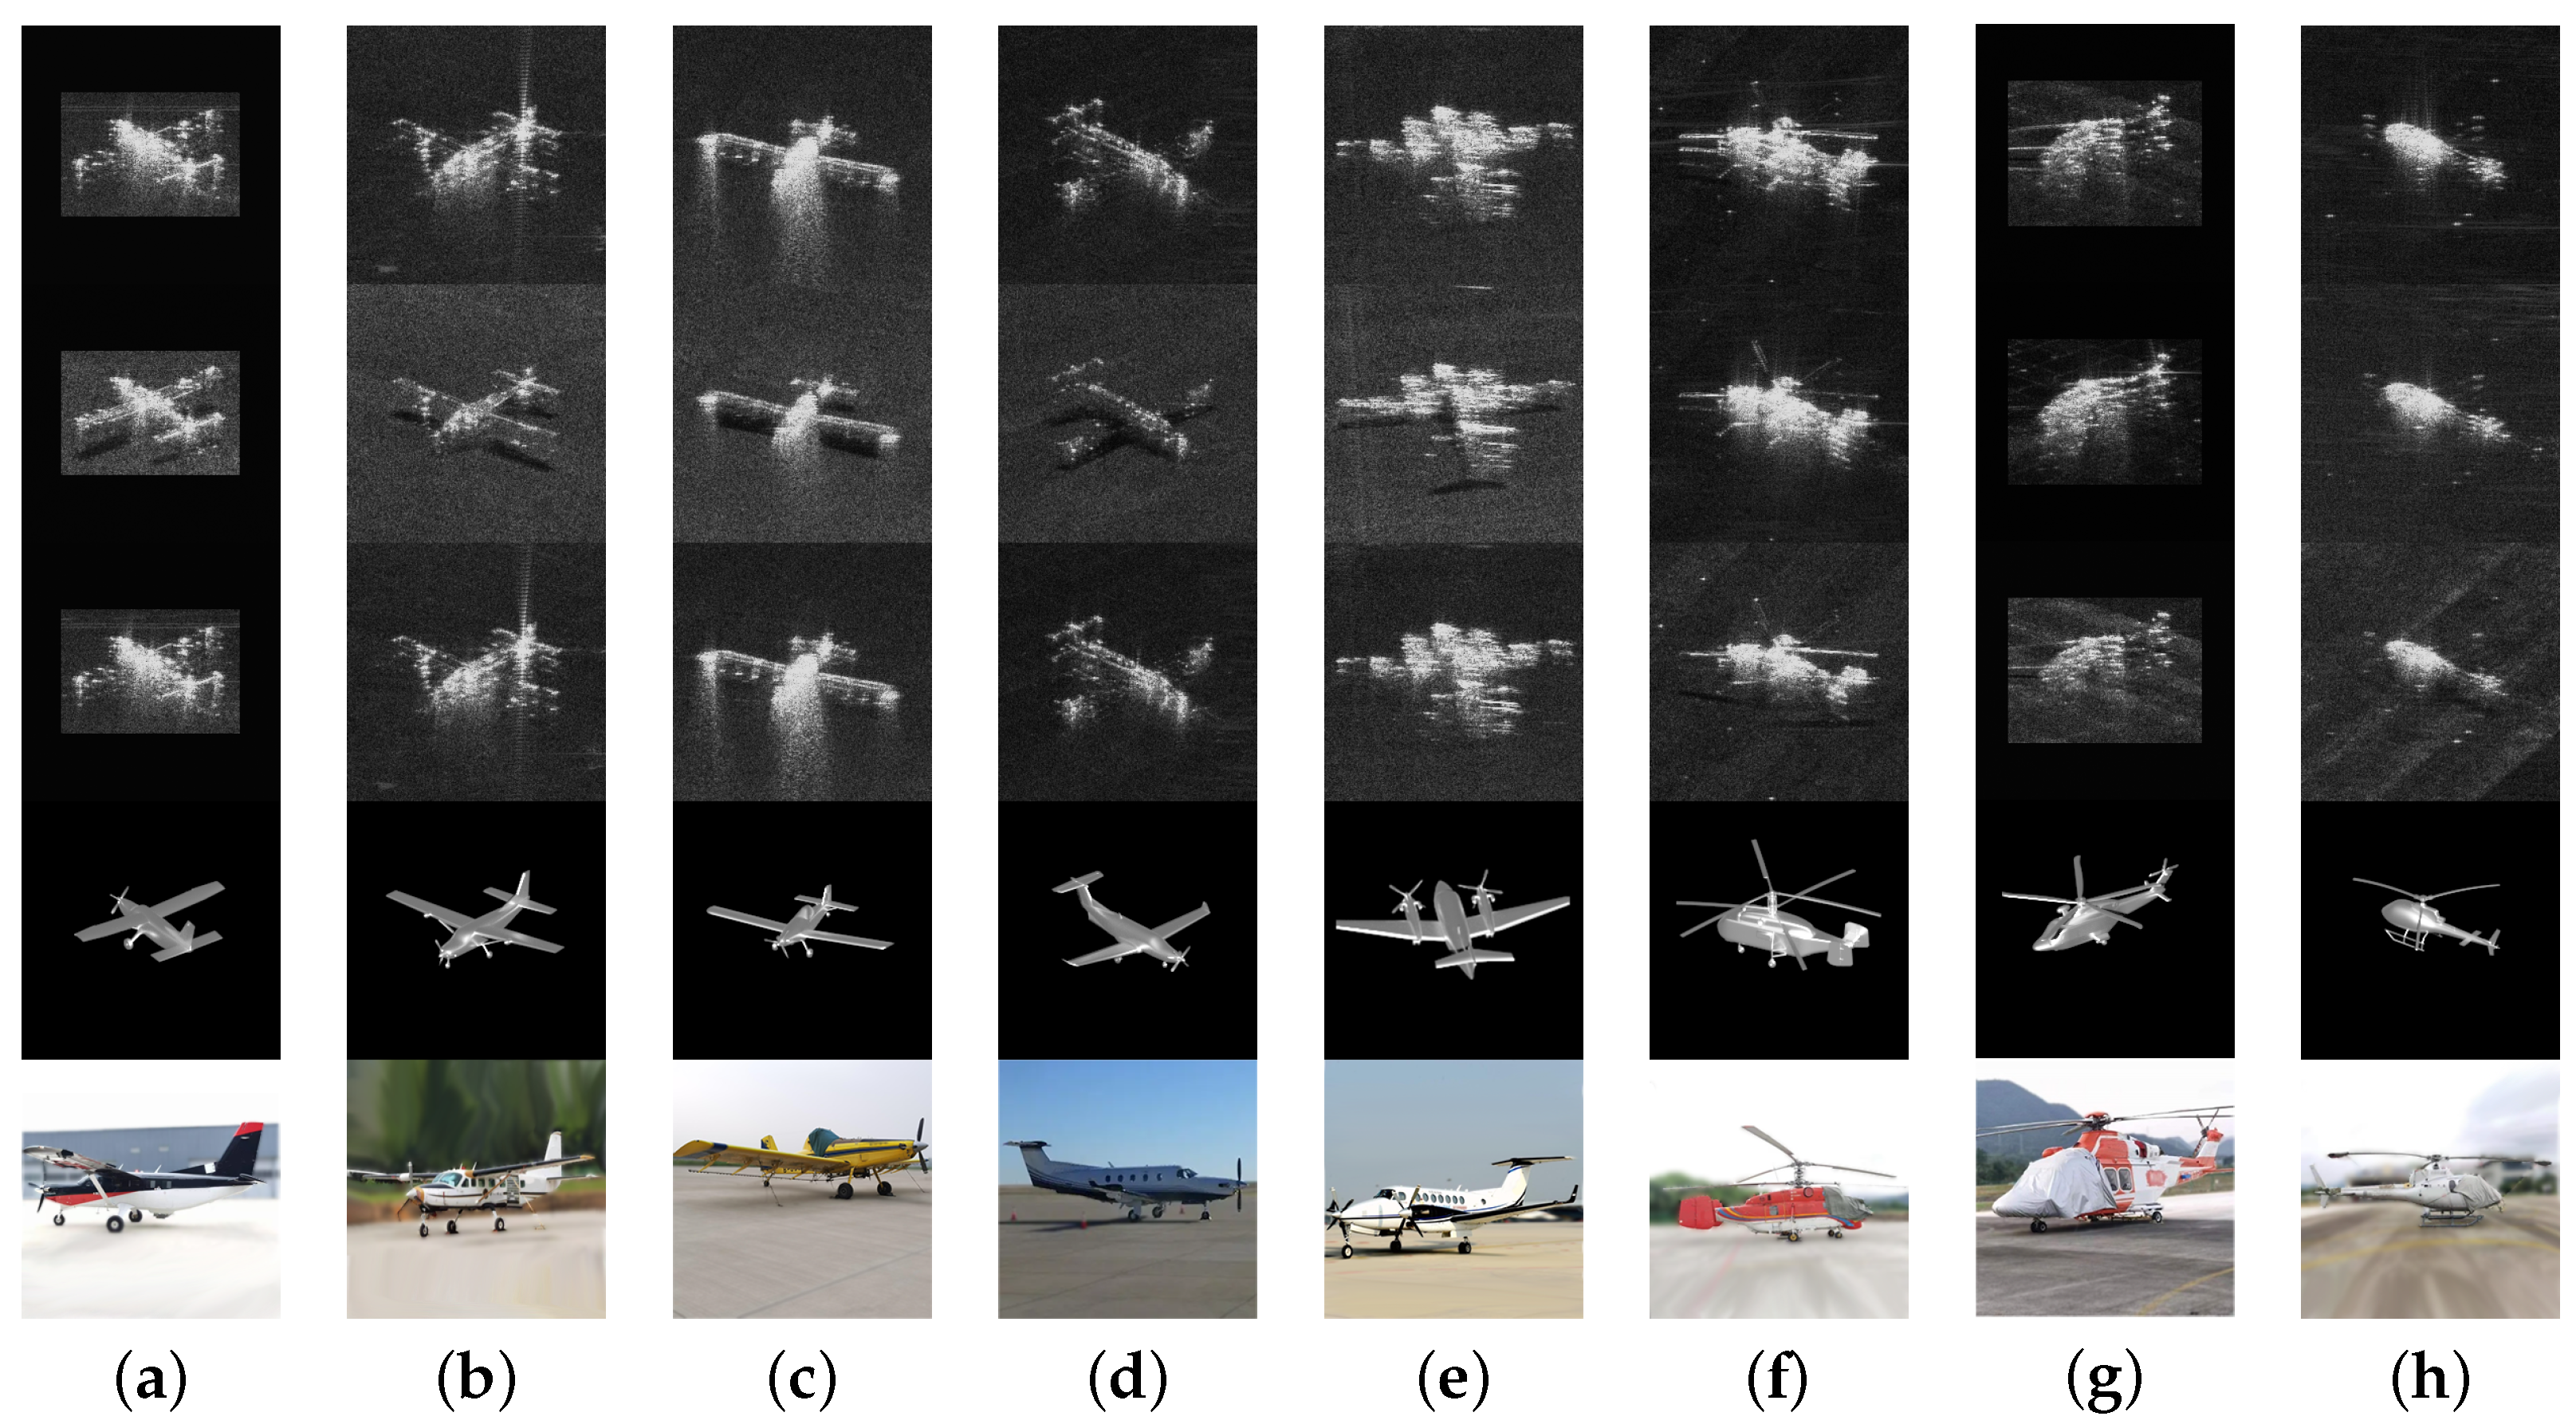
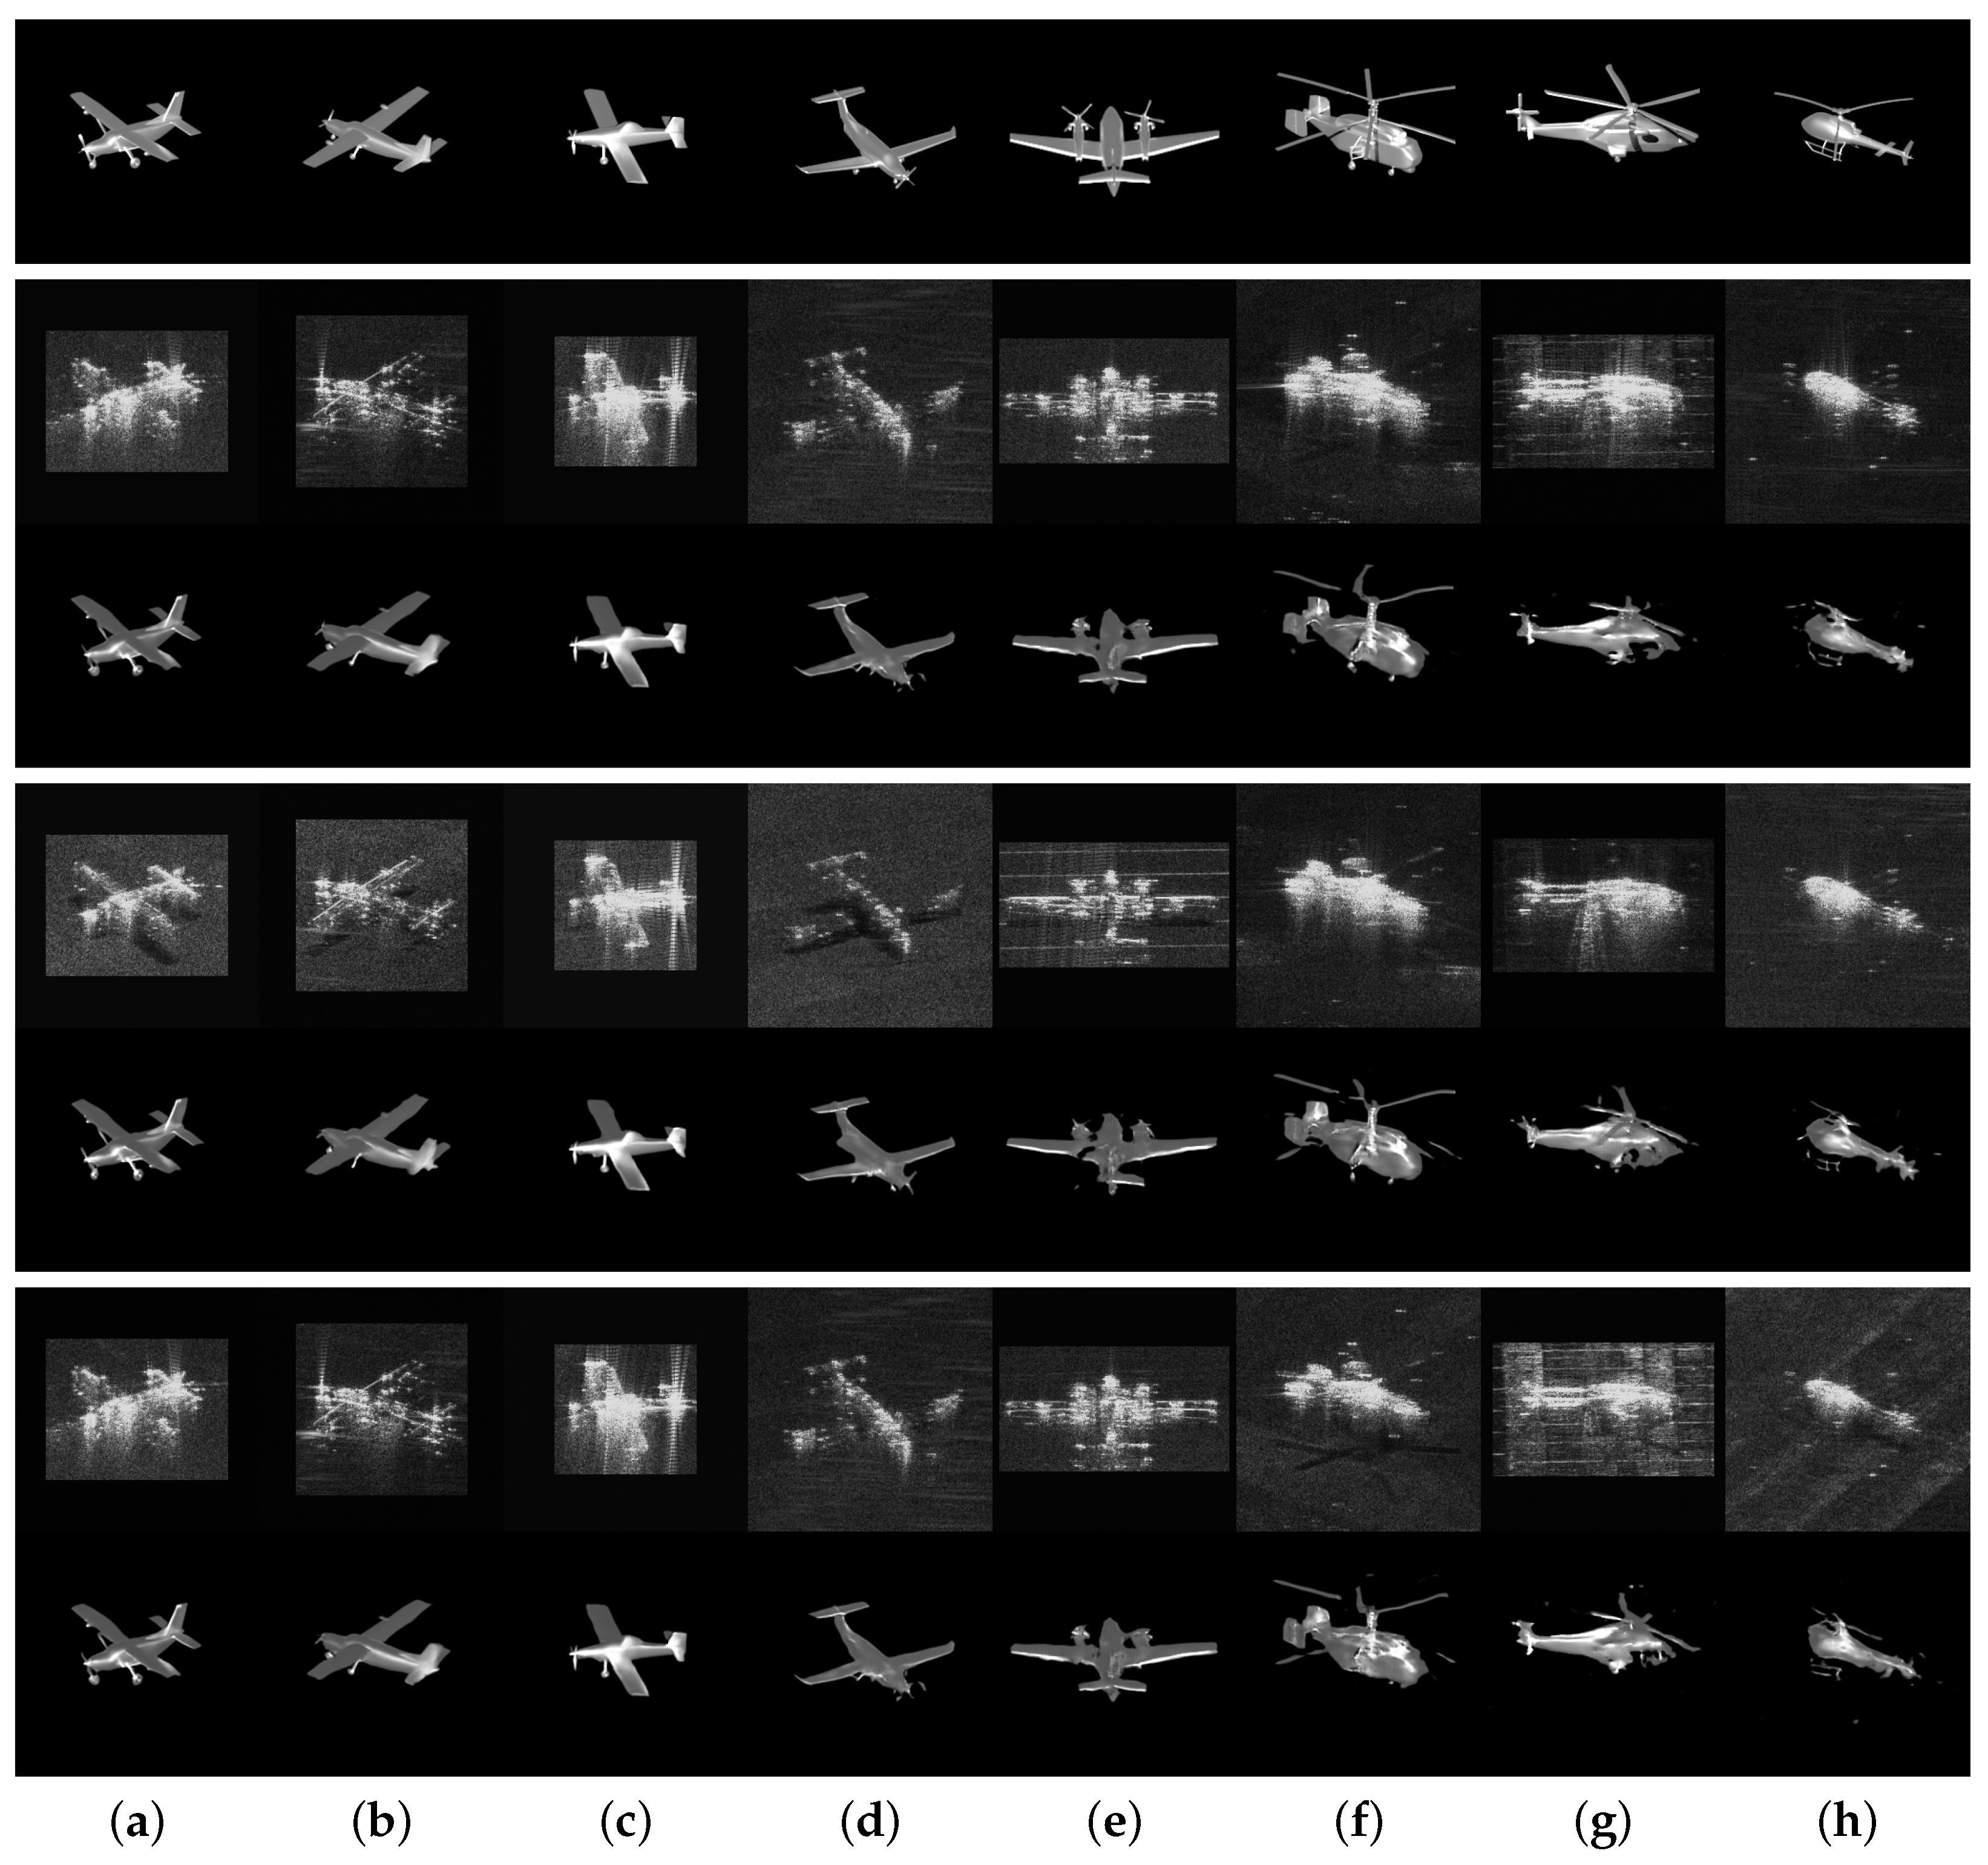
5. Results and Analysis
5.1. Results of Image Fusion
5.2. Results of SAR ATR Enhanced by Image Fusion
6. Discussion
6.1. Effect of Loss Functions on S2O Translation
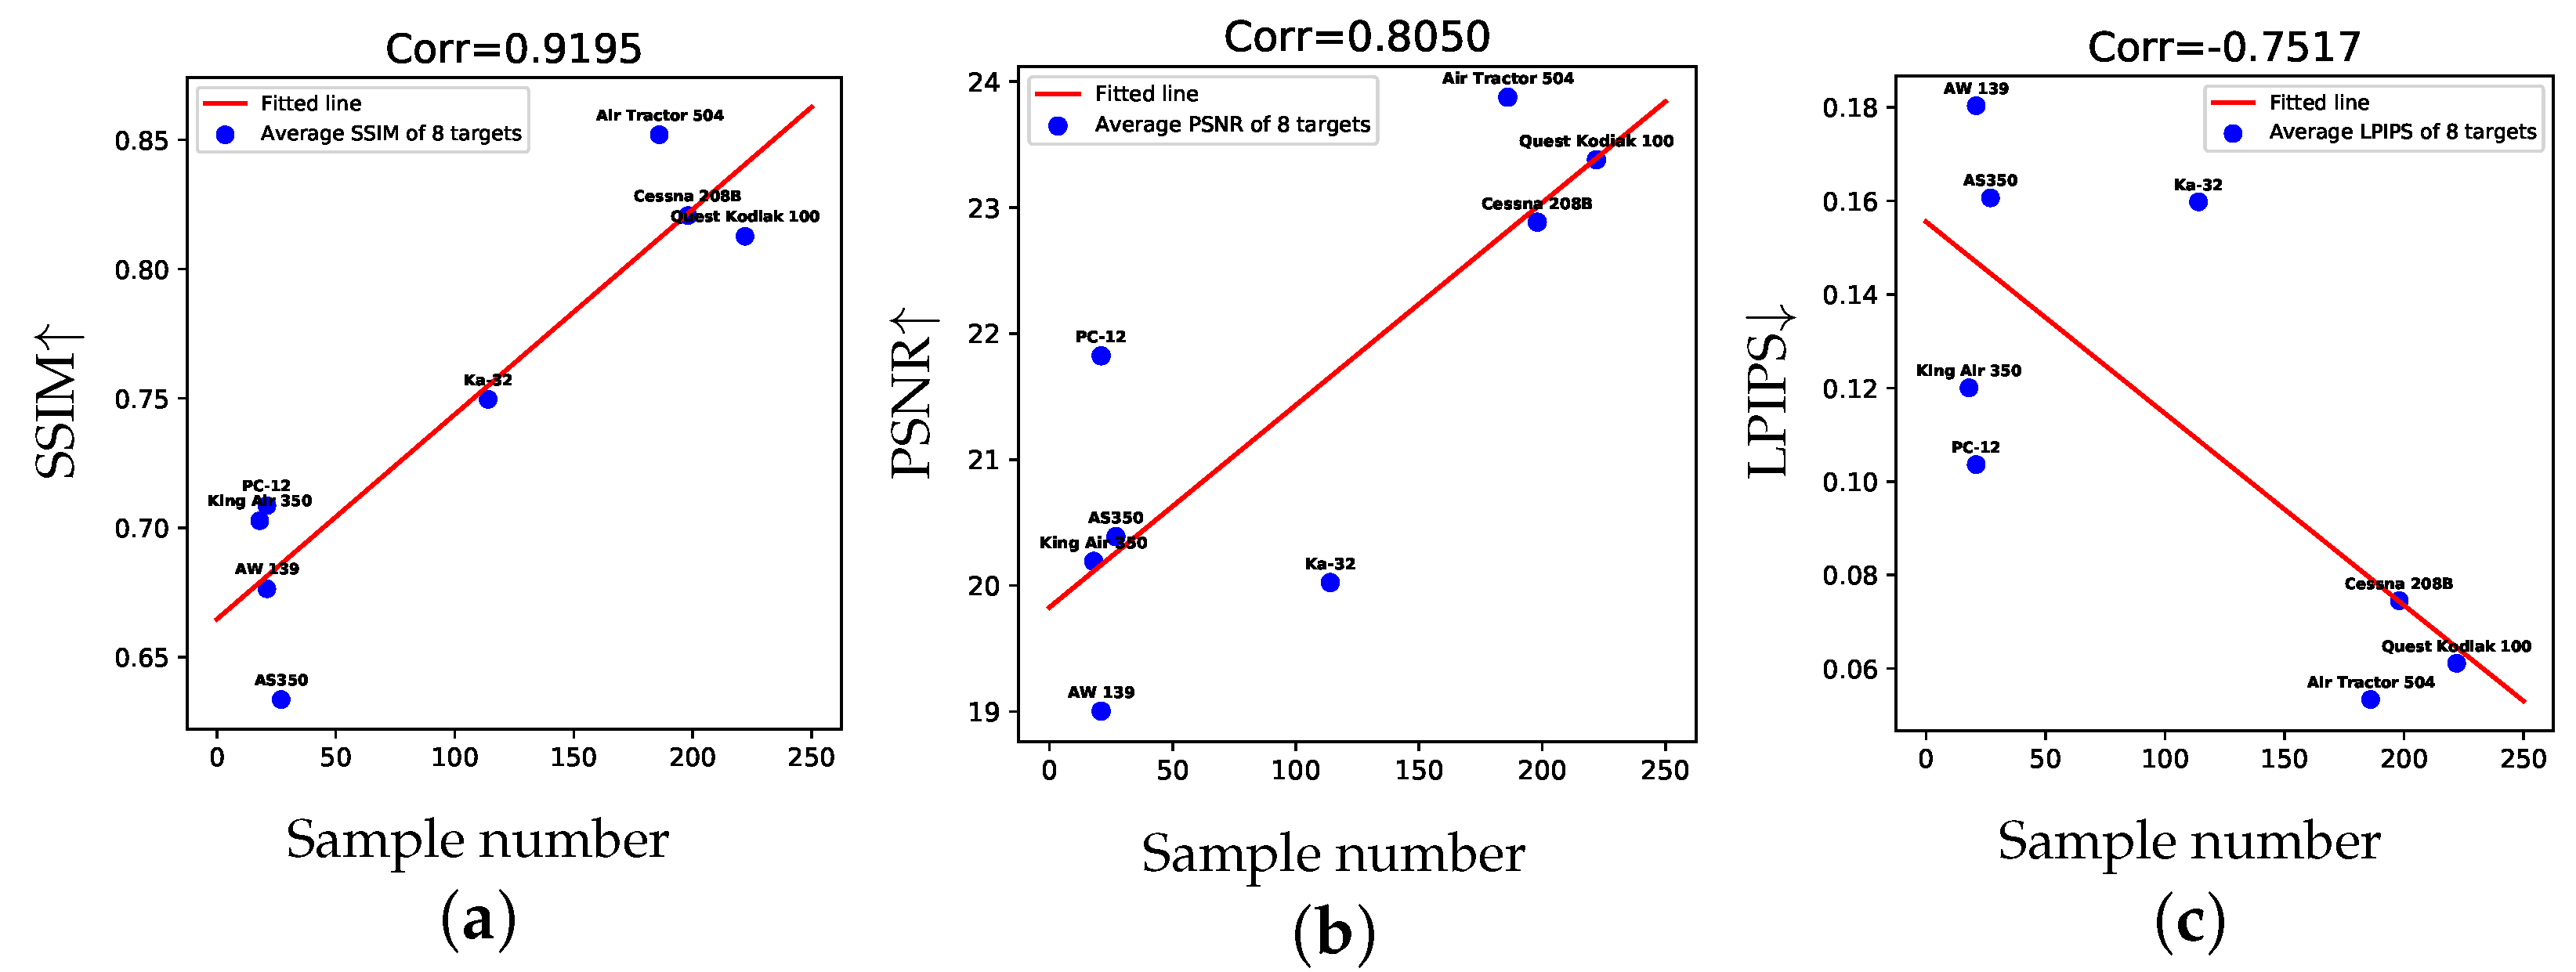
6.2. Effect of the Unequal Sample Number on Image Fusion
6.3. Spacial Cases
- Azimuth ambiguity. The results of the samples with azimuth ambiguity are shown in Figure 10a,b. The severe ambiguity makes the target in the SAR image difficult to recognize, which also affects the artificial optical image, resulting in slight geometric distortions and missing structures, such as the tail in Figure 10a,b. Nevertheless, the target can be effectively recovered in artificial optical images, which greatly facilitates target recognition.
- Azimuth ghosting. As shown in Figure 10c,d, azimuth ghosting appears in the SAR images, which is caused by the periodic high-frequency vibration of the platform. Despite the extra entities in the SAR images causing the translation network confusion, it still adheres to the prior knowledge and avoids generating an aircraft with four wings. However, the extra fuselage still results in an elongated nose on the aircraft.
- Extra bright strips. In Figure 10e–i, bright strips can be classified into two types: periodic and aperiodic. The periodic bright stripes are well eliminated in Figure 10e,f, which hardly affect the results of the transformation. However, the aperiodic bright strips in Figure 10g and the HH SAR image in Figure 10h show the target structure missing in the same place as the artificial optical images. The bright stripes in the tail of the SAR images in Figure 10i arise from the secondary scattering of the rotor and the ground, which are regarded as an entity and added to the tails of the aircraft.
- Missing structures. Due to the edge of the imaging area, the targets in Figure 10e,i have missing wings. With the help of prior information, the translation network restores the wings of the aircraft but with a slight distortion. Proper incomplete information completion is also highly advantageous for target recognition.
7. Conclusions
Author Contributions
Funding
Data Availability Statement
Conflicts of Interest
References
- Li, J.; Yu, Z.; Yu, L.; Cheng, P.; Chen, J.; Chi, C. A Comprehensive Survey on SAR ATR in Deep-Learning Era. Remote Sens. 2023, 15, 1454. [Google Scholar] [CrossRef]
- Liu, L.; Lei, B. Can SAR Images and Optical Images Transfer with Each Other? In Proceedings of the IGARSS 2018–2018 IEEE International Geoscience and Remote Sensing Symposium, Valencia, Spain, 22–27 July 2018. [CrossRef]
- Fuentes Reyes, M.; Auer, S.; Merkle, N.; Henry, C.; Schmitt, M. SAR-to-Optical Image Translation Based on Conditional Generative Adversarial Networks Optimization, Opportunities and Limits. Remote Sens. 2019, 11, 2067. [Google Scholar] [CrossRef]
- Yang, X.; Zhao, J.Y.; Wei, Z.Y.; Wang, N.N.; Gao, X.B. SAR-to-optical image translation based on improved CGAN. Pattern Recognit. 2022, 121, 108208. [Google Scholar] [CrossRef]
- Sun, Y.; Jiang, W.; Yang, J.; Li, W. SAR Target Recognition Using cGAN-Based SAR-to-Optical Image Translation. Remote Sens. 2022, 14, 1793. [Google Scholar] [CrossRef]
- Goodfellow, I.; Pouget-Abadie, J.; Mirza, M.; Xu, B.; Warde-Farley, D.; Ozair, S.; Courville, A.; Bengio, Y. Generative adversarial networks. Commun. ACM 2020, 63, 139–144. [Google Scholar] [CrossRef]
- Gao, F.; Yang, Y.; Wang, J.; Sun, J.; Yang, E.; Zhou, H. A Deep Convolutional Generative Adversarial Networks (DCGANs)-Based Semi-Supervised Method for Object Recognition in Synthetic Aperture Radar (SAR) Images. Remote Sens. 2018, 10, 846. [Google Scholar] [CrossRef]
- Liu, W.; Zhao, Y.; Liu, M.; Dong, L.; Liu, X.; Hui, M. Generating simulated sar images using generative adversarial network. In Proceedings of the Applications of Digital Image Processing XLI. International Society for Optics and Photonics, San Diego, CA, USA, 17 September 2018; Volume 10752, p. 1075205. [Google Scholar]
- Xie, D.; Ma, J.; Li, Y.; Liu, X. Data Augmentation of Sar Sensor Image via Information Maximizing Generative Adversarial Net. In Proceedings of the 2021 IEEE 4th International Conference on Electronic Information and Communication Technology (ICEICT), Xi’an, China, 18–20 August 2021. [Google Scholar] [CrossRef]
- Song, Q.; Xu, F.; Zhu, X.X.; Jin, Y.Q. Learning to Generate SAR Images With Adversarial Autoencoder. IEEE Trans. Geosci. Remote Sens. 2022, 60, 1–15. [Google Scholar] [CrossRef]
- Fan, W.; Zhou, F.; Zhang, Z.; Bai, X.; Tian, T. Deceptive jamming template synthesis for SAR based on generative adversarial nets. Signal Process. 2020, 172, 107528. [Google Scholar] [CrossRef]
- Chen, S.; Wang, H.; Xu, F.; Jin, Y.Q. Target Classification Using the Deep Convolutional Networks for SAR Images. IEEE Trans. Geosci. Remote Sens. 2016, 54, 4806–4817. [Google Scholar] [CrossRef]
- Dudgeon, D.E.; Lacoss, R.T. An overview of automatic target recognition. Linc. Lab. J. 1993, 6, 3–10. [Google Scholar]
- Keydel, E.R.; Lee, S.W.; Moore, J.T. MSTAR extended operating conditions: A tutorial. In Proceedings of the Algorithms for Synthetic Aperture Radar Imagery III. International Society for Optics and Photonics, Orlando, FL, USA, 10 June 1996; Volume 2757, pp. 228–242. [Google Scholar]
- Zhao, Q.; Principe, J.C. Support vector machines for SAR automatic target recognition. IEEE Trans. Aerosp. Electron. Syst. 2001, 37, 643–654. [Google Scholar] [CrossRef]
- Bhanu, B.; Lin, Y. Genetic algorithm based feature selection for target detection in SAR images. Image Vis. Comput. 2003, 21, 591–608. [Google Scholar] [CrossRef]
- Mishra, A.K.; Motaung, T. Application of linear and nonlinear PCA to SAR ATR. In Proceedings of the 2015 25th International Conference Radioelektronika (RADIOELEKTRONIKA), Pardubice, Czech Republic, 21–22 April 2015. [Google Scholar] [CrossRef]
- Majumder, U.; Christiansen, E.; Wu, Q.; Inkawhich, N.; Blasch, E.; Nehrbass, J. High-performance computing for automatic target recognition in synthetic aperture radar imagery. In Proceedings of the Cyber Sensing 2017. International Society for Optics and Photonics, Anaheim, CA, USA, 1 May 2017; Volume 10185, p. 1018508. [Google Scholar]
- Zhang, Y.; Guo, X.; Leung, H.; Li, L. Cross-task and cross-domain SAR target recognition: A meta-transfer learning approach. Pattern Recognit. 2023, 138, 109402. [Google Scholar] [CrossRef]
- Huang, L.; Liu, B.; Li, B.; Guo, W.; Yu, W.; Zhang, Z.; Yu, W. OpenSARShip: A dataset dedicated to Sentinel-1 ship interpretation. IEEE J. Sel. Top. Appl. Earth Obs. Remote Sens. 2017, 11, 195–208. [Google Scholar] [CrossRef]
- Li, B.; Liu, B.; Huang, L.; Guo, W.; Zhang, Z.; Yu, W. OpenSARShip 2.0: A large-volume dataset for deeper interpretation of ship targets in Sentinel-1 imagery. In Proceedings of the 2017 SAR in Big Data Era: Models, Methods and Applications (BIGSARDATA), Beijing, China, 13–14 November 2017. [Google Scholar] [CrossRef]
- Hou, X.; Ao, W.; Song, Q.; Lai, J.; Wang, H.; Xu, F. FUSAR-Ship: Building a high-resolution SAR-AIS matchup dataset of Gaofen-3 for ship detection and recognition. Sci. China Inform. Sci. 2020, 63, 140303. [Google Scholar] [CrossRef]
- Liu, L.; Pan, Z.; Qiu, X.; Peng, L. SAR Target Classification with CycleGAN Transferred Simulated Samples. In Proceedings of the IGARSS 2018—2018 IEEE International Geoscience and Remote Sensing Symposium, Valencia, Spain, 22–27 July 2018. [Google Scholar] [CrossRef]
- Sun, X.; Lv, Y.; Wang, Z.; Fu, K. SCAN: Scattering characteristics analysis network for few-shot aircraft classification in high-resolution SAR images. IEEE Trans. Geosci. Remote Sens. 2022, 60, 5226517. [Google Scholar] [CrossRef]
- Pohl, C.; Van Genderen, J. Remote Sensing Image Fusion; CRC Press: Boca Raton, FL, USA, 2016. [Google Scholar] [CrossRef]
- Merkle, N.; Fischer, P.; Auer, S.; Muller, R. On the possibility of conditional adversarial networks for multi-sensor image matching. In Proceedings of the 2017 IEEE International Geoscience and Remote Sensing Symposium (IGARSS), Fort Worth, TX, USA, 23–28 July 2017. [Google Scholar] [CrossRef]
- Enomoto, K.; Sakurada, K.; Wang, W.; Kawaguchi, N.; Matsuoka, M.; Nakamura, R. Image Translation Between Sar and Optical Imagery with Generative Adversarial Nets. In Proceedings of the IGARSS 2018—2018 IEEE International Geoscience and Remote Sensing Symposium, Valencia, Spain, 22–27 July 2018. [Google Scholar] [CrossRef]
- Schmitt, M.; Hughes, L.H.; Zhu, X.X. The SEN1-2 Dataset for Deep Learning in SAR-Optical Data Fusion. arXiv 2018, arXiv:1807.01569. [Google Scholar] [CrossRef]
- Zhang, J.; Zhou, J.; Li, M.; Zhou, H.; Yu, T. Quality Assessment of SAR-to-Optical Image Translation. Remote Sens. 2020, 12, 3472. [Google Scholar] [CrossRef]
- Hwang, J.; Yu, C.; Shin, Y. SAR-to-Optical Image Translation Using SSIM and Perceptual Loss Based Cycle-Consistent GAN. In Proceedings of the 2020 International Conference on Information and Communication Technology Convergence (ICTC), Jeju Island, Republic of Korea, 21–23 October 2020; pp. 191–194. [Google Scholar]
- Li, Y.; Fu, R.; Meng, X.; Jin, W.; Shao, F. A SAR-to-Optical Image Translation Method Based on Conditional Generation Adversarial Network (cGAN). IEEE Access 2020, 8, 60338–60343. [Google Scholar] [CrossRef]
- Bermudez, J.; Happ, P.; Oliveira, D.; Feitosa, R. SAR to optical image synthesis for cloud removal with generative adversarial networks. ISPRS Ann. Photogramm. Remote Sens. Spat. Inf. Sci. 2018, 4, 5–11. [Google Scholar] [CrossRef]
- Bermudez, J.D.; Happ, P.N.; Feitosa, R.Q.; Oliveira, D.A.B. Synthesis of Multispectral Optical Images From SAR/Optical Multitemporal Data Using Conditional Generative Adversarial Networks. IEEE Geosci. Remote Sens. Lett. 2019, 16, 1220–1224. [Google Scholar] [CrossRef]
- Meraner, A.; Ebel, P.; Zhu, X.X.; Schmitt, M. Cloud removal in Sentinel-2 imagery using a deep residual neural network and SAR-optical data fusion. ISPRS J. Photogramm. Remote Sens. 2020, 166, 333–346. [Google Scholar] [CrossRef] [PubMed]
- Ebel, P.; Meraner, A.; Schmitt, M.; Zhu, X.X. Multisensor Data Fusion for Cloud Removal in Global and All-Season Sentinel-2 Imagery. IEEE Trans. Geosci. Remote Sens. 2021, 59, 5866–5878. [Google Scholar] [CrossRef]
- Zhao, M.; Olsen, P.; Chandra, R. Seeing Through Clouds in Satellite Images. IEEE Trans. Geosci. Remote Sens. 2023, 61, 4704616. [Google Scholar] [CrossRef]
- Li, X.; Zhang, G.; Cui, H.; Hou, S.; Chen, Y.; Li, Z.; Li, H.; Wang, H. Progressive fusion learning: A multimodal joint segmentation framework for building extraction from optical and SAR images. ISPRS J. Photogramm. Remote Sens. 2023, 195, 178–191. [Google Scholar] [CrossRef]
- Toriya, H.; Dewan, A.; Kitahara, I. SAR2OPT: Image Alignment Between Multi-Modal Images Using Generative Adversarial Networks. In Proceedings of the IGARSS 2019, Yokohama, Japan, 28 July–2 August 2019. [Google Scholar] [CrossRef]
- Chen, Z.; Liu, J.; Liu, F.; Zhang, W.; Xiao, L.; Shi, J. Learning Transformations between Heterogeneous SAR and Optical Images for Change Detection. In Proceedings of the IGARSS 2022—2022 IEEE International Geoscience and Remote Sensing Symposium, Kuala Lumpur, Malaysia, 17–22 July 2022. [Google Scholar] [CrossRef]
- Li, X.; Du, Z.; Huang, Y.; Tan, Z. A deep translation (GAN) based change detection network for optical and SAR remote sensing images. ISPRS J. Photogramm. Remote Sens. 2021, 179, 14–34. [Google Scholar] [CrossRef]
- Adrian, J.; Sagan, V.; Maimaitijiang, M. Sentinel SAR-optical fusion for crop type mapping using deep learning and Google Earth Engine. ISPRS J. Photogramm. Remote Sens. 2021, 175, 215–235. [Google Scholar] [CrossRef]
- Zhang, P.; Ban, Y.; Nascetti, A. Learning U-Net without forgetting for near real-time wildfire monitoring by the fusion of SAR and optical time series. Remote Sens. Environ. 2021, 261, 112467. [Google Scholar] [CrossRef]
- Li, J.; Li, C.; Xu, W.; Feng, H.; Zhao, F.; Long, H.; Meng, Y.; Chen, W.; Yang, H.; Yang, G. Fusion of optical and SAR images based on deep learning to reconstruct vegetation NDVI time series in cloud-prone regions. Int. J. Appl. Earth Obs. Geoinf. 2022, 112, 102818. [Google Scholar] [CrossRef]
- Mao, Y.; Van Niel, T.G.; McVicar, T.R. Reconstructing cloud-contaminated NDVI images with SAR-Optical fusion using spatio-temporal partitioning and multiple linear regression. ISPRS J. Photogramm. Remote Sens. 2023, 198, 115–139. [Google Scholar] [CrossRef]
- Fu, S.; Xu, F.; Jin, Y.Q. Reciprocal translation between SAR and optical remote sensing images with cascaded-residual adversarial networks. arXiv 2019, arXiv:1901.08236. [Google Scholar] [CrossRef]
- Lewis, B.; Scarnati, T.; Sudkamp, E.; Nehrbass, J.; Rosencrantz, S.; Zelnio, E. A SAR dataset for ATR development: The Synthetic and Measured Paired Labeled Experiment (SAMPLE). In Proceedings of the Algorithms for Synthetic Aperture Radar Imagery XXVI. International Society for Optics and Photonics, Baltimore, MD, USA, 14 May 2019; Volume 10987, p. 109870H. [Google Scholar]
- Auer, S.; Hinz, S.; Bamler, R. Ray-Tracing Simulation Techniques for Understanding High-Resolution SAR Images. IEEE Trans. Geosci. Remote Sens. 2010, 48, 1445–1456. [Google Scholar] [CrossRef]
- Gartley, M.; Goodenough, A.; Brown, S.; Kauffman, R.P. A comparison of spatial sampling techniques enabling first principles modeling of a synthetic aperture RADAR imaging platform. In Proceedings of the Algorithms for Synthetic Aperture Radar Imagery XVII, International Society for Optics and Photonics, Orlando, FL, USA, 18 April 2010; Volume 7699, p. 76990N. [Google Scholar]
- Du, S.; Hong, J.; Wang, Y.; Qi, Y. A High-Quality Multicategory SAR Images Generation Method With Multiconstraint GAN for ATR. IEEE Geosci. Remote Sens. Lett. 2022, 19, 4011005. [Google Scholar] [CrossRef]
- Oh, J.; Kim, M. PeaceGAN: A GAN-Based Multi-Task Learning Method for SAR Target Image Generation with a Pose Estimator and an Auxiliary Classifier. Remote Sens. 2021, 13, 3939. [Google Scholar] [CrossRef]
- Ulyanov, D.; Vedaldi, A.; Lempitsky, V. Instance normalization: The missing ingredient for fast stylization. arXiv 2016, arXiv:1607.08022. [Google Scholar]
- He, K.; Zhang, X.; Ren, S.; Sun, J. Deep residual learning for image recognition. In Proceedings of the IEEE Conference on Computer Vision and Pattern Recognition, San Juan, PR, USA, 17–19 June 1997; pp. 770–778. [Google Scholar]
- Radford, A.; Metz, L.; Chintala, S. Unsupervised representation learning with deep convolutional generative adversarial networks. arXiv 2015, arXiv:1511.06434. [Google Scholar]
- Arjovsky, M.; Chintala, S.; Bottou, L. Wasserstein generative adversarial networks. In Proceedings of the International Conference on Machine Learning, PMLR, Sydney, Australia, 6–11 August 2017; pp. 214–223. [Google Scholar]
- Karras, T.; Laine, S.; Aila, T. A style-based generator architecture for generative adversarial networks. In Proceedings of the IEEE/CVF Conference on Computer Vision and Pattern Recognition, Long Beach, CA, USA, 15–20 June 2019; pp. 4401–4410. [Google Scholar]
- Zhang, R.; Isola, P.; Efros, A.A.; Shechtman, E.; Wang, O. The Unreasonable Effectiveness of Deep Features as a Perceptual Metric. In Proceedings of the 31st IEEE/CVF Conference on Computer Vision and Pattern Recognition (CVPR), Salt Lake City, UT, USA, 18–23 June 2018; pp. 586–595. [Google Scholar] [CrossRef]


| Layer Information | Output Shape |
|---|---|
| Cov(C64, K7, S1, P3) + InsNorm + ReLU | (64 × 256 × 256) |
| Cov(C128, K3, S2, P1) + InsNorm + ReLU | (128 × 128 × 128) |
| Cov(C256, K3, S2, P1) + InsNorm + ReLU | (256 × 64 × 64) |
| ResBlock(C256) | (256 × 64 × 64) |
| … | |
| Upsample(S2) | (256 × 128 × 128) |
| Cov(C128, K3, S1, P1) + InsNorm + ReLU | (128 × 128 × 128) |
| Upsample(S2) | (128 × 256 × 256) |
| Cov(C64, K3, S1, P1) + InsNorm + ReLU | (64 × 256 × 256) |
| Cov(C1, K7, S1, P3) + Tanh | (1 × 256 × 256) |
| Layer Information | Output Shape |
|---|---|
| Cov(C64, K4, S2, P1) + InsNorm + LeakyReLU | (64 × 128 × 128) |
| Cov(C128, K4, S2, P1) + InsNorm + LeakyReLU | (128 × 64 × 64) |
| Cov(C256, K4, S2, P1) + InsNorm + LeakyReLU | (256 × 32 × 32) |
| Cov(C512, K4, S2, P1) + InsNorm + LeakyReLU | (512 × 16 × 16) |
| Cov(C1, K4, S1, P1) | (1 × 15 × 15) |
| Layer Information | Output Shape |
|---|---|
| Linear(C512) + LeakyReLU | (1 × 512) |
| Linear(C256) + LeakyReLU | (1 × 256) |
| Linear(C1) | (1 × 1) |
| SAR | Pix2Pix | SOIF-CycleGAN | Optical | |
|---|---|---|---|---|
| SSIM↑ | 0.4312 | 0.7420 | 0.8000 | 1 |
| PSNR↑ | 18.1603 | 21.4738 | 22.5710 | |
| LPIPS↓ | 0.4253 | 0.1236 | 0.0855 | 0 |
| Samples | 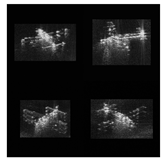 |  |  |  |
| Experiment | Input Channel | Training Data | Test Data | Accuracy |
|---|---|---|---|---|
| 0 | One | Real SAR | Real SAR | 79.92% |
| 1 | Two | Real SAR | Real optical | Real SAR | Real optical | 86.00% |
| Real SAR | Artificial optical | 85.50% | |||
| 2 | One | Real + Artificial SAR | Real SAR | 81.54% |
| 3 | Two | Real + Artificial SAR | Real optical | Real SAR | Real optical | 87.61% |
| Real SAR | Artificial optical | 86.25% |
| Type | SSIM↑ | PSNR↑ | LPIPS↓ | Samples |
|---|---|---|---|---|
| SAR | 0.4312 | 18.1603 | 0.4253 |  |
| CycleGAN | 0.6575 | 20.0650 | 0.1673 |  |
| L1 | 0.7830 | 22.2319 | 0.1262 | 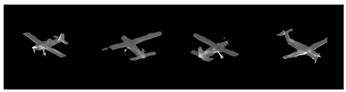 |
| SSIM | 0.7412 | 21.7073 | 0.1417 | 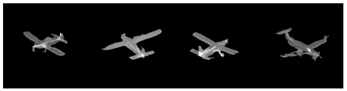 |
| LPIPS | 0.7765 | 21.8677 | 0.0894 |  |
| CycleGAN + L1 | 0.7917 | 22.5961 | 0.1122 | 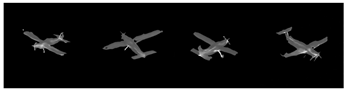 |
| CycleGAN + SSIM | 0.7589 | 22.3098 | 0.1169 |  |
| CycleGAN + LPIPS | 0.7880 | 22.0856 | 0.0857 | 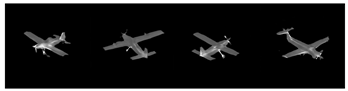 |
| CycleGAN + L1 + LPIPS | 0.7999 | 22.4452 | 0.0879 |  |
| CycleGAN + SSIM + LPIPS | 0.7975 | 22.4793 | 0.0881 | 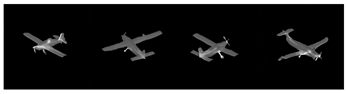 |
Disclaimer/Publisher’s Note: The statements, opinions and data contained in all publications are solely those of the individual author(s) and contributor(s) and not of MDPI and/or the editor(s). MDPI and/or the editor(s) disclaim responsibility for any injury to people or property resulting from any ideas, methods, instructions or products referred to in the content. |
© 2023 by the authors. Licensee MDPI, Basel, Switzerland. This article is an open access article distributed under the terms and conditions of the Creative Commons Attribution (CC BY) license (https://creativecommons.org/licenses/by/4.0/).
Share and Cite
Sun, Y.; Yan, K.; Li, W. CycleGAN-Based SAR-Optical Image Fusion for Target Recognition. Remote Sens. 2023, 15, 5569. https://doi.org/10.3390/rs15235569
Sun Y, Yan K, Li W. CycleGAN-Based SAR-Optical Image Fusion for Target Recognition. Remote Sensing. 2023; 15(23):5569. https://doi.org/10.3390/rs15235569
Chicago/Turabian StyleSun, Yuchuang, Kaijia Yan, and Wangzhe Li. 2023. "CycleGAN-Based SAR-Optical Image Fusion for Target Recognition" Remote Sensing 15, no. 23: 5569. https://doi.org/10.3390/rs15235569
APA StyleSun, Y., Yan, K., & Li, W. (2023). CycleGAN-Based SAR-Optical Image Fusion for Target Recognition. Remote Sensing, 15(23), 5569. https://doi.org/10.3390/rs15235569