4.1. The Spatial MIM Network
Time series prediction involves fitting a function to historical moment data to predict future values [
38]. An effective prediction model should be able to capture the intrinsic variation in continuous time, which comprises a low-frequency stationarity component and a high-frequency non-stationarity component. While existing methods can fit the low-frequency stationarity component well, accurately modeling the high-frequency non-stationarity component remains a significant challenge in time series prediction tasks. In particular, the radar reflectivity image sequence is a natural space-time process in which adjacent pixels are closely related, and their joint distribution rapidly changes with time, resulting in complex non-stationarity in both time and space. Therefore, learning the high-frequency components based on temporal and spatial non-stationarity is crucial for radar reflectivity image prediction tasks.
The results of the study reveal [
31] that while models such as PredRNN have made some progress in addressing the issue of temporal and spatial information transfer, their forgetting gate settings are overly simplistic and cannot effectively predict higher-order components of spatiotemporal non-stationarity. This drawback leads to partial blurring of the predicted image and diminishes the model’s prediction effectiveness. Specifically, experiments [
29] using the PredRNN model for precipitation prediction reveal that the forgetting gate is saturated in 80% of the time, leading to a significant loss of high-frequency non-stationarity components in the forecast process. Consequently, the prediction results are dominated by the forecasts of low-frequency stationarity components.
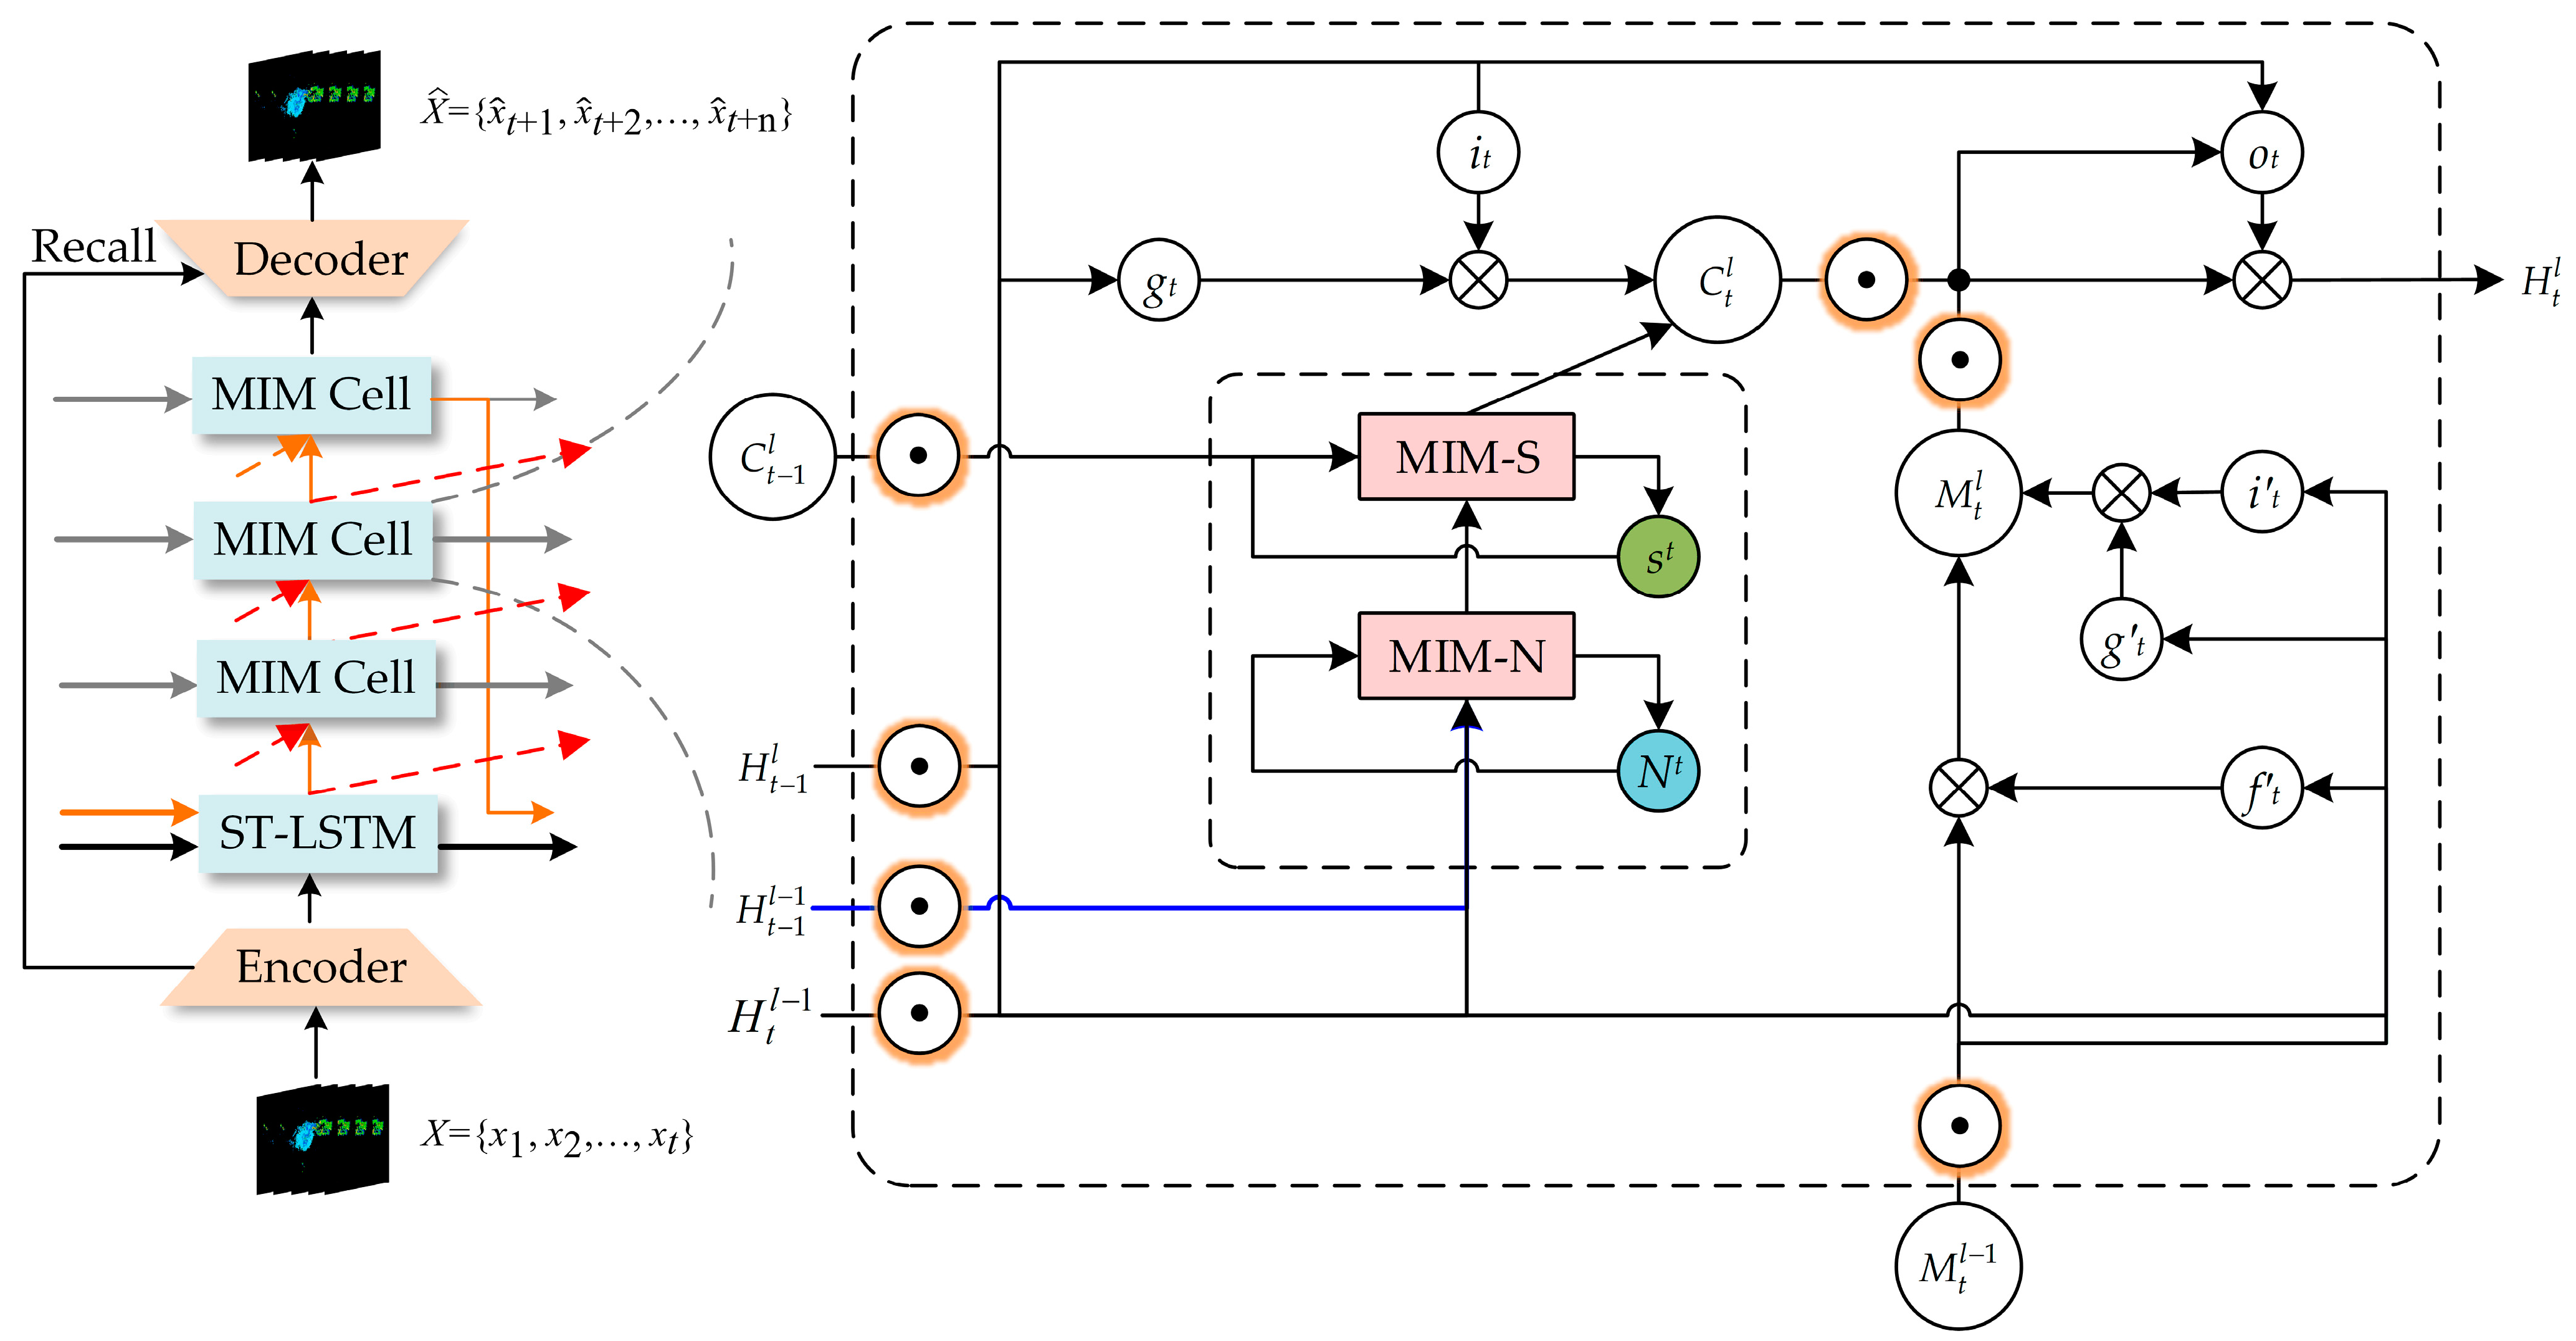
In comparison to the PredRNN, the proposed model provides better prediction of the higher-order components of spatiotemporal non-stationarity. Specifically, the input images to the Spatial MIM network are radar reflectivity images with a sequence length of five, and the output is a sequence of radar reflectivity images at future 5 moments. The Spatial MIM network is a six-layer network comprising an encoder, an ST-LSTM layer, three modified MIM layers and a decoder layer. The design of the Spatial MIM network is derived from the MIM network, which aims to replace the easily saturated forgetting gate in the ST-LSTM network with two cascaded temporal memory modules.
The memory module is shown in
Figure 3 and
Figure 4. Its formulas can be expressed as follows:
where
Ntl and
Stl denote the memory units in MIM-N and MIM-S, respectively,
Dtl is learned by MIM-N and used as the input of MIM-S,
Ttl is the memory passing the virtual “forget gate”,
Ctl is the standard temporal cell,
Mtl is the spatiotemporal memory,
Htl is the hidden state,
it is the input gate,
ot is the output gate,
ft is the forget gate,
gt is the input-modulation gate,
σ is sigmoid activation function and * means that function
A acts on array
B in
A *
B.
The first module is a non-stationarity module with inputs
htl−1 and
ht-1l−1. This module represents high-frequency non-stationary changes through the difference between the two inputs. The second module is the stationary module, and the input is the output of the non-stationary module
Dtl and the external temporary memory
Ct-1l. This module is used to represent low-frequency stationarity variations in spatiotemporal sequences. The above two modules are cascaded and used to replace the forgetting gate in ST-LSTM. It can better forecast high-frequency non-stationary variations. The formulas for the MIM-N module are shown as follows:
where the non-stationary variation in the spatiotemporal series is represented by the difference (
Htl−1 −
Ht−1l−1). The formulas of the MIM-S module are shown as follows:
When the value of differential feature Dtl is very small, the non-stationary variation is not severely expressed. At this time, the MIM-S module will mainly use the original memory. When the value of the difference feature Dtl is large, the MIM-S module will overwrite the original memory.
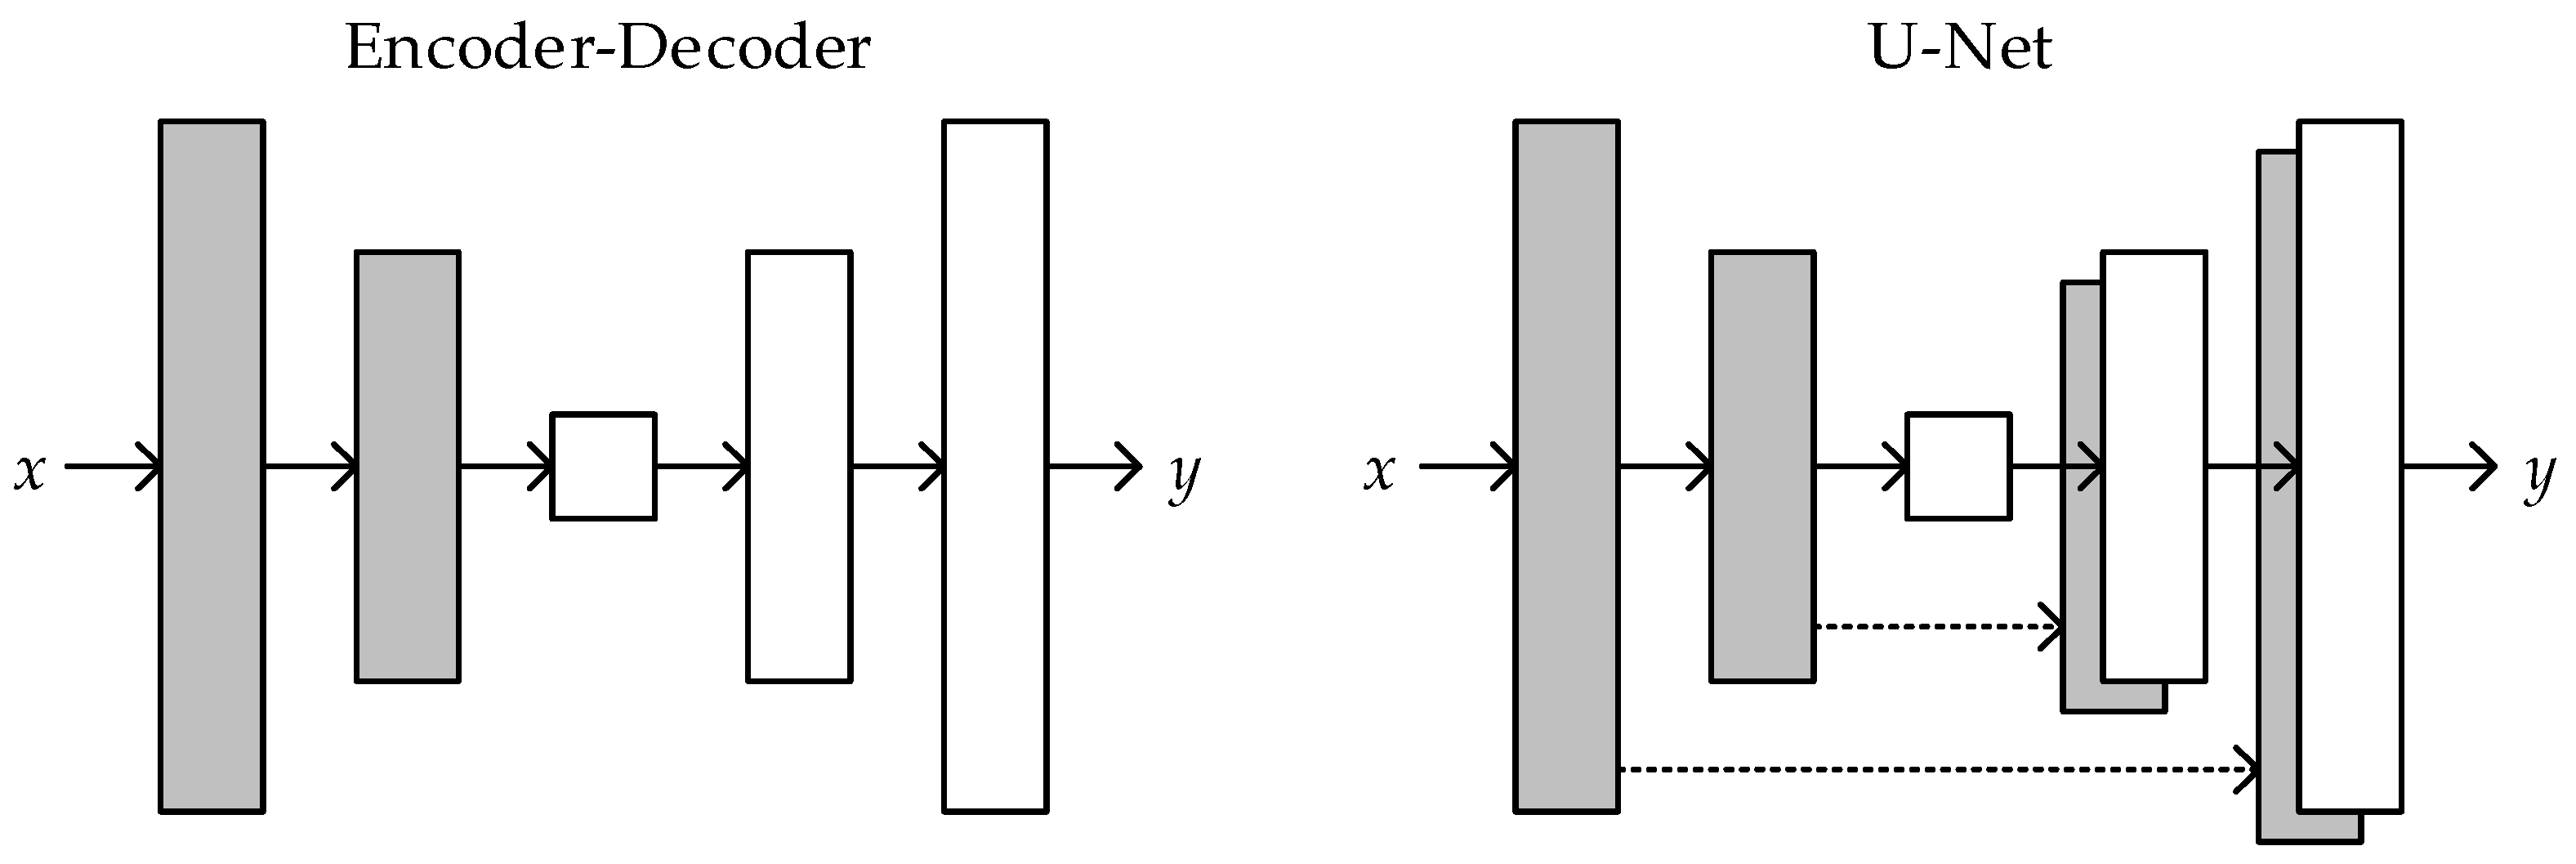
During training, the encoder and decoder [
39,
40] are required to effectively transfer information from the bottom layer to the top layer and preserve the spatial high-frequency components of the image. The encoder encodes the input
Xt into deep features, which extract useful spatial information that helps the state transfer unit make accurate spatial predictions. The decoder saves the useful spatial information and decodes the predicted spatial states as outputs.
The structure diagram of the Spatial MIM network is shown in
Figure 4, and the formulas of the encoder and decoder are presented as follows:
where
Enc denotes encoder and
Dec denotes decoder.
Considering that some high-frequency components of spatial information will be lost during encoding, the information recall scheme is used when constructing the encoder and decoder. By using the information recall scheme, each layer of the decoder can obtain information from multiple layers of the encoder. This information can help generate better forecast images with a more complete retention of the high-frequency component of spatial information. The formula of the information recall scheme is shown as follows:
where
Dl denotes the decoding features from layer
l of the decoder and
El~N denotes the encoding features from layer
l to layer
N of the encoder.
In this paper, we replace the 5 × 5 convolution filter in the MIM module with two 3 × 3 convolution filters and change the normalization method, resulting in three advantages: increased network depth, reduced model parameters and reduced risk of the exploding gradient problem. The orange circles in
Figure 3 and
Figure 4 represent our modified two-layer convolutional filter, which consists of a convolutional layer, a LayerNorm layer and a ReLU layer. The structure is shown in
Figure 5. The first convolutional layer of the two-layer convolutional filter is followed by a ReLU activation function, and the second convolutional layer is followed by a tanh or sigmoid activation function.
4.2. Prediction Results of the Spatial MIM Network
In this section, we present the experimental results of the proposed Spatial MIM network and compare it with other models, namely Convlstm, PredRNN, PredRNN++ and MIM. To evaluate the performance of the models, we use evaluation indicators and analyze the results. All models were trained using 5337 sample sequences and tested using 800 sample sequences to evaluate the model performance.
The original radar reflectivity image is a 220-graded pseudo-color image, and the radar reflectivity image obtained from the forecast is a color image. Therefore, we perform a similarity measure for each pixel point in the forecast radar reflectivity image and convert the image to a 220-graded pseudo-color image.
4.2.1. Meteorological Evaluation Indicators
To evaluate the models under different degrees of meteorological disasters, a threshold is set for the reflectivity intensity. Pixel points with reflectivity intensity lower than the reflectivity threshold are changed to background black, while pixel points with reflectivity intensity larger than the reflectivity threshold retain their original color. The evaluation is conducted by classifying each point on the forecast image after setting the threshold as “predicted yes” or “predicted no”. Likewise, each point on the labeled image after setting the threshold is classified as “observed yes” or “observed no”. The details are shown in
Table 1.
POD,
FAR,
CSI and
ETS, which are commonly used in the field of meteorology, were selected as evaluation indicators, and the formulas are shown below.
The POD represents the proportion of successful forecasts among the total number of events; the FAR represents the proportion of incorrect forecasts among the total number of forecast events; the CSI represents the comprehensive level of POD and FAR; the ETS represents a more comprehensive evaluation of hits through penalizing misses and false alarms and adjusting hits associated with random chance. Larger POD, CSI and ETS values indicate greater model performance, while smaller FAR values indicate greater model performance.
Using the
POD,
FAR,
CSI and
ETS scores evaluated from the test set, we quantitatively assess the model’s overall performance.
Table 2 lists the
POD,
FAR,
CSI and
ETS scores of the models with the threshold of 0 DBZ. Compared with the Convlstm, the other four models have higher
POD,
CSI and
ETS scores. Although the Convlstm outperforms the other four models in
FAR during the first two prediction moments, it falls short in subsequent moments. The PredRNN outperforms the Convlstm on
POD,
CSI and
ETS scores but falls short on
FAR score, showing that its predicted results are more accurate and closer to reality. At the same time, the experiments result also exhibits the ST-SLTM module’s effectiveness. When compared to the PredRNN, the PredRNN++ and the MIM perform better. As a result, the feasibility of using cascaded memory modules to replace ST-SLTM modules was demonstrated. Among the five models, the Spatial MIM model proposed in this article has the highest
POD,
CSI and
ETS scores while also having the least
FAR score. The Spatial MIM achieved the best prediction results, proving the superiority of the proposed method.
Table 3,
Table 4 and
Table 5 list the
POD,
FAR,
CSI and
ETS scores of the models with the threshold of 20, 25 and 30 DBZ. When the threshold value is 30DBZ, the MIM has a lower
FAR score than the Spatial MIM and a lower fraction of prediction error events. However, it is clear that the Spatial MIM proposed in this paper has higher
POD,
CSI and
ETS scores while having a lower
FAR score most of the time. Experiments show that the Spatial MIM proposed in this paper can complete the spatiotemporal modeling well and forecast convective weather more accurately.
4.2.2. Mathematical Evaluation Indicators
The most common mathematical evaluation indicators used for assessing the performance of prediction models are Mean Absolute Error (
MAE), Root-Mean-Square Error (
RMSE), Correlation Coefficient (
CC), Skill Score (
SS), Mean Error (
ME) and Normalized Root-Mean-Square Error (
NRMSE). Thus, the mathematical evaluation indicators used in this paper are expressed as follows:
where
and
represents the actual pixel values and the predicted pixel values,
n represents the total number of pixels,
MSES represents the
MSE score of the Spatial MIM and
MSEf represents the
MSE score of the comparison network.
Larger CC, SS values indicate greater model performance, while smaller MAE, RMSE, NRMSE values indicate greater model performance. At the same time, ME value closer to 0 indicate greater model performance.
The mathematical evaluation indicators of the models averaged over all moments and the time required to predict a time series are listed in
Table 6. In comparison to Convlstm and PredRNN, the other three models have higher
CC value and lower
SS value. This represents an improvement in the correlation between the forecast and real images, as well as a decrease in forecast error. Although the
RMSE value for RredRNN++ and
MAE and
ME values for MIM are the same as for the Spatial MIM, the Spatial MIM performs better on other Mathematical evaluation indicators. Although the increased network depth adds some time consumption. In a sequence of radar reflectivity images, the time interval between two neighboring images is severe minutes, whereas our prediction of a complete sequence takes 0.97 s. This time consumption is acceptable in comparison to the performance improvement. In summary, the prediction method presented in this paper can perform better in the area of radar reflectivity image prediction.
4.2.3. Ablation Study
We performed an ablation study on the spatial MIM network to validate the effectiveness of the model improvement. The details are shown in
Table 7 and
Table 8:
The evaluation indicators reveals that the performance of the Spatial MIM is not only superior to MIM, but also better than the Spatial MIM with no E and the Spatial MIM with no D. It can be seen that the improvements made in this paper for the MIM are effective and can better predict the radar reflectivity images.
4.2.4. Reflectivity Forecast Images
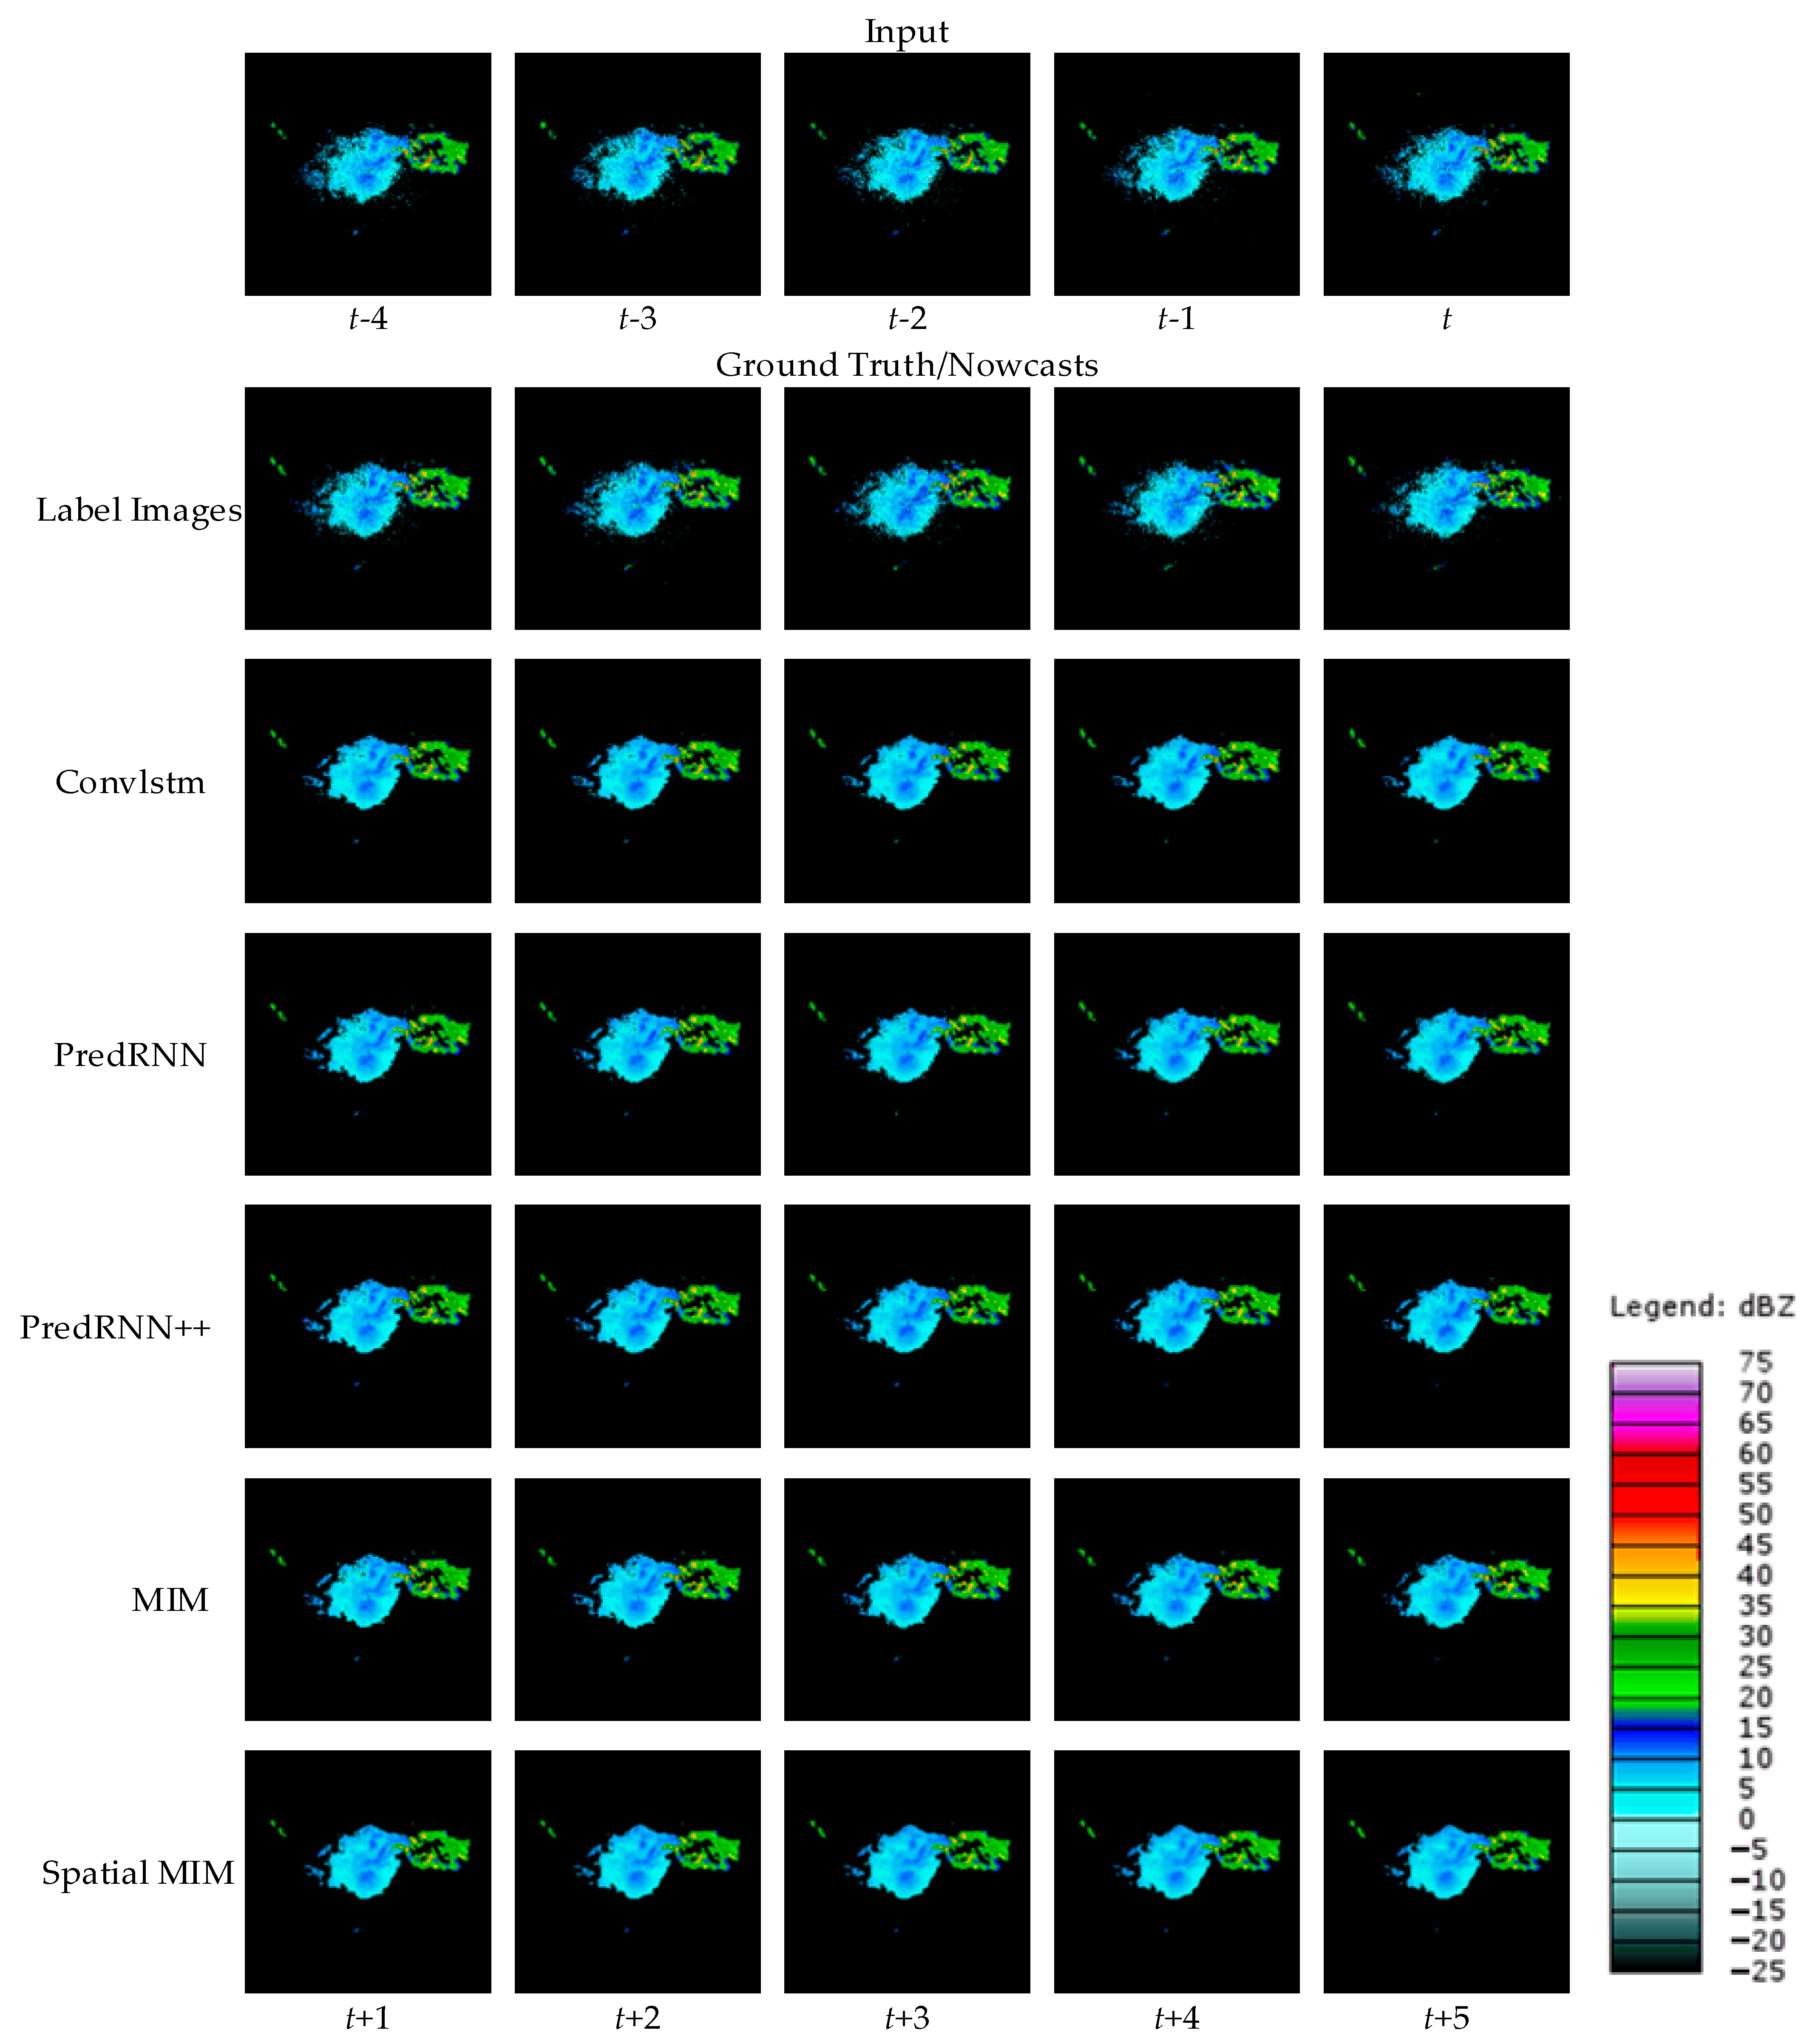
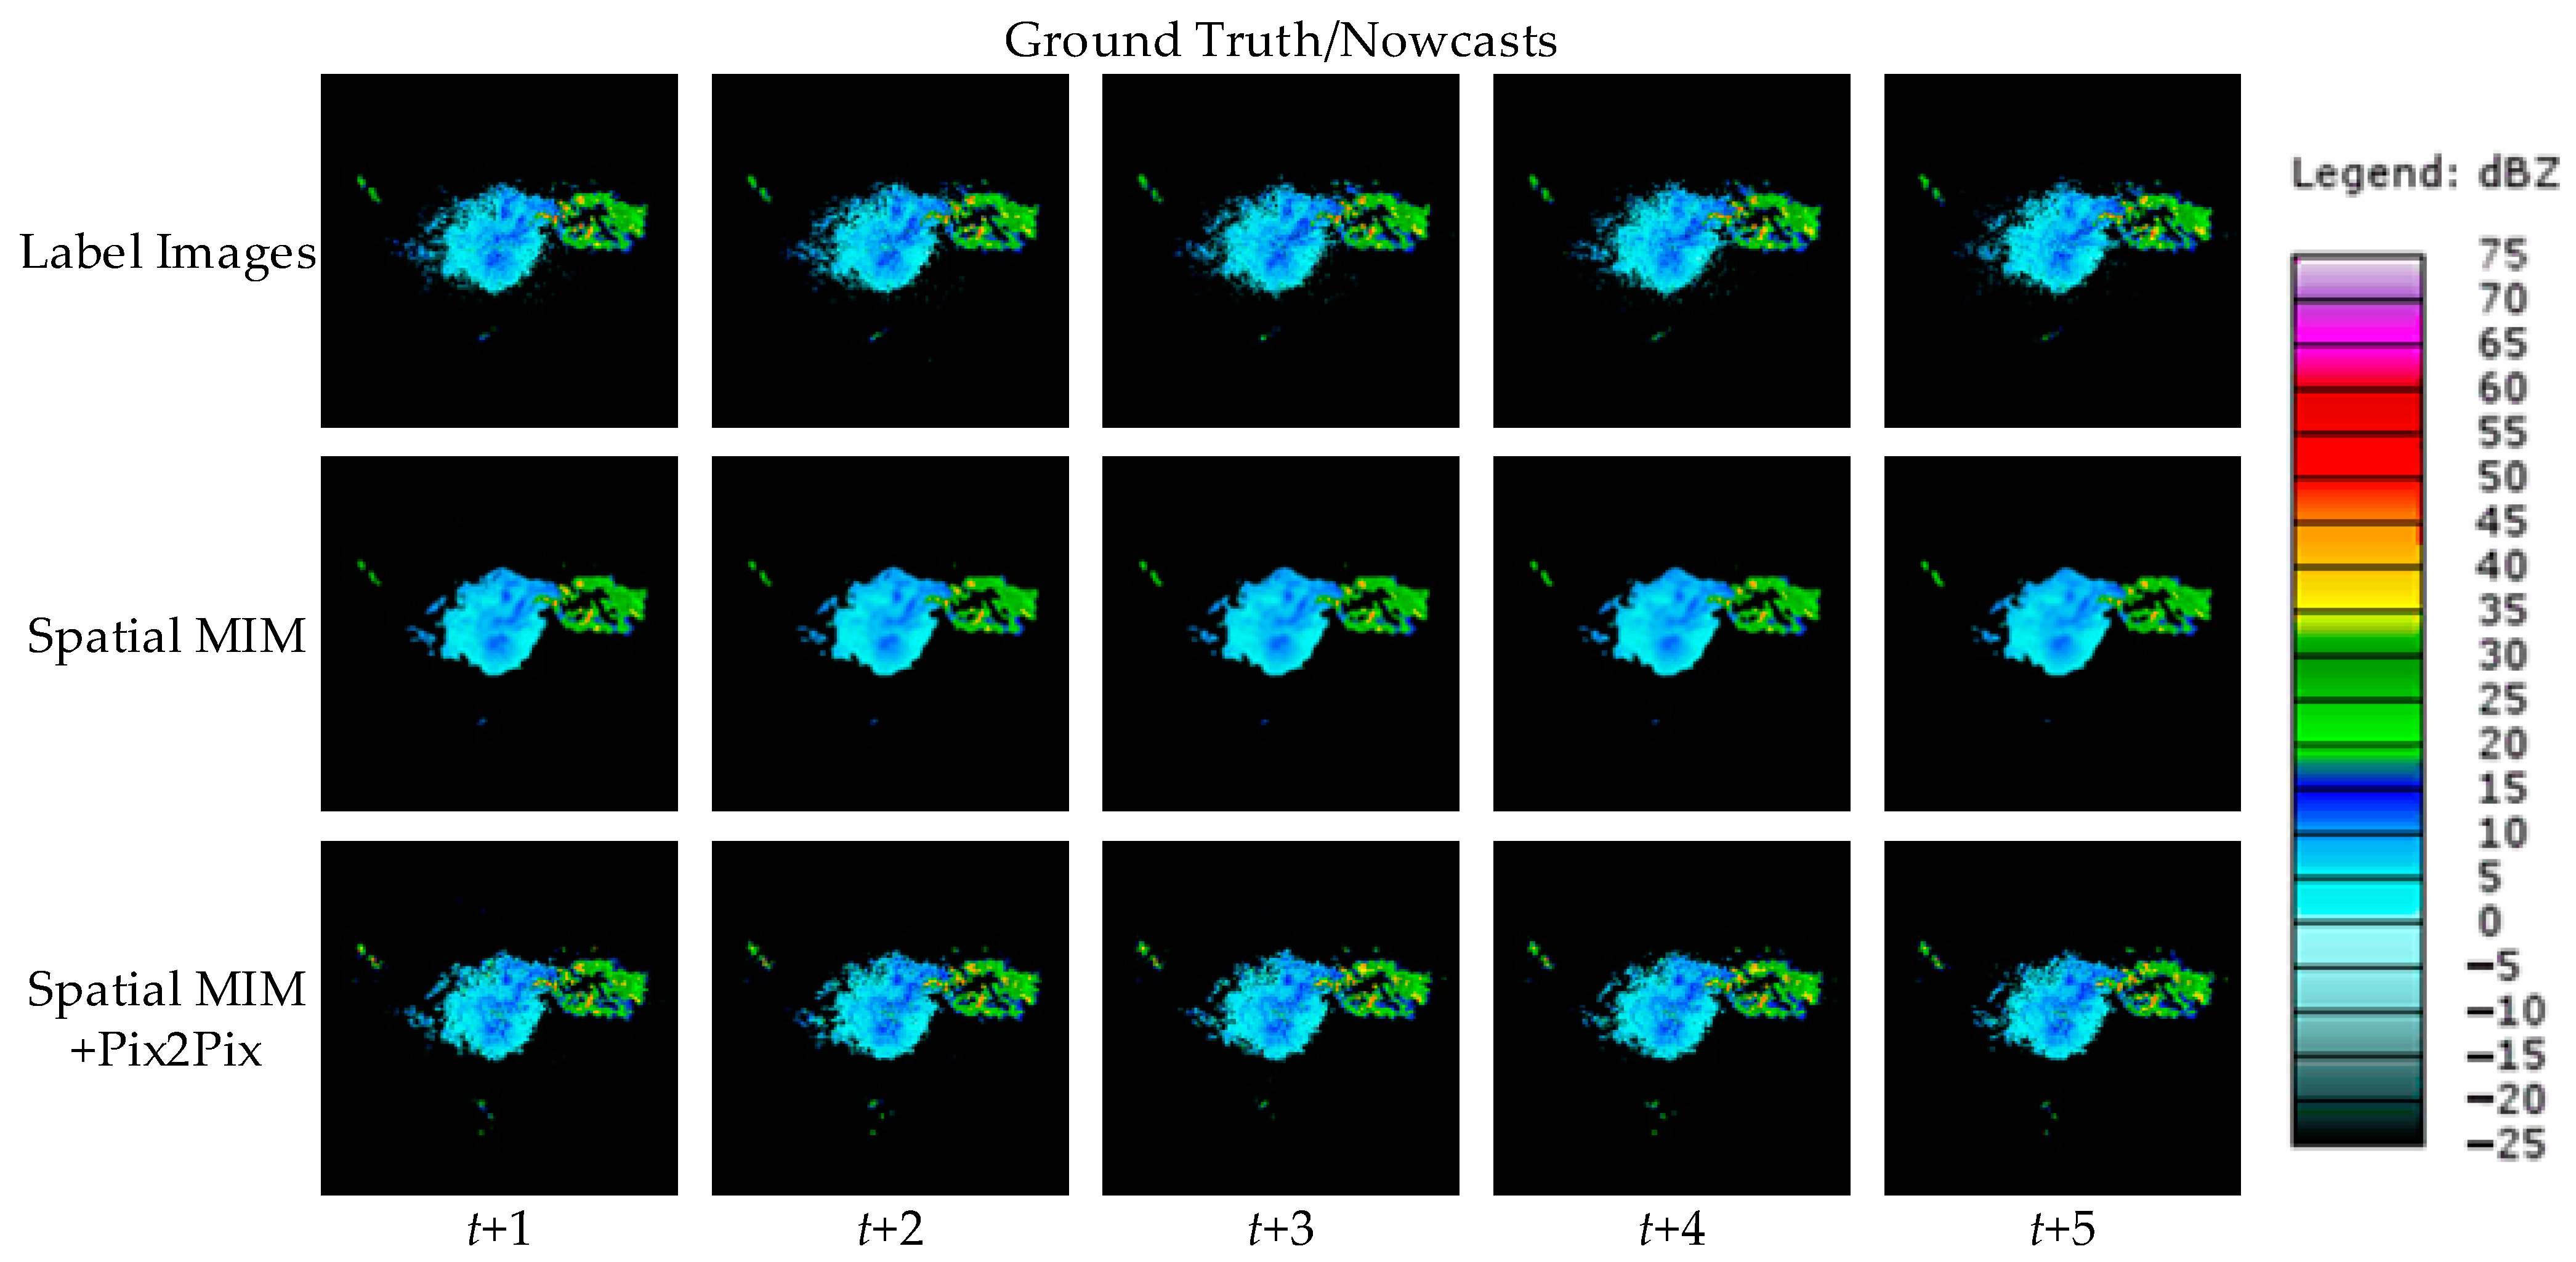
To visually represent the performance of the model proposed in this paper, two cases are randomly selected from the test set and the forecast results of different models are shown.
Figure 6 and
Figure 7 show the observed images and forecast results of the two cases.
As demonstrated by the above two cases, all four comparison models can produce roughly accurate prediction predictions. However, compared with other comparable models, Spatial MIM produces better extrapolation results. At the same time, it can complete as much of the forecast of high-frequency components as possible while minimizing detail loss. Through the evaluation indexes and forecast images, it is easy to see that Spatial MIM has superior spatial and temporal modeling capabilities for the complex nonlinear process of convective echoes. While RNN networks provide accurate forecasts, they do have limits, which are described in detail in
Section 4.

