Article

A Novel Hybrid Method for Urban Green Space Segmentation from High-Resolution Remote Sensing Images

1
State Key Laboratory of Resources and Environmental Information System, Institute of Geographic Sciences and Natural Resources Research, Chinese Academy of Sciences, Beijing 100101, China
2
School of Automation, Nanjing University of Information Science & Technology, Nanjing 210044, China
3
School of Software, Nanjing University of Information Science & Technology, Nanjing 210044, China
4
China Centre for Resources Satellite Data and Application, Beijing 100094, China
5
School of Geographical Sciences, Nanjing University of Information Science & Technology, Nanjing 210044, China
*
Author to whom correspondence should be addressed.
Remote Sens. 2023, 15(23), 5472; https://doi.org/10.3390/rs15235472
Submission received: 14 October 2023 / Revised: 13 November 2023 / Accepted: 21 November 2023 / Published: 23 November 2023
(This article belongs to the Special Issue Remote Sensing Applications in Land Use and Land Cover Monitoring)

Abstract

:
The comprehensive use of high-resolution remote sensing (HRS) images and deep learning (DL) methods can be used to further accurate urban green space (UGS) mapping. However, in the process of UGS segmentation, most of the current DL methods focus on the improvement of the model structure and ignore the spectral information of HRS images. In this paper, a multiscale attention feature aggregation network (MAFANet) incorporating feature engineering was proposed to achieve segmentation of UGS from HRS images (GaoFen-2, GF-2). By constructing a new decoder block, a bilateral feature extraction module, and a multiscale pooling attention module, MAFANet enhanced the edge feature extraction of UGS and improved segmentation accuracy. By incorporating feature engineering, including false color image and the Normalized Difference Vegetation Index (NDVI), MAFANet further distinguished UGS boundaries. The UGS labeled datasets, i.e., UGS-1 and UGS-2, were built using GF-2. Meanwhile, comparison experiments with other DL methods are conducted on UGS-1 and UGS-2 to test the robustness of the MAFANet network. We found the mean Intersection over Union (MIOU) of the MAFANet network on the UGS-1 and UGS-2 datasets was 72.15% and 74.64%, respectively; outperforming other existing DL methods. In addition, by incorporating false color image in UGS-1, the MIOU of MAFANet was improved from 72.15% to 74.64%; by incorporating vegetation index (NDVI) in UGS-1, the MIOU of MAFANet was improved from 72.15% to 74.09%; and by incorporating false color image and the vegetation index (NDVI) in UGS-1, the MIOU of MAFANet was improved from 72.15% to 74.73%. Our experimental results demonstrated that the proposed MAFANet incorporating feature engineering (false color image and NDVI) outperforms the state-of-the-art (SOTA) methods in UGS segmentation, and the false color image feature is better than the vegetation index (NDVI) for enhancing green space information representation. This study provided a practical solution for UGS segmentation and promoted UGS mapping.

1. Introduction

UGS is one of the important components of the urban ecosystem and plays an important role in ecological environment, public health, social economy, and other aspects [1,2,3,4]. In recent years, to promote sustainable planetary health, providing balanced UGS resources for urban residents has become an increasingly important goal for governments and institutions at all levels around the world [5,6]. To promote equitable access to UGS, it is essential to gain insights into the distribution of UGS. Such insights can aid in the development of well-informed policies and the allocation of funds [7]. While the Statistical Yearbook may provide an approximate area of UGS in a given region or city, obtaining precise UGS distribution data remains a challenge [8]. Furthermore, some areas lack reliable information regarding UGS distribution, posing significant obstacles to effective policy development and resource allocation. Therefore, to supply reliable basic geographical information for in-depth UGS research, it is crucial to conduct fine-grained and accurate extraction of UGS.
With the advancement and application of remote sensing technology, a variety of remote sensing images have become valuable sources of data for obtaining urban geographical information coverage [9]. For instance, Sun et al. [10] utilized MODIS data to extract UGS in certain Chinese cities. Jun et al. [11] constructed GlobeLand30 data based on Landsat images. In another study, Huang et al. [12] calculated object UGS coverage based on Landsat images to evaluate changes in health benefits when UGS exists. However, despite the rich data provided by multispectral images, their lower spatial resolution often limits the precision of the UGS information obtained. Furthermore, compared with low- and medium-resolution remote sensing images such as MODIS and Landsat, HRS images can provide more and more detailed ground information, helping to refine the extraction of UGS. At the same time, UGS extraction methods mainly include traditional machine learning methods and DL methods. Machine learning includes maximum likelihood methods, Random Forest, support vector machines, etc. For example, Yang et al. [13] and Huang et al. [14] applied machine learning methods to extract green space coverage information. However, these methods necessitate manual feature engineering for classification, which can be time-consuming, labor-intensive, and have a low degree of automation.
DL can automatically extract multi-level features and finds widespread application across domains [15], including computer vision [16], natural language processing [17], and more. In the realm of remote sensing image interpretation, DL algorithms such as U-Net [18], FCNs [19], SegNet [20], DeepLabv3+ [21], etc., have been widely adopted. For example, Liu et al. [22] used DeepLabv3+ and Tong et al. [23] used residual networks to automatically obtain UGS distribution from GF-2 images, respectively. The automated extraction of high-resolution UGS has assumed increasing importance [24,25]. Although deep learning methods have achieved good application results in UGS classification tasks, current methods mostly focus on the improvement of DL networks, ignoring the spectral information of HRS images. Harnessing this spectral information to its full potential has the potential to further improve the accuracy of UGS classification. To this end, we propose a MAFANet network that incorporates feature engineering. The network uses ResNet50 as the backbone network. In terms of feature extraction, we constructed a multiscale pooling attention (MSPA) module. The MSPA module focuses on extracting the contextual information of multiscale UGS, which in turn enhances the relevance of the MAFANet model in capturing long-range feature information of UGS, which is more effective than ordinary convolution in extracting features. The decoder module consists of a new decoder block (DE) and a bilateral feature fusion (BFF). We build the decoder module to enhance the dual-channel communication capability, allowing the two adjacent layers of the ResNet50 network to guide each other for feature mining. And it helps in the recovery and fusion of the acquired image feature information by the decoder module. False color image synthesis and NDVI vegetation index are incorporated to enhance the identification of UGS boundary can effectively improve the segmentation accuracy of UGS.
In summary, our main contributions are as follows:
(1)
Design the MSPA module to extract the intra-contextual information of multiscale UGS, and then improve the relevance of the MAFANet model to capture the long-range feature information of UGS, thus improving the overall USG segmentation effect;
(2)
Designing the DE and BFF module construction new decoder to enhance the dual-channel communication capability, so that the two neighboring layers of ResNet50 network can guide each other in feature mining and improve the anti-interference capability of the MAFANet model;
(3)
Introducing false color image synthesis and NDVI vegetation index to improve segmentation accuracy while proving that false color feature is better than the vegetation index in the process of UGS information extraction.

2. Materials and Methods

This paper combines HRS image band information and the vegetation index to propose a DL method (MAFANet) based on encoding and decoding structure. This method uses attention aggregation and bilateral feature fusion to realize the utilization of multi-scale information and can effectively segment green areas. Figure 1 shows the overall structure of MAFANet, which consists of the ResNet50, MSPA, BFF, and DE modules.

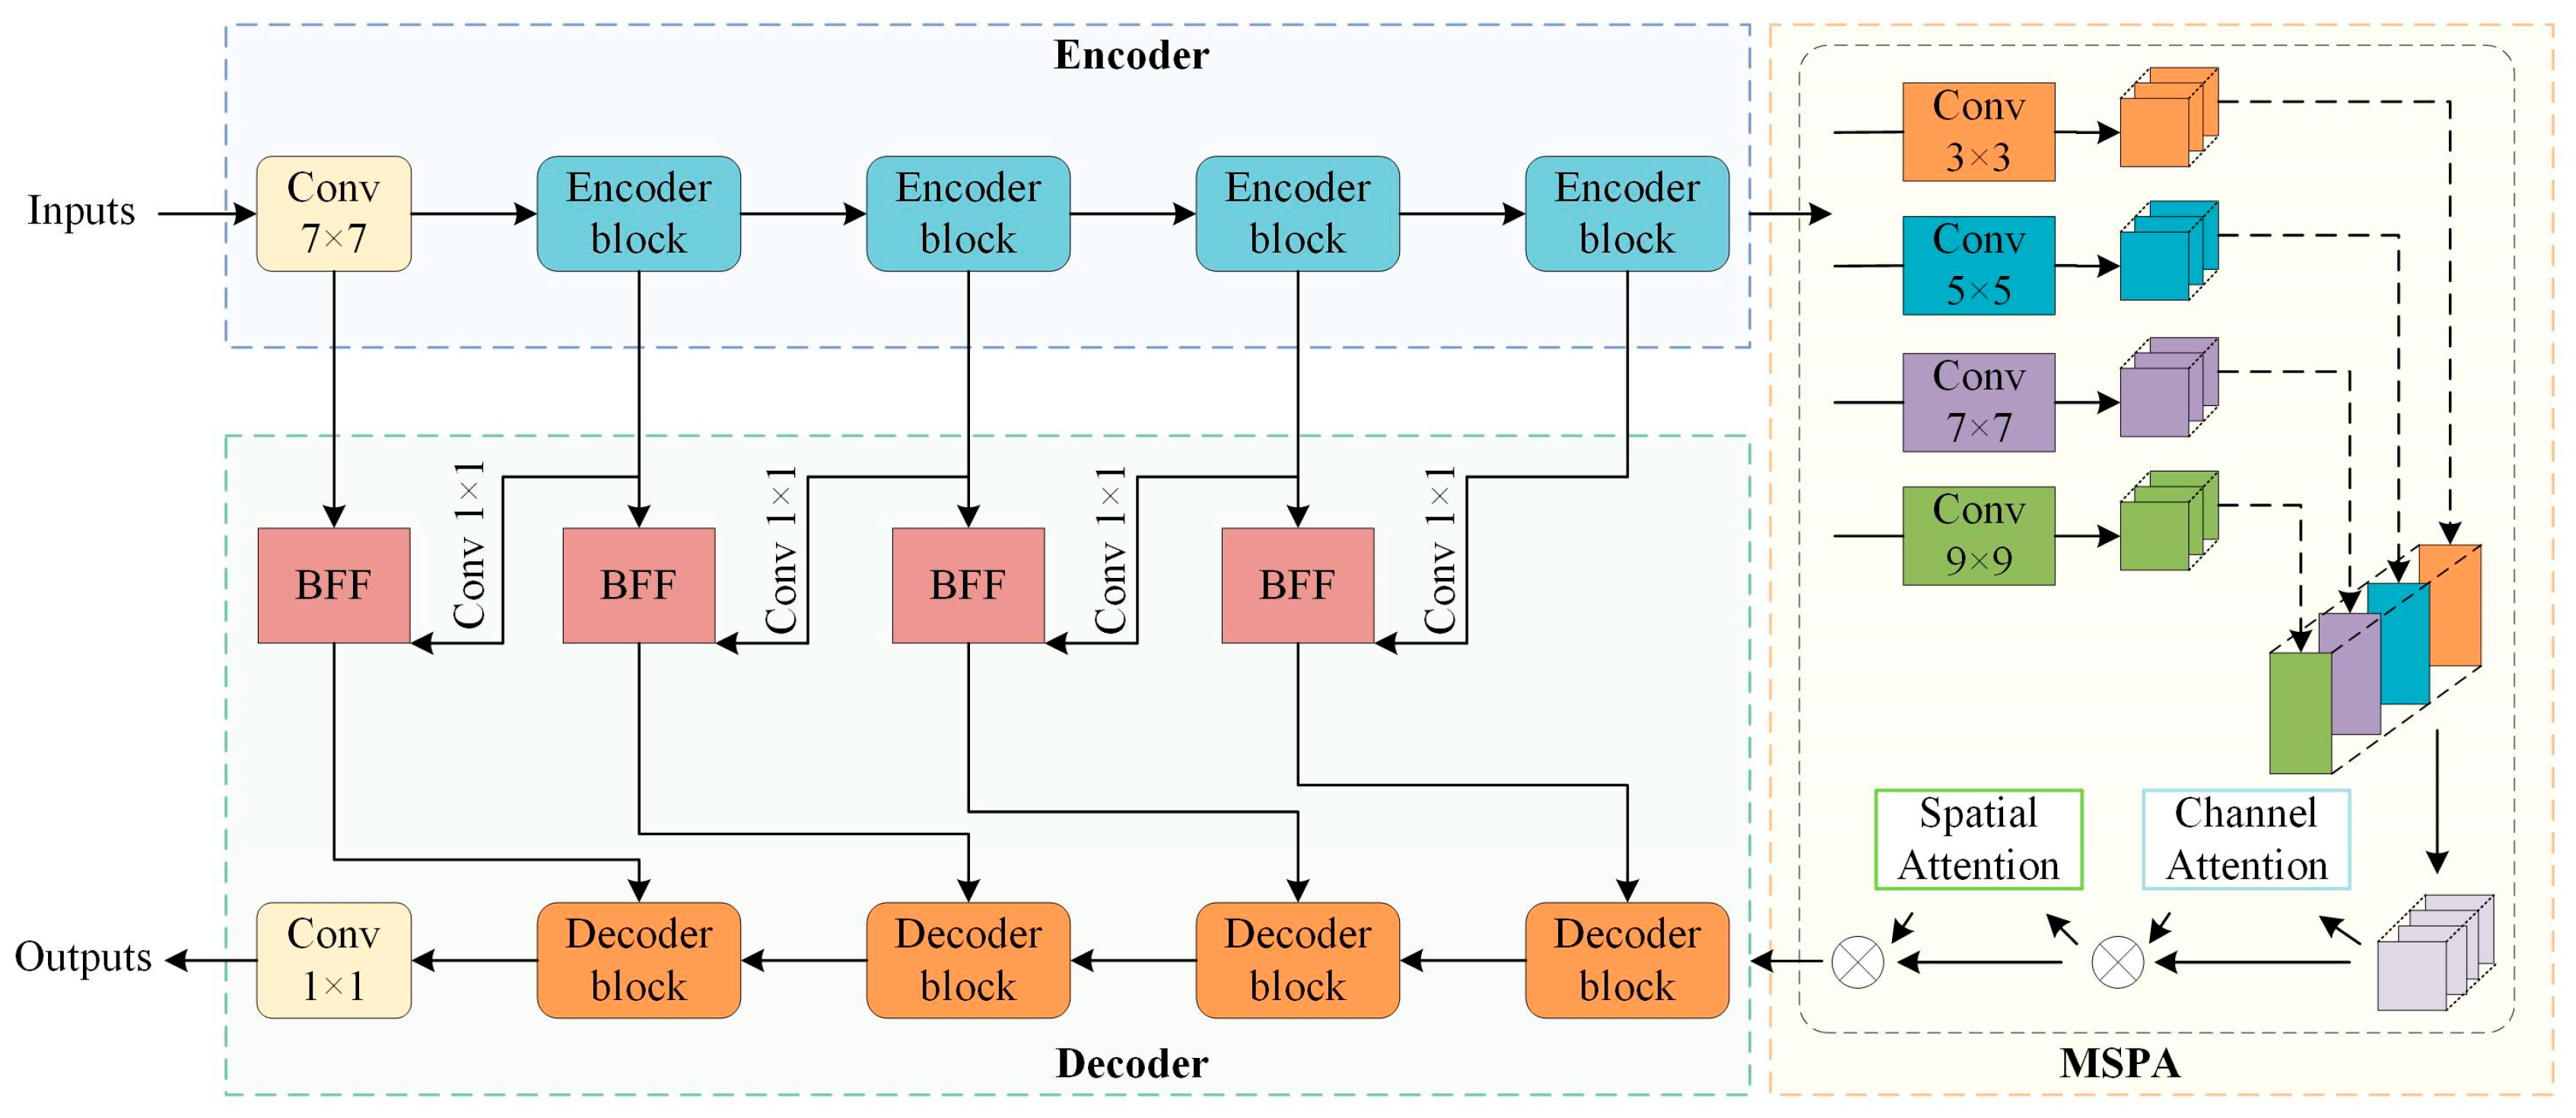
2.1. MAFANet Network

The extraction accuracy of UGS feature plays a crucial role in the final segmentation accuracy. To optimize the MAFANet model performance, we modify the input image size and channel number during the encoding part, increasing information richness. During the decoding part, we restore the image size and reduce channels to the input size, preserving image details. This work employs ResNet50 as the backbone network, complemented by an MSPA module for multiscale contextual awareness and deep spatial channel information extraction, aiding UGS segmentation based on contextual cues. Furthermore, to retain essential information while filtering out noise, we built a novel decoder module by designing a DE and a BFF module. The DE module is mainly used for information fusion between the encoding and decoding layer. The BFF module enhances communication between channels, facilitating mutual guidance in feature mining between adjacent layers of the ResNet50 network, promoting feature fusion, and providing richer feature information for upsampling. The use of four upsampling modules progressively integrates features from high to low and reinstates the details of HRS image, significantly enhances the MAFANet model segmentation performance.

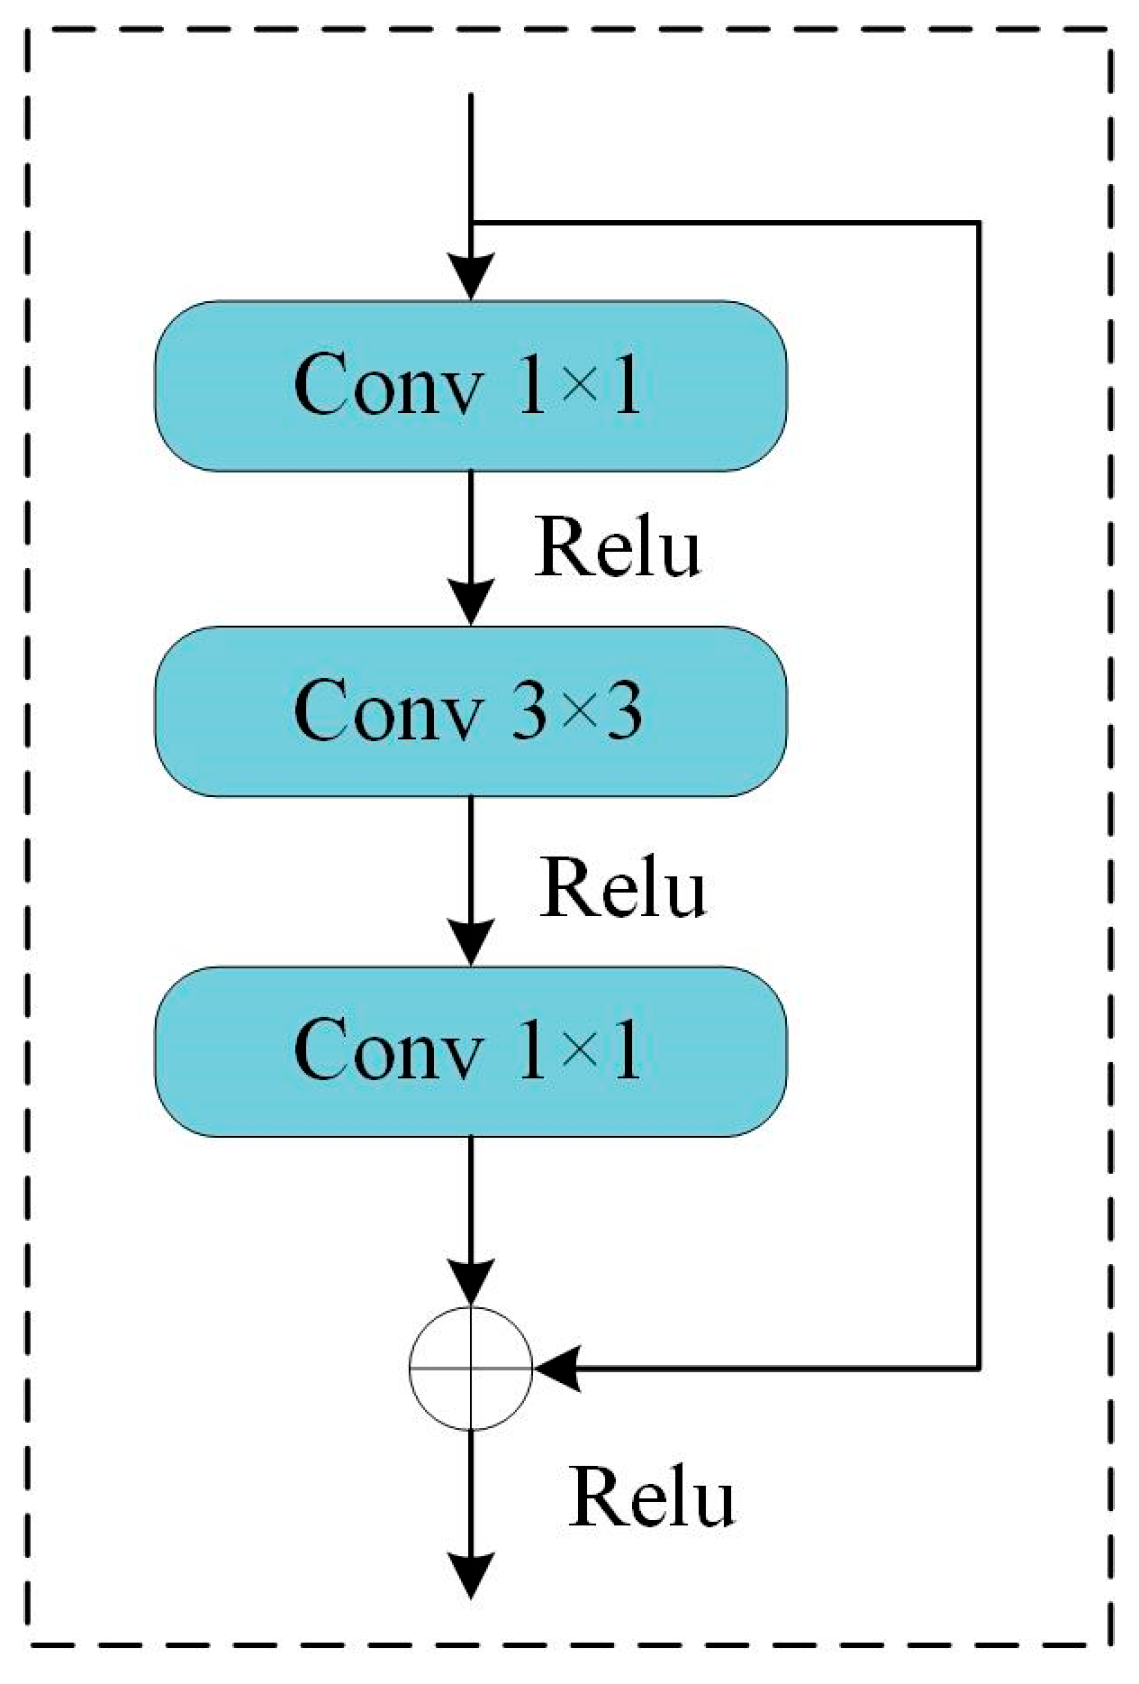
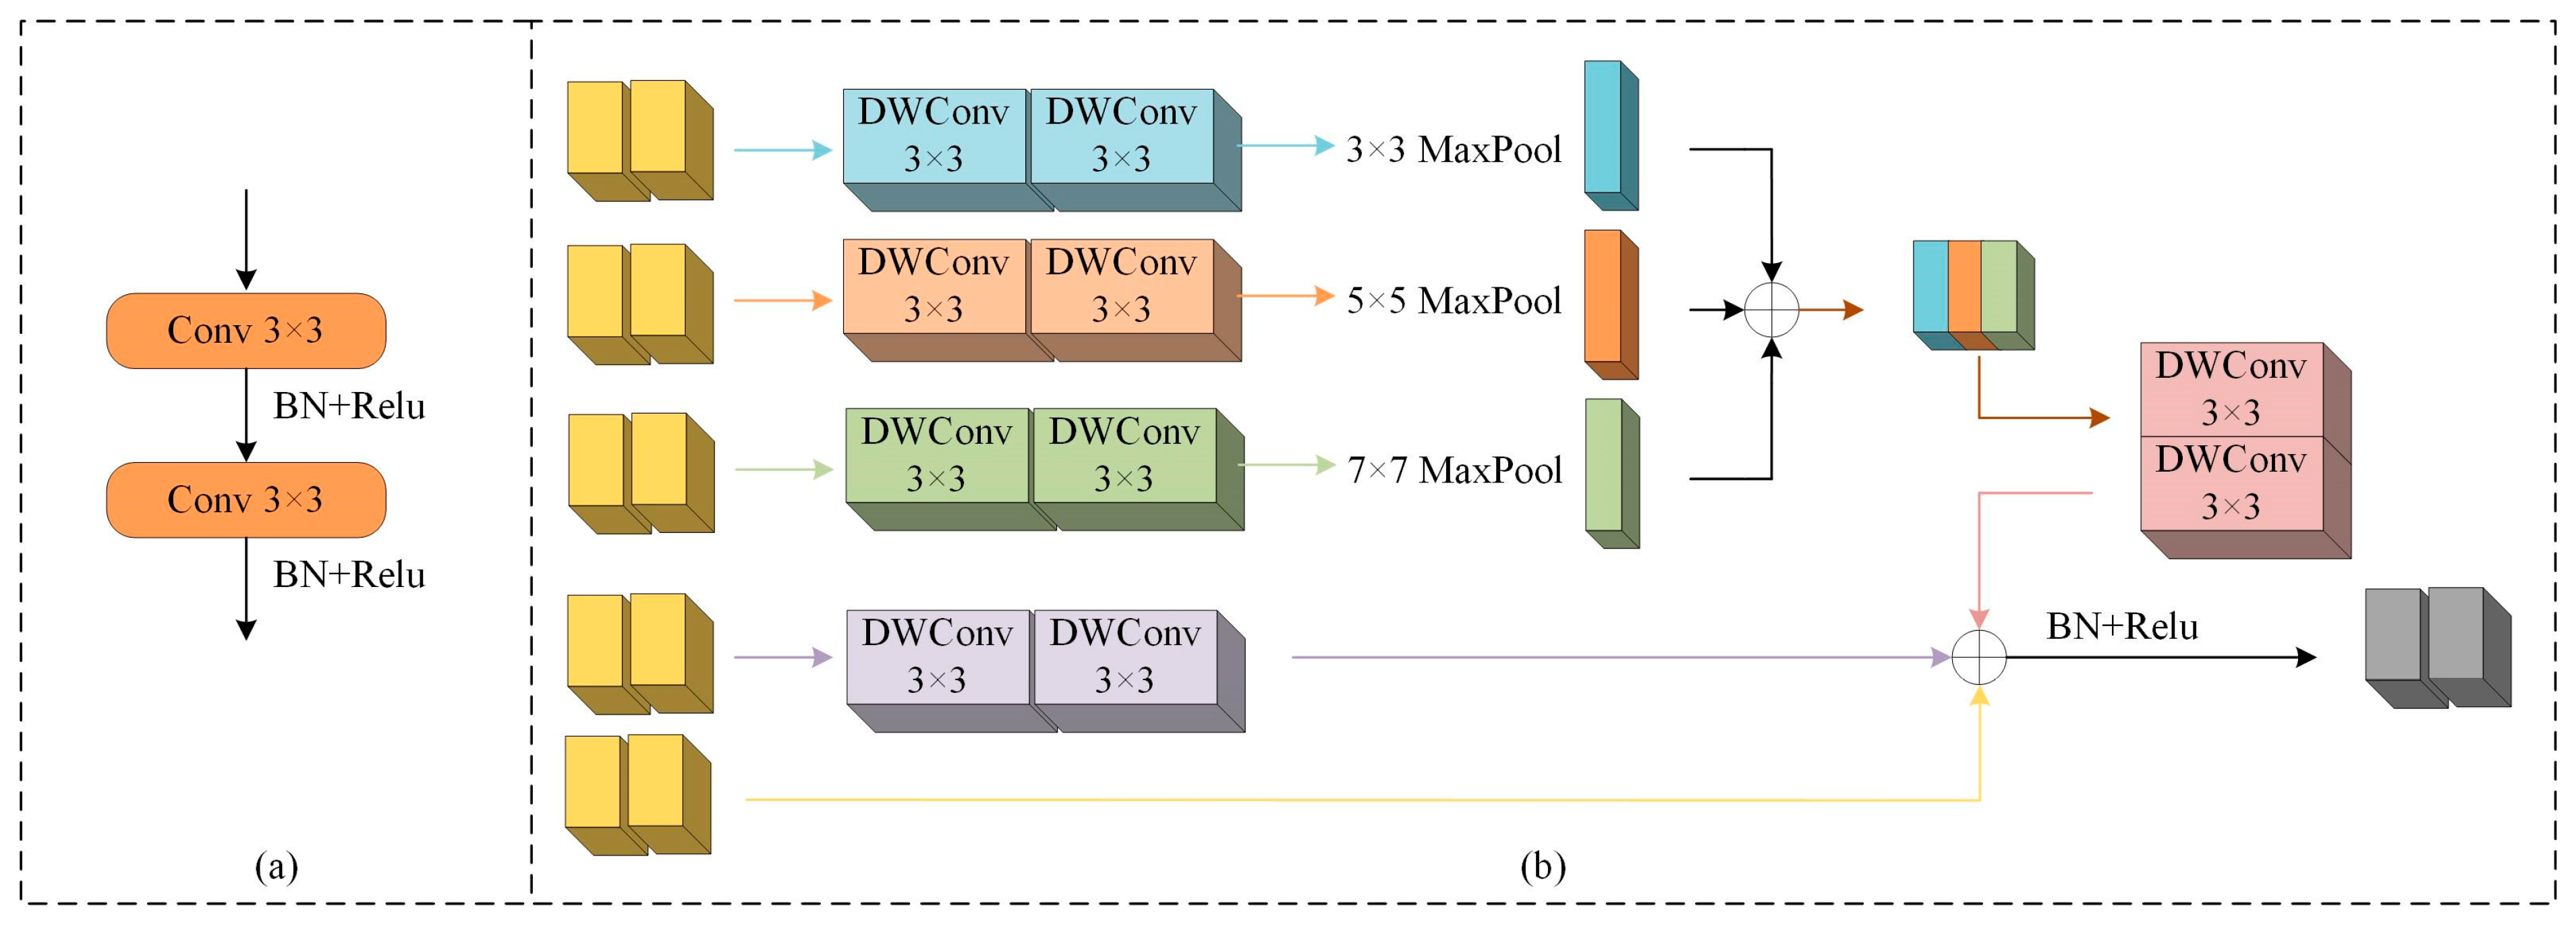
2.2. Encoder with Residual Network

HRS images are rich in data, and DL networks have the capability to capture more information and richer features from HRS image data. However, during training, deep networks often face challenges such as gradient explosion and gradient disappearance due to the increasing number of network layers, which can hinder effective training of the network and affect the segmentation effect. ResNet50 [26] effectively addresses these issues, allowing the construction of very deep networks. Resnet50 uses three convolutional layers of 1 × 1, 3 × 3, 1 × 1, respectively, while introducing a branch to add with the convolutional layers and then outputs the final result. Therefore, this article uses ResNet50 as the backbone for multi-level feature extraction, forming the encoding part. Resnet50 residual structure is shown in Figure 2.

2.3. Decoder with Decoder Block and Bilateral Feature Fusion Module

During the decoding stage, many networks perform direct upsampling to match the original image size, which can result in information loss. Some networks address this by using a single convolutional layer for decoding, preserving important local features but lacking long-range feature connections. These networks are not as effective in recovering the edges of the UGS areas. Therefore, we built a novel decoder module designed to gradually recover essential information from deep features. Figure 3 shows the structure of our proposed decoder module.
In the upsampling process, high-level semantic and spatial information often results in a rough final segmentation boundary, especially when dealing with arbitrary and irregular UGS sizes and shapes, making UGS boundary segmentation challenging. Some existing methods segment the boundaries very coarsely and lack detail. As shown in Figure 3a, this paper uses two layers of 3 × 3 convolution, normalization, and activation functions to form a DE module to enhance the ability to obtain information when extracting features. As shown in Figure 3b, this article uses DWConv convolution [27] to form a BFF module, which can learn richer detailed features while reducing the amount of calculation parameters. During the training phase, multiple DWConv convolution combinations can enhance the representation of UGS information features. Maxpool is used to extract feature information. We used three maxpool layers of 3 × 3, 5 × 5, 7 × 7, respectively, to achieve UGS feature information extraction in parallel. To a certain extent, it can extract texture and edge information in the image, reduce interference from non-green space areas in the HRS image, and more effectively identify scattered multiscale objects, thereby reducing the risk of missed segmentation and false segmentation. At the same time, we keep an input channel in the side to preserve the integrity of the input information. The new decoder module has the potential to promote MAFANet model segmentation of UGS.

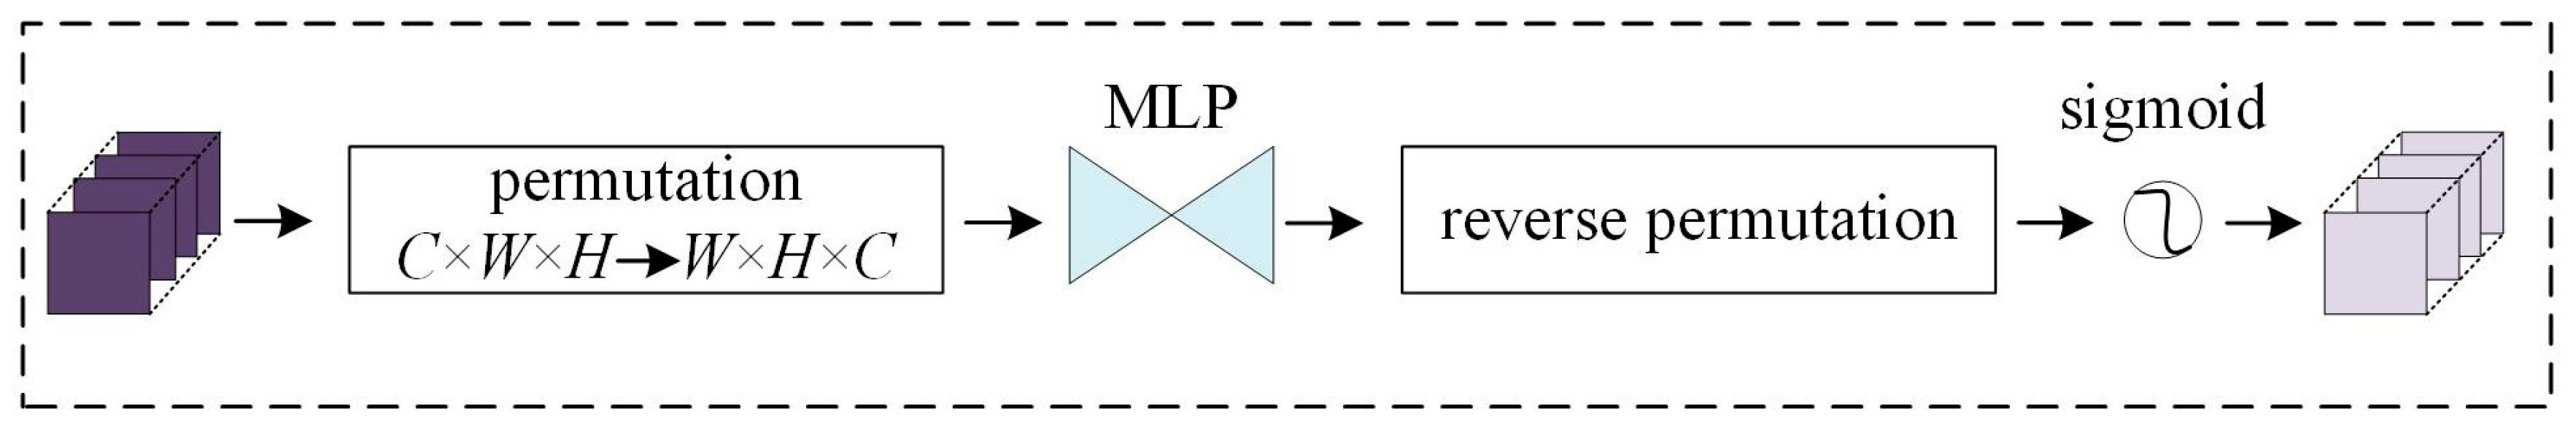
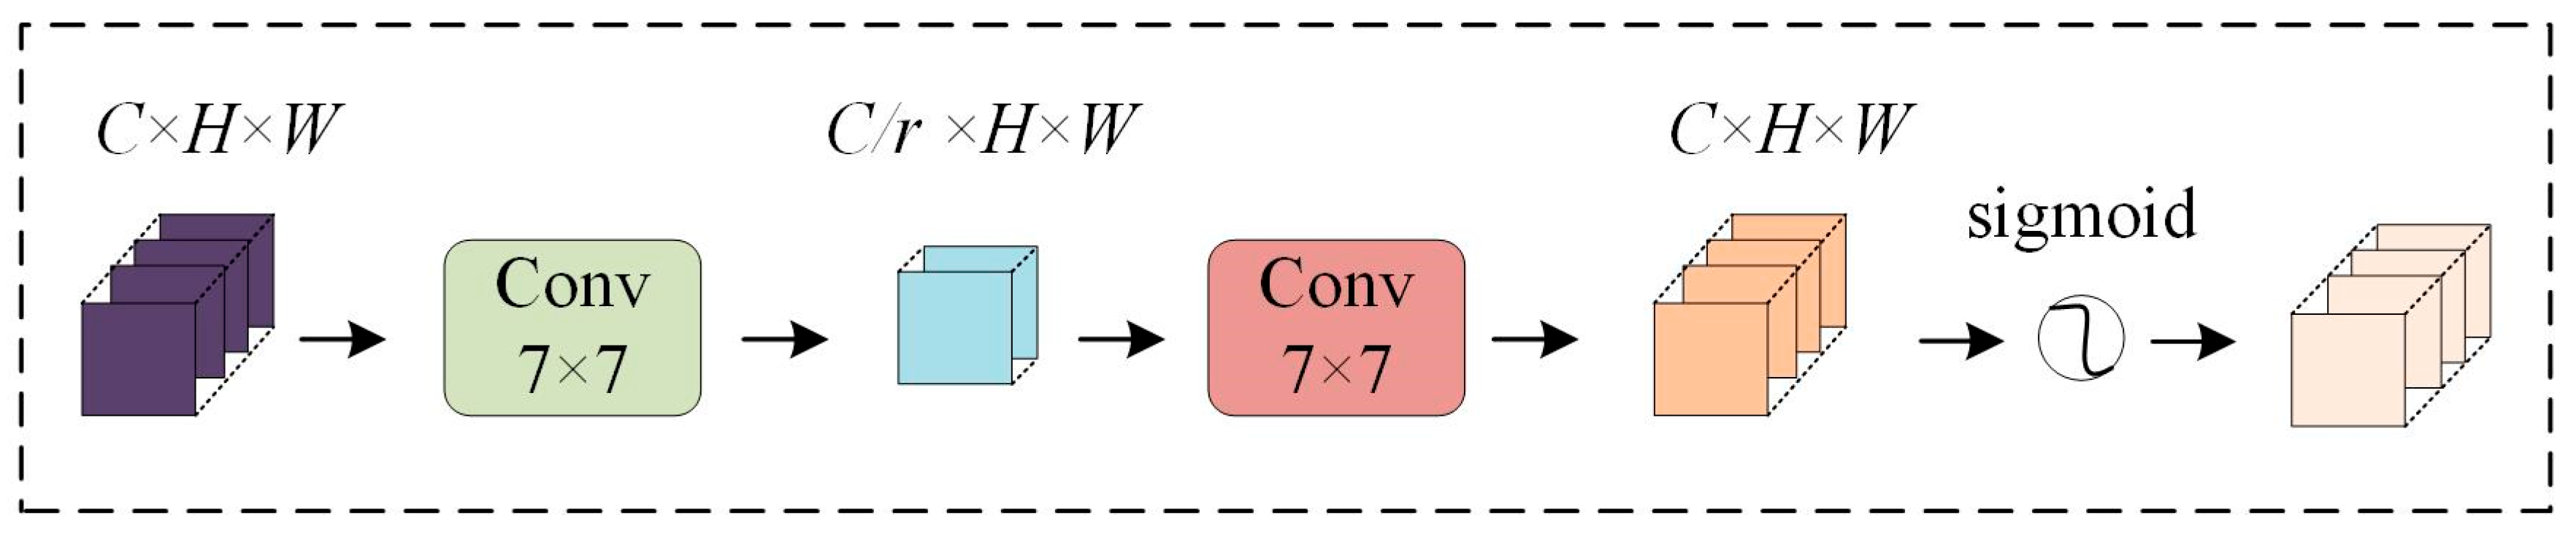
2.4. Multiscale Pooling Attention Module

For DL networks, capturing long-range correlations is crucial. However, the convolution operation is used to process local areas, and its receptive field is limited, so it cannot capture the correlation of long-distance UGS feature information. The pooling operation of the large square kernel can enhance the sharing of global information. This method works well when detecting large-scale objects, but it does not work well when detecting scattered small-scale green spaces. This is because the large kernel extracts too much information from irrelevant regions to adapt to multi-scale changing objects, which can interfere with the final prediction of the model. Therefore, the model needs to have convolutional kernels of multiple sizes to obtain a multi-scale detection field of view to accommodate scale variations of UGS objects.
PyConv [28] can not only expand the receptive field of the input to capture sufficient UGS contextual information by convolving 3 × 3, 5 × 5, 7 × 7, etc., but also process inputs of incremental kernel sizes in parallel by using a pyramid structure. This helps the model understand and represent UGS in images of different scales, and to obtain detailed multi-scale information on UGS objects. Global attention mechanism (GAM) [29] preserves channel (Figure 4) and spatial (Figure 5) aspects of information to enhance the importance of cross-dimensional interactions, improving the perception performance of the deep neural network on UGS objects by reducing object information dispersion. Inspired by PyConv and GAM, the MSPA module is built to further enhance object information extraction. As depicted in Figure 1, the MSPA module comes into play after the initial feature extraction phase using ResNet50. Its primary objective is to extract multi-scale contextual information and depth channel-specific information. The MSPA module’s capabilities are twofold. First, it leverages contextual information to address objects with similar shapes, such as low vegetation and tree, facilitating their classification. Moreover, it excels in processing and segmenting the intricate edge details between objects. This contextual understanding enhances the model’s ability to distinguish and categorize objects effectively. Secondly, the MSPA module extracts multi-scale spatial and channel information concurrently. This parallel extraction approach ensures that the model pays significant attention to both object category information and object location details. This focus on multi-scale aspects allows the model to emphasize essential information within the image, leading to a substantial improvement in segmentation accuracy. In general, the MSPA module, inspired by the principles of PyConv and the Global Attention Mechanism, plays a pivotal role in enhancing object information extraction. It effectively captures multi-scale context and depth channel-specific information, ultimately bolstering the segmentation quality and precision of the model.

2.5. Data and Experiment Details

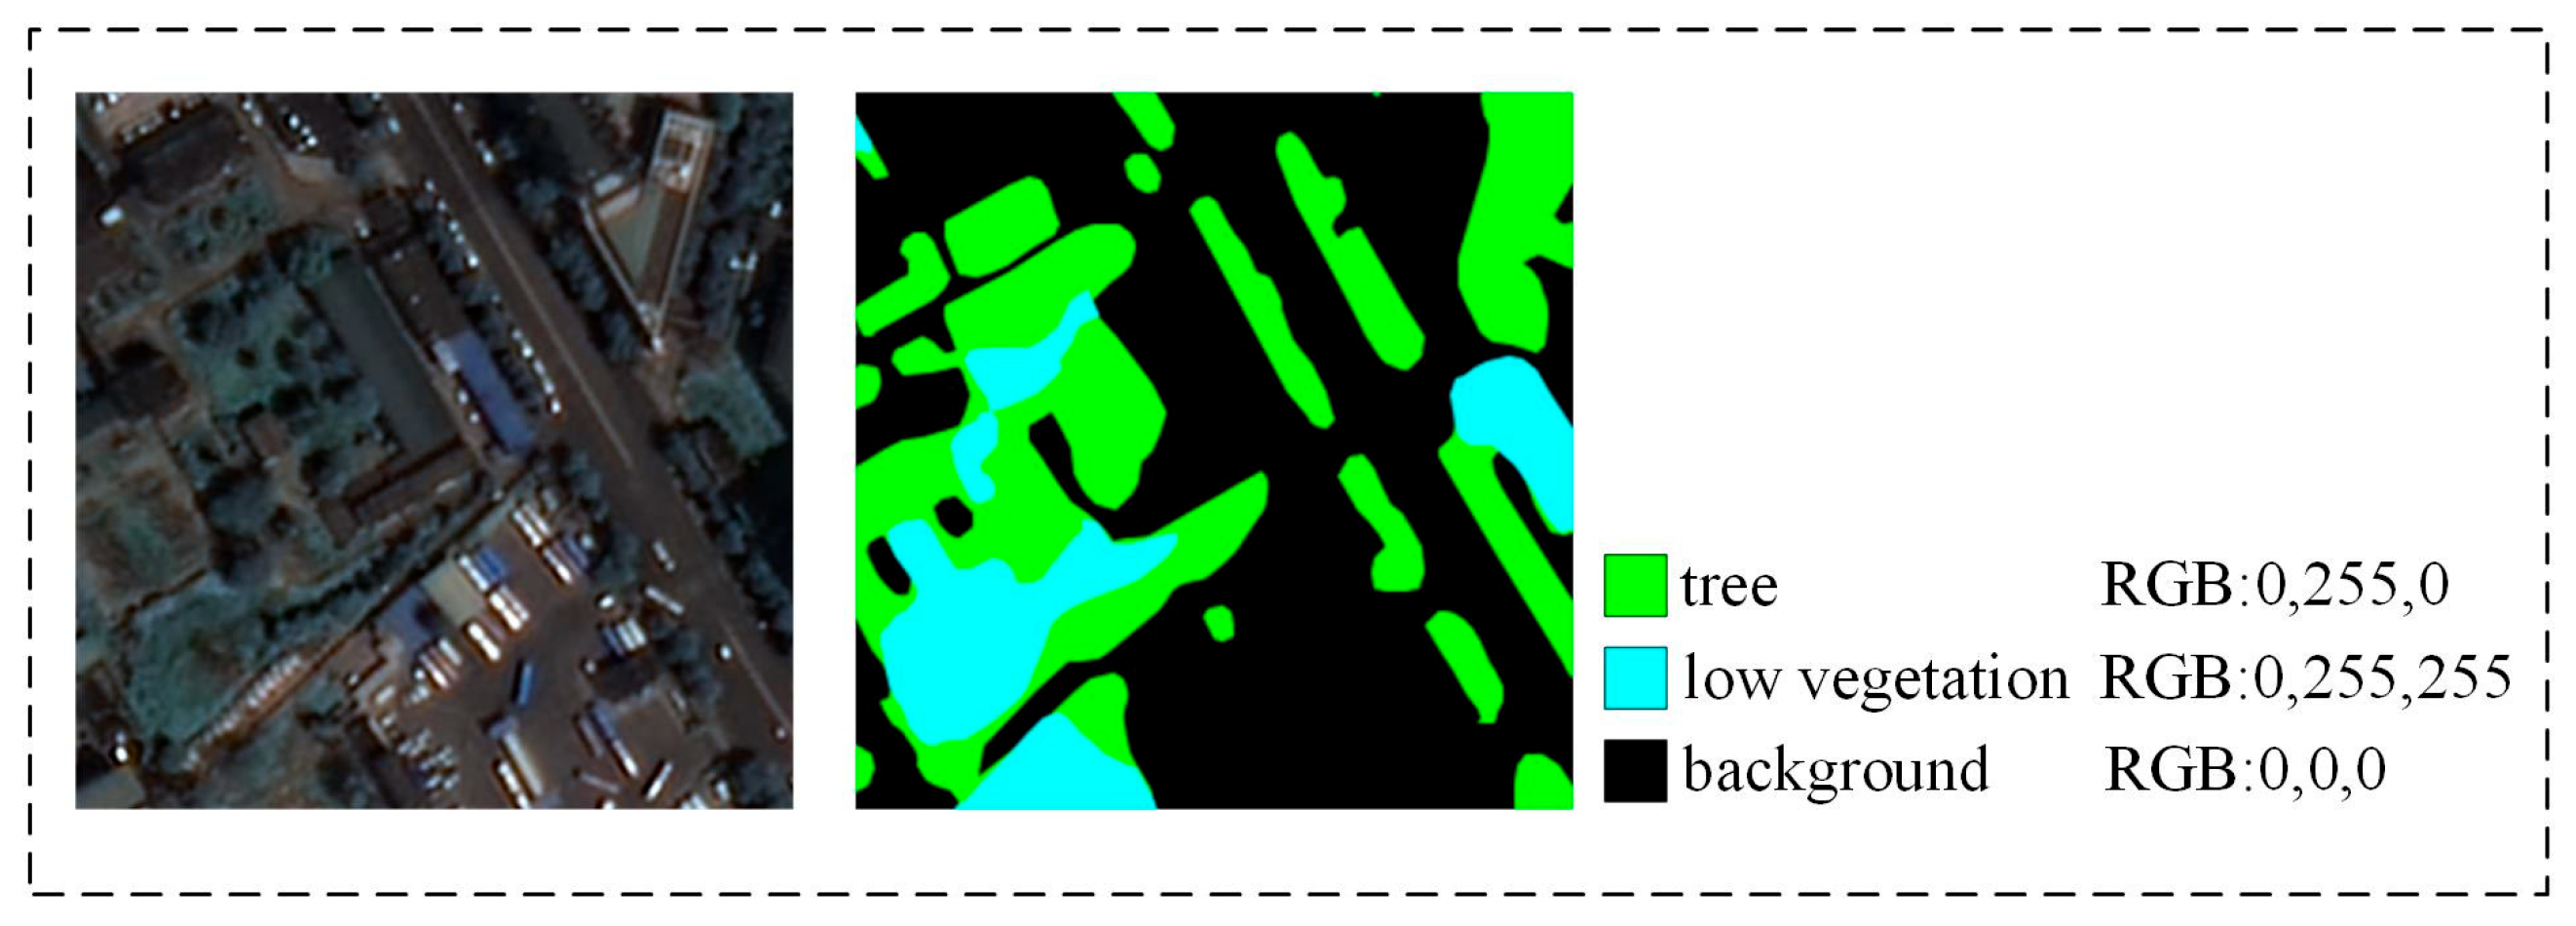
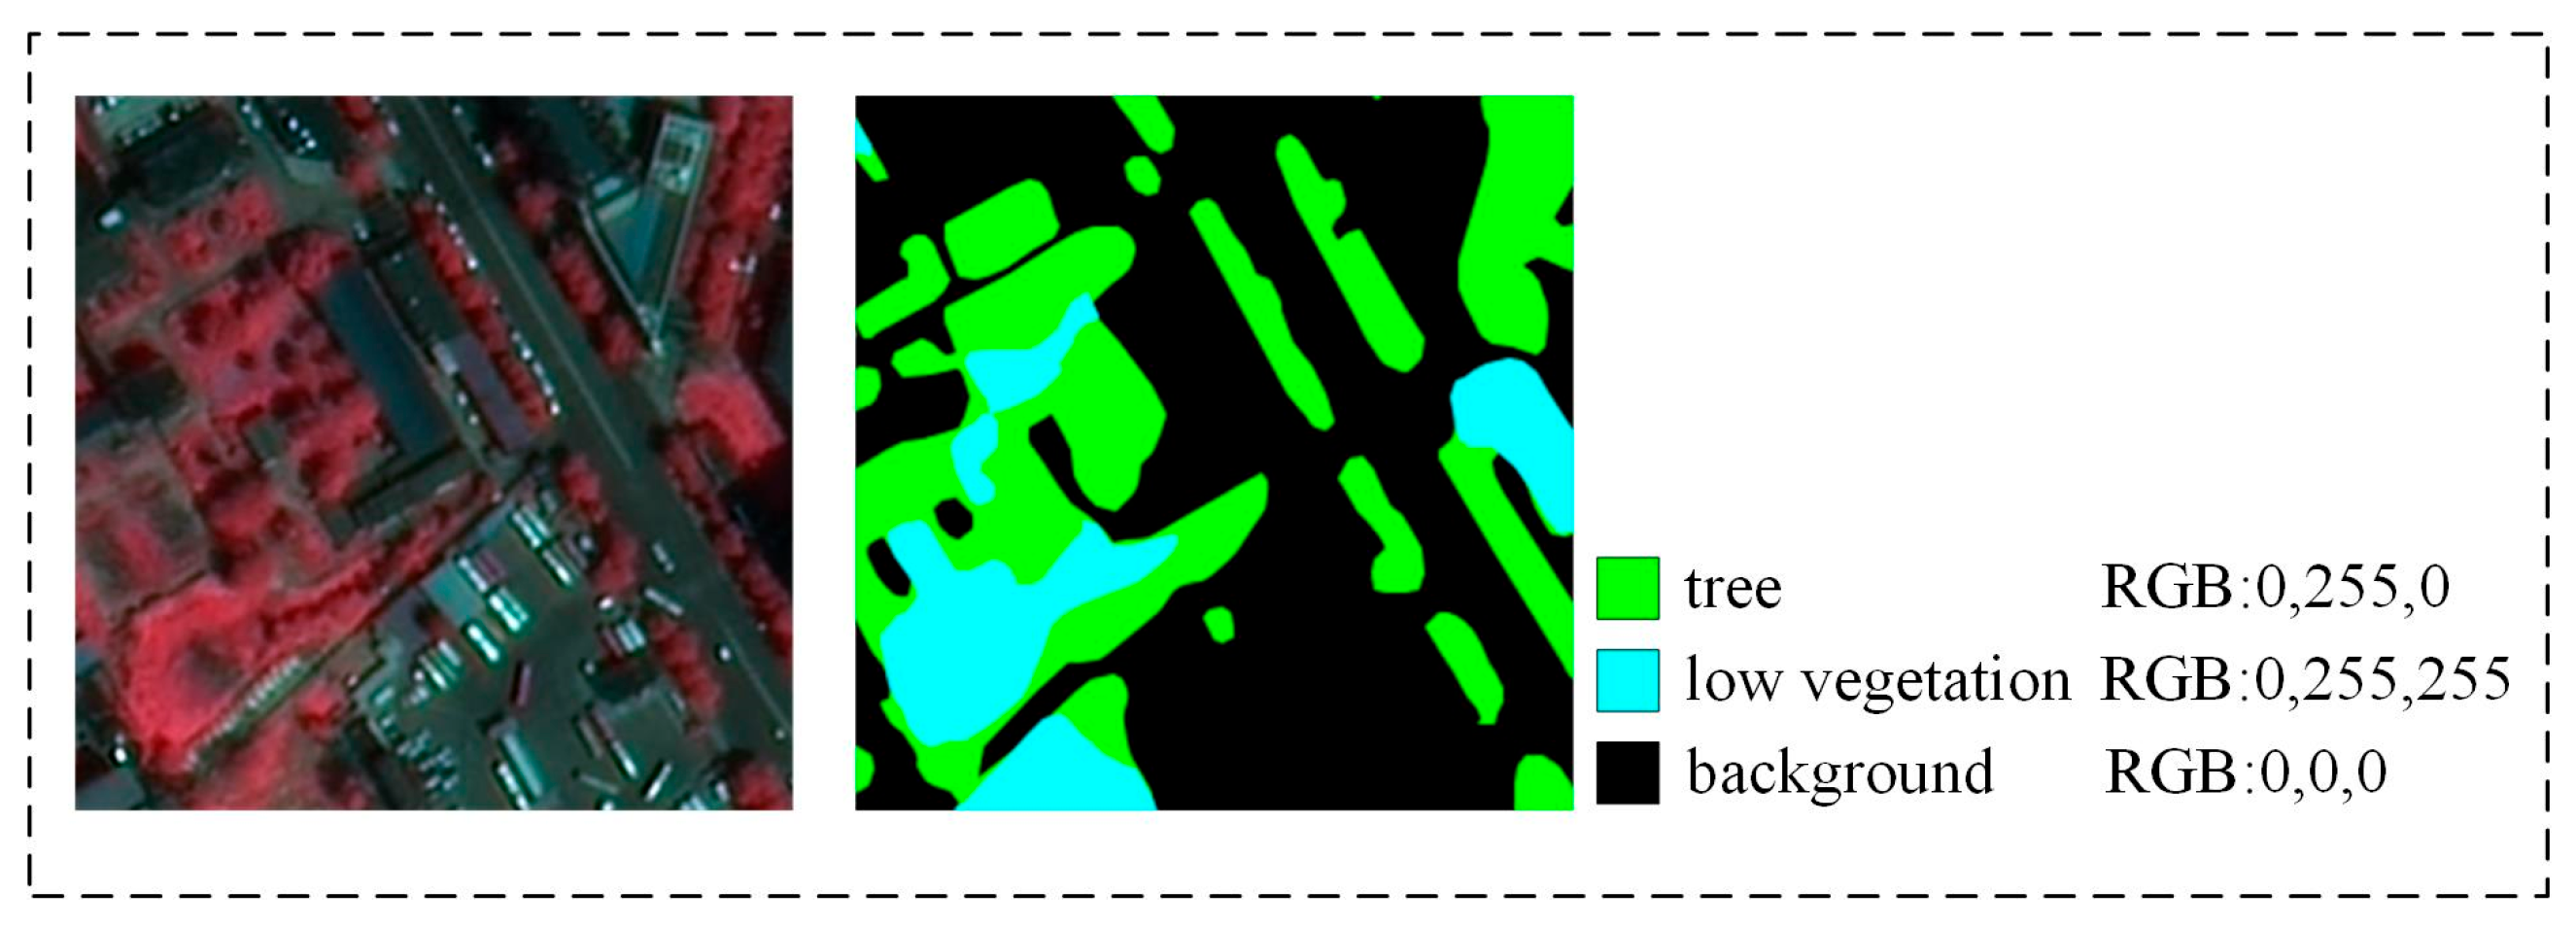
2.5.1. HRS Image Data

In order to effectively extract UGS, this experiment obtained high-resolution remote sensing images (GF-2, 21 July 2022) from the China Resources Satellite Application Center as the data source. The GF-2 PMS (panchromatic multispectral sensor) has a panchromatic band with a spatial resolution of 1 m and four multispectral bands with a spatial resolution of 4 m. The multispectral includes blue, green, red, and near-infrared bands. After ortho-correction, the panchromatic and multispectral images were fused to obtain the GF-2 image with a spatial resolution of 0.8 m. The image shearing operation was performed to obtain the GF-2 image. Finally, the 0.8 m GF-2 image was subjected to image cropping operation to obtain the object image of the study area.

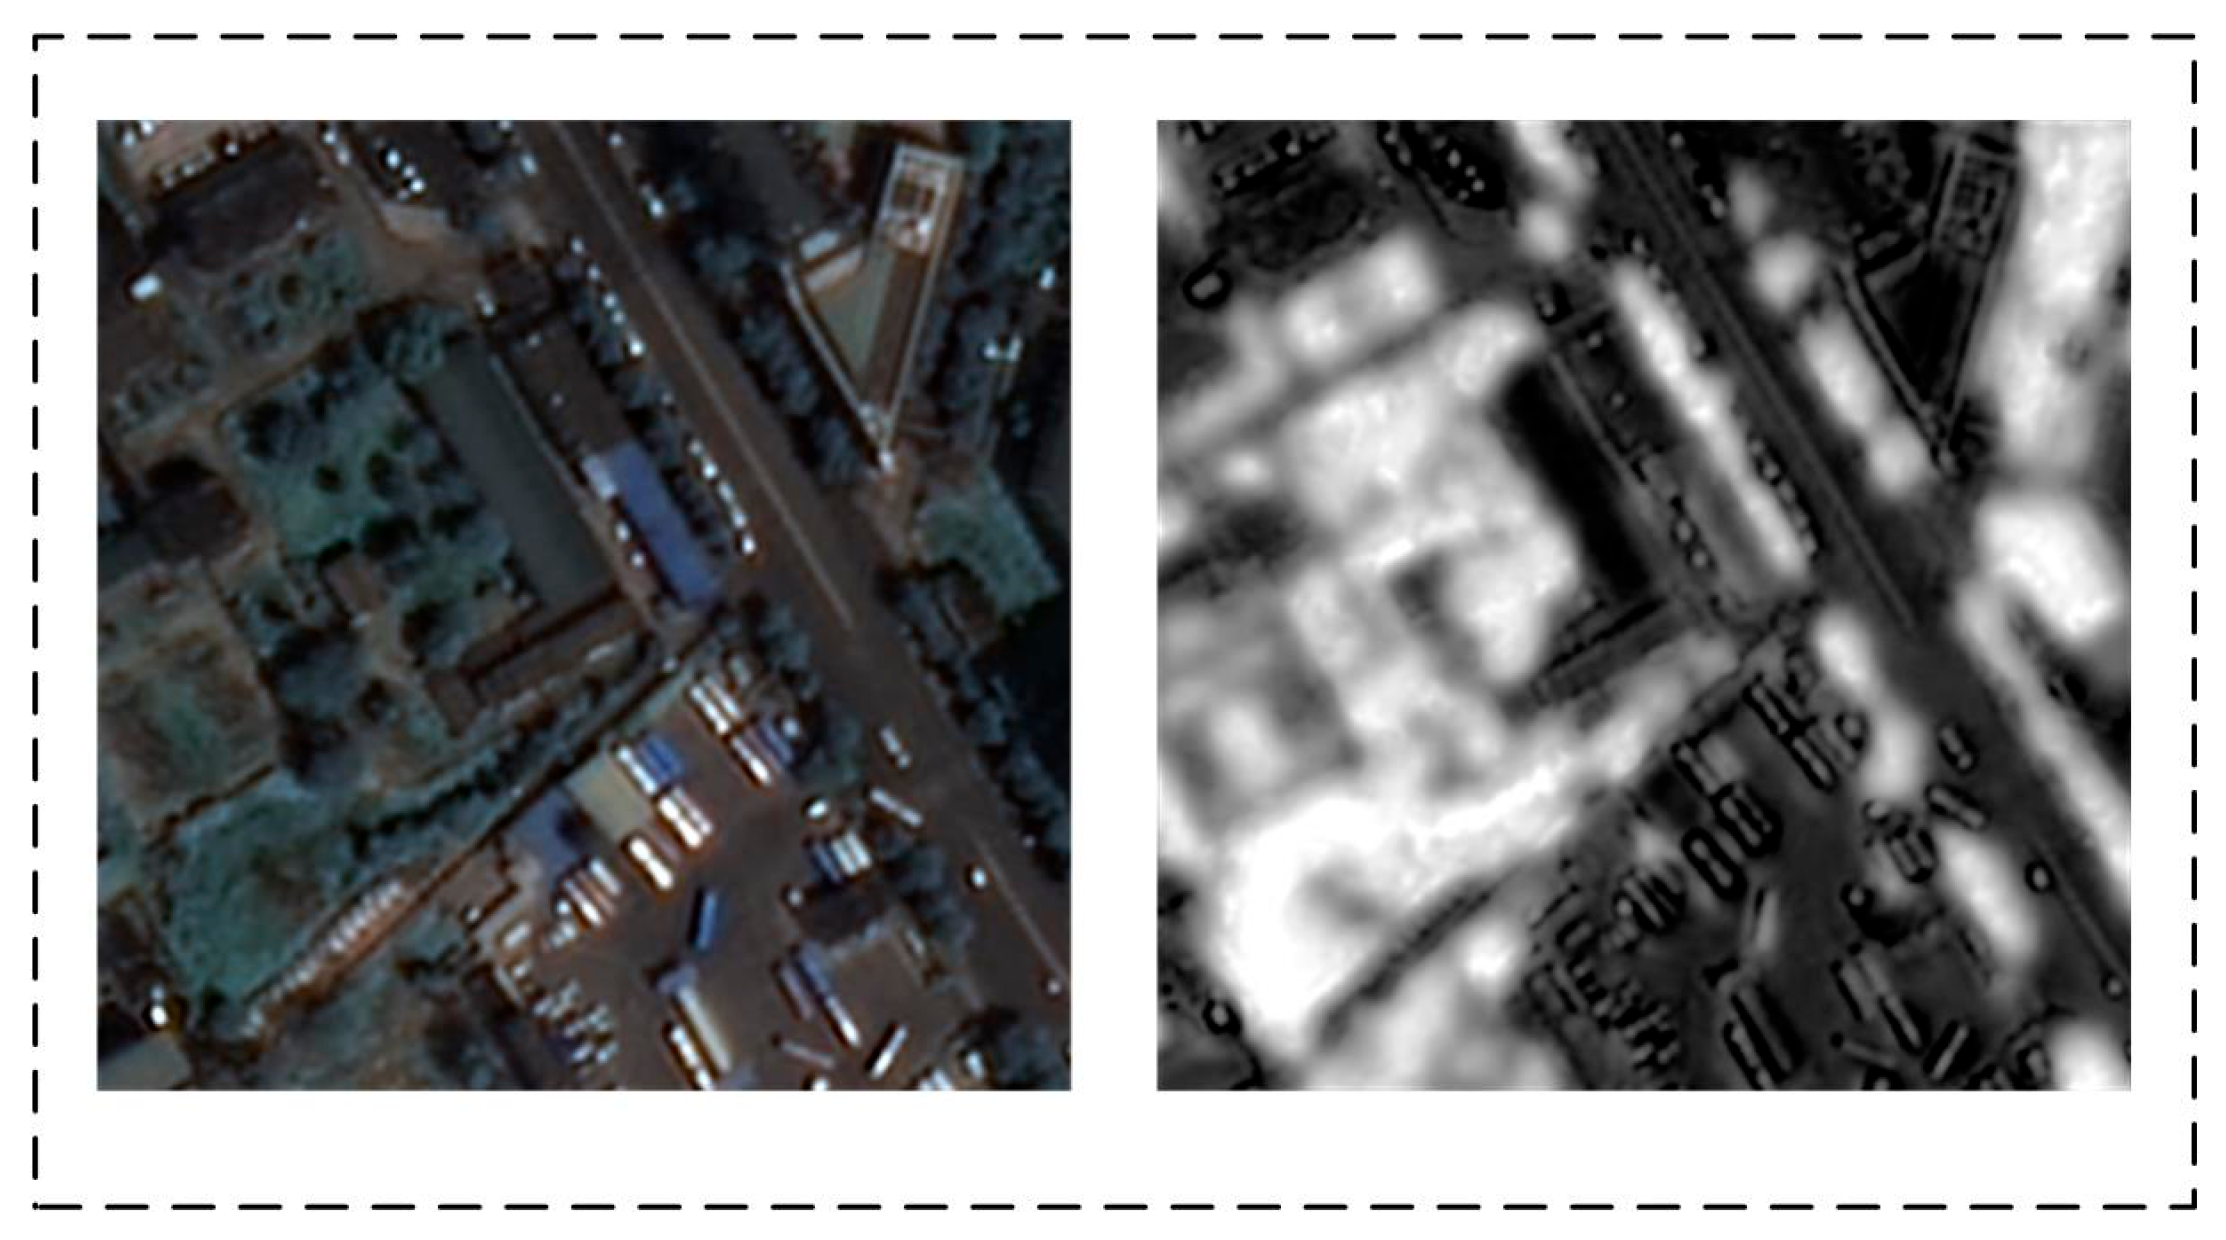
2.5.2. False Color Data

A typical false color image using a 4-3-2 band blends to illustrate UGS characteristics. Select three bands from the HRS data and put them into RGB color in the order of bands 4, 3, and 2, then finally, obtain a false color image.

2.5.3. Vegetation Index Data

In GF-2, the UGS area has lower reflectance in the visible and higher reflectance in the near-infrared. This study combines GF-2 multi-temporal remote sensing images to introduce urban green space vegetation characteristics. The vegetation characteristics were selected as NDVI [30], which is an index widely used for plant growth assessment, as shown in Figure 6, and its calculation formula is as follows:
N D V I = N I R R N I R + R
where NIR is the value of the near-infrared band, and R is the value of the red band.

2.5.4. Dataset Construction

Existing datasets are dominated by ISPRS-Vaihingen and Potsdam (https://www.isprs.org/education/benchmarks/UrbanSemLab/semantic-labeling.aspx, accessed on 24 January 2023), mostly for land cover use. There are few datasets about UGS and most of them are not publicly available for UGS related research. Meanwhile, most of the existing studies use MODIS, Landsat, and other low- and medium-resolution remote sensing image data, which have low precision in UGS exposure level evaluation and cannot express the structure, quality, morphology, and other aspects of UGS characteristics. Therefore, we selected an HRS image (GF-2) as the data to construct the UGS dataset. With the help of Google Earth, all acquired images are marked at the pixel level, and the original image pixels are divided into three categories: low vegetation, tree, and background. The RGB values of the background, tree and low vegetation pixels are set to (0, 0, 0), (0, 255, 0) and (0, 255, 255), respectively, as shown in Figure 7. Among them, low vegetation is dominated by grass and shrub. In order to adapt to the limited computing resources, we adopt the image cropping method to segment both the original image and the labeled image into 256 × 256-pixel images, and finally the UGS labeled dataset UGS-1 is obtained, including the training, validation, and test set. UGS-1 is shown in the original bands (1-2-3) of the GF-2 image. The sets are 1109, 336, and 336, respectively. At the same time, the original bands (1-2-3) of UGS-1 are modified to display the false color image in the order of 4-3-2 bands sequentially. The same method as above is used to construct UGS-2 with false color image, as shown in Figure 8, where the training, validation, and test set are 1109, 336, and 336, respectively.

2.5.5. Experimental Environment and Evaluation Metrics

The experimental operating system was Windows 10, the GPU was NVIDIA GeForce RTX 3060 (NVIDIA, Santa Clara, CA, USA), the running memory was 12 G, and the deep learning framework was Pytorch1.7.1 and Cuda11.6. During the model training process, this article used the cosine annealing strategy to adjust the learning rate, and also used the SGD optimizer, whose weight attenuation was set to 1 × 10⁻⁴. All networks were optimized using the loss function of cross-entropy loss. In addition, the number of training iterations was 300 and the batch_ size was set to 2. To further optimize the model learning, the baseline learning rate was set to 0.001. The adjustment multiple was set to 0.98. The adjustment interval was set to 3.
To quantitatively evaluate the robustness and effectiveness of the model, this study used four metrics, namely pixel accuracy (PA), mean pixel accuracy (MPA), and Intersection over Union (IOU), and mean Intersection over Union (MIOU) and other evaluation indicators to evaluate the model performance. The calculation formula for the above evaluation indicators is as follows:
P = p i i p i i + p i j
R = p i i p i i + p j i
P A = i = 0 k P i i j = 0 k p i j
M P A = 1 k + 1 i = 0 k P i i j = 0 k p i j
I O U = p i i j = 0 k p i j + j = 0 k p j i p i i
M I O U = 1 k + 1 i = 0 k p i i j = 0 k p i j + j = 0 k p j i p i i
where precision (P) denotes the probability that the object category is predicted correctly in the prediction result; recall (R) denotes the probability that the object category is predicted correctly in the true value; k denotes the number of object categories excluding background; Pii and Pji denote the corresponding true and false positive; Pij and Pjj denote the corresponding false and true negative. In semantic segmentation tasks, the Intersection over Union (IOU) metric quantifies the degree of overlap between the predicted segmented image and the actual ground truth image (labeled data). The mean IOU (MIOU) assesses the likeness between the true green space pixels and the predicted ones. A higher MIOU value indicates a stronger resemblance, making it a crucial measure of segmentation accuracy.

3. Results

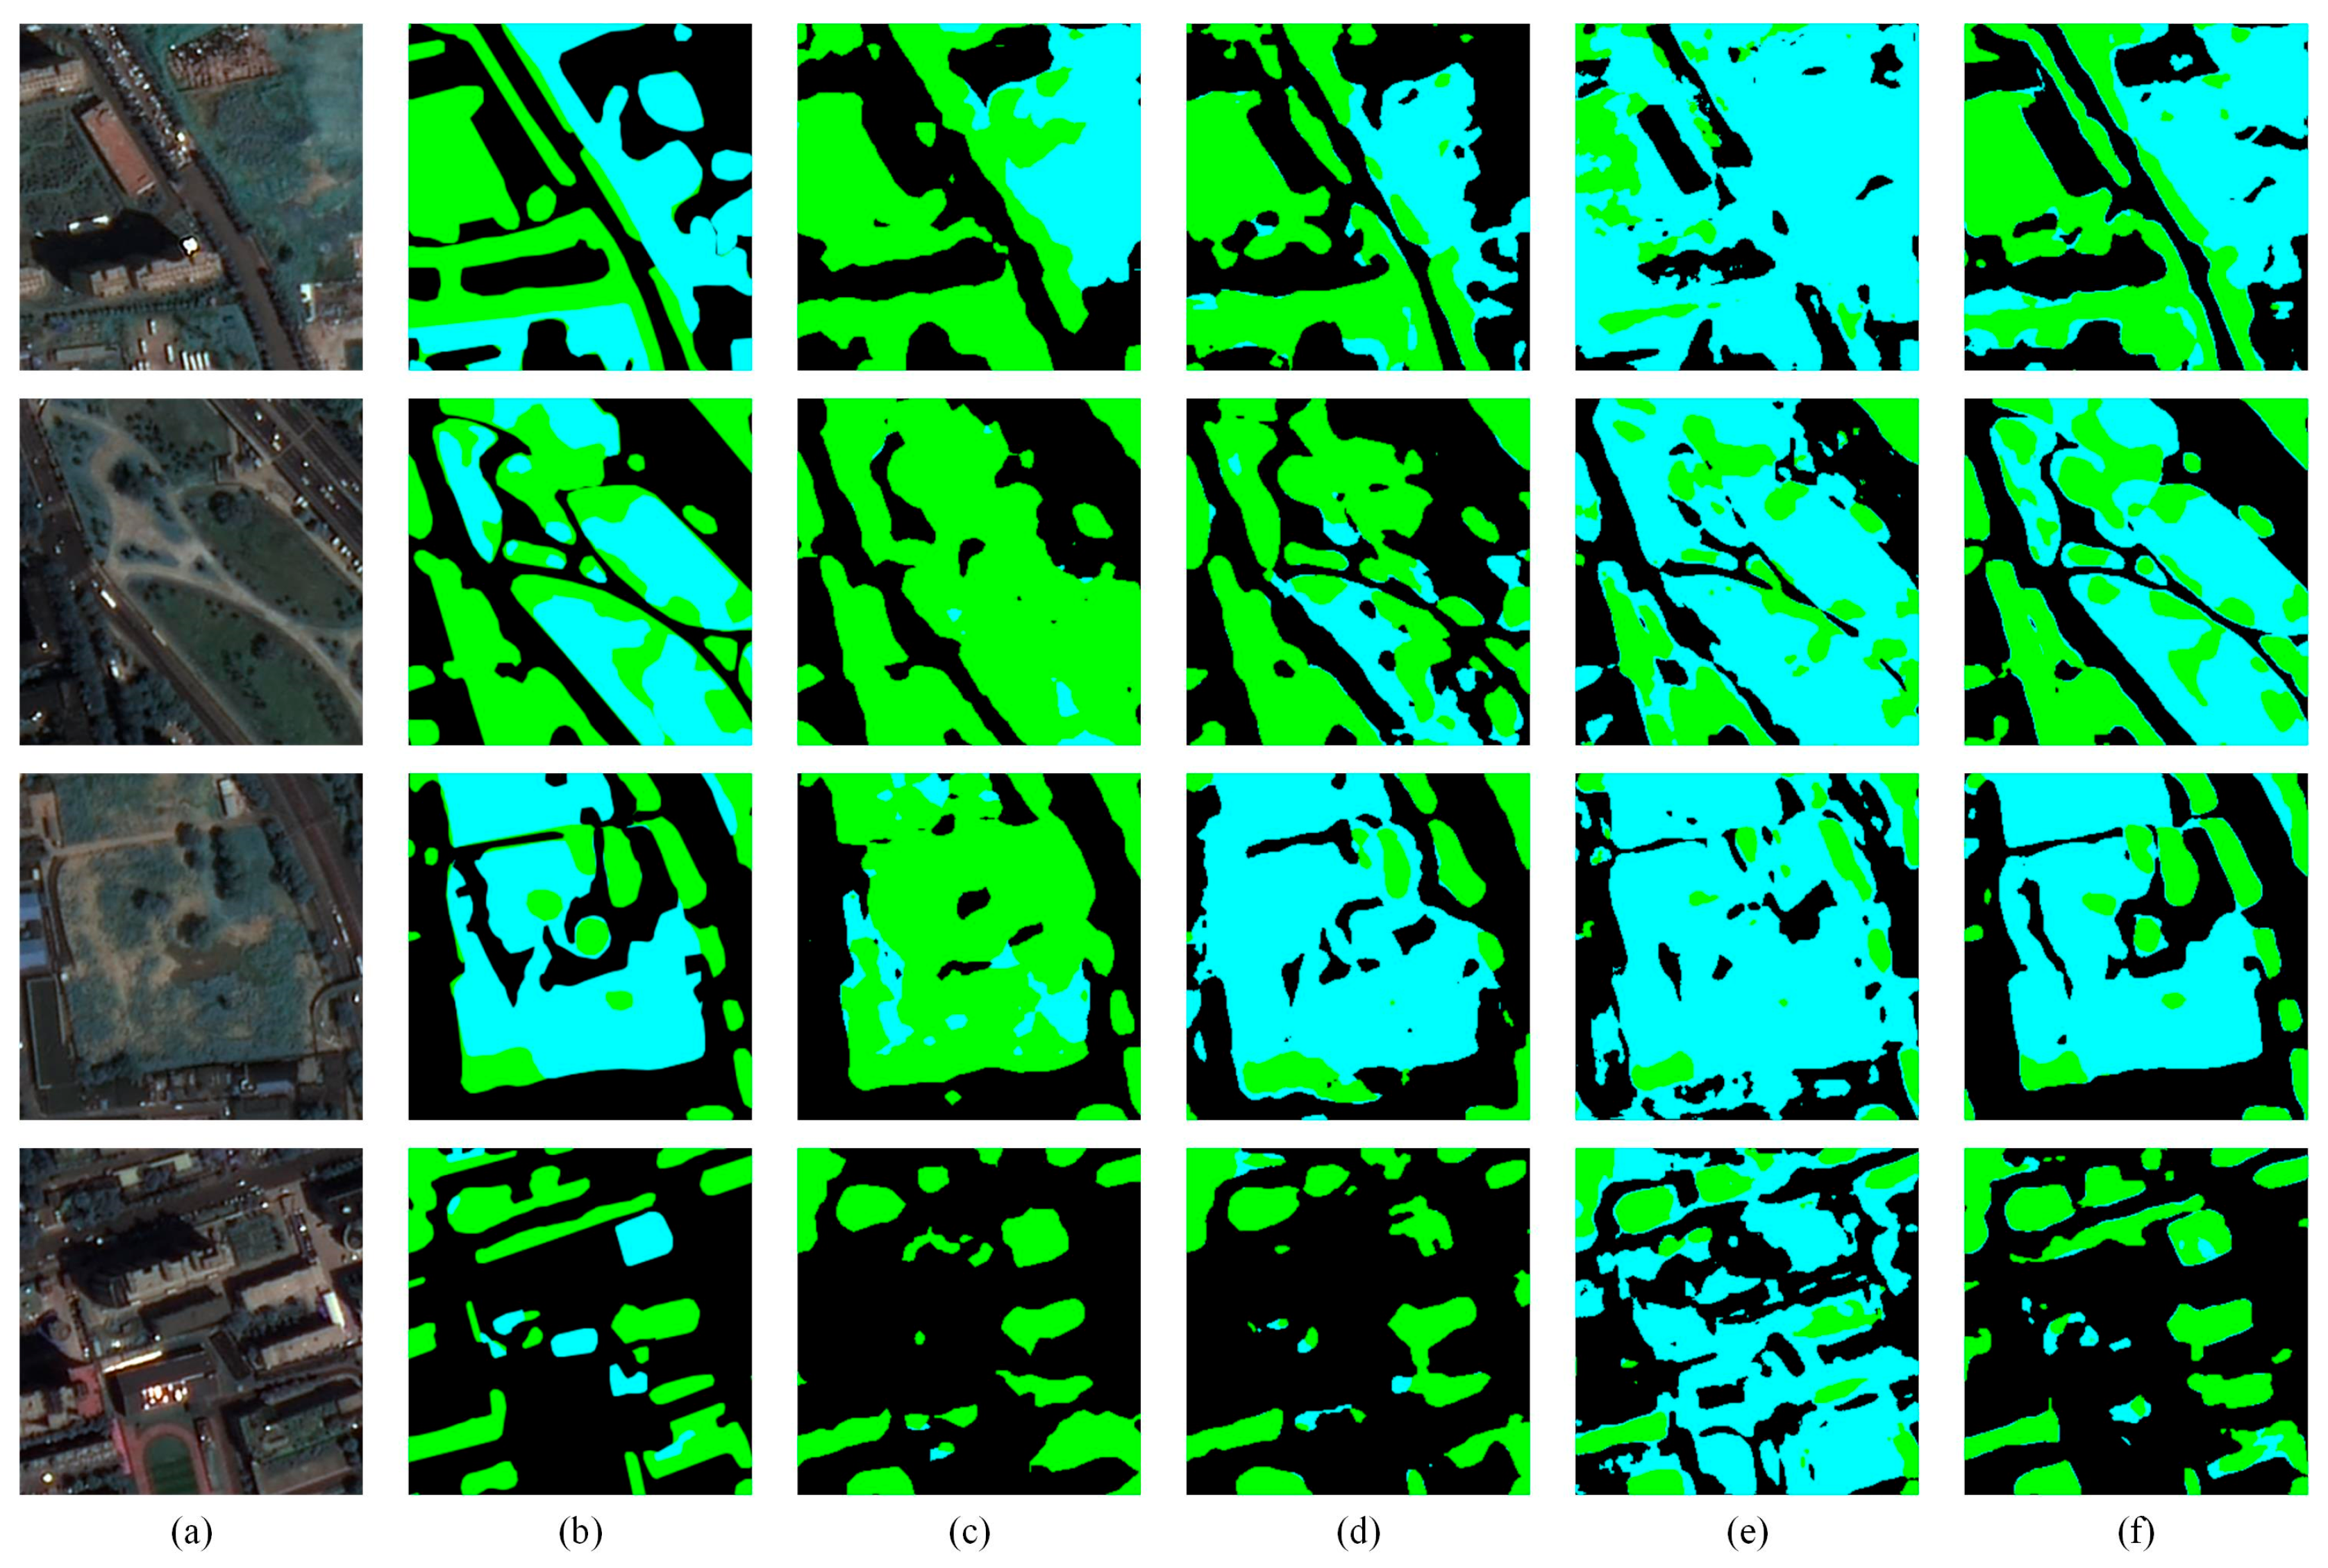
3.1. Comparison Experiment

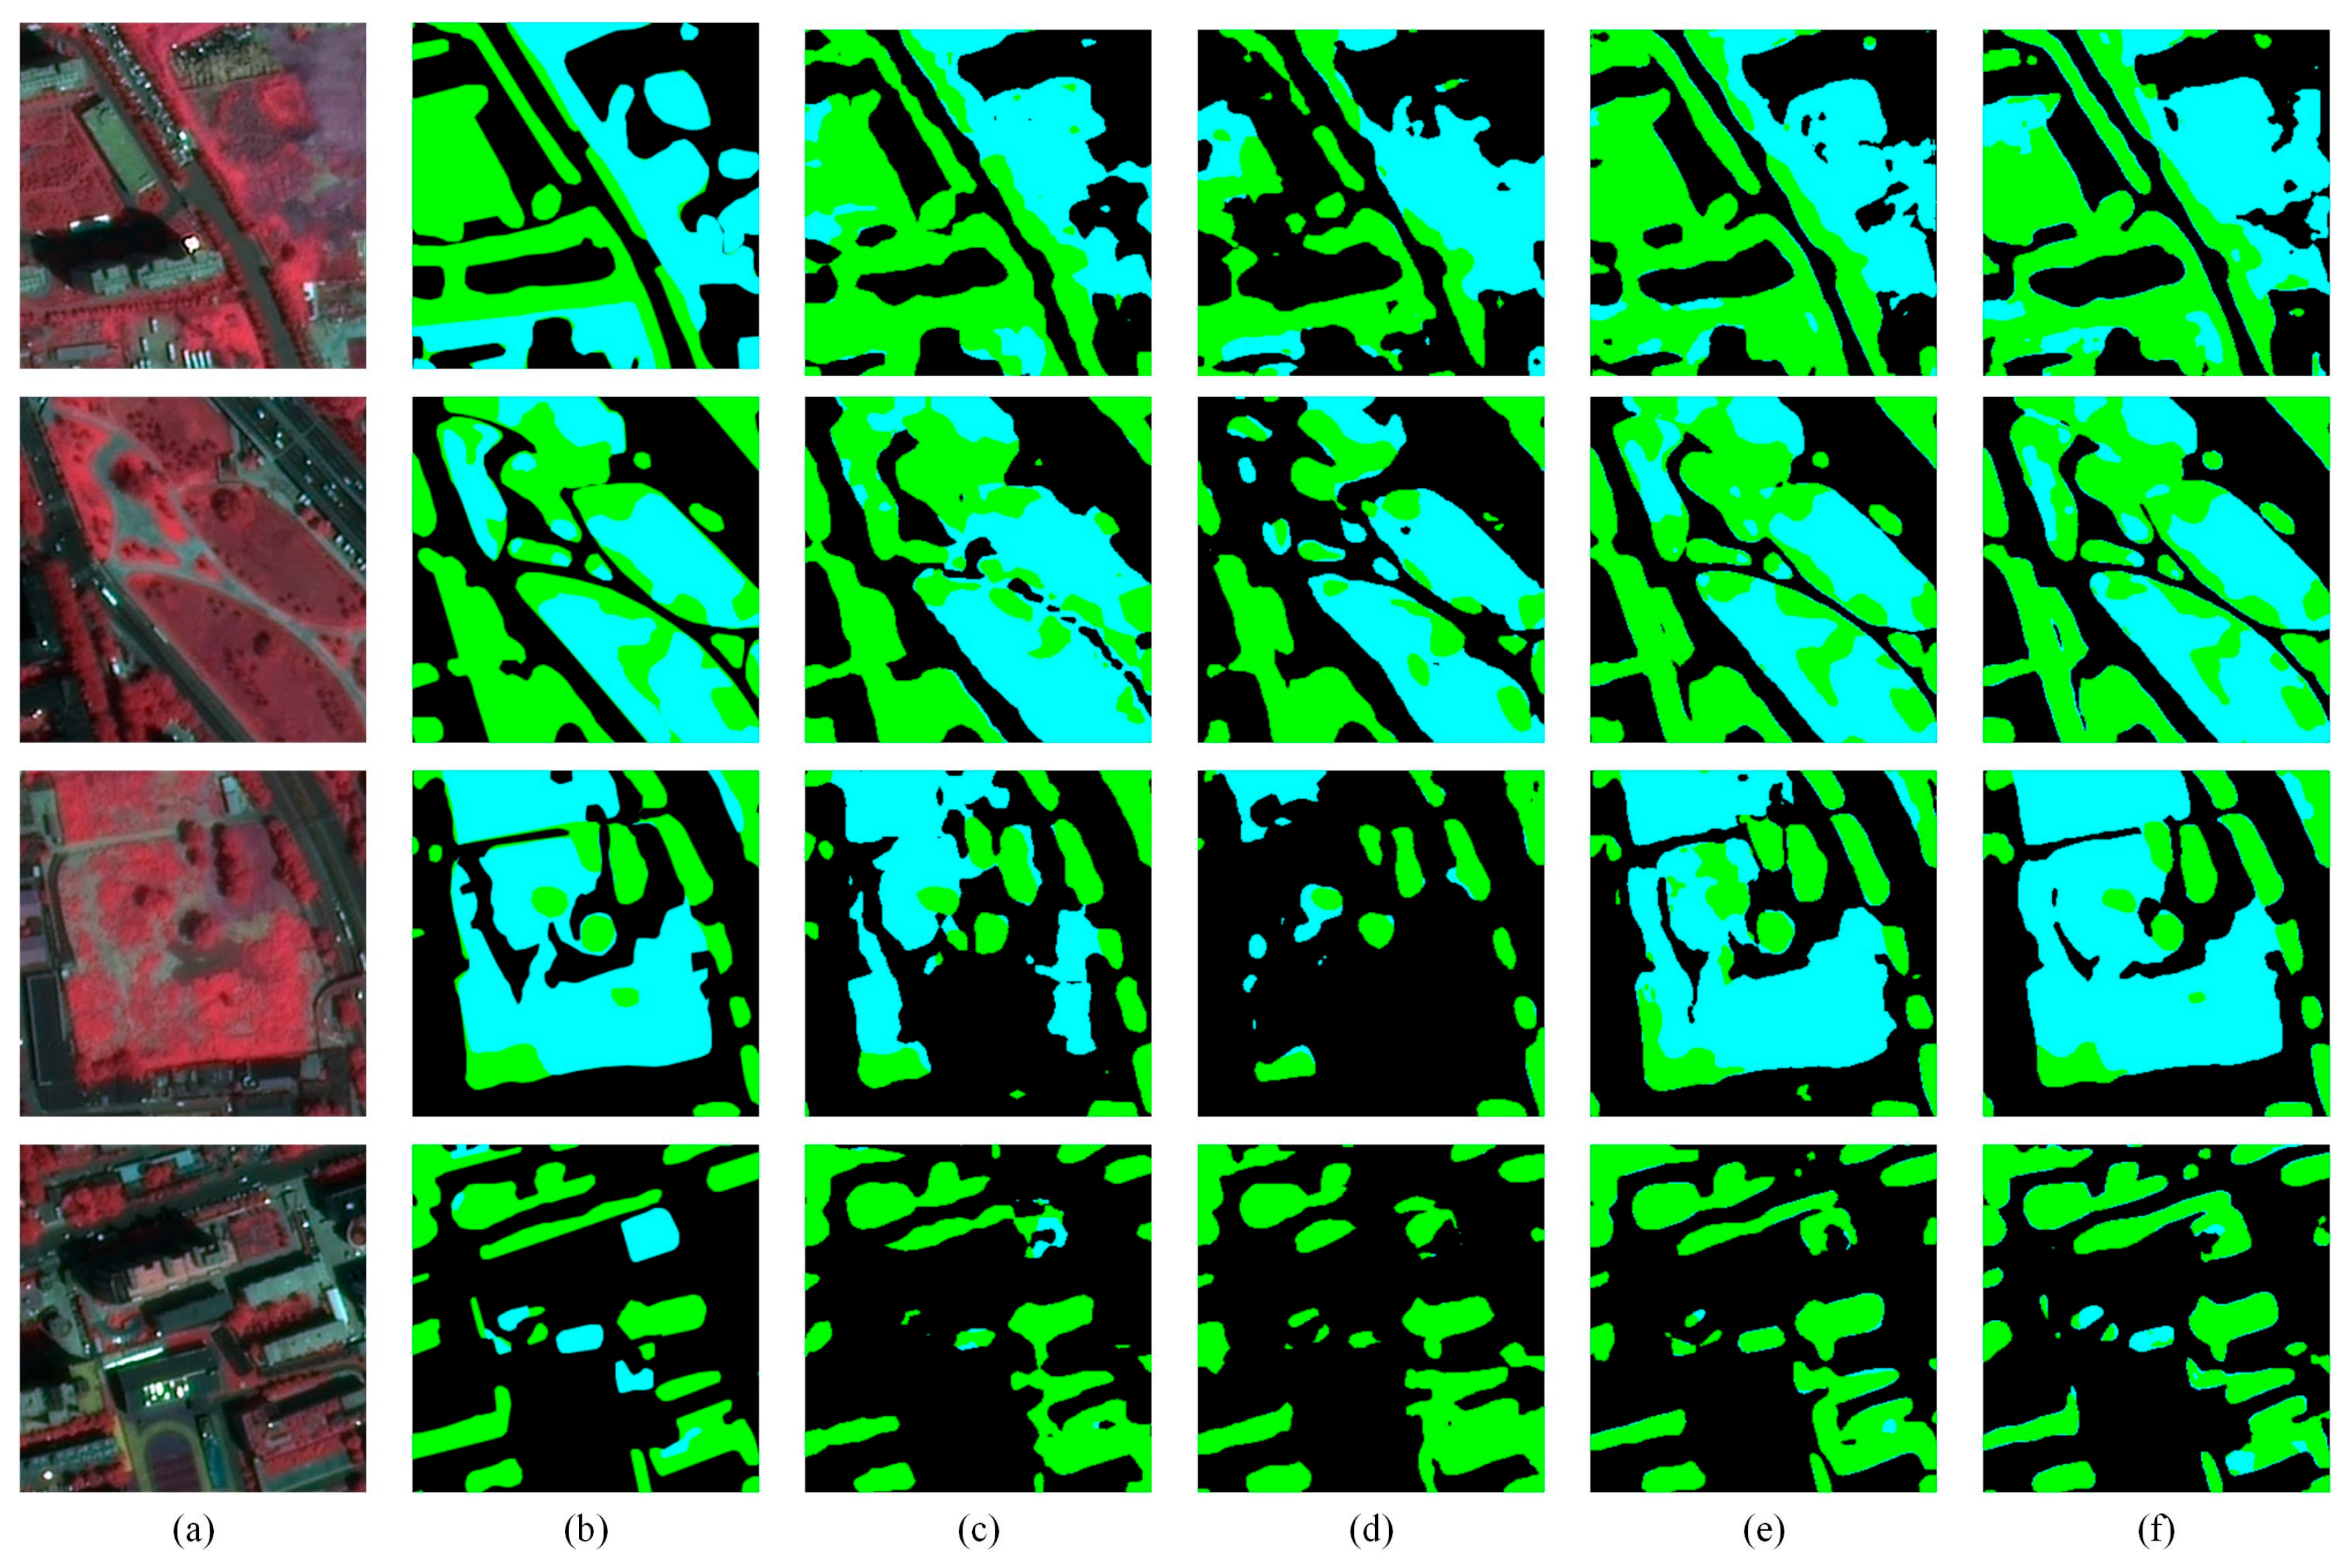
3.1.1. Comparison Experiment of the UGS-1 Dataset

To verify the effectiveness and rationality of MAFANet in UGS segmentation tasks, we select some existing methods and conduct a set of comparative experiments on UGS-1. This experimental method included UNet [18], FCN8s [19], SegNet [20], DeepLabv3+ [21], DenseASPP [31], ShuffleNetV2 [32], PSPNet [33], DFANet [34], DABNet [35], ESPNetv2 [36], ACFNet [37], ERFNet [38], HRNet [39], DensASPP (mobilenet), MFFTNet [40] and MAFANet. Table 1 shows the specific comparison experimental results.
Table 1 shows the four score indicators of our selected methods on the UGS-1 dataset. This paper uses PA, MPA, MIOU, and IOU to evaluate the effect of our selected methods. As can be seen from the table, for the UGS segmentation task, the proposed MAFANet has the highest segmentation accuracy, and all indicators are better than other networks. The scores of the four indicators are: PA, 88.52%; MPA, 81.55%; MIOU, 72.15%; IOU (low vegetation), 49.53%; IOU (tree), 81.64% (Table 1).
There are objects of different sizes, shapes, and widespread distribution in the HRS images, and the training and predicting results of different DL models are different. In order to intuitively show the effectiveness of the MAFANet model in the UGS segmentation task from the HRS images, this paper selected several representative remote sensing images on the UGS-1 dataset for experiments. The visual segmentation results are shown in Figure 9. We can observe that the MAFANet network can effectively detect the vast majority of objects. It can be seen closely from the first line of Figure 9, although DensASPP uses a dense pyramid and a large field of view structure, the classification results obtained ignore a large number of low vegetation parts, and the classification results are poor. The classification results of DeepLabv3+ show that the edges of the target are relatively smooth, but the building area next to the low vegetation cannot be correctly identified and is mistakenly detected as low vegetation (third row d in Figure 9); at the same time, the low vegetation area next to the trees cannot be effectively identified. UNet classification results have improved, but this method mistakenly identified some barren wastelands as green spaces (Figure 9). We can see from the figure that the segmentation effect of MAFANet is better than that of UNet and DenseASPP, and the edge of MAFANet segmentation is more consistent with the actual edge characteristics of UGS area. The MIOU scores of the MAFANet network are 6.47%, 2.22%, 2.18%, 1.73%, and 1.22% higher than those of ESPNetv2, SegNet, HRNet, ACFNet, and PSPNet, respectively. The IOU (low vegetation) scores of the MAFANet network are 7.78%, 1.94%, 3.13%, 1.69%, and 0.87% higher than those of ESPNetv2, SegNet, HRNet, ACFNet, and PSPNet, respectively. The scores of IOU (tree) are 6.01%, 2.05%, 1.72%, 1.53%, and 1.48% higher than ESPNetv2, SegNet, HRNet, ACFNet, and PSPNet, respectively. Experiments have shown that this model has certain advantages in UGS segmentation from HRS images. At the same time, compared with most existing networks, such as DenseASPP, DensASPP (mobilenet), SegNet, DeepLabv3+, and UNet, MAFANet effectively identifies most UGS and is close to the real surface conditions. Accurate green space segmentation faces considerable challenges, especially in urban environments characterized by intricate surfaces from the HRS images. The presence of building shadows, a multitude of imaging conditions, and the spectral similarities between green spaces and other features significantly impede precise green space extraction. This complexity necessitates innovative approaches to overcome these hurdles and enhance the accuracy of green space segmentation in HRS images. Performance of UGS recognition near buildings by Deeplabv3+ and DenseASPP decline; UNet incorrectly extracts green space parts near buildings, and the overall performance is poor. By optimizing the network, the MAFANet network performs multi-scale attention aggregation and dual-channel information fusion; effectively realizing green space classification in complex urban environments and having strong robustness.

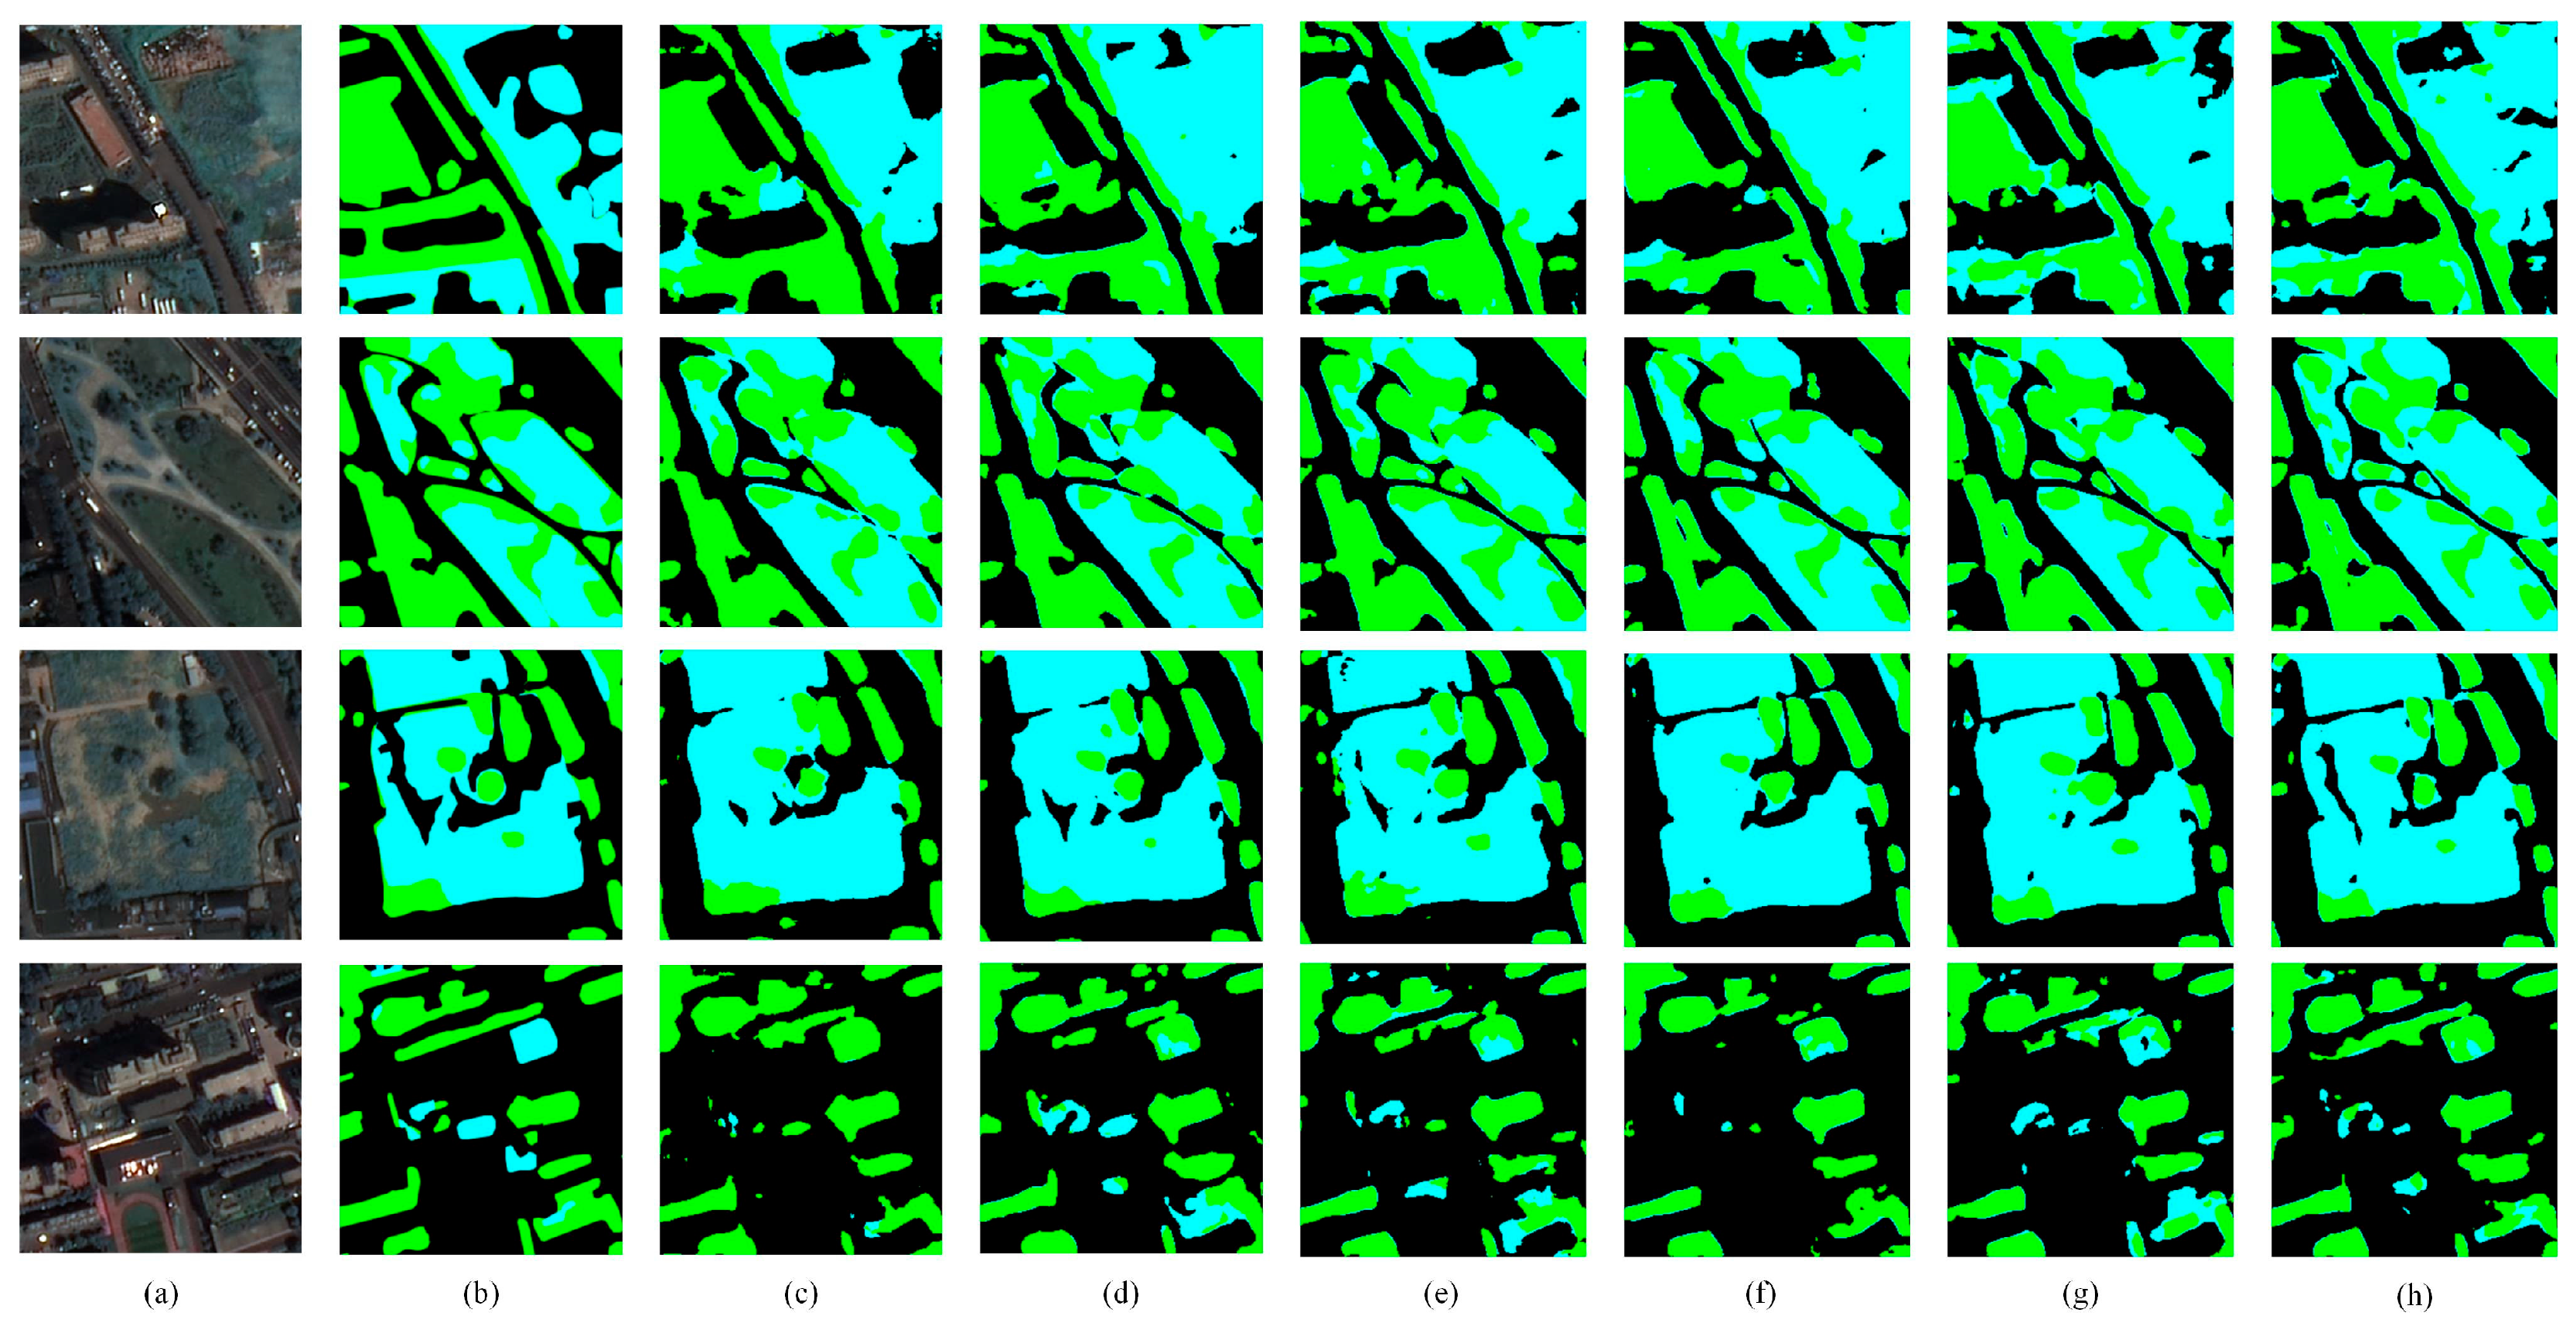
3.1.2. Comparison Experiment of the UGS-2 Dataset

To further test the generalization performance of MAFANet in the UGS segmentation task, we select the existing DL methods to conduct a set of comparative experiments on UGS-2. Table 2 shows the specific comparison experimental results.
In the UGS-2 dataset, the four score indicators of the proposed MAFANet network are: PA, 90.19%; MPA, 83.10%; MIOU, 74.64%; IOU (low vegetation), 51.43%; IOU (tree), 83.72% (Table 2). Comparing the segmentation accuracy of the MAFANet on UGS-1, the MIOU on UGS-2 data set reached 74.64%, an increase of 2.49%. Experiments have shown that using standard false color images to extract urban green spaces can better express the characteristics of UGS. It can be observed that the MAFANet network can effectively detect the vast majority of objects. From the third row of Figure 10, both DensASPP and DeepLabv3+ use dense connection structures, but the classification results obtained ignore a large number of low vegetation parts, and the classification results are poor; in comparison, MAFANet and UNet can effectively identify low vegetation and tree areas, The segmentation edges of MAFANet network are smoother than UNet. DensASPP mistakenly detects some roads between green spaces as green spaces (second row in Figure 10). We can see that MAFANet outperforms DeepLabv3+, DensASPP, and UNet in classifying low vegetation and tree. The MIOU scores of the MAFANet network are 5.21%, 2.4%, 1.29%, 1.27%, and 1.24% higher than those of ESPNetv2, HRNet, ACFNet, PSPNet, and SegNet, respectively. The IOU (low vegetation) scores the MAFANet network are 9.03%, 3.98%, 1.14%, 1.56%, and 1.26% higher than those of ESPNetv2, HRNet, ACFNet, PSPNet, and SegNet, respectively. The scores of IOU (tree) are 3.64%, 1.8%, 1.66%, 1.11%, and 1.23% higher than ESPNetv2, HRNet, ACFNet, PSPNet, and SegNet, respectively. For the surface information of the first row of building attachments, MAFANet recognizes better, captures more complete information, and excels closely approximating real surface conditions.

3.2. Ablation Experiments

3.2.1. Ablation Experiment on UGS-1 and UGS-2

To verify the effectiveness of the ResNet50, MSPA, BFF, and DE modules, ablation experiments are performed on UGS-1 dataset (Table 3) and UGS-2 dataset (Table 4), respectively. We start with the first line for feature extraction using the baseline, and then the upsampling operation is directly performed to output the extraction results. From the second line to the last line, this article adds DE, BFF, Pyconv, GAM, and MSPA modules in sequence.
Compared with the base network, the model feature extraction performance can be improved by using the new decoder module (Table 3, Figure 11). The DE module protects the integrity of the information when extracting UGS features, resulting in a 0.33% improvement in MIOU, a 0.41% improvement in IOU (low vegetation), and a 0.12% improvement in IOU (tree). The BFF module enhances the dual-channel communication capability, so that the two neighboring layers of ResNet50 network can guide each other in feature mining and improve the anti-interference capability of the MAFANet model, resulting in a 0.54% improvement in MIOU, a 0.37% improvement in IOU (low vegetation), and a 0.84% improvement in IOU (tree). Using the MSPA module, MIOU is significantly improved by 0.43%. In addition, a comparison was made between Pyconv and the GAM module, both of them showed a decrease in performance. The optimized MSPA module has better performance, with MIOU, IOU (low vegetation) and IOU (tree) all improved. The reason is that the MSPA module takes into account the multi-scale information extraction of the Pyconv module and the GAM module. The MSPA effectively utilizes the global attention field, which in turn improves the segmentation accuracy of the MAFANet model. Using the above improvement strategy finally brings a gain of 1.04 percentage points compared with the baseline, thus proving the effectiveness of the MAFANet network.
Compared with the base network, the model feature extraction performance can be improved by using the new decoder module (Table 4, Figure 12). Building the DE module and the BFF module effectively guides the learning of adjacent two layers of ResNet50 network and can carry out feature mining at the same time, increasing MIOU by 0.39%, IOU (low vegetation) by 0.52%, and IOU (tree) by 0.56%. Using the MSPA module, MIOU is significantly improved by 0.43%. In addition, comparing the Pyconv and GAM modules, the optimized MSPA module has better performance, with the MIOU, IOU (low vegetation) and IOU (tree) all improved. The reason is that the MSPA module takes into account the multi-scale information extraction of the Pyconv module and the GAM module. As a result, the MSPA module effectively improves segmentation accuracy. Using the above improvement strategy finally brings a gain of 0.82 percentage points to the model, proving the effectiveness of the MAFANet network.

3.2.2. Ablation Experiment of the Feature Engineering

To verify the effectiveness of feature engineering, we use UNet and MAFANet to conduct ablation experiments in different feature engineering (Table 5). We performed ablation experiments on the image of NDVI, the UGS-1 image, the image of fused NDVI in UGS-1, the UGS-2 image, and the image of fused NDVI in UGS-2 to test accordingly.
When the NDVI feature was incorporated into UGS-1 data, the MIOU of UNet and MAFANet increased by 1.95% and 1.94%, the IOU (low vegetation) increased by 0.67% and 1.14%, and the IOU (tree) increased by 1.59% and 1.70%, respectively. When the false color image features were incorporated into UGS-1 data, the MIOU of UNet and MAFANet increased by 2.56% and 2.49%, the IOU (low vegetation) increased by 1.77% and 1.90%, and the IOU (tree) increased by 2.16% and 2.08%, respectively. The integration of false color image and the NDVI index into UGS-1 data can further improve the accuracy of UGS segmentation by MAFANet from 72.15% to 74.73%.
In general, the fusion feature engineering can effectively improve the segmentation accuracy, and the above improvement strategy proves the effectiveness of the fusion feature engineering method. At the same time, several representative remote sensing images are selected for visual analysis, and the results are shown in Figure 13. After blending false color and NDVI feature engineering, the boundary of UGS is further distinguished. MAFANet’s UGS segmentation is more accurate and is close to the real situation of the surface.

4. Discussion

Among the existing studies on UGS extraction based on HRS images, our study further realizes the classification of tree and low vegetation compared to the study by Cheng et al. [40]. Compared to Yang et al. [41], we segment tree with higher accuracy when considering multi-scale object feature information in UGS. Compared with Shao et al. [42] and Shi et al. [43], we further integrate feature engineering to improve the UGS segmentation accuracy. In view of the problem that the current DL methods for UGS segmentation are too focused on improving the model structure but ignore the spectral information of HRS images, we proposed and verified a novel MAFANet. The MAFANet achieved UGS segmentation from high-resolution GF-2 satellite images by incorporating feature engineering and DL technology. We built UGS labeled datasets UGS-1 and UGS-2 based on GF-2 images to test the applicability of DL in UGS segmentation. At the same time, we conducted ablation experiments on the datasets UGS-1 and UGS-2 to verify the effectiveness of each module of the MAFANet network. In addition, deep learning networks such as FCN8s, UNet, SegNet, DeepLabv3+, DenseASPP, ShuffleNetV2, PSPNet, DFANet, DABNet, ESPNetv2, ACFNet, ERFNet, HRNet, DensASPP (mobilenet), MFFTNet were selected for comparative experiments. Experimental results on UGS-1 and UGS-2 data set show that our MAFANet model exhibits good robustness. In addition, we found that the MFFTNet network performed erratically. In the UGS-1 dataset, MFFTNet had a higher IOU for segmenting tree and a lower IOU for segmenting low vegetation than PSPNet. In the UGS-2 dataset, MFFTNet had a higher IOU for segmenting low vegetation and a lower IOU for segmenting tree than UNet. Both UNet and MAFANet performed well, with a good MIOU in both the UGS-1 and UGS-2 datasets, segmenting the tree and low vegetation very steadily. To this extent, we performed ablation experiments for feature engineering in the UNet and MAFANet networks. In particular, by using false color synthesis and vegetation feature (NDVI) feature engineering, our MAFANet network improved the MIOU by 2.58% over the baseline network, thus, further demonstrating the effectiveness of our approach. In particular, the use of false color compositing was better for UGS segmentation, with a significant increase of 2.49% for MAFANet. In contrast, NDVI was less effective, and incorporating NDVI into MAFANet resulted in a MIOU increase of 1.94%. Overall, results showed that the MIOU of UGS segmentation can be significantly improved by incorporating false color synthesis and the vegetation index (NDVI) into our MAFANet model.
However, although our MAFANet model showed excellent performance in experiments, we also recognize that the training of DL models still requires a large amount of labeled data, which may limit its generalizability in practical applications. Therefore, future research may need to explore some semi-supervised or unsupervised DL methods to alleviate the need for annotated data [44,45]. In addition, we will also explore how to incorporate features such as vegetation parameters and phenological changes into our MAFANet model to further improve the richness of the model and its ability to UGS segmentation [46].

5. Conclusions

In this study, we developed a new hybrid method (MAFANet) combined with feature engineering (false color and NDVI) for UGS segmentation in HRS images. Our method improves the segmentation accuracy by 3.62% compared to the baseline. Our approach utilizes a DE module, a BFF module, and a MSPA module to enhance the complement of green space context information and a multi-scale segmentation view of urban green space. Our method combines false color image and the NDVI to highlight vegetation information and effectively distinguishes green space boundaries. Experiments on the UGS-1 and UGS-2 datasets show that MAFANet performs well in terms of accuracy and generalization. In particular, we found that incorporating false color and NDVI improved the accuracy of UGS segmentation. Therefore, the seasonal variation characteristics of vegetation (such as phenological characteristics) should also be considered in the future to further identify the boundaries of the UGS and improve the segmentation accuracy of the UGS by providing the changes of vegetation under different seasons. Meanwhile, this experimental area is limited, and subsequent studies can consider testing in areas with more complex land use and richer vegetation types to further improve the model generalization and the related research on UGS.

Author Contributions

Conceptualization, Z.R.; methodology, W.W.; supervision, Y.C., Z.R. and J.W.; project administration, Y.C. and Z.R.; investigation, W.W. and Z.R.; writing—review and editing, W.W., Z.R., J.H. and W.Z.; funding acquisition, Y.C., Z.R. and W.Z.; resources, Y.Z. All authors have read and agreed to the published version of the manuscript.

Funding

This research was supported by the Innovation Project of LREIS (YPI007), the National Natural Science Foundation of China (grant numbers 42071377, 41975183, 41875184, 42201053), and supported by a grant from State Key Laboratory of Resources and Environmental Information System.

Data Availability Statement

The data used to support the results of this study are available from the respective authors upon request.

Acknowledgments

We thank the anonymous reviewers for their comments and suggestions that improved this paper.

Conflicts of Interest

The authors declare no conflict of interest.

Abbreviations

Since some parts of this article are abbreviated, a table explaining what each abbreviation means has been inserted to further enhance the readability of the article.
NameAbbreviation
high-resolution remote sensingHRS
deep learningDL
urban green spaceUGS
GaoFen-2GF-2
Multiscale Attention Feature Aggregation NetworkMAFANet
Normalized Difference Vegetation IndexNDVI
state-of- the-artSOTA
multiscale pooling attentionMSPA
decoder blockDE
bilateral feature fusionBFF
Global attention mechanismGAM
Pyramidal convolutionPyconv
Batch NormalizationBN
Multi-Layer PerceptronMLP
convolutionconv
PrecisionP
RecallR
Pixel AccuracyPA
Mean Pixel AccuracyMPA
Intersection over UnionIOU
Mean Intersection over UnionMIOU

References

  1. Kuang, W.; Dou, Y. Investigating the patterns and dynamics of urban green space in China’s 70 major cities using satellite remote sensing. Remote Sens. 2020, 12, 1929. [Google Scholar] [CrossRef]
  2. Zhang, B.; Li, N.; Wang, S. Effect of urban green space changes on the role of rainwater runoff reduction in Beijing, China. Landsc. Urban Plan. 2015, 140, 8–16. [Google Scholar] [CrossRef]
  3. Astell-Burt, T.; Hartig, T.; Putra, I.G.N.E.; Walsan, R.; Dendup, T.; Feng, X. Green space and loneliness: A systematic review with theoretical and methodological guidance for future research. Sci. Total Environ. 2022, 847, 157521. [Google Scholar] [CrossRef] [PubMed]
  4. De Ridder, K.; Adamec, V.; Bañuelos, A.; Bruse, M.; Bürger, M.; Damsgaard, O.; Dufek, J.; Hirsch, J.; Lefebre, F.; Prez-Lacorzana, J.M.; et al. An integrated methodology to assess the benefits of urban green space. Sci. Total Environ. 2004, 334, 489–497. [Google Scholar] [CrossRef] [PubMed]
  5. Schmidt-Traub, G.; Kroll, C.; Teksoz, K.; Durand-Delacre, D.; Sachs, J.D. National baselines for the Sustainable Development Goals assessed in the SDG Index and Dashboards. Nat. Geosci. 2017, 10, 547–555. [Google Scholar] [CrossRef]
  6. Chen, B.; Wu, S.; Song, Y.; Webster, C.; Xu, B.; Gong, P. Contrasting inequality in human exposure to greenspace between cities of Global North and Global South. Nat. Commun. 2022, 13, 4636. [Google Scholar] [CrossRef]
  7. Zhou, X.; Wang, Y.C. Spatial–temporal dynamics of urban green space in response to rapid urbanization and greening policies. Landsc. Urban Plan. 2011, 100, 268–277. [Google Scholar] [CrossRef]
  8. Wu, Z.; Chen, R.; Meadows, M.E.; Sengupta, D.; Xu, D. Changing urban green spaces in Shanghai: Trends, drivers and policy implications. Land Use Policy 2019, 87, 104080. [Google Scholar] [CrossRef]
  9. Wang, J.; Ma, A.; Zhong, Y.; Zheng, Z.; Zhang, L. Cross-sensor domain adaptation for high spatial resolution urban land-cover mapping: From airborne to spaceborne imagery. Remote Sens. Environ. 2022, 277, 113058. [Google Scholar] [CrossRef]
  10. Sun, J.; Wang, X.; Chen, A.; Ma, Y.; Cui, M.; Piao, S. NDVI indicated characteristics of vegetation cover change in China’s metropolises over the last three decades. Environ. Monit. Assess. 2011, 179, 1–14. [Google Scholar] [CrossRef]
  11. Jun, C.; Ban, Y.; Li, S. Open access to Earth land-cover map. Nature 2014, 514, 434. [Google Scholar] [CrossRef] [PubMed]
  12. Huang, C.; Yang, J.; Jiang, P. Assessing impacts of urban form on landscape structure of urban green spaces in China using Landsat images based on Google Earth Engine. Remote Sens. 2018, 10, 1569. [Google Scholar] [CrossRef]
  13. Yang, J.; Huang, C.; Zhang, Z.; Wang, L. The temporal trend of urban green coverage in major Chinese cities between 1990 and 2010. Urban For. Urban Green. 2014, 13, 19–27. [Google Scholar] [CrossRef]
  14. Huang, C.; Yang, J.; Lu, H.; Huang, H.; Yu, L. Green spaces as an indicator of urban health: Evaluating its changes in 28 mega-cities. Remote Sens. 2017, 9, 1266. [Google Scholar] [CrossRef]
  15. Hinton, G.E.; Osindero, S.; Teh, Y.W. A fast learning algorithm for deep belief nets. Neural Comput. 2006, 18, 1527–1554. [Google Scholar] [CrossRef] [PubMed]
  16. Zhu, Q.; Zhang, Y.; Wang, L.; Zhong, Y.; Guan, Q.; Lu, X.; Zhang, L.; Li, D. A global context-aware and batch-independent network for road extraction from VHR satellite imagery. ISPRS J. Photogramm. Remote Sens. 2021, 175, 353–365. [Google Scholar] [CrossRef]
  17. Wu, H.; Xiao, B.; Codella, N.; Liu, M.; Dai, X.; Yuan, L.; Zhang, L. Cvt: Introducing convolutions to vision transformers. In Proceedings of the International Conference on Computer Vision, Montreal, QC, Canada, 10–17 October 2021; pp. 22–31. [Google Scholar]
  18. Ronneberger, O.; Fischer, P.; Brox, T. U-net: Convolutional networks for biomedical image segmentation. In Proceedings of the Medical Image Computing and Computer-Assisted Intervention (MICCAI), Munich, Germany, 5–9 October 2015; pp. 234–241. [Google Scholar]
  19. Long, J.; Shelhamer, E.; Darrell, T. Fully convolutional networks for semantic segmentation. In Proceedings of the Computer Vision and Pattern Recognition, Boston, MA, USA, 7–12 June 2015; pp. 3431–3440. [Google Scholar]
  20. Badrinarayanan, V.; Kendall, A.; Cipolla, R. Segnet: A deep convolutional encoder-decoder architecture for image segmentation. IEEE Trans. Pattern Anal. Mach. Intell. 2017, 39, 2481–2495. [Google Scholar] [CrossRef] [PubMed]
  21. Chen, L.C.; Zhu, Y.; Papandreou, G.; Schroff, F.; Adam, H. Encoder-decoder with atrous separable convolution for semantic image segmentation. In Proceedings of the European Conference on Computer Vision (ECCV), Munich, Germany, 8–14 September 2018; pp. 801–818. [Google Scholar]
  22. Liu, W.; Yue, A.; Shi, W.; Ji, J.; Deng, R. An automatic extraction architecture of urban green space based on DeepLabv3plus semantic segmentation model. In Proceedings of the International Conference on Image, Vision and Computing (ICIVC), Xiamen, China, 5–7 July 2019; pp. 311–315. [Google Scholar]
  23. Tong, X.; Xia, G.; Lu, Q.; Shen, H.; Li, S.; You, S.; Zhang, L. Land-cover classification with high-resolution remote sensing images using transferable deep models. Remote Sens. Environ. 2020, 237, 111322. [Google Scholar] [CrossRef]
  24. Cao, Y.; Huang, X. A deep learning method for building height estimation using high-resolution multi-view imagery over urban areas: A case study of 42 Chinese cities. Remote Sens. Environ. 2021, 264, 112590. [Google Scholar] [CrossRef]
  25. Wu, F.; Wang, C.; Zhang, H.; Li, J.; Li, L.; Chen, W.; Zhang, B. Built-up area mapping in China from GF-3 SAR imagery based on the framework of deep learning. Remote Sens. Environ. 2021, 262, 112515. [Google Scholar] [CrossRef]
  26. He, K.; Zhang, X.; Ren, S.; Sun, J. Deep residual learning for image recognition. In Proceedings of the Computer Vision and Pattern Recognition, Las Vegas, NV, USA, 27–30 June 2016; pp. 770–778. [Google Scholar]
  27. Chollet, F. Xception: Deep learning with depthwise separable convolutions. In Proceedings of the Computer Vision and Pattern Recognition, Honolulu, HI, USA, 21–26 July 2017; pp. 1251–1258. [Google Scholar]
  28. Duta, I.C.; Liu, L.; Zhu, F.; Shao, L. Pyramidal convolution: Rethinking convolutional neural networks for visual recognition. arXiv 2020, arXiv:2006.11538. [Google Scholar]
  29. Liu, Y.; Shao, Z.; Hoffmann, N. Global attention mechanism: Retain information to enhance channel-spatial interactions. arXiv 2021, arXiv:2112.05561. [Google Scholar]
  30. Tucker, C.J.; Pinzon, J.E.; Brown, M.E.; Slayback, D.A.; Pak, E.W.; Mahoney, R.; Vermote, E.F.; Saleous, N.E. An extended AVHRR 8-km NDVI dataset compatible with MODIS and SPOT vegetation NDVI data. Int. J. Remote Sens. 2005, 26, 4485–4498. [Google Scholar] [CrossRef]
  31. Yang, M.; Yu, K.; Zhang, C.; Li, Z.; Yang, K. Denseaspp for semantic segmentation in street scenes. In Proceedings of the Computer Vision and Pattern Recognition, Salt Lake City, UT, USA, 18–22 June 2018; pp. 3684–3692. [Google Scholar]
  32. Ma, N.; Zhang, X.; Zheng, H.T.; Sun, J. Shufflenet v2: Practical guidelines for efficient cnn architecture design. In Proceedings of the European Conference on Computer Vision (ECCV), Munich, Germany, 8–14 September 2018; pp. 116–131. [Google Scholar]
  33. Zhao, H.; Shi, J.; Qi, X.; Wang, X.; Jia, J. Pyramid scene parsing network. In Proceedings of the Computer Vision and Pattern Recognition, Honolulu, HI, USA, 21–26 June 2017; pp. 2881–2890. [Google Scholar]
  34. Li, H.; Xiong, P.; Fan, H.; Sun, J. Dfanet: Deep feature aggregation for real-time semantic segmentation. In Proceedings of the Computer Vision and Pattern Recognition, Long Beach, CA, USA, 16–20 June 2019; pp. 9522–9531. [Google Scholar]
  35. Li, G.; Yun, I.; Kim, J.; Kim, J. Dabnet: Depth-wise asymmetric bottleneck for real-time semantic segmentation. arXiv 2019, arXiv:1907.11357. [Google Scholar]
  36. Mehta, S.; Rastegari, M.; Shapiro, L.; Hajishirzi, H. Espnetv2: A light-weight, power efficient, and general purpose convolutional neural network. In Proceedings of the Computer Vision and Pattern Recognition, Long Beach, CA, USA, 16–20 June 2019; pp. 9190–9200. [Google Scholar]
  37. Zhang, F.; Chen, Y.; Li, Z.; Hong, Z.; Liu, J.; Ma, F.; Han, J.; Ding, E. Acfnet: Attentional class feature network for semantic segmentation. In Proceedings of the International Conference on Computer Vision, Long Beach, CA, USA, 16–20 June 2019; pp. 6798–6807. [Google Scholar]
  38. Romera, E.; Alvarez, J.M.; Bergasa, L.M.; Arroyo, R. Erfnet: Efficient residual factorized convnet for real-time semantic segmentation. IEEE Trans. Intell. Transp. Syst. 2017, 19, 263–272. [Google Scholar] [CrossRef]
  39. Sun, K.; Xiao, B.; Liu, D.; Wang, J. Deep high-resolution representation learning for human pose estimation. In Proceedings of the Computer Vision and Pattern Recognition, Long Beach, CA, USA, 16–20 June 2019; pp. 5693–5703. [Google Scholar]
  40. Cheng, Y.; Wang, W.; Ren, Z.; Zhao, Y.; Liao, Y.; Ge, Y.; Wang, J.; He, J.; Gu, Y.; Wang, Y.; et al. Multi-scale Feature Fusion and Transformer Network for urban green space segmentation from high-resolution remote sensing images. Int. J. Appl. Earth Obs. Geoinf. 2023, 124, 103514. [Google Scholar] [CrossRef]
  41. Yang, X.; Fan, X.; Peng, M.; Guan, Q.; Tang, L. Semantic segmentation for remote sensing images based on an AD-HRNet model. Int. J. Digit. Earth 2022, 15, 2376–2399. [Google Scholar] [CrossRef]
  42. Shao, Z.; Zhou, W.; Deng, X.; Zhang, M.; Cheng, Q. Multilabel remote sensing image retrieval based on fully convolutional network. IEEE J. Sel. Top. Appl. Earth Obs. Remote Sens. 2020, 13, 318–328. [Google Scholar] [CrossRef]
  43. Shi, Q.; Liu, M.; Marinoni, A.; Liao, X. UGS-1m: Fine-grained urban green space mapping of 31 major cities in China based on the deep learning framework. Earth Syst. Sci. Data 2023, 15, 555–577. [Google Scholar] [CrossRef]
  44. Zhu, F.; Gao, J.; Yang, J.; Ye, N. Neighborhood linear discriminant analysis. Pattern Recognit. 2022, 123, 108422. [Google Scholar] [CrossRef]
  45. Zhu, F.; Zhang, W.; Chen, X.; Gao, X.; Ye, N. Large margin distribution multi-class supervised novelty detection. Expert Syst. Appl. 2023, 224, 119937. [Google Scholar] [CrossRef]
  46. Du, S.; Liu, X.; Chen, J.; Duan, W.; Liu, L. Addressing validation challenges for TROPOMI solar-induced chlorophyll fluorescence products using tower-based measurements and an NIRv-scaled approach. Remote Sens. Environ. 2023, 290, 113547. [Google Scholar] [CrossRef]
Figure 1. MAFANet structure.
Remotesensing 15 05472 g001
Figure 2. Resnet50 residual structure.
Remotesensing 15 05472 g002
Figure 3. (a) A new decoder block; (b) a bilateral feature fusion module.
Remotesensing 15 05472 g003
Figure 4. Channel attention submodule.
Remotesensing 15 05472 g004
Figure 5. Spatial attention submodule.
Remotesensing 15 05472 g005
Figure 6. Example of NDVI image.
Remotesensing 15 05472 g006
Figure 7. Example of UGS-1 dataset.
Remotesensing 15 05472 g007
Figure 8. Example of UGS-2 dataset.
Remotesensing 15 05472 g008
Figure 9. Visualization results of experiments comparing the UGS-1. (a) Input image; (b) Label; (c) DensASPP; (d) DeepLabv3+; (e) UNet; (f) MAFANet.
Remotesensing 15 05472 g009
Figure 10. Visualization results of experiments comparing the UGS-2. (a) Input image; (b) Label; (c) DensASPP; (d) DeepLabv3+; (e) UNet; (f) MAFANet.
Remotesensing 15 05472 g010
Figure 11. UGS-1 ablation experiment visualization results. (a) Input image; (b) Label; (c) baseline; (d) baseline+ DE; (e) baseline+ DE+ BFF; (f) baseline+ DE+ BFF+ Pyconv; (g) baseline+ DE+ BFF+ GAM; (h) baseline+ DE+ BFF+ MSPA.
Remotesensing 15 05472 g011
Figure 12. UGS-2 ablation experiment visualization results. (a) Input image; (b) Label; (c) baseline; (d) baseline+ DE; (e) baseline+ DE+ BFF; (f) baseline+ DE+ BFF+ Pyconv; (g) baseline+ DE+ BFF+ GAM; (h) baseline+ DE+ BFF+ MSPA.
Remotesensing 15 05472 g012
Figure 13. Feature engineering ablation experiment visualization results. (a) Input image (UGS-1); (b) Label; (c) MAFANet (NDVI); (d) MAFANet (UGS-1); (e) MAFANet (UGS-1+NDVI); (f) MAFANet (UGS-2); (g) MAFANet (UGS-2+NDVI).
Remotesensing 15 05472 g013
Table 1. Results of comparison experiments on UGS-1.
Overall ResultsClass IOU
MethodPA (%)MPA (%)MIOU (%)Low Vegetation (%)Tree (%)
DensASPP(mobilenet)83.7175.2264.1940.3574.11
ESPNetv284.9475.5265.6841.7575.63
DensASPP85.2976.1066.3942.8176.67
DFANet85.1876.4066.4443.5675.29
ShuffleNetV286.2277.7368.2245.7477.68
DeepLabv3+86.3178.1268.3845.6678.08
FCN8s87.0179.4969.7147.3579.11
SegNet87.1779.5169.9347.5979.59
HRNet87.5378.9669.9746.4079.92
ERFNet87.4779.2270.0646.9579.92
DABNet87.5379.2170.2247.4779.97
ACFNet87.5179.8770.4247.8480.11
MFFTNet87.9779.2970.5546.7380.54
PSPNet87.8479.9970.9348.6680.16
ResNet5088.0380.0671.1148.4480.64
UNet88.2580.5171.5348.9481.12
MAFANet88.5281.5572.1549.5381.64
Table 2. Results of comparison experiments on UGS-2.
Overall ResultsClass IOU
MethodPA (%)MPA (%)MIOU (%)Low Vegetation (%)Tree (%)
DensASPP (mobilenet)84.7375.4864.8938.6273.85
DFANet87.3077.4868.3741.0578.29
ESPNetv288.0777.6769.4342.4080.08
DensASPP88.4578.7370.5845.0080.80
DeepLabv3+88.5379.6370.8844.9481.06
ShuffleNetV288.2680.5371.4348.4580.43
FCN8s88.8779.8771.5846.5781.27
HRNet89.2180.4172.2447.4581.92
ERFNet89.4280.8172.7148.2582.11
DABNet89.3481.1872.9749.7181.73
ACFNet89.4781.8173.3550.2982.06
PSPNet89.6181.4873.3749.8782.61
SegNet89.5981.4973.4050.1782.49
ResNet5089.8481.7073.8250.7182.68
MFFTNet89.8282.2774.0151.2482.63
UNet89.9782.2974.0950.7183.28
MAFANet90.1983.1074.6451.4383.72
Table 3. Results of UGS-1 ablation experiments. DE denotes decoder block, BFF denotes bilateral feature fusion module, Pyconv denotes Pyramidal Convolution, GAM denotes Global attention mechanism, MSPA denotes multiscale pooling attention.
Class IOU
MethodMIOU (%)Low Vegetation (%)Tree (%)
baseline71.1148.4480.64
baseline+ DE71.4448.8580.76
baseline+ DE+ BFF71.9849.2281.60
baseline+ DE+ BFF+ Pyconv71.8049.1481.34
baseline+ DE+ BFF+ GAM71.7648.6981.53
baseline+ DE+ BFF+ MSPA72.1549.5381.64
Table 4. Results of UGS-2 ablation experiments. DE denotes decoder block, BFF denotes bilateral feature fusion module, Pyconv denotes Pyramidal Convolution, GAM denotes Global attention mechanism, MSPA denotes multiscale pooling attention.
Class IOU
MethodMIOU (%)Low Vegetation (%)Tree (%)
baseline73.8250.7182.68
baseline+ DE74.1550.9783.00
baseline+ DE+ BFF74.2151.2383.24
baseline+ DE+ BFF+ Pyconv74.4651.2483.43
baseline+ DE+ BFF+ GAM74.4851.1183.71
baseline+ DE+ BFF+ MSPA74.6451.4383.72
Table 5. Results of the feature engineering ablation experiments. UGS-1+NDVI indicates that NDVI is superimposed onto the UGS-1 data, and UGS-2+NDVI indicates that NDVI is superimposed onto the UGS-2 data.
Class IOU
DataMethodMIOU (%)Low Vegetation (%)Tree (%)
NDVIUNet69.5841.8479.83
MAFANet71.1046.2680.38
UGS-1UNet71.5348.9481.12
MAFANet72.1549.5381.64
UGS-1+NDVIUNet73.4849.6182.71
MAFANet74.0950.6783.34
UGS-2UNet74.0950.7183.28
MAFANet74.6451.4383.72
UGS-2+NDVIUNet74.1150.8983.26
MAFANet74.7350.9684.05
Disclaimer/Publisher’s Note: The statements, opinions and data contained in all publications are solely those of the individual author(s) and contributor(s) and not of MDPI and/or the editor(s). MDPI and/or the editor(s) disclaim responsibility for any injury to people or property resulting from any ideas, methods, instructions or products referred to in the content.

