Article

Critical Disaster Indicators (CDIs): Deriving the Duration, Damage Degree, and Recovery Level from Nighttime Light Image Time Series

1
Department of Geography, Texas A&M University, College Station, TX 77843, USA
2
Center for Spatial Analysis, University of Oklahoma, Norman, OK 73019, USA
3
Department of Geography and Environmental Sustainability, University of Oklahoma, Norman, OK 73019, USA
*
Author to whom correspondence should be addressed.
Remote Sens. 2023, 15(23), 5471; https://doi.org/10.3390/rs15235471
Submission received: 7 October 2023 / Revised: 11 November 2023 / Accepted: 22 November 2023 / Published: 23 November 2023
(This article belongs to the Section Urban Remote Sensing)

Abstract

:
Deriving timely natural disaster information is critical in emergency risk management and disaster recovery efforts. Due to the limitation of data availability, such information is difficult to obtain in a timely manner. In this research, VIIRS nighttime light (NTL) image time series from January 2014 to July 2019 were employed to reflect key changes between pre- and post-disasters. The Automated Valley Detection (AVD) model was proposed and applied to derive critical disaster indicators in the 2017 Hurricane Maria event in Puerto Rico. Critical disaster indicators include outage duration, damage degree, and recovery level. Two major findings can be concluded. First, the AVD model is a robust and useful approach to detecting sudden changes in NTL in terms of their location and duration at the census tract level. Second, the AVD-estimated disaster metrics are able to capture disaster information successfully and match with two types of reference data. These findings will be valuable for emergency planning and the energy industry to monitor and restore power outages in future natural disasters.

1. Introduction

Electricity is the backbone of a society, supporting social wellbeing, industrial production, and economic development. In a natural disaster event, unfortunately, power infrastructure is one of the most vulnerable systems. The losses of power supply caused by natural hazards impede emergency response, disrupt critical infrastructure (e.g., telecommunication and transportation), and increase the difficulty for healthcare. In the United States, the average annual number of power outages caused by weather events increased by 78% from 2011 to 2021 compared to the 2000s due to climate change, and they cost at least tens of billion dollars annually [1]. Examples include Hurricane Sandy in 2012, Hurricane Maria in 2017, and the winter storm in Texas in 2021, to name a few [2,3,4]. To reduce economic losses and disaster fatalities and to improve power system resilience, timely knowledge of a complete process of electricity recovery is critical.
Current U.S. public power outage data are normally limited in both spatial and temporal domains. For example, data published by Transmission Availability Data System (TADS) [5] and Eaton Blackout Tracker [6] are only available at regional or state levels. In addition, they are usually updated on a quarterly or annual basis. Neither such spatial nor temporal scale is sufficient to provide detailed and timely information on a natural disaster. Moreover, they hardly reflect spatial heterogeneity of disaster recovery situations within a region or state, which is important to present the complexity of disaster management at a local scale and further help government and citizens to cope with accidental events [7]. Even though local electric power companies provide information on power outages, they are likely restricted by data quality uncertainty due to missing records and inconsistency across regions. Thus, it is difficult to perform regional comparisons.
Recent developments in utilizing remote sensing technology, such as nighttime light (NTL) [2,8,9,10], LiDAR [11], Synthetic Aperture Radar (SAR) [12], and unmanned aerial vehicle (UAV) photogrammetry [13], allow for more efficiently assessing the damage level and recovery process of natural disasters. Among these remote sensing datasets, an advantage of NTL is its large geographic coverage, high update frequency, and consistent data source and format, which are invaluable to largely address the aforementioned limitations. Two mainstream NTL products are widely used, namely, Defense Meteorological Satellite Program/Operational Linescan System (DMSP/OLS) and Visible Infrared Imaging Radiometer Suite (VIIRS) Day/Night Band (DNB). Increasing studies have employed the VIIRS DNB images due to their improved spatial resolution and the mitigation of the saturation and overglow issues associated with DMSP/OLS [14]. Applications using VIIRS DNB include urban delineation and expansion analysis [10,15], economic activity estimates [16,17], electricity consumption analysis [18,19], natural disaster detection [2,8], boats and fishing activity detection [20,21], conflict observation [22,23], and world heritage conservation [24].
When it comes to natural disaster recovery, by comparing differences between pre- and post-disaster NTL intensity, researchers depicted power outage extent [9,25,26]. Nonetheless, the information on the extent of affected areas is not sufficient to respond to emergencies in natural hazards. Other important disaster information, such as how long a disaster event lasts, how quickly the recovery process is, and how well the electricity system is restored, is also valuable. Even though two investigations have shed light on such information, they can be further improved in three ways [8,27]. First, it is commonly assumed that electrical power can be regained to the degree of pre-disaster normality. In reality, however, a system may not be able to return to its pre-disaster level, particularly after an extremely severe natural hazard, such as the 1995 Kobe earthquake in Japan [28]. Thus, simply using variations between pre- and post-disaster levels as a criterion to evaluate how long it takes for the electric grid to be fully restored may produce estimation bias. Second, the literature always used a simple average to obtain the pre-disaster light intensity level. The derivation likely ignores long-term trends in light intensity, especially in areas with increasing (e.g., Texas) [29] or decreasing (e.g., Puerto Rico) [30] population and electricity demand, which would lead to, respectively, a rise or decline in the brightness level. Inaccurate pre-event level estimations possibly result in overestimations/underestimations when assessing disaster damage and recovery levels. Third, few studies have estimated critical disaster metrics such as disaster duration and the recovery level. This is because human interventions existed to some degree when investigating disaster recovery situations, including manual identification of pre- and post-disaster periods and visual examination on the recovery processes [9,25,27]. These approaches are prone to inaccuracies in terms of the identification of critical times in a disaster, especially the end of the recovery.
To improve the existing disaster studies using NTL time series data, it is of great necessity to develop new methods that allow the automatic detection of different periods of a disaster. With the detected periods, we can further derive detailed information on disaster recovery processes (i.e., outage and recovery duration, the degree of damage during the disaster, and the recovery level when the electricity system fully recovers). To this end, the overall objective of this research is to explore whether and how timely and accurate disaster information can be extracted from nighttime light image time series in support of disaster rescue. Two specific aims include: (1) to propose an automated method to detect change points with night image time series, (2) to derive several critical disaster indicators (CDI) in a timely manner, including the duration of the disaster, the degree of damage, and the degree of recovery.

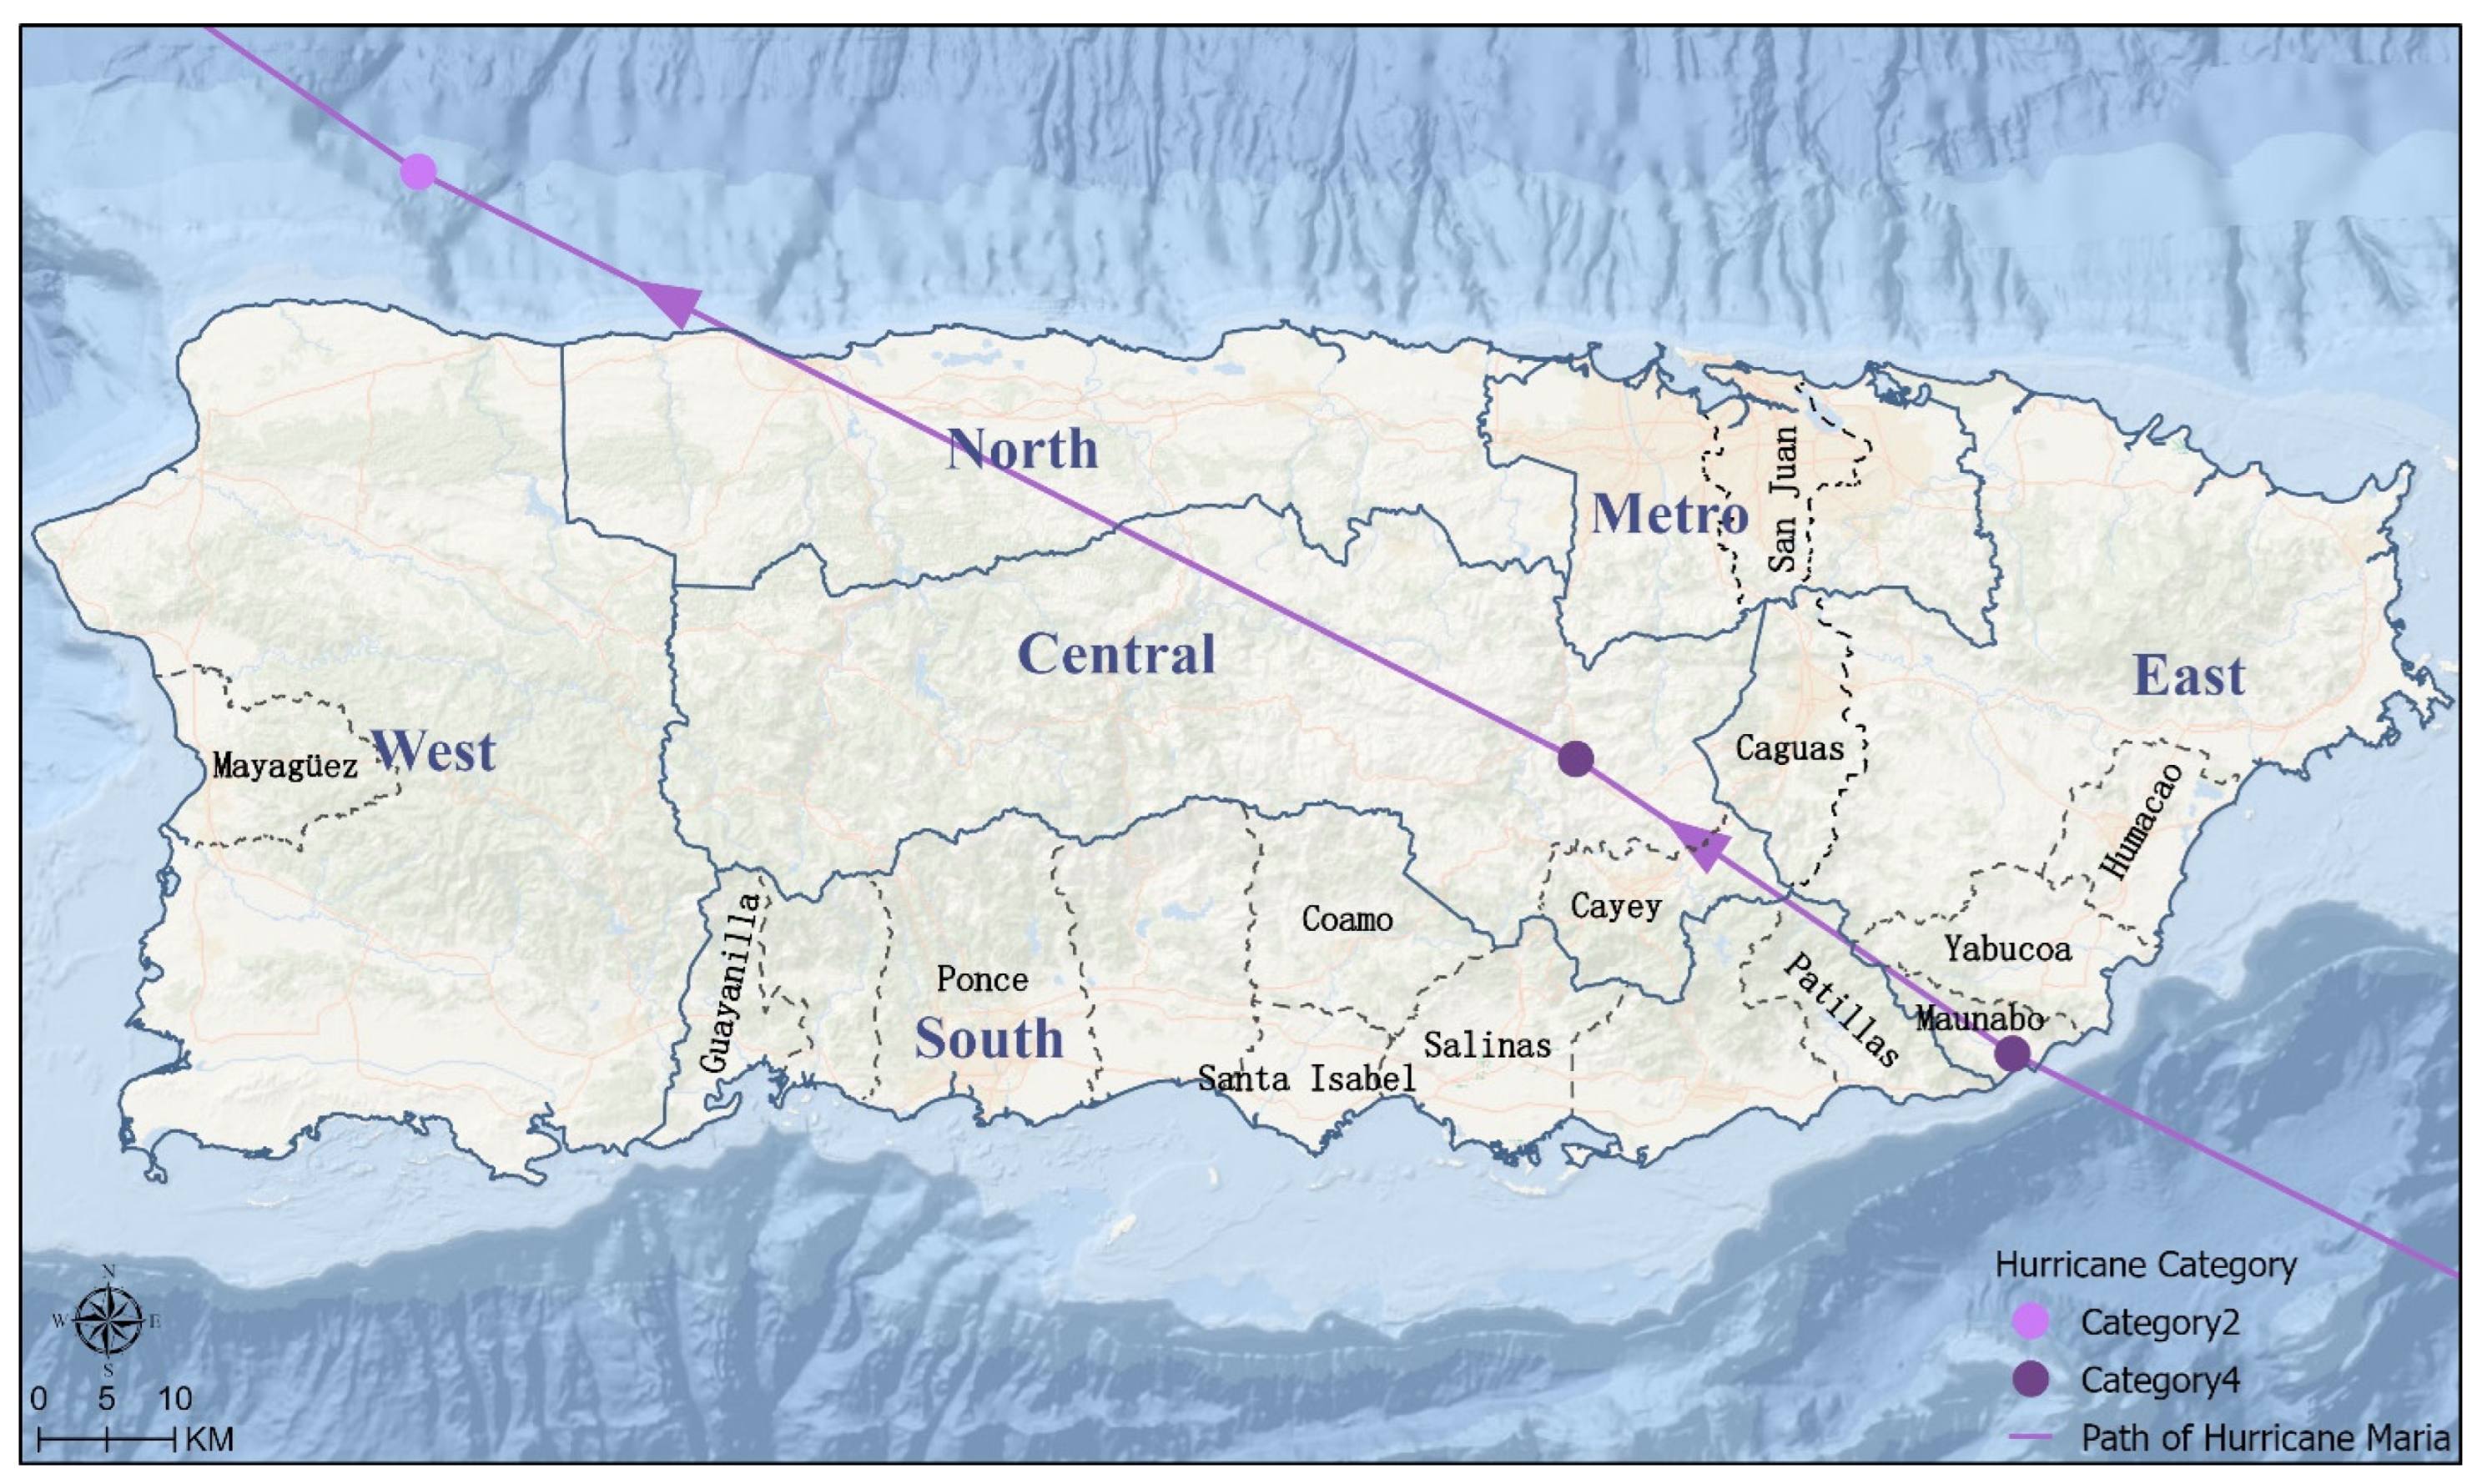
2. Study Area and Data
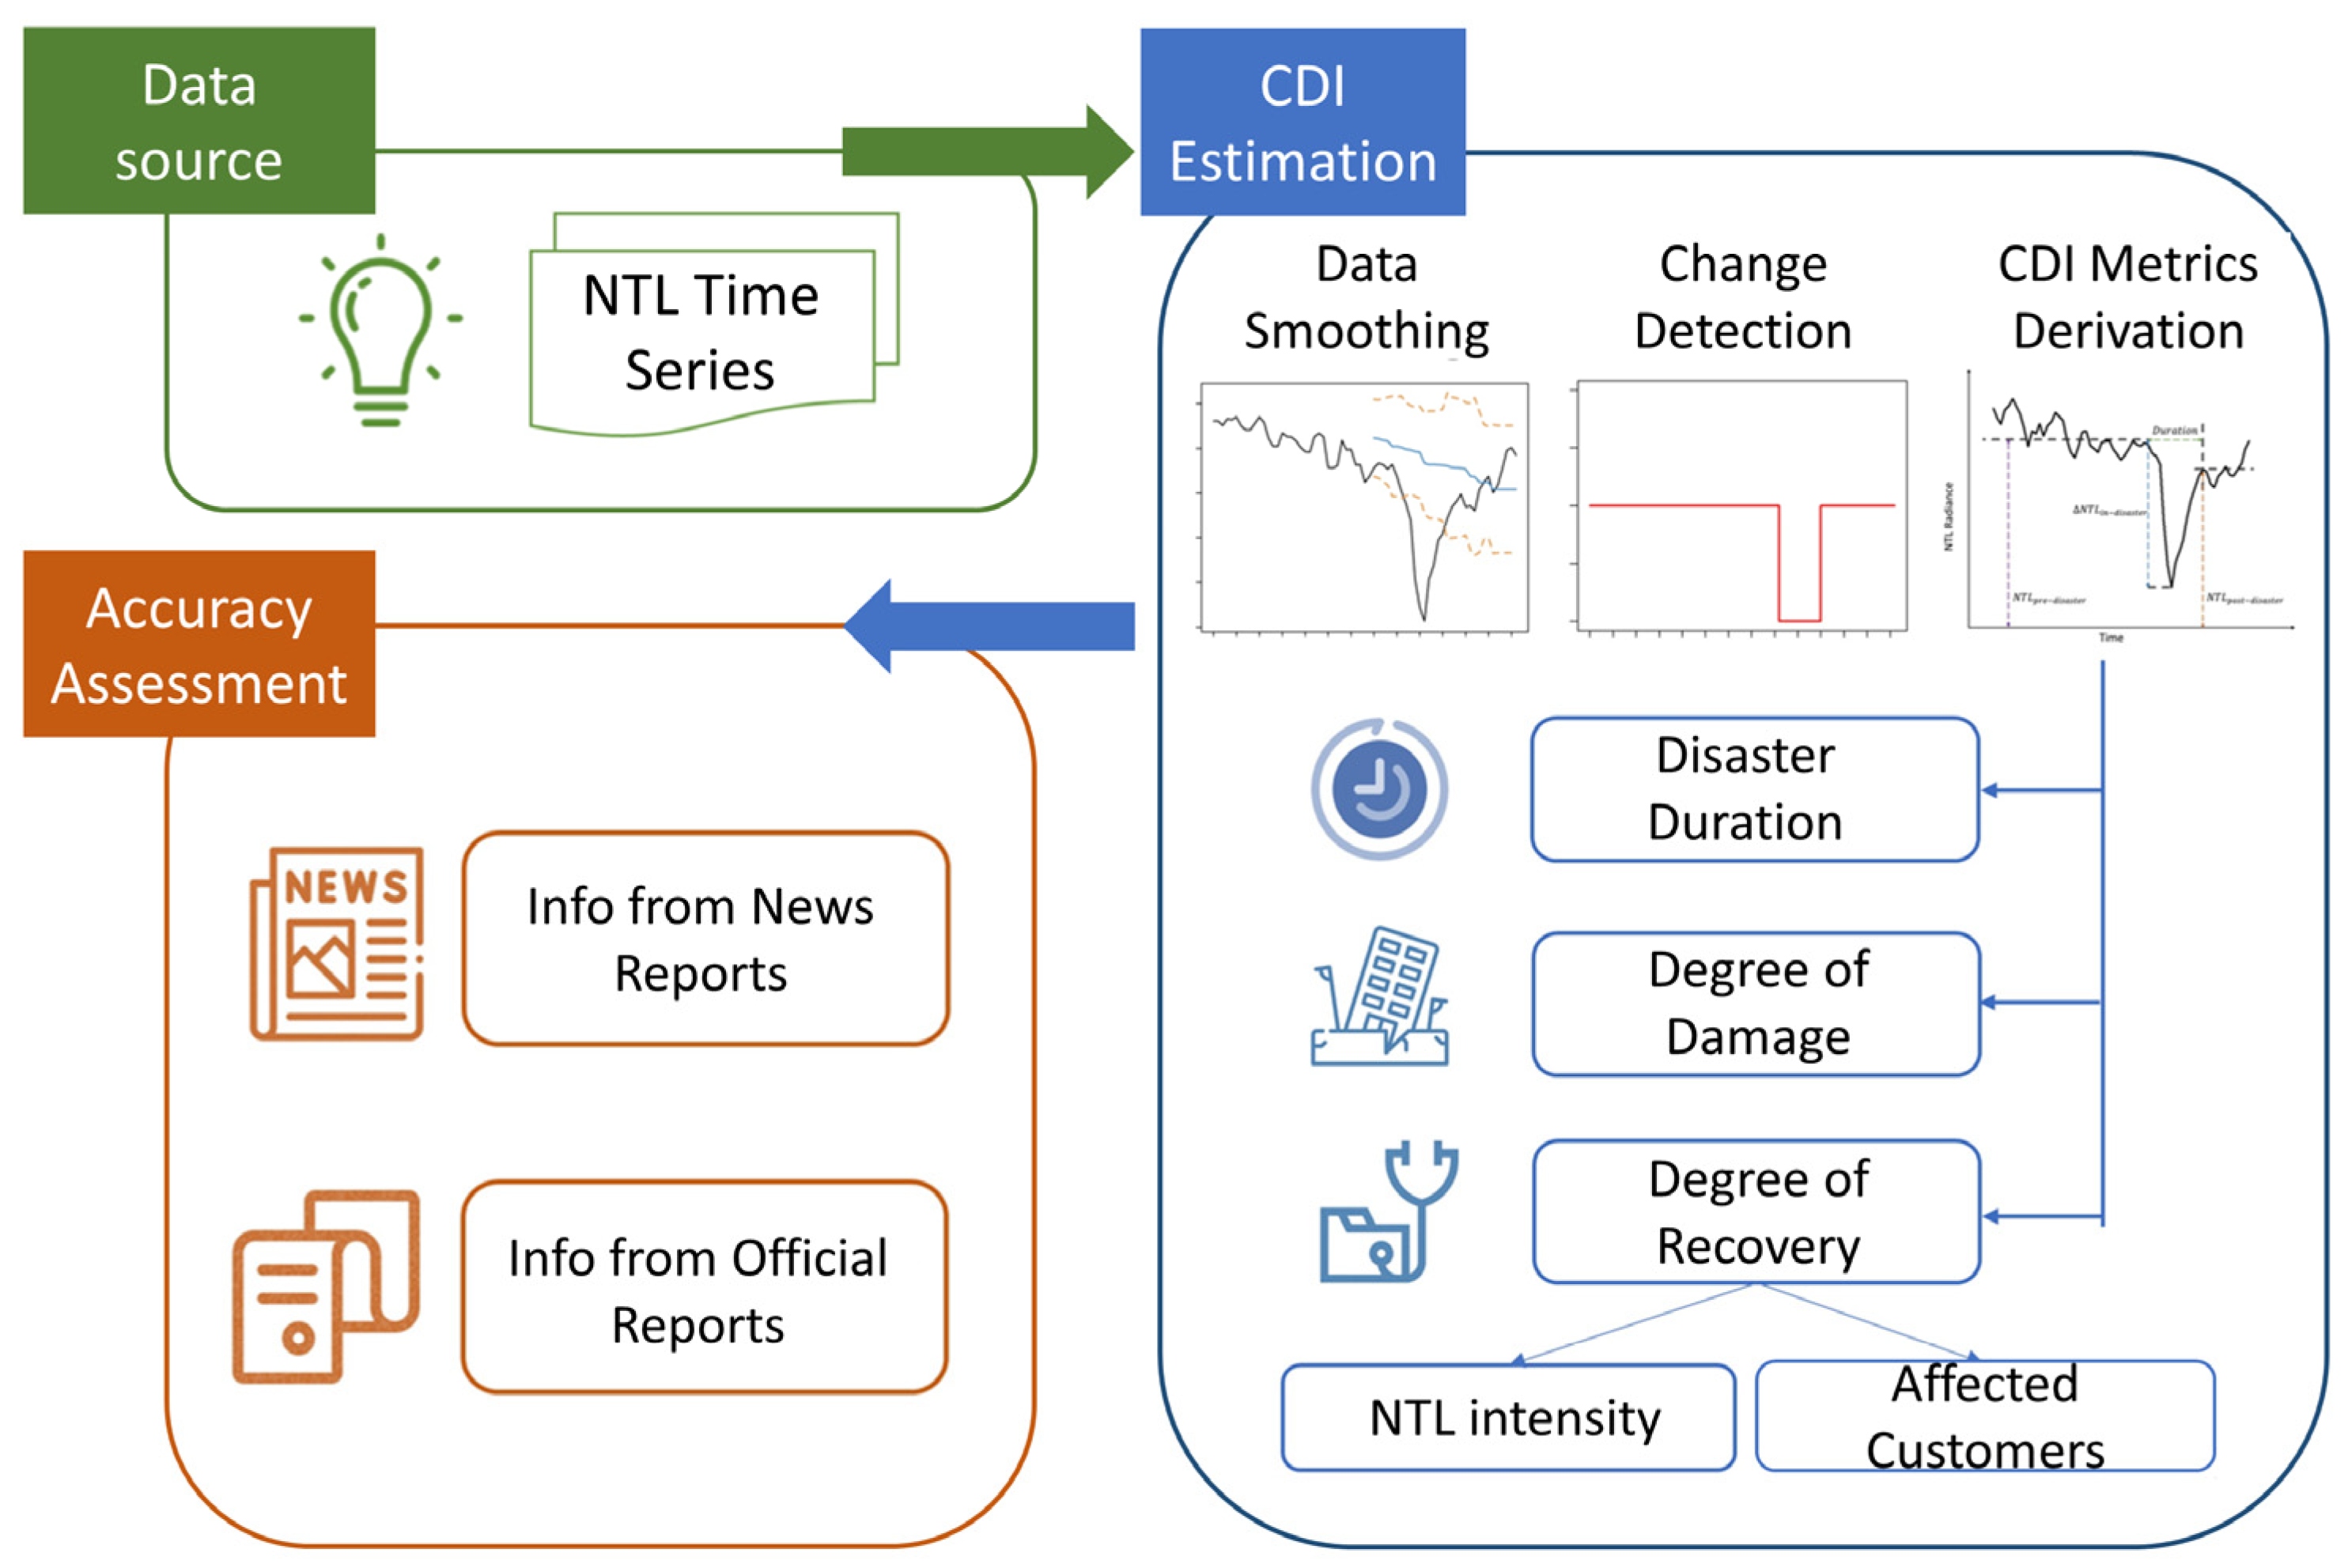
Hurricane Irma skirted northeastern Puerto Rico in early September 2017, leading to 1 million island population living without power. Two weeks later, Hurricane Maria hit Puerto Rico on 20 September 2017, as a Category 4 hurricane with sustained winds of 155 mph. It first landed near the town of Yabucoa in southeastern Puerto Rico and then moved to the northwest (Figure 1). After passing through the whole island, it weakened and became a Category 2 hurricane. It is the worst storm that affected the entire island in the past 80 years. Heavy rains and floods, along with the hurricane, further worsened the damage. This catastrophic disaster knocked out electricity completely across the island, resulting in the longest blackout in U.S. history. Nearly 3.4 million Puerto Ricans were affected by this storm [31]. Further, the restoration of the grid was exceptionally slow [32]. Only 18.5% of peak load was restored one month after the hurricane landed. Approximately 95% of customers did not have their power restored until over half a year after the disaster event [3]. According to the Puerto Rico Electric Power Authority (PREPA), it took nearly one year after the hurricane to recover power to serve all customers. The municipality of Yabucoa, where the hurricane landed, was the last area recovering from the blackout [31]. In addition to the exposure to Hurricane Maria, the electricity demand and the generation capacity of power plants also affected the process of regional recovery. Approximately 40% of the island population lives in the San Juan metropolitan area, demanding the greatest electricity across the entire island. As a result, electricity transmission from the south of the island is particularly important. Severe damages to these transmission lines substantially affected the electric power restoration in the San Juan metropolitan area [30].
To quantify the impact of Hurricane Maria, VIIRS DNB NTL data covering Puerto Rico were used to examine changes in night light before and after the hurricane. All available VIIRS DNB monthly composites from January 2014 (the first year with the stray light correction) to July 2019 (when we started to work on this research), produced by the Earth Observation Group [14], were employed in the analysis. Noise pixels, including those contaminated by stray light, lunar illumination, and cloud cover, were removed, while all other valid pixels were retained. To provide a big picture of Hurricane Maria’s impact, the monthly night light radiance of the entire island was extracted and plotted (Figure 2). The information on customers with power percentage was acquired from the situation reports published by the U.S. Department of Energy [3]. It is worth noting that since the situation reports were only published from September 2017 (when the hurricane landed), we assumed all customers with power (i.e., 100%) before Hurricane Maria (July and August 2017). Starting from July and August 2017 (the upper right bubbles in Figure 2), the night light intensity decreased considerably in September of the same year, dropped to the lowest in October (the lower left bubble in Figure 2), and slowly grew each month until April 2018 (i.e., the last month in the DOE situation reports). A correlation coefficient of 0.97 shows a high correlation between average NTL radiance and the official percent customers with power from DOE. To obtain detailed CDI (e.g., power outage and recovery status) at a finer scale, NTL data were further examined at the census tract level.

3. Methods

The analytical framework of this study consists of four major parts: NTL data smoothing, change detection, CDI metrics derivation, and accuracy assessment (Figure 3).

3.1. Data Smoothing

To mitigate the noise of the NTL data, we first applied a Savitzky–Golay (S–G) filter to smooth the raw data. This algorithm is based on the least square polynomial fitting [33]. This filter method allows data to retain their features, such as the number and frequency of peak values [34]. The degree of polynomial decides how many noises can be detected and how well the bias can be reduced [35]. Generally, higher-order filters allow for the detection of narrower noises but are less likely to smooth data [36]. The general equation for data smoothing is given as follows [35]:
l ^ j = i = m i = m C i l j + 1 N
where l is the raw NTL data, l ^ is the smoothed NTL, j refers to the running index of the ordinate data in the original table, C i is the coefficient for the corresponding brightness value of the filter, N indicates the size of the smoothing window, and m is half-width of the window. To select the optimal filter order in the S–G filter, we carried out a sensitivity analysis by computing the differences between the raw and smoothed data using root mean square error (RMSE). It is calculated as follows:
R M S E = 1 y x = 1 y ( l ^ x l x ) 2
where l ^ x is the smoothed NTL obtained from various filter orders (ranging from 1 to 5 here) for month x ; l x is the corresponding raw NTL; and y is the number of months (y = 67 in our study). The lowest median RMSE occurred with the filter order of 1 (Figure 4), and, therefore, this filter order was used throughout this study.

3.2. Change Detection

To capture sudden changes in NTL time series, a method called Automated Valley Detection (AVD) was developed by adapting from a peak detection algorithm [37]. The idea is to identify extrema by using a moving average and then to detect outliers beyond the deviation of the moving average. Three parameters, lag, threshold, and influence, need to be determined when employing this method. Lag (L) refers to the moving window size for change detection, which specifies the number of points used to calculate the mean and deviation each time. Threshold (T) determines the boundary beyond which extrema are identified. With a range from 0 to 1, influence (I) controls whether a new datapoint is affected by the previous observations. When it is zero, it suggests that the signal is not influenced completely by the past signal. Although it is the most robust option, the influence at 0 is not suitable for non-stationary data (e.g., the NTL time series used in this study). Median and median absolute deviation (MAD) replaced mean and standard deviation to identify extrema, as they are likely to be more resilient to outliers and make the algorithm less restrictive [38]. In this study, aggregated NTL values were taken as input, and the algorithm derived a vector y consisting of “0” or “−1”. The former indicates non extrema while the latter represents local minimums (a valley of the curve). The vector is derived via the following equations [39]:
s x ¯ = 1 L * x x + L s x       σ s x = x x + l ( s x s x ¯ ) 2 L 1
s x = I * l x + 1 I * s x 1       z x = l x s ¯ x 1 σ s x 1
T = c o n s t a n t       a x = 0 ,     i f   z x < T 1 ,     i f   z x T
where s x represents the value adjusted by influence for month x . Sensitivity analyses were conducted to decide lag and threshold. For the lag selection, we tested results with three different sizes of moving window (i.e., 12, 24, and 36 months). A sensible threshold was determined by performing 11 trials using thresholds ranging from 1 to 3 with an increment of 0.2. Then, by comparing estimations from various thresholds to the official outage duration, the optimal threshold was decided. The influence did not greatly change the results with NTL time series data, according to our pilot experiments. Thus, we adopted an influence of 0.5 in the analysis. With the selected parameters from sensitivity analyses, we then identified the valley signals of each census tract.

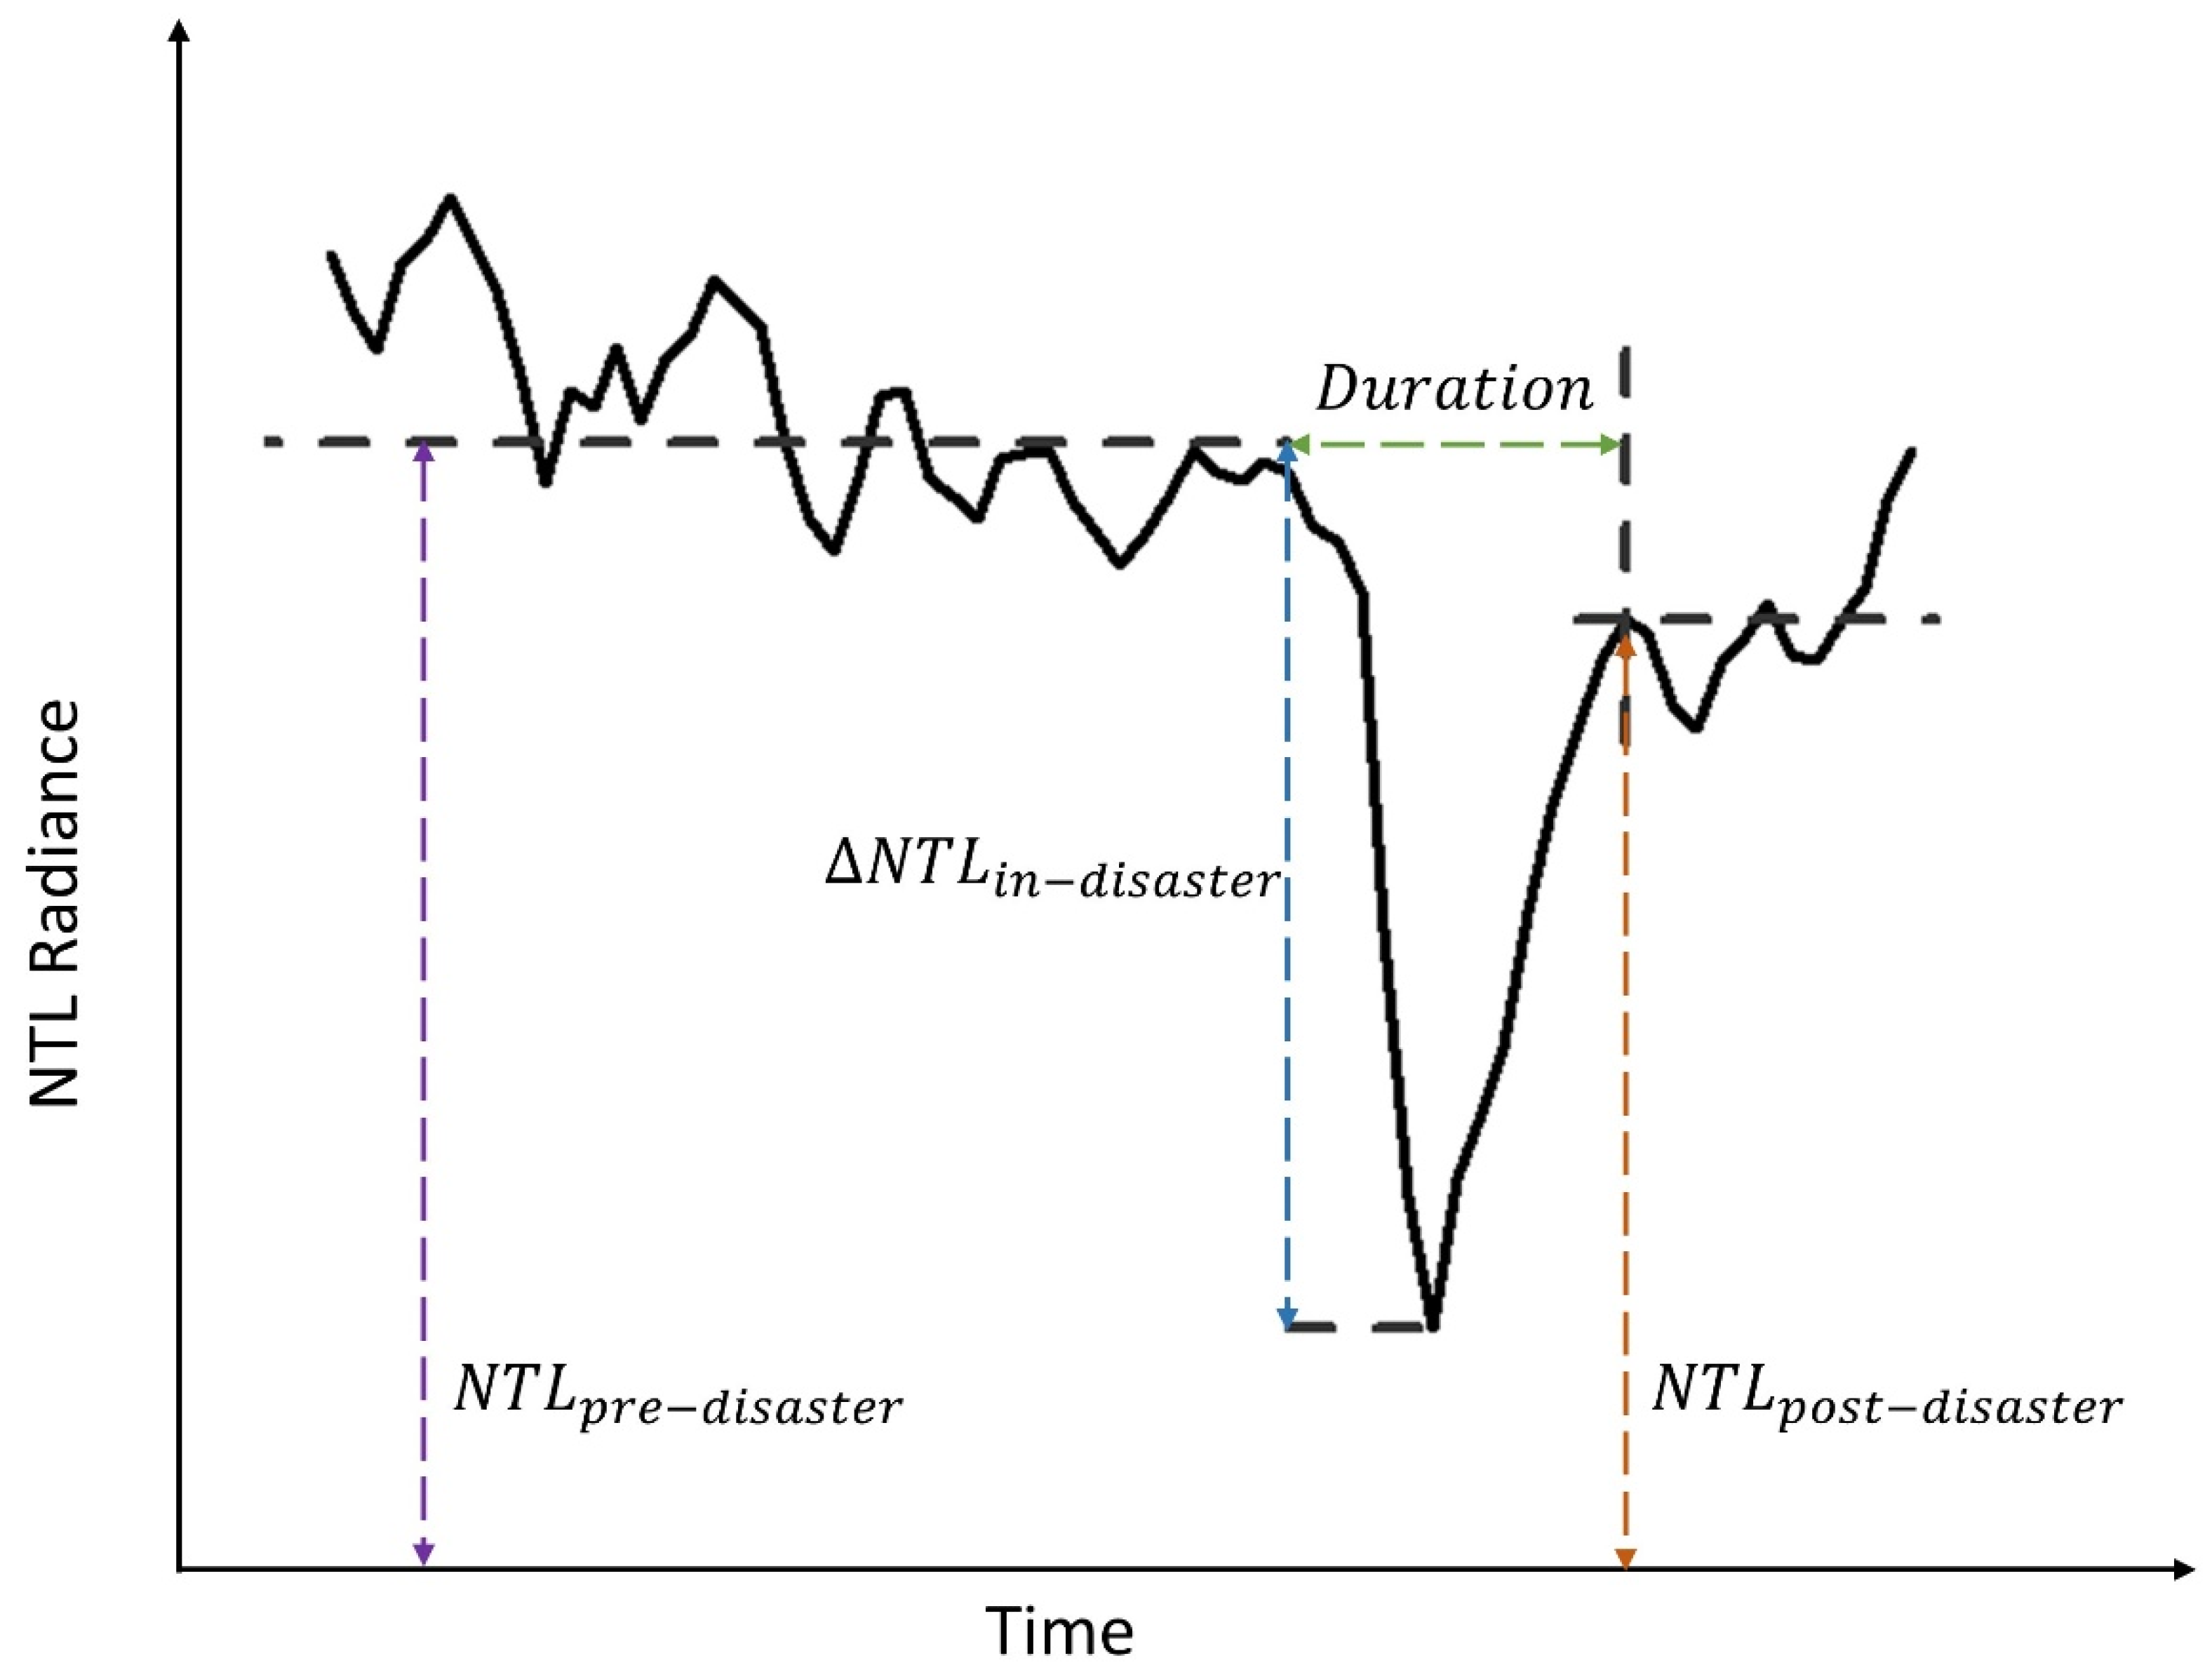
3.3. CDI Metrics Derivation

Three CDIs, outage and recovery duration, damage degree, and recovery level, were estimated based on the recognized valley. These three metrics and their relationships are illustrated in Figure 5. Outage duration is defined as the time interval between the onset and the end of the power outage, represented by the width of the identified valley (the green line in Figure 5). Damage degree refers to the percentage of power lost during a disaster. Recovery level characterizes the percentage of power recovered from a disaster, reflected by changes in NTL intensity and the proportion of customers with power when the electric grid recovers.
Estimations of the damage and recovery degrees rely on the determination of the pre- and post-disaster levels. Instead of using a simple average, a weighted average was adopted to characterize a more similar NTL value in a closer month. That said, when deciding the pre-disaster general NTL level, the weights of months closer to the onset of the hurricane (i.e., September 2017 in our case) are higher during the pre-disaster period. Similarly, when calculating the post-disaster general NTL level, post-disaster months that are further away from the end of the outage are given a heavier weight than the months that are right after the end of the outage. That is, July 2019, the last month in our data, being the furthest month from the end of the outage, was given the highest weight. The pre- and post-disaster general radiance levels were calculated following Equations (6) and (7), respectively.
M p r e d i s a s t e r = 1 y P x l ^ x 1 N P x   ( w h e r e   P x = 1 i s )
M p o s t d i s a s t e r = 1 y Q x l ^ x 1 y Q x   ( w h e r e   Q x = 1 i t )
where P x and Q x are the weight in month x during pre- and post-disaster periods, respectively, s represents the last month in the pre-disaster period, and t is the end of month (t = 67 in our analysis).
After deriving the pre- and post-disaster brightness levels, the degree of damage ( D ) was calculated as the ratio of the decrease in radiance (i.e., the difference between the pre-disaster level and the lowest radiance during the disaster corresponding to the blue line in Figure 5) to the pre-disaster average radiance (the purple line in Figure 5; Equation (8)).
D = M p r e d i s a s t e r M i n i n d i s a s t e r M p r e d i s a s t e r
where M i n i n d i s a s t e r is the minimum radiance during the disaster period. Further, to investigate to what extent the degree of damage is associated with the level of hurricane threat, we quantified hurricane threat as averaged kernel density at the census tract level based on the hurricane path and category [40]. The Pearson correlation coefficient was employed to assess their relationship. The recovery level ( R ) was calculated as the ratio of the post-disaster average radiance (the brown line in Figure 5) to the pre-disaster average radiance (Equation (9)).
R = M p o s t d i s a s t e r M p r e d i s a s t e r * 100 %
To further quantify the recovery level, we also calculated the cumulative percentage of customers with power by multiplying the estimated recovery percentage and the number of occupied housing units based on the derived end of power outage.

3.4. Accuracy Assessment

The accuracy of the AVD-estimated disaster metrics was evaluated through comparison with publicly available official data for the whole island. The DOE weekly situation reports regarding Hurricane Maria were only available during the disaster from September 2017 to April 2018 [3]. After April 2018, the electricity system has largely been restored without further significant updates. Therefore, we used 7 months as the reference island-wide disaster duration for the evaluation. In addition, the derived outage recovery duration was also compared with the local news reports. We carefully examined local newspaper reports and made records when an expected month of power restoration was mentioned in any reports for a county. The outage duration in that county was then calculated as the difference between the month of the onset and the expected end of the power outage recovery. We then averaged modeled tract-level durations at the county level, which was compared with the reference duration stated in the reports for the corresponding county. Finally, the estimated cumulative percentage of customers with power was used for comparison with the reference situations reflected in the DOE reports to assess the accuracy of the recovery level.

4. Results

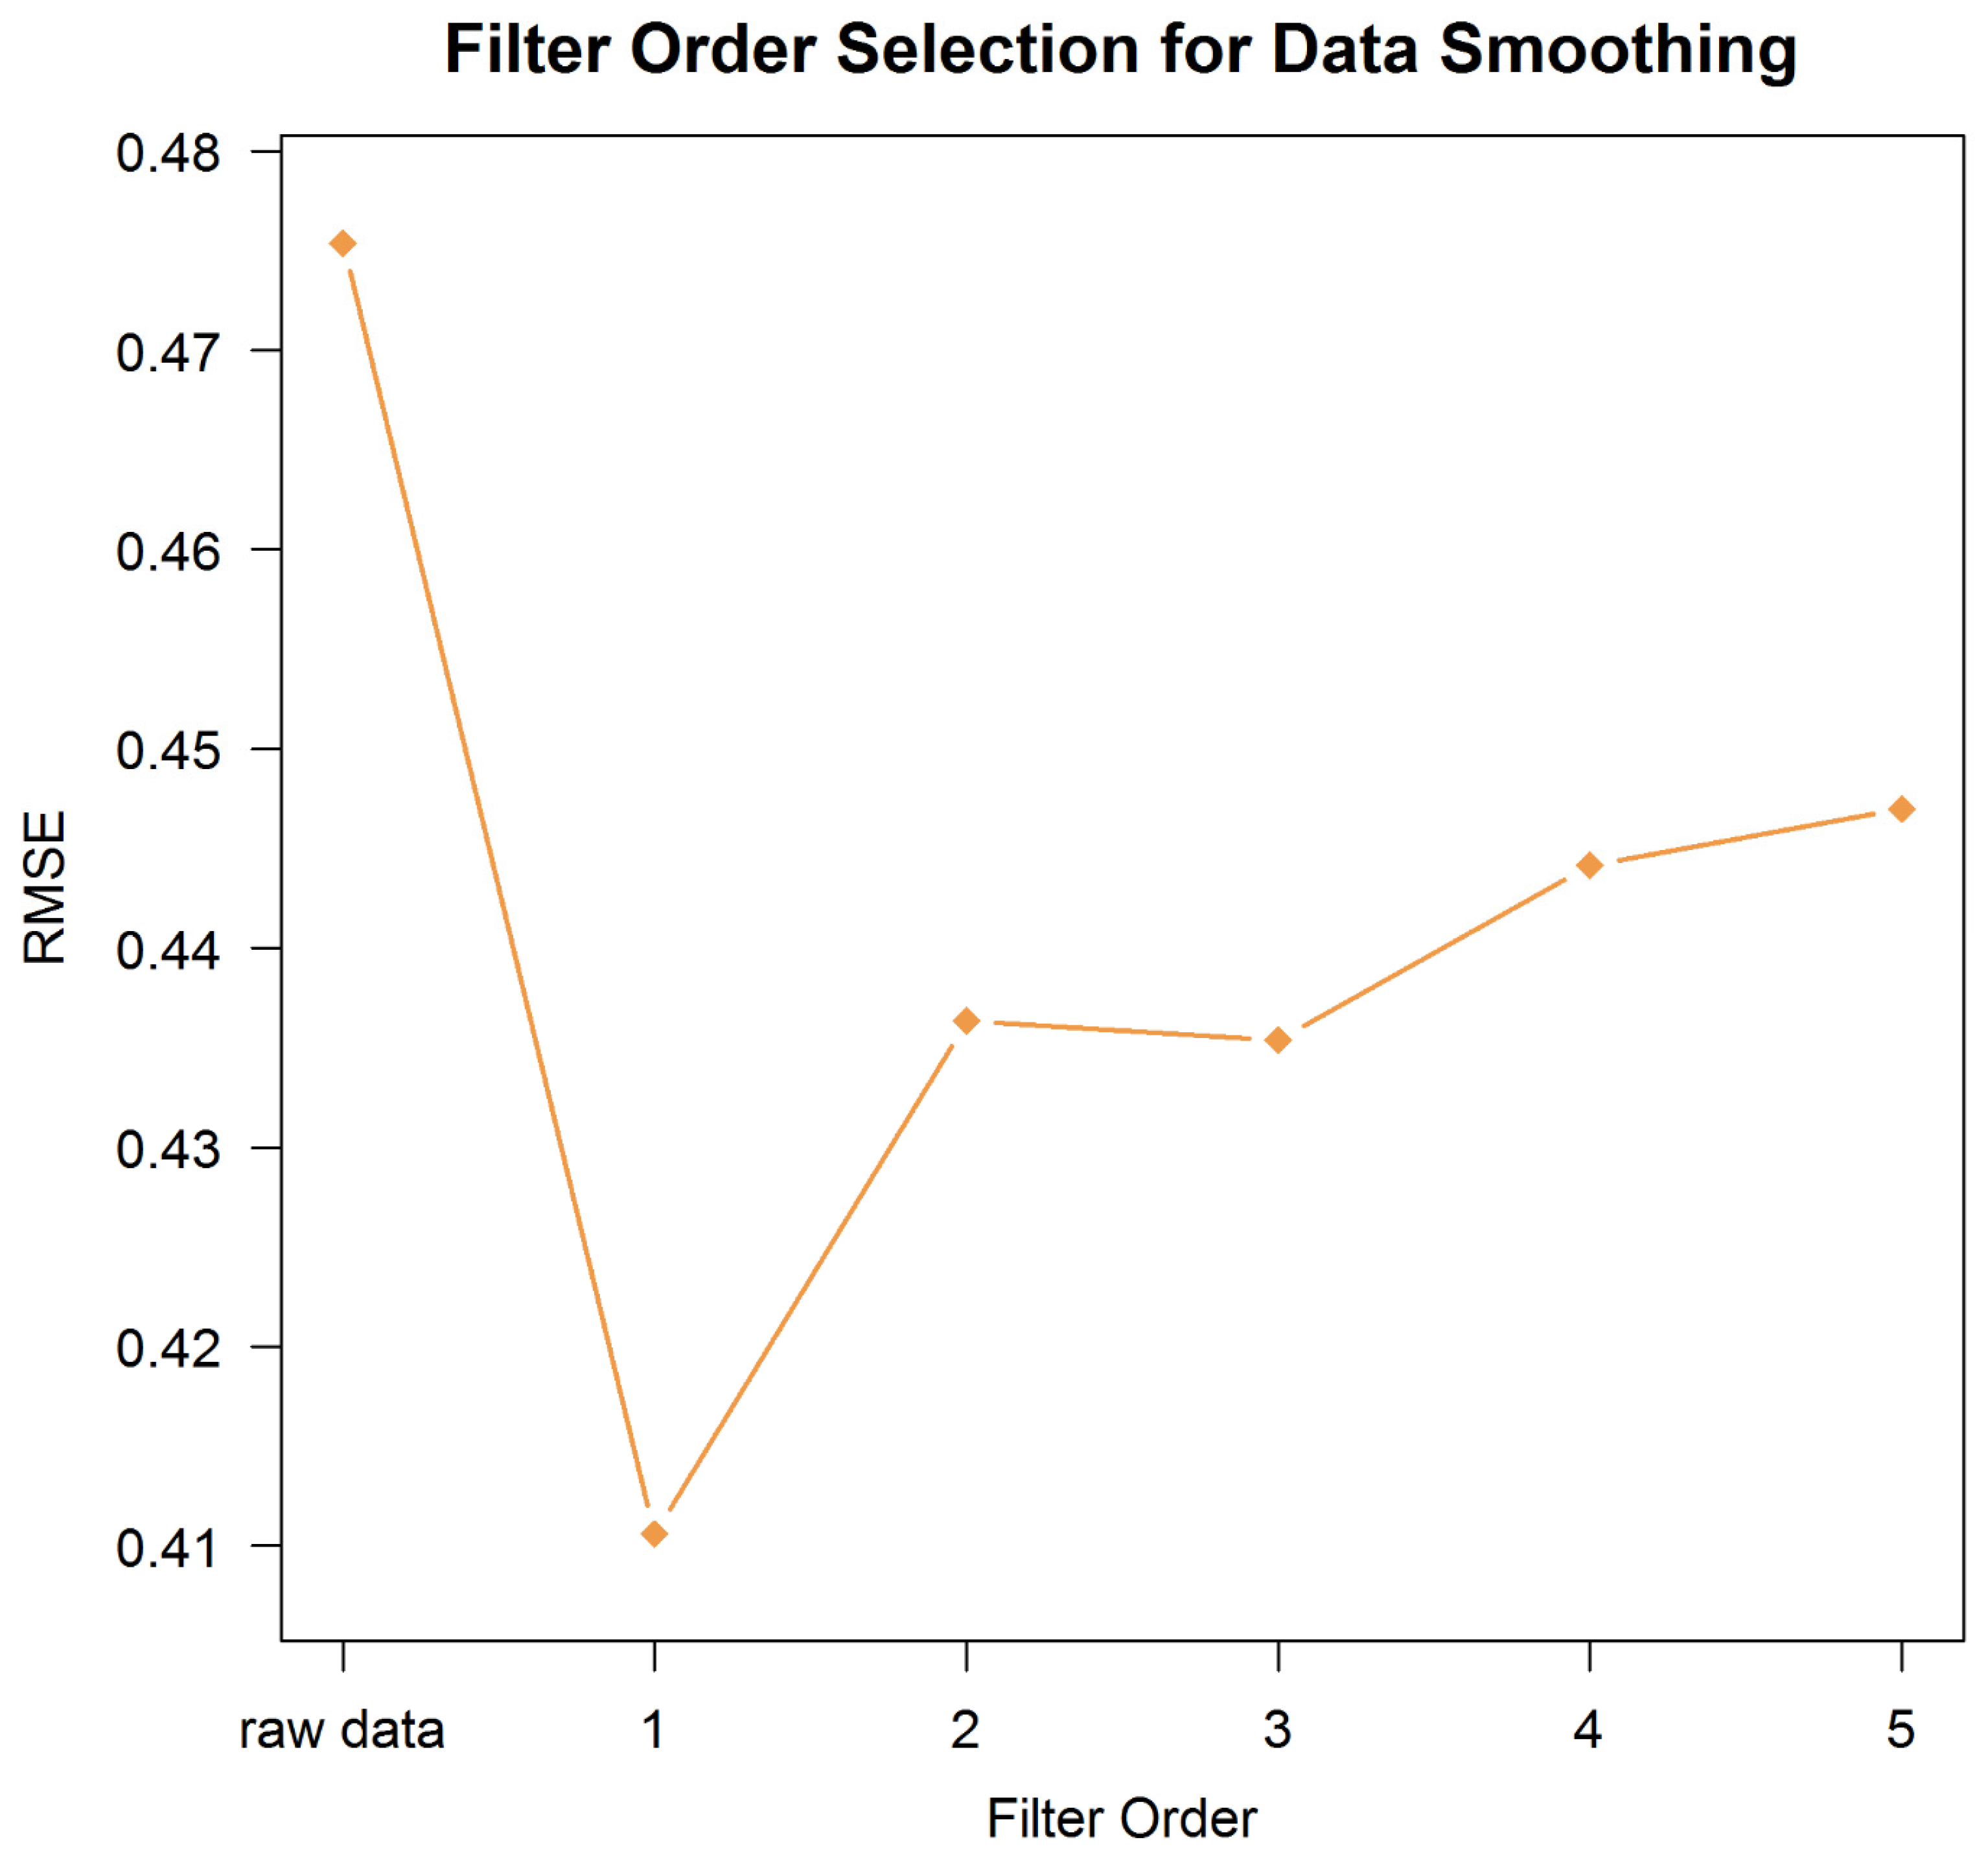
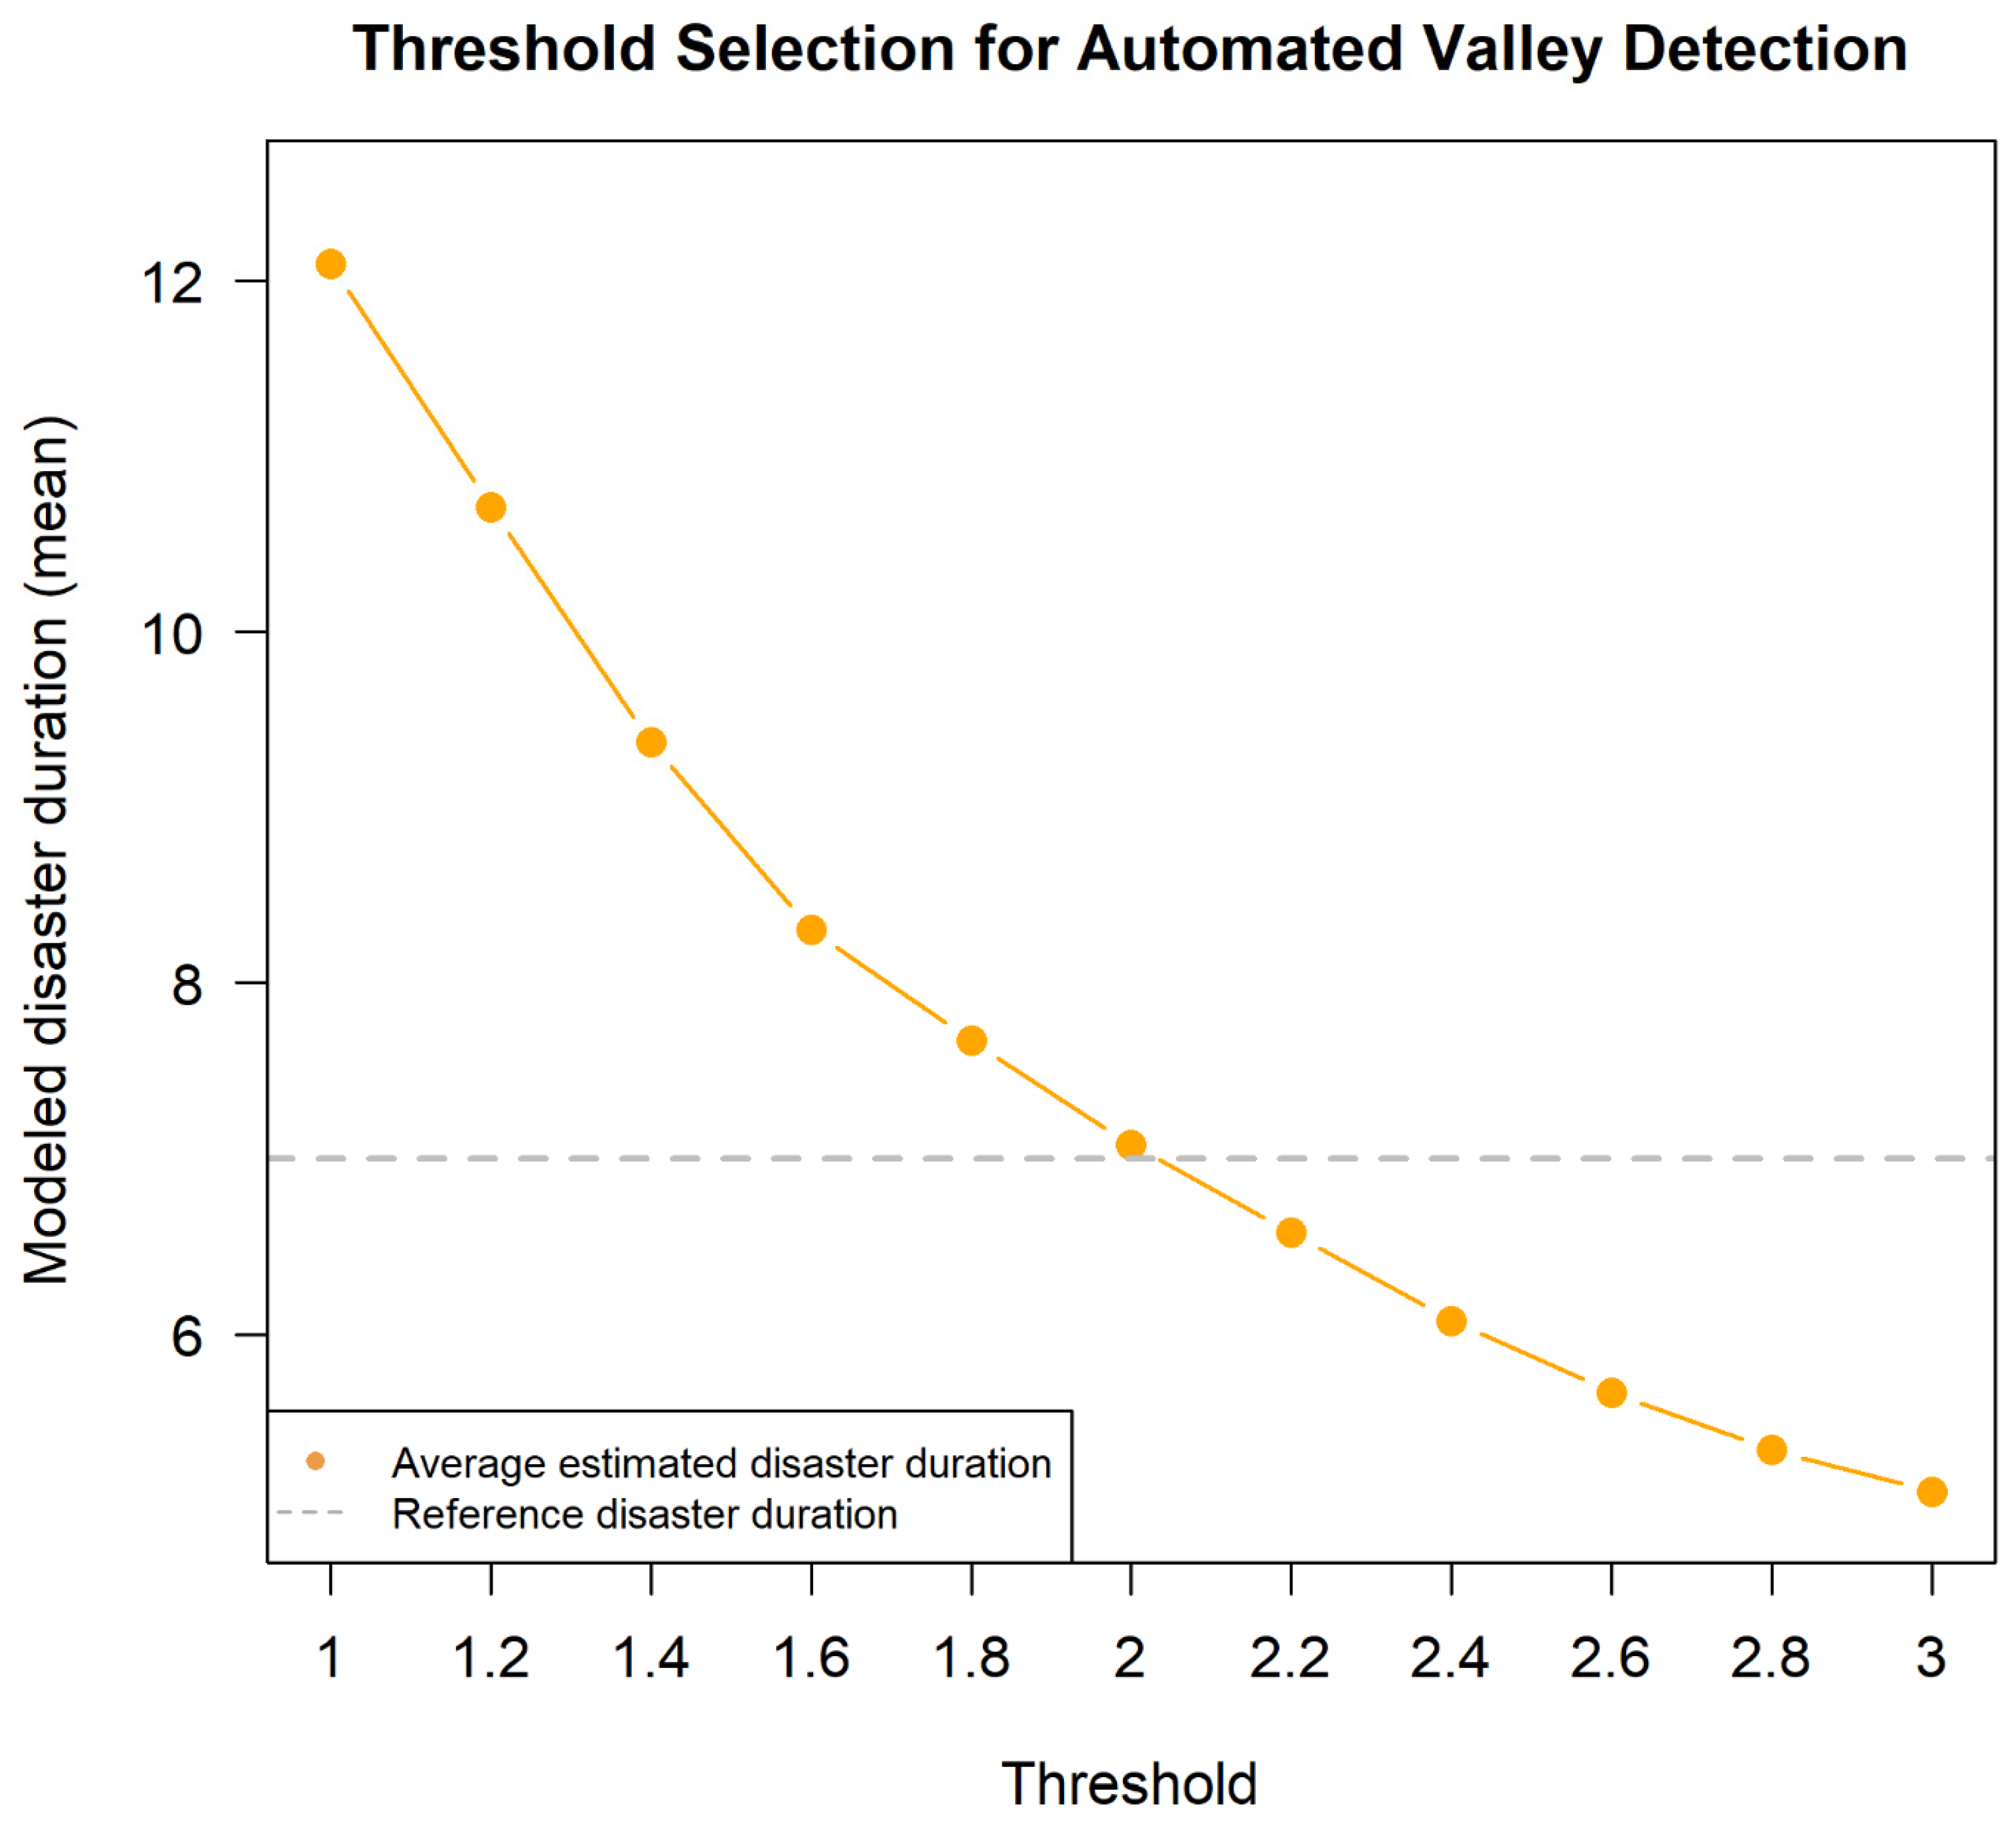
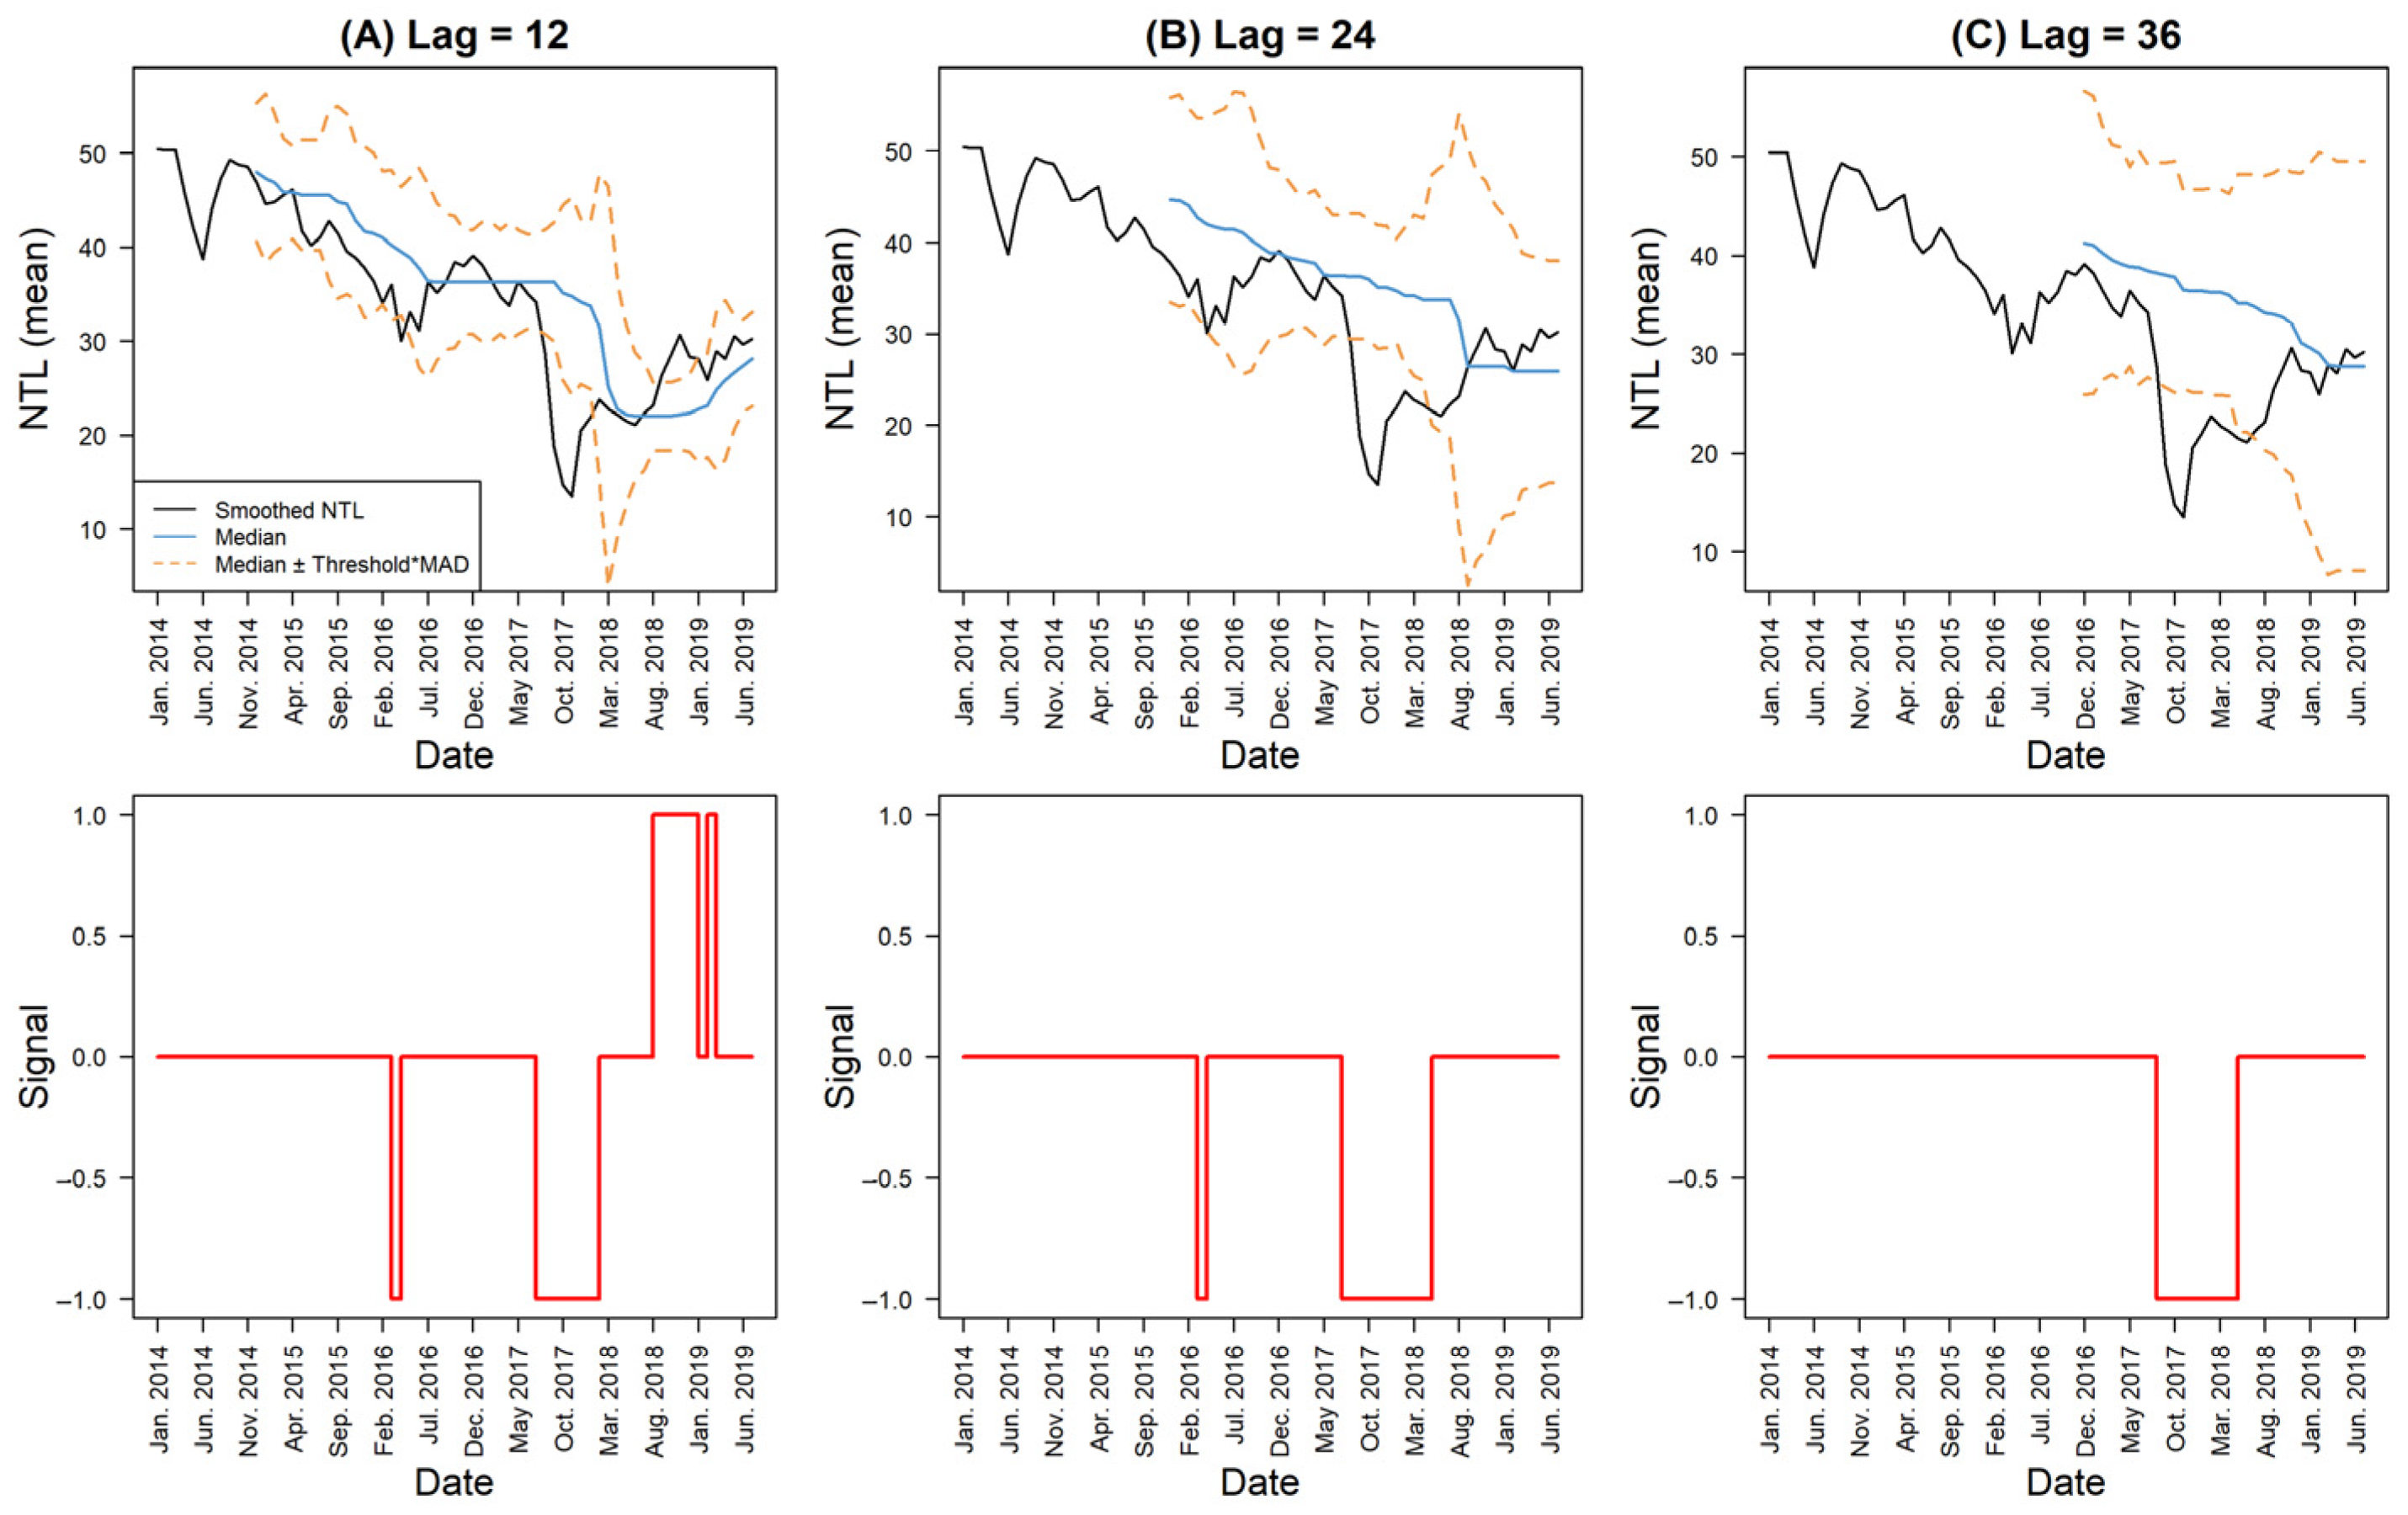
4.1. Selection of the Optimal Parameter Settings

With a lag of 36 and an influence of 0.5, different sets of AVD-estimated tract-level outage durations with thresholds ranging from 1 to 3 were aggregated to the entire island by averaging and comparing them with the reference disaster duration. We find that the mean of outage duration estimated from the model with a threshold of 2 best matches with the reference duration (Figure 6). To determine the moving window length (lag), an example with lags of 12, 24, and 36 is presented in Figure 7. It is observed that if the moving window size is too small, noises within the pre-disaster period are mistaken as change points (Figure 7A,B). They potentially affect the detection of the onset of the disaster event. Finally, we determined the AVD parameters as a lag of 36, a threshold of 2, and an influence of 0.5.

4.2. Results of the Three CDIs

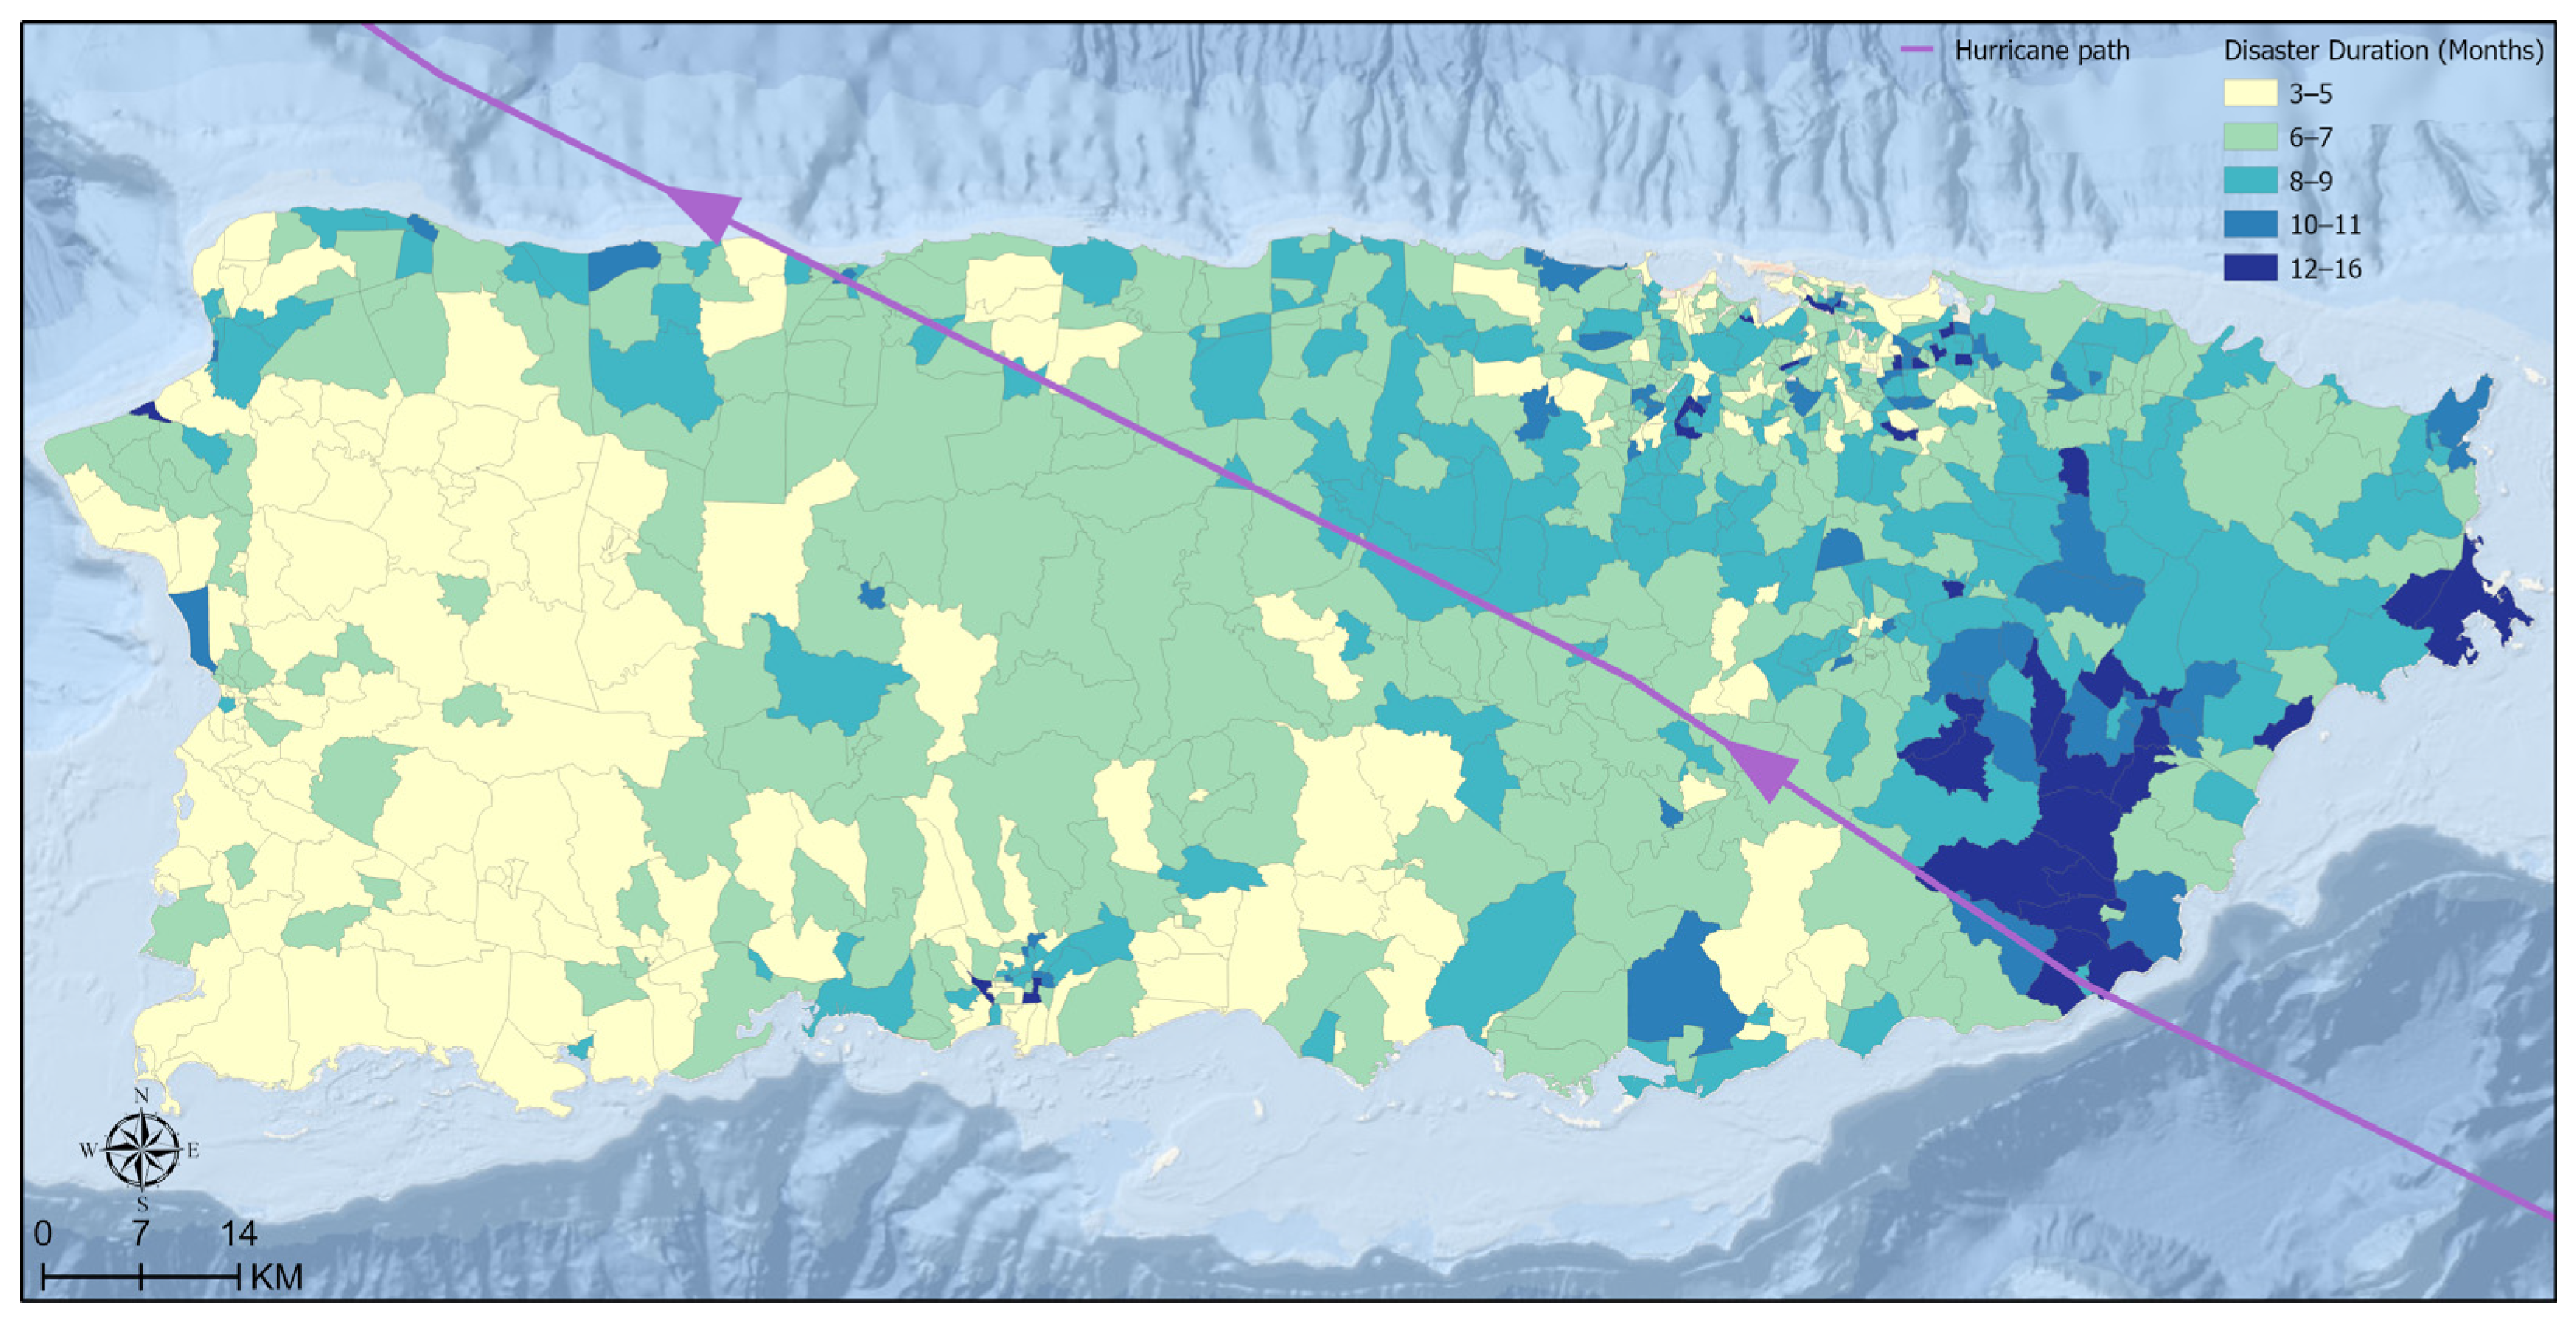
4.2.1. Results of Outage Duration

With the selected parameters, the AVD-estimated outage duration is first visually compared with the local knowledge. Southeast Puerto Rico was first hit by the storm and affected the most severely, and thus this region tended to experience the longest power outage relative to other regions [3,31]. Such a pattern is accurately captured by our results (Figure 8). Amongst all census tracts, approximate outage durations range from 3 to 16 months (Figure 9). Most of them recover within eight months. The average disaster duration of all tracts shown as the red vertical dashed line is almost the same as the reference duration from the DOE (gray dashed line).
Regarding the reference outage duration from local news reports, for example, the following description was extracted from a report about electricity recovery after Hurricane Maria in Humacao County:
“Los portavoces de la marcha resaltaron que a más de seis meses del paso del Huracán María, aún la mayoría del sureste de la Isla, sigue sin el servicio de energía eléctrica”.
(Direct quote of a news report on 21 March 2018, [41])
“Leaders from the march stressed that more than six months after the passage of Hurricane Maria, even the majority of the southeast of the Island, is still without the electric power service”.
(Translated)
Based on the description, the reference outage duration of Humacao County is greater than six months. As such, we find that the expected month of power restoration was mentioned in local news reports for ten counties. Their corresponding duration estimates are reported in Table 1. Regardless of regions, estimated results from AVD are consistent with the duration reported in the local news reports.

4.2.2. Result of the Degree of Damage

In terms of the damage degree to the electricity system, it can be observed that eastern Puerto Rico experienced severe blackouts, as shown in a dark purple color (Figure 10A). Some tracts lost over 80% light intensity, principally located in the southeastern region, while southwestern areas experienced less damage. This is mainly related to the varying hurricane threat across the entire island (Figure 10B), which is positively associated with the estimated damage degree, with a correlation coefficient of 0.47 (Figure 11). The noteworthy mismatch between the damage level and the hurricane threat usually occurs in western and northwestern areas (Figure 10). Specifically, some tracts here experienced a high damage level while their hurricane threat was slighter, which may be related to the local resilience to disaster risk. For example, the damage degree in large cities is usually lower than in their neighboring areas (e.g., Mayagüez). This can be explained by better resilience to natural disasters in major cities. They are more likely to have systematic and efficient disaster management, improved urban infrastructure, and high economic competitiveness. On the contrary, suburban areas tend to have low capabilities to respond to emergency and aging electricity systems, which possibly results in severe power outages.

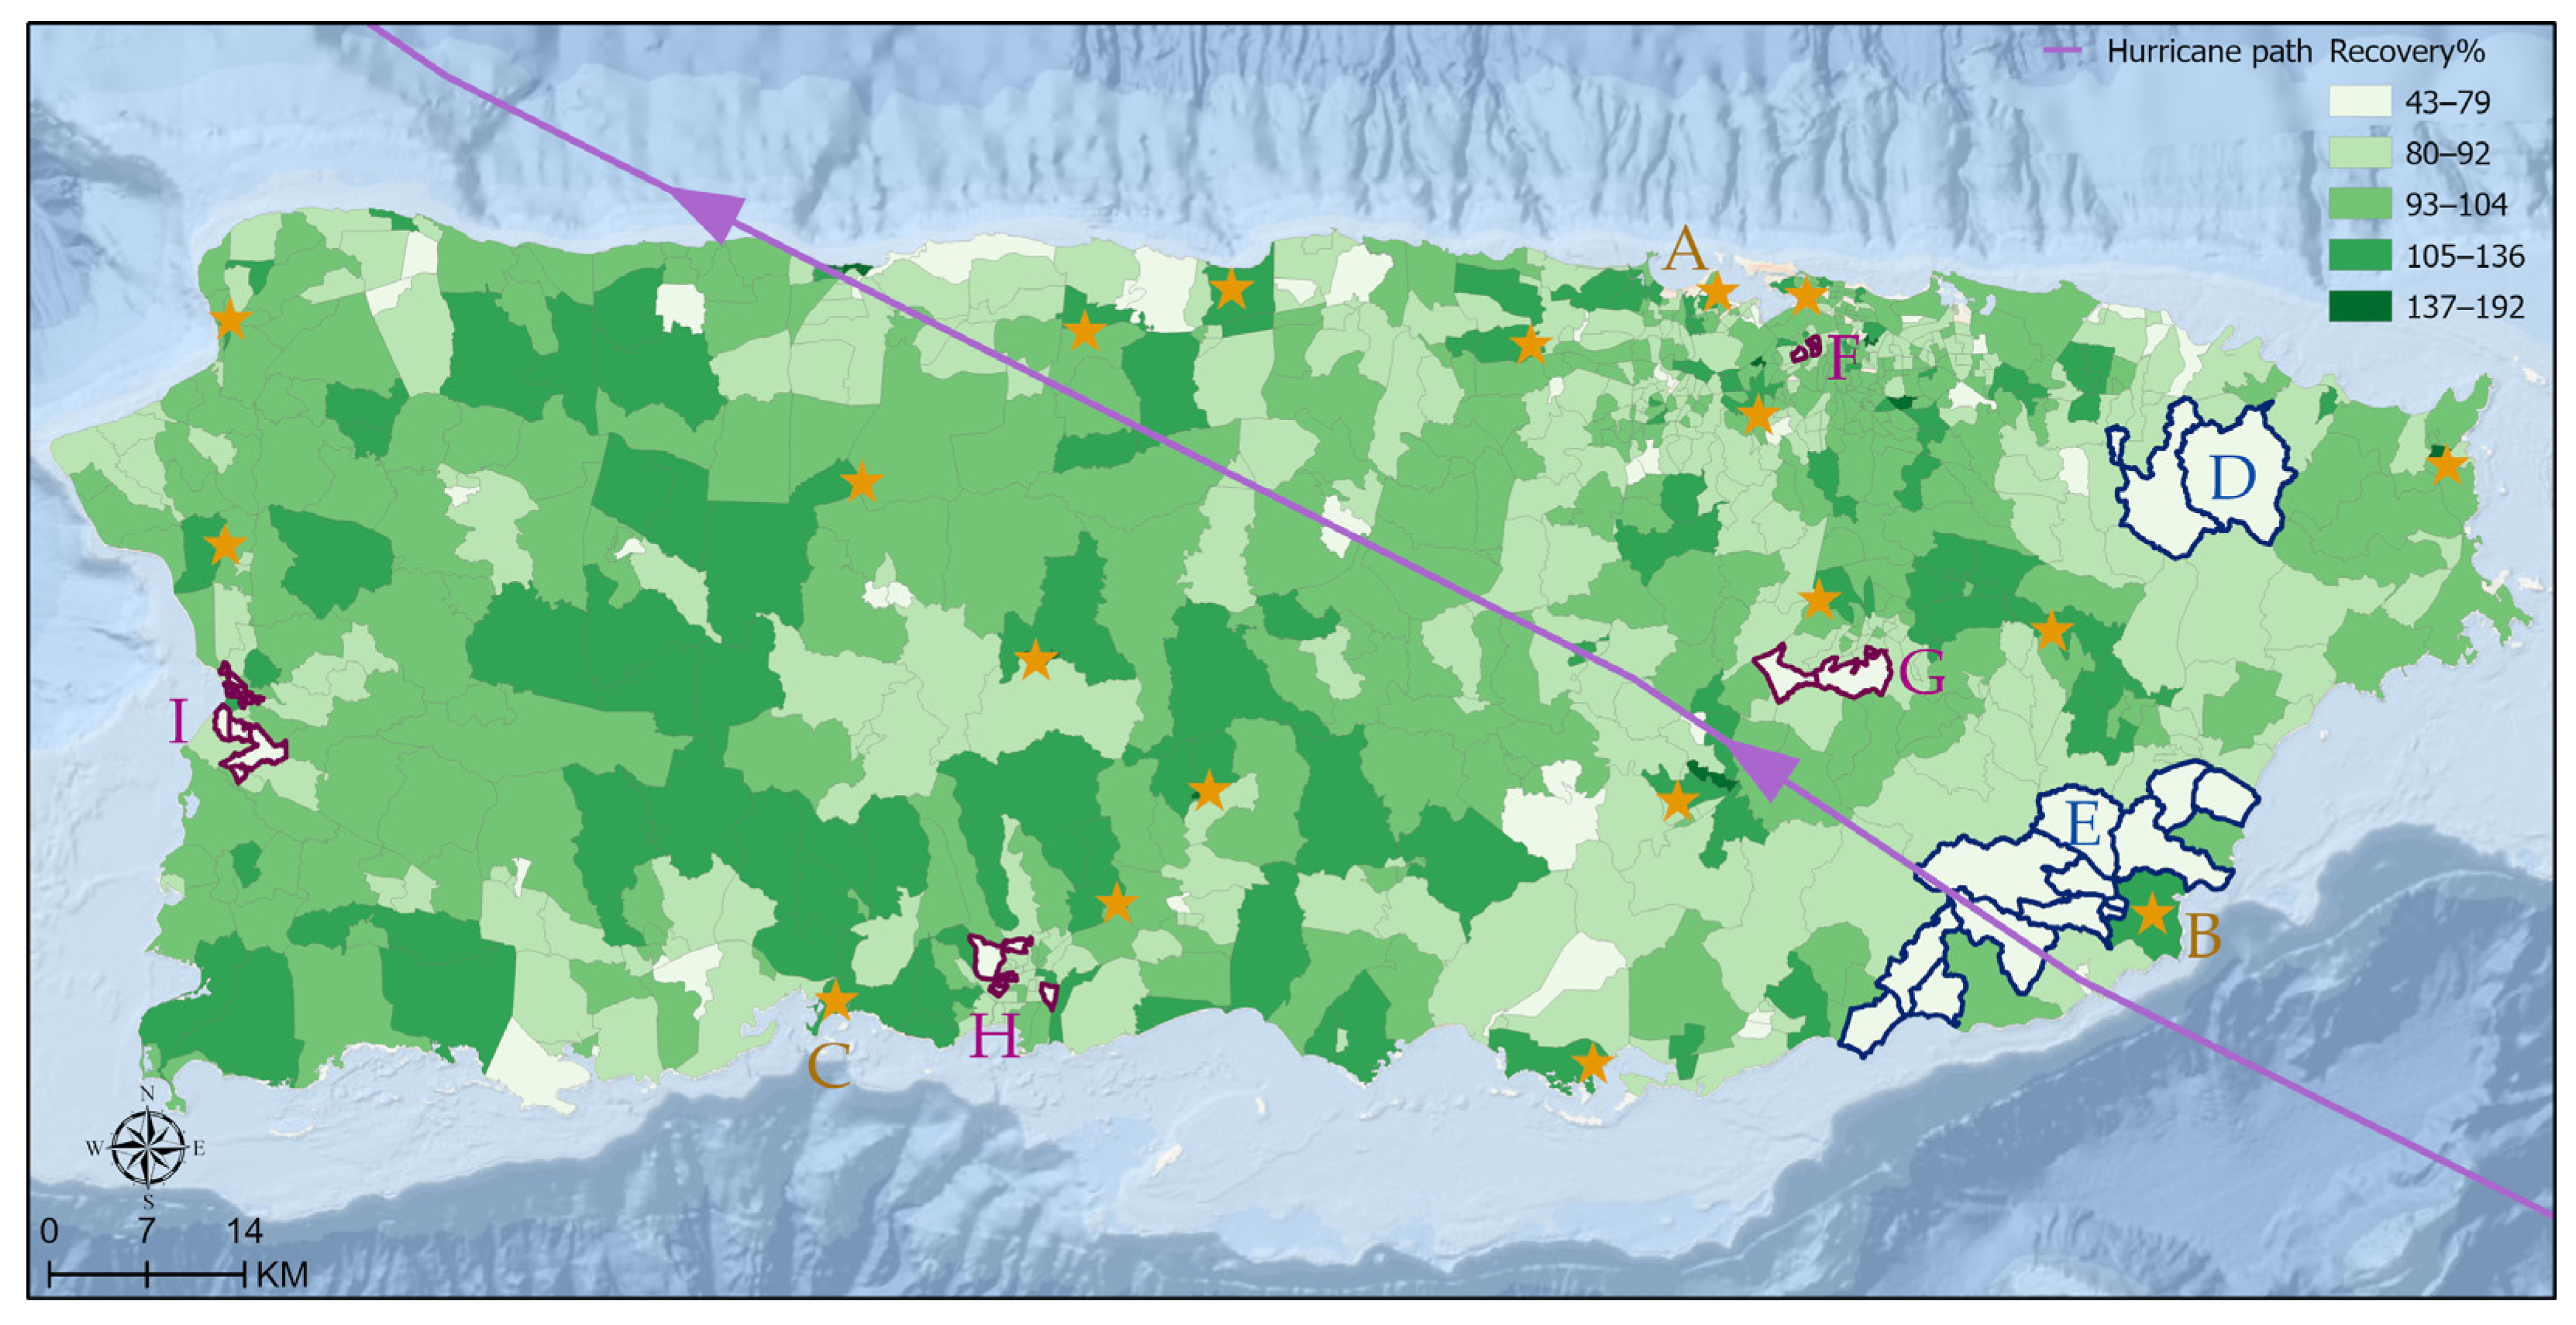
4.2.3. Result of the Degree of Recovery

As of July 2019, more than 90% of the tracts in Puerto Rico recovered to at least 90% of the pre-disaster level (Figure 12). These tracts are usually located in central and western Puerto Rico. In particular, a few tracts have a recovery level greater than 100% (shown as dark green in Figure 12), indicating their NTL radiance becomes brighter than the pre-disaster level. The raw NTL radiance profile of sample tracts with a brighter post-disaster level is highlighted in Figure 13A–C. The potential reasons are threefold. First, a number of key power plants are located in these tracts, shown as orange stars in Figure 12. The brighter light may be originated from the ongoing repair or maintenance on these key power plants. Second, the newly replaced lights may be much brighter than the old ones that have been damaged during the disaster. Third, many trees fell when the hurricane hit. With fewer obstructions from leaves due to the fallen trees, even when lights recover to the same level as that before the disaster, lights may become more exposed than before.
On the other hand, for some tracts, it was observed that their post-disaster light intensity is lower than the pre-disaster levels (Figure 12 and Figure 13D–I). They can be categorized into two groups. The first is those in the eastern region located on or near the path of the hurricane; on average, their radiances are at least 75% lower than the pre-disaster level (points D and E in Figure 12, respectively). This is likely caused by the damaged power plants and transmission lines to these areas during the hurricane, making it difficult to regain the pre-disaster brightness level. The second category is those suburban tracts with bold purple boundaries highlighted in Figure 12 that are found near certain large cities, including San Juan, Caguas, Ponce, and Mayagüez (points F–I in Figure 12, respectively). There are three possible reasons. First, although large cities have sufficient public resources, high-quality urban infrastructure, and disaster response systems, not all people can recover quickly from a disastrous event [46]. Those suburban tracts may need more resources to fully rebound to pre-disaster levels. Second, individuals are likely to migrate to urban areas or off-island after the hurricane [47]. The decreasing population probably results in lower light intensity. Third, building damage may also lead to a decrease in NTL intensity. The rebuilding process should be a long-term project.
In addition to the comparison of NTL intensity before and after Hurricane Maria, the cumulative proportion of customers who have recovered from the power outage is also used to quantify the recovery level. Approximately 93% of customers are with power (the green line in Figure 14) until the estimated end of the power outage for all tracts (December 2018 in our study). The estimated percentage is largely consistent with the reference percentage (the gray line in Figure 14) [3]. However, a notable difference is that the estimated percentage is always lower than the reference one, particularly at the beginning of the recovery period (i.e., from October 2017 to January 2018). This is largely caused by different data sources. NTL data mainly capture outdoor lighting (e.g., streetlights and traffic), while the reference information collected by PREPA includes electricity consumption in multiple sectors (e.g., residential, commercial, and industrial). Even though NTL is found to be significantly associated with electric power consumption [18,48], the detected light is a part of the sources of electricity consumption. This likely results in underestimation all over the time. Moreover, the estimated percentage of customers with power is calculated based on the number of occupied housing units from Census data. It largely focuses on the residential sector. However, hospitals and other required public facilities usually recovered from the power outage first. It possibly leads to an underestimation during the first several months.

5. Discussion

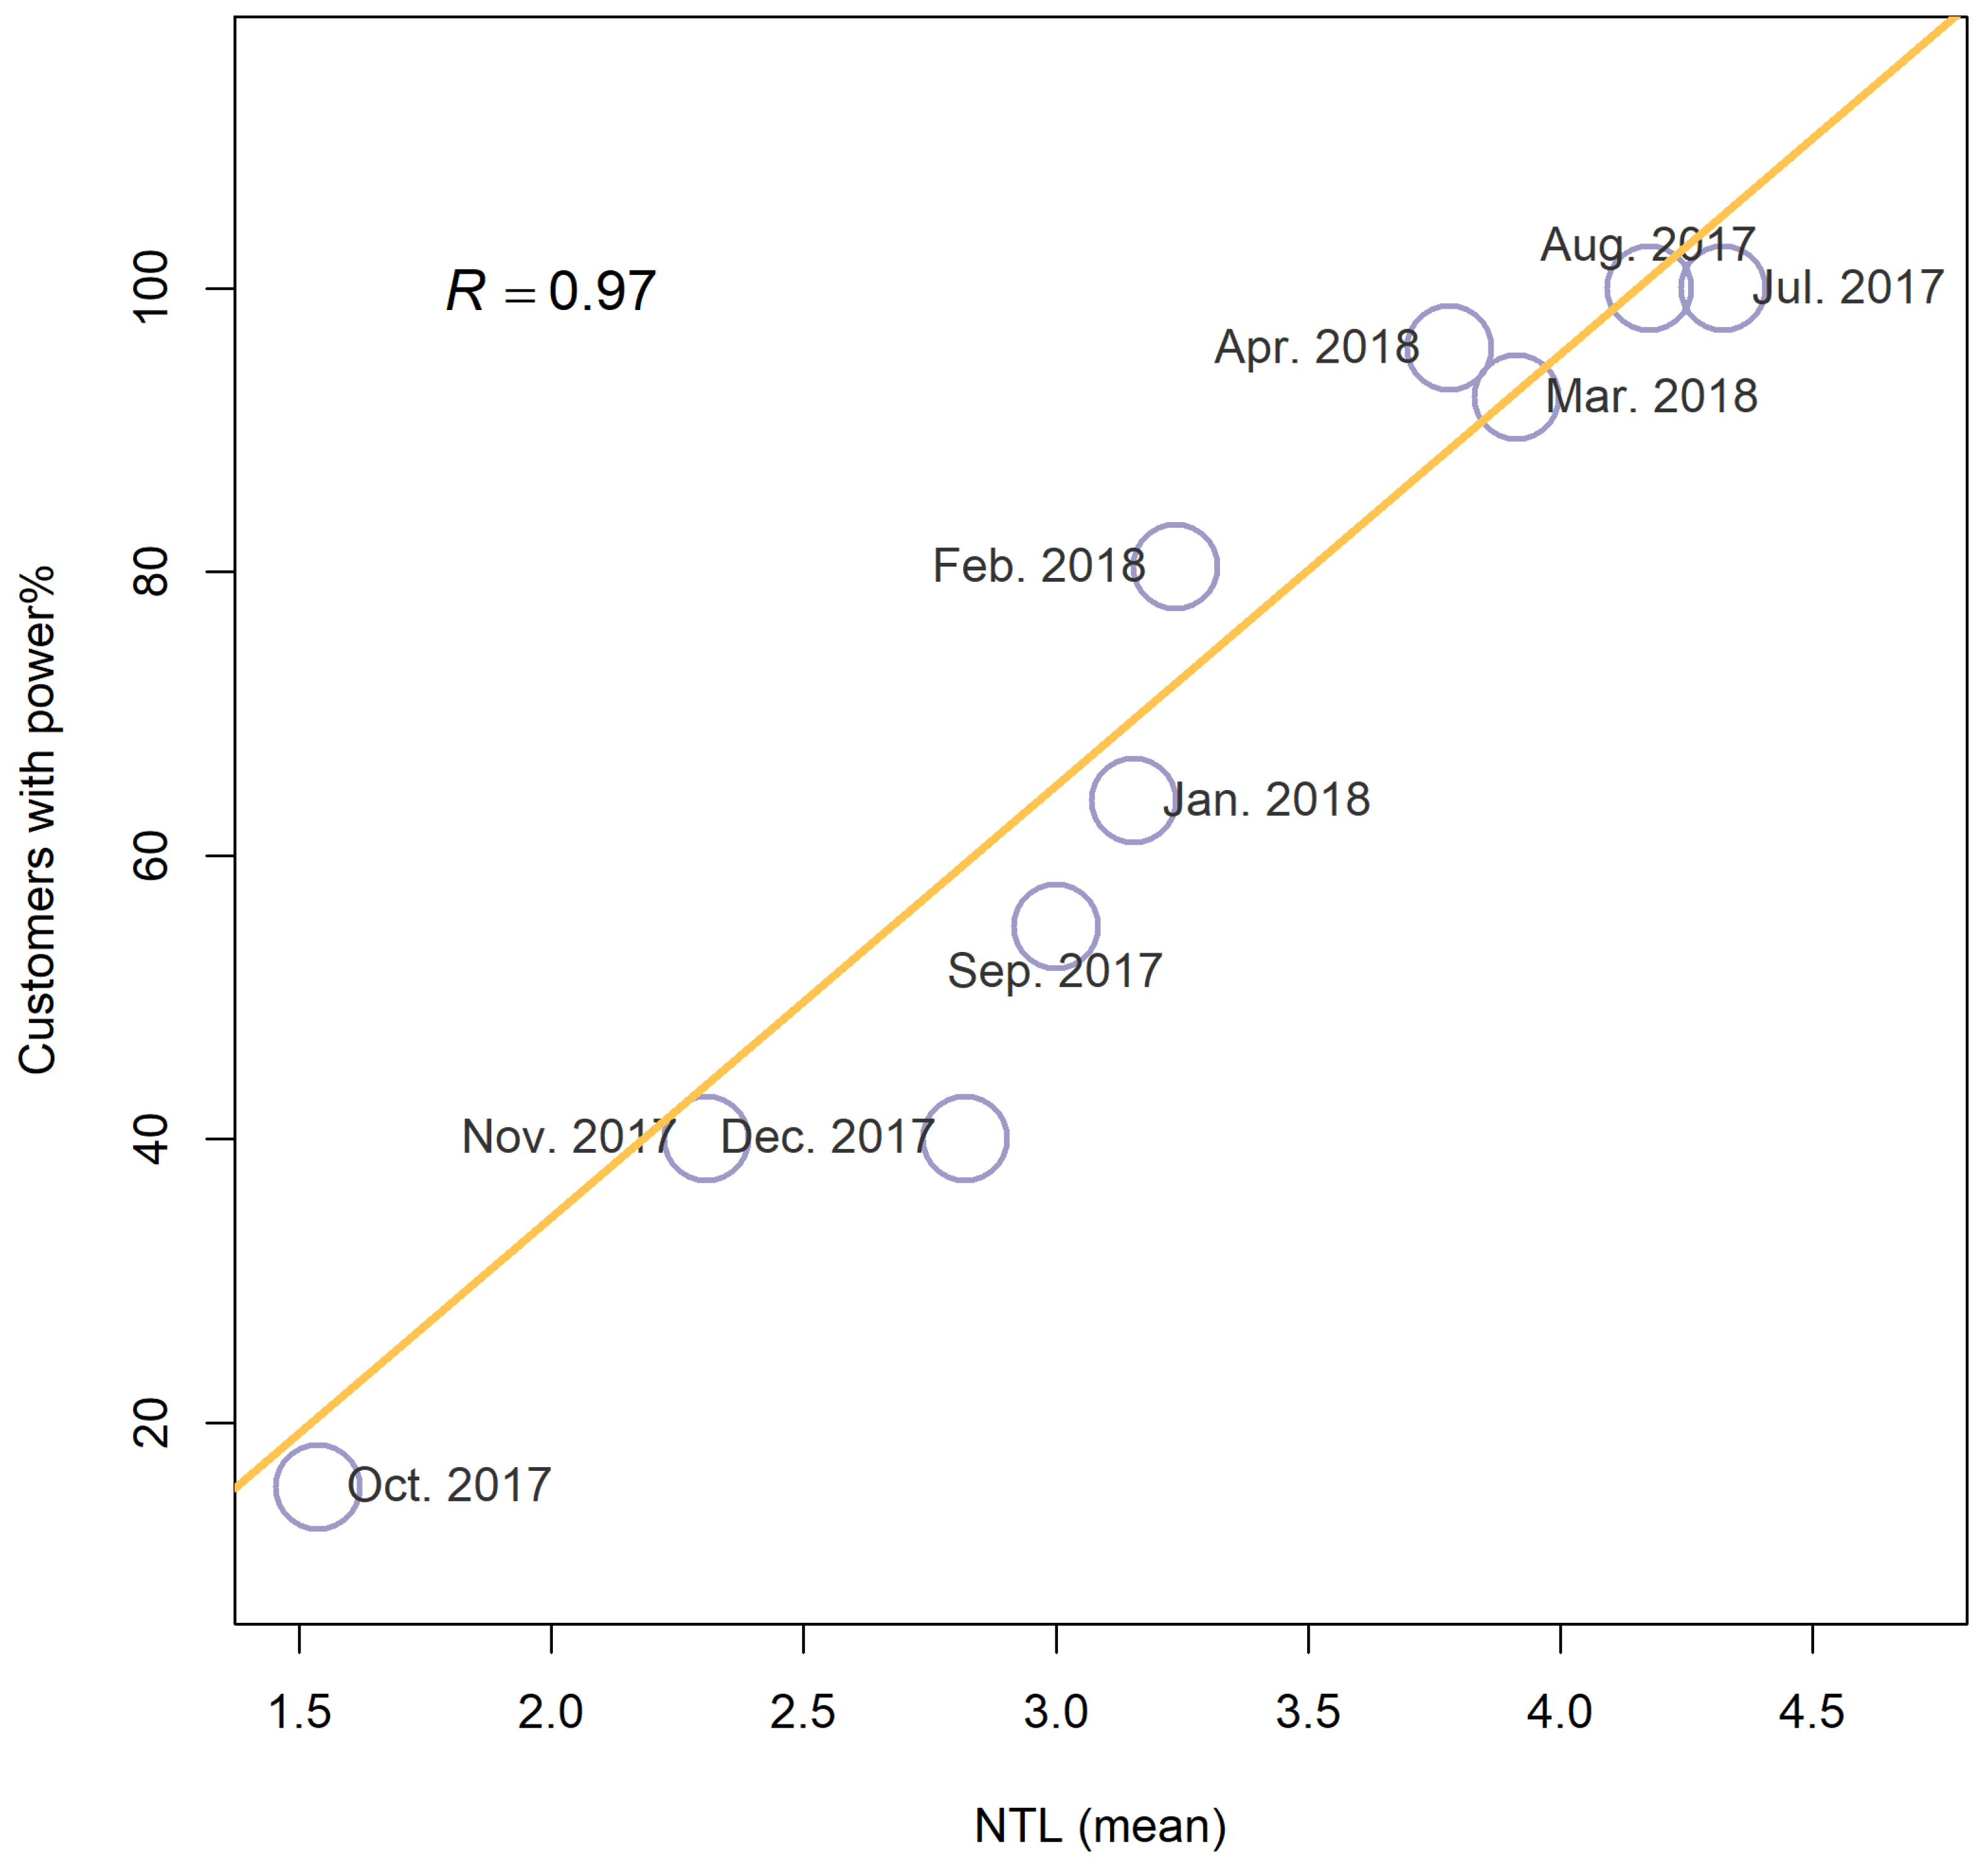
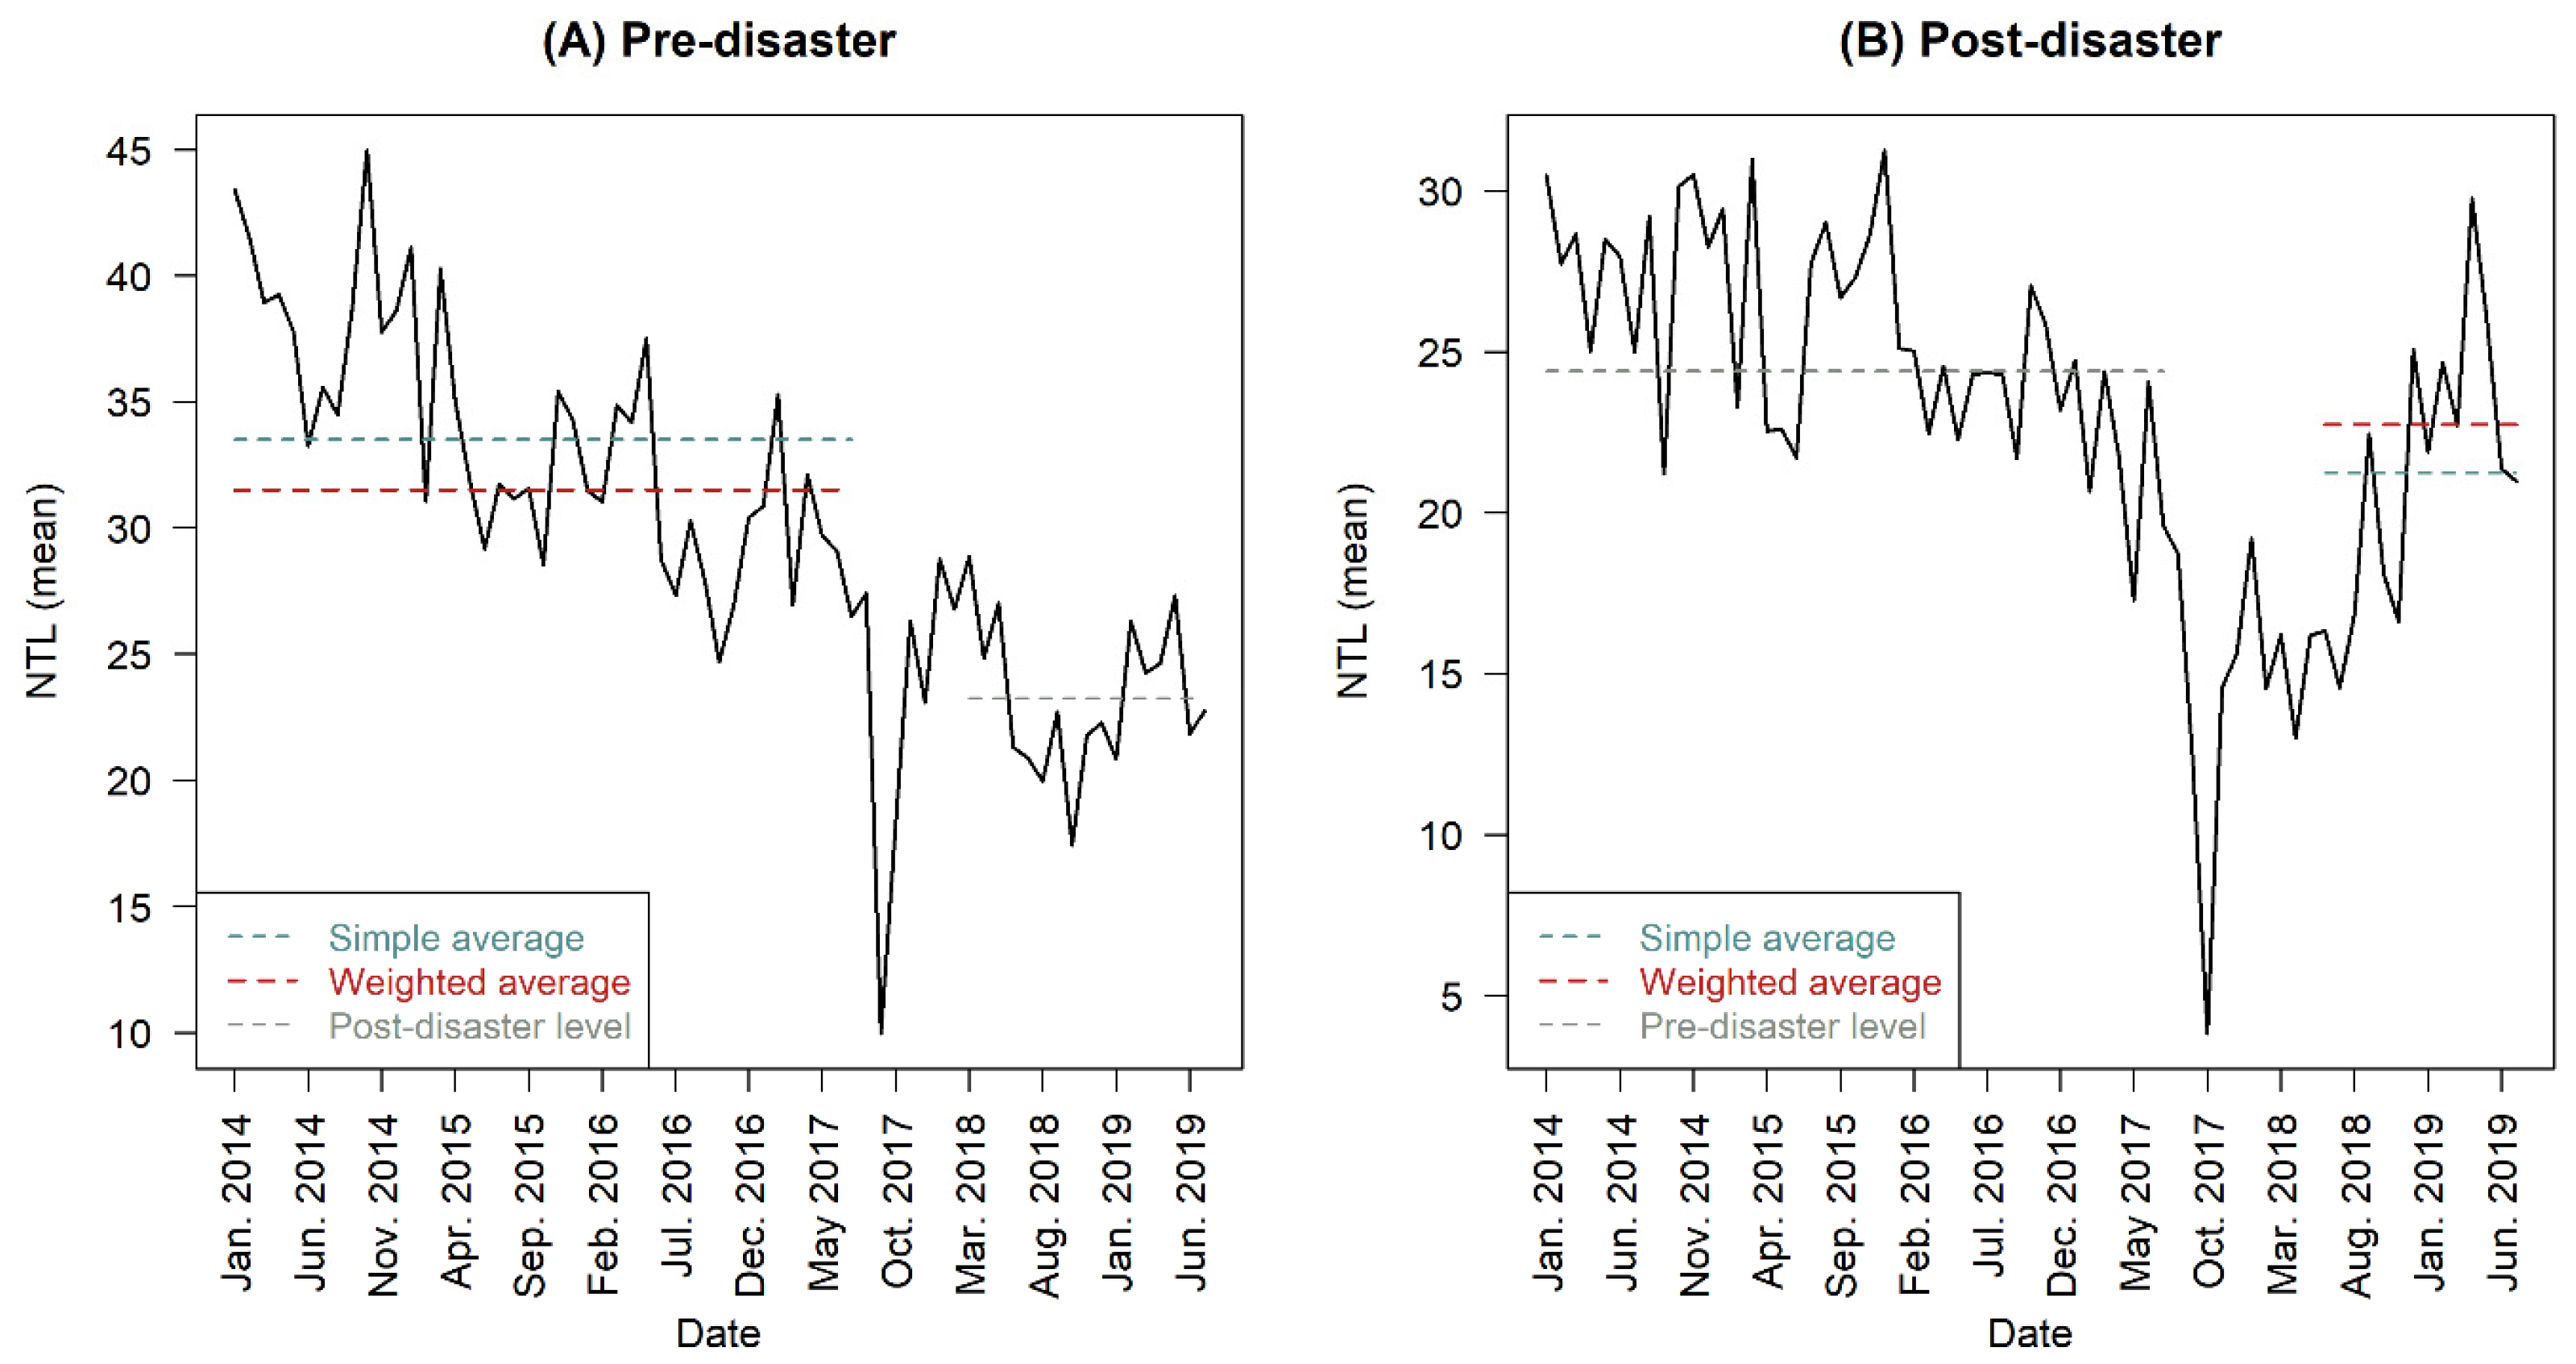
5.1. Temporally Weighted Average

To determine pre-disaster general NTL intensity, previous studies usually calculated a simple average of pre-event NTL radiances [9,25,27]. However, the simple average may not be appropriate when data have long-term increasing/decreasing trends. Reflected by NTL data, long-term city light dynamics usually exist, possibly due to changes in population and economic activities [49,50]. Particularly, Puerto Rico experienced a population decline, and hence, the electricity demand and consumption in all sectors decreased during the previous decade [30,51]. These facts tend to cause a long-term declining trend in nighttime light. To take such a pattern into account, we employed a temporally weighted average, which can characterize the similarity from a closer time avoiding estimated errors from NTL dynamics over time. As an example, declining pre-disaster light intensity is shown in Figure 15A. It can be observed that the simple average (blue dashed line) overestimates the pre-disaster night light level, which potentially further causes inaccuracy in the following disaster metric estimations, such as more severe damage degree or worse recovery level.
With respect to the post-disaster general brightness level, although we determine the end of power outages when the NTL intensity goes back to a steady level, the brightness may continuously increase because of the long-term recovery (Figure 15B), particularly after a severe natural disaster [52]. Therefore, the post-disaster general NTL level obtained from the weighted average (red dashed line) is likely to be more accurate in assessing the restoration situation.

5.2. Extensions on Critical Disaster Indicator Estimate

Most studies regarding outage detection in a natural disaster only delineated the extent of affected areas and simply evaluated differences between pre- and post-disaster brightness levels [2,25,53]. These cannot provide enough information in responding to emergencies and improving the resilience of urban infrastructure. Few studies have included other disaster metrics derivations. Among these few, Wang et al. [27] evaluated recovery start date, duration, and rate for Hurricane Sandy (New York) and Hurricane Maria (Puerto Rico). Román et al. [8] estimated the recovery level as well as the number of days and total customer hours without electricity for Hurricane Maria. Even though they comprehensively assessed the disaster and recovery situation, our analysis extends the critical disaster indicator estimation in five ways.
First, the method proposed in this study does not require prior knowledge about the time of a disaster. Our results highlight that it can automatically and effectively capture critical information of a disaster, including the start date, the time when a system is completely recovered, and the duration of the outage and recovery. Second, thanks to the derivation of the end of the outage recovery from our proposed model, comparisons between each month or stage to examine the recovery level are not necessary. How well the electricity system is restored can be evaluated directly by comparing pre- and post-disaster light intensity levels. Furthermore, it extends the literature on the assumption that the system can rebound to the previous level. Under the context of attaining a new normality, the recovery level can be higher or lower than the pre-disaster level, as shown in Figure 13. Some census tracts in our study area only regain less than 80% brightness level compared with the pre-disaster condition. Their estimated disaster duration and recovery level may be inaccurate if we use the criterion of whether they restore to the original level. Fourth, similar to the literature, we find that urban areas usually experience faster restoration rates than suburban and/or rural areas [8,54]. However, we also observe differences in the damage and recovery levels between urban and suburban areas. It deepens our understanding of how power recovery unfolds in the aftermath of a hurricane and provides a potential reference for policymakers to decide on the allocation of resources for the long-term recovery of people and economic activities. Lastly, although NTL imagery is successful in capturing different periods of a disaster, it is not directly related to the number of customers with/without power. Such information may be missing after a disaster happens; for example, PREPA lacked the number of customers without power due to technical issues on some dates in the aftermath of Hurricane Maria [3]. Our analysis finds that the estimated recovery percentage allows us to further calculate the cumulative percentage of customers with the power to study the island-wide degree of recovery.

5.3. Limitations and Future Works

Two major limitations exist in this analysis and imply future research directions. We do not consider population dynamics before and after Hurricane Maria. A net outflow from Puerto Rico after the hurricane was demonstrated through the use of various data sources [47,55,56], which likely lowered the light intensity during the post-disaster period. Current U.S. public demographic data (i.e., Census data), however, tend to be limited in explaining the effect of Hurricane Maria on the population loss constrained by the frequency of updates [57]. In addition, there was return migration to Puerto Rico during the recovery period [55,58], and thus, the influence of out-migration on the post-disaster brightness level change may be uncertain.
Another potential limitation relates to the temporal resolution of the data. We employed monthly NTL composites to assess power outage and recovery in Hurricane Maria with a long recovery period. The utility of monthly data would be limited in the context of other disasters for which the recovery period is usually of short durations, such as just a few days or even a few hours [59]. There are three reasons why monthly data were used in this study as opposed to studies that used daily data [8,9]. First, even though daily data are valuable for capturing short-term changes, daily NTL intensity is easily contaminated by stray light and cloud cover, leading to abnormal values. Monthly data tend to be steadier after correcting stray light, removing cloud cover, and averaging high or low brightness due to holidays or sudden power outages. They are more suitable for identifying long-term trends (e.g., pre-disaster level since January 2014 in this study). Second, the daily moonlight-adjusted NTL product (VNP46A2) in NASA’s standard Black Marble product suite (VNP46) was not yet publicly available when we performed this analysis. The daily at-sensor top of atmosphere (TOA) nighttime radiance product (VNP46A1) is without lunar irradiance correction. Since NTL not only captures light emitted by human activities but also reflects moonlight whose brightness depends on the lunar phase and elevation [2], the light intensity with lunar illumination likely causes bias in evaluating night light dynamics. Third, the reference reports from the DOE are on a weekly basis, which does not allow for comparison against daily estimates.
Currently, the VNP46A2 product is archived by NASA’s Level 1 and Atmosphere Archive and Distribution System Distributed Active Archive Center (LAADS DAAC) data center. It will be valuable in future studies regarding short-, mid-, and long-term night light dynamics detections. In addition to the finer temporal resolution, the approach used in this study can be implemented with finer spatial resolution (e.g., blocks and streets) data in the future. Further, more research needs to explore how to determine the optimal parameters for automatic detection algorithms across a wider range of natural or man-made disasters to achieve increasingly accurate results.

6. Conclusions

How to obtain timely disaster information efficiently is important to respond to emergencies and improve disaster resilience. Our research proposes an effective method to automatically capture critical disaster information (i.e., disaster duration, damage degree, and recovery level) based on an NTL time series dataset. The results suggest two major findings. First, the proposed Automated Valley Detection (AVD) method is a useful tool for capturing the location and length of sudden changes in time series data. Second, based on the detected periods from the AVD model, electricity outage recovery metrics at the census tract level can be derived accurately. Estimations of disaster duration and the cumulative percentage of customers with power during the recovery period are consistent with the reference data from the official reports and local news. The CDI from our proposed framework provides comprehensive knowledge on how long the electricity system can retain a new normality and how well it can be restored. This information will benefit decision makers in emergency risk management, emergency planning, and the energy industry.

Author Contributions

Conceptualization, W.L. and C.D.; methodology, W.L. and C.D.; software, W.L.; validation, C.D., B.G. and L.Z.; formal analysis, W.L. and C.D.; resources, C.D.; data curation, W.L.; writing—original draft preparation, W.L.; writing—review and editing, W.L., C.D., B.G. and L.Z.; visualization, W.L. and C.D. and B.G.; supervision, C.D.; project administration, C.D. All authors have read and agreed to the published version of the manuscript.

Funding

This research received no external funding.

Data Availability Statement

Data are contained within the article.

Conflicts of Interest

The authors declare no conflict of interest.

References

  1. Climate Central. Surging Power Outages and Climate Change. 2022. Available online: https://assets.ctfassets.net/cxgxgstp8r5d/73igUswSfOhdo7DUDVLwK7/bb0a4e95e1d04457e56106355a1f74b9/2022PowerOutages.pdf (accessed on 14 September 2022).
  2. Cao, C.; Shao, X.; Uprety, S. Detecting light outages after severe storms using the S-NPP/VIIRS day/night band radiances. IEEE Geosci. Remote Sens. Lett. 2013, 10, 1582–1586. [Google Scholar] [CrossRef]
  3. DOE. Hurricanes Nate, Maria, Irma, and Harvey Situation Reports. 2017. Available online: https://www.energy.gov/ceser/articles/hurricanes-nate-maria-irma-and-harvey-situation-reports (accessed on 13 May 2017).
  4. King, C.W.; Rhodes, J.D.; Zarnikau, J.; Lin, N.; Kutanoglu, E.; Leibowicz, B.; Niyogi, D.; Rai, V.; Santoso, S.; Spence, D. The Timeline and Events of the February 2021 Texas Electric Grid Blackouts; The University of Texas Energy Institute: Austin, TX, USA, 2021. [Google Scholar]
  5. Papic, M.; Clemons, M.; Ekisheva, S.; Langthorn, J.; Ly, T.; Pakeltis, M.; Quest, R.; Schaller, J.; Till, D.; Weisman, K. Transmission availability data system (TADS) reporting and data analysis. In Proceedings of the 2016 International Conference on Probabilistic Methods Applied to Power Systems (PMAPS), Beijing, China, 16–20 October 2016. [Google Scholar]
  6. Eaton, Powering Business Worldwide. Power Outage Annual Report: Blackout Tracker. 2014. Available online: http://www.eaton.com/blackouttracker (accessed on 26 February 2015).
  7. Balsa-Barreiro, J.; Menendez, M.; Morales, A.J. Scale, context, and heterogeneity: The complexity of the social space. Sci. Rep. 2022, 12, 9037. [Google Scholar] [CrossRef]
  8. Román, M.O.; Stokes, E.C.; Shrestha, R.; Wang, Z.; Schultz, L.; Carlo, E.A.S.; Sun, Q.; Bell, J.; Molthan, A.; Kalb, V.; et al. Satellite-based assessment of electricity restoration efforts in Puerto Rico after Hurricane Maria. PLoS ONE 2019, 14, e0218883. [Google Scholar] [CrossRef]
  9. Zhao, X.; Yu, B.; Liu, Y.; Yao, S.; Lian, T.; Chen, L.; Yang, C.; Chen, Z.; Wu, J. NPP-VIIRS DNB daily data in natural disaster assessment: Evidence from selected case studies. Remote Sens. 2018, 10, 1526. [Google Scholar] [CrossRef]
  10. Zhao, M.; Zhou, Y.; Li, X.; Zhou, C.; Cheng, W.; Li, M.; Huang, K. Building a series of consistent night-time light data (1992–2018) in Southeast Asia by integrating DMSP-OLS and NPP-VIIRS. IEEE Trans. GeoSci. Remote Sens. 2019, 58, 1843–1856. [Google Scholar] [CrossRef]
  11. Balsa-Barreiro, J. LiDAR for management in natural disasters and catastrophes. In Government Briefing Book: Emerging Technology & Human Rights; Greene, K.G., Ed.; 2019; Volume 1, p. 11. Available online: https://www.greenestrategy.com/brief (accessed on 1 July 2021).
  12. Kaku, K. Satellite remote sensing for disaster management support: A holistic and staged approach based on case studies in Sentinel Asia. Int. J. Disaster Risk Reduct. 2019, 33, 417–432. [Google Scholar] [CrossRef]
  13. Daud, S.M.S.M.; Yusof, M.Y.P.M.; Heo, C.C.; Khoo, L.S.; Singh, M.K.C.; Mahmood, M.S.; Nawawi, H. Applications of drone in disaster management: A scoping review. Sci. Justice 2022, 62, 30–42. [Google Scholar] [CrossRef] [PubMed]
  14. Elvidge, C.D.; Baugh, K.E.; Zhizhin, M.; Hsu, F.-C. Why VIIRS data are superior to DMSP for mapping nighttime lights. Proc. Asia-Pac. Adv. Netw. 2013, 35, 62. [Google Scholar] [CrossRef]
  15. Shi, K.; Huang, C.; Yu, B.; Yin, B.; Huang, Y.; Wu, J. Evaluation of NPP-VIIRS night-time light composite data for extracting built-up urban areas. Remote Sens. Lett. 2014, 5, 358–366. [Google Scholar] [CrossRef]
  16. Ma, T.; Zhou, C.; Pei, T.; Haynie, S.; Fan, J. Responses of Suomi-NPP VIIRS-derived nighttime lights to socioeconomic activity in China’s cities. Remote Sens. Lett. 2014, 5, 165–174. [Google Scholar] [CrossRef]
  17. Wu, R.; Yang, D.; Dong, J.; Zhang, L.; Xia, F. Regional inequality in China based on NPP-VIIRS night-time light imagery. Remote Sens. 2018, 10, 240. [Google Scholar] [CrossRef]
  18. Deng, C.; Lin, W.; Chen, S. Use of smart meter readings and nighttime light images to track pixel-level electricity consumption. Remote Sens. Lett. 2019, 10, 205–213. [Google Scholar] [CrossRef]
  19. Fragkias, M.; Lobo, J.; Seto, K.C. A comparison of nighttime lights data for urban energy research: Insights from scaling analysis in the US system of cities. Environ. Plan. B Urban Anal. City Sci. 2017, 44, 1077–1096. [Google Scholar] [CrossRef]
  20. Elvidge, C.D.; Zhizhin, M.; Baugh, K.; Hsu, F.-C. Automatic boat identification system for VIIRS low light imaging data. Remote Sens. 2015, 7, 3020–3036. [Google Scholar] [CrossRef]
  21. Geronimo, R.C.; Franklin, E.C.; Brainard, R.E.; Elvidge, C.D.; Santos, M.D.; Venegas, R.; Mora, C. Mapping fishing activities and suitable fishing grounds using nighttime satellite images and maximum entropy modelling. Remote Sens. 2018, 10, 1604. [Google Scholar] [CrossRef]
  22. Levin, N.; Ali, S.; Crandall, D. Utilizing remote sensing and big data to quantify conflict intensity: The Arab Spring as a case study. Appl. Geogr. 2018, 94, 1–17. [Google Scholar] [CrossRef]
  23. Li, X.; Liu, S.; Jendryke, M.; Li, D.; Wu, C. Night-time light dynamics during the Iraqi civil war. Remote Sens. 2018, 10, 858. [Google Scholar] [CrossRef]
  24. Levin, N.; Ali, S.; Crandall, D.; Kark, S. World Heritage in danger: Big data and remote sensing can help protect sites in conflict zones. Glob. Environ. Chang. 2019, 55, 97–104. [Google Scholar] [CrossRef]
  25. Cole, T.A.; Wanik, D.W.; Molthan, A.L.; Román, M.O.; Griffin, R.E. Synergistic use of nighttime satellite data, electric utility infrastructure, and ambient population to improve power outage detections in urban areas. Remote Sens. 2017, 9, 286. [Google Scholar] [CrossRef]
  26. Molthan, A.; Jedlovec, G. Satellite observations monitor outages from Superstorm Sandy. Eos Trans. Am. Geophys. Union 2013, 94, 53–54. [Google Scholar] [CrossRef]
  27. Wang, Z.; Román, M.O.; Sun, Q.; Molthan, A.L.; Schultz, L.A.; Kalb, V.L. Monitoring disaster-related power outages using NASA black marble nighttime light product. Int. Arch. Photogramm. Remote Sens. Spat. Inf. Sci. 2018, 42, 1853–1856. [Google Scholar] [CrossRef]
  28. Chang, S.E. Urban disaster recovery: A measurement framework and its application to the 1995 Kobe earthquake. Disasters 2010, 34, 303–327. [Google Scholar] [CrossRef] [PubMed]
  29. Pacsi, A.P.; Alhajeri, N.S.; Webster, M.D.; Webber, M.E.; Allen, D.T. Changing the spatial location of electricity generation to increase water availability in areas with drought: A feasibility study and quantification of air quality impacts in Texas. Environ. Res. Lett. 2013, 8, 035029. [Google Scholar] [CrossRef]
  30. Kwasinski, A.; Andrade, F.; Castro-Sitiriche, M.J.; O’Neill-Carrillo, E. Hurricane Maria effects on Puerto Rico electric power infrastructure. IEEE Power Energy Technol. Syst. J. 2019, 6, 85–94. [Google Scholar] [CrossRef]
  31. Corps, M. Quick Facts: Hurricane Maria’s Effect on Puerto Rico. 2019. Available online: https://www.mercycorps.org/blog/facts-hurricane-maria-puerto-rico#:~:text=Electricity%20was%20cut%20off%20to,into%20a%20desperate%20humanitarian%20crisis (accessed on 3 July 2019).
  32. Irfan, U. It’s Been More than 100 Days and Puerto Rico is Still in the Longest Blackout in US History. Vox. 2018. Available online: https://www.vox.com/energy-and-environment/2017/10/30/16560212/puerto-rico-longest-blackout-in-us-history-hurricane-maria-grid-electricity (accessed on 8 December 2018).
  33. Savitzky, A.; Golay, M.J.E. Smoothing and differentiation of data by simplified least squares procedures. Anal. Chem. 1964, 36, 1627–1639. [Google Scholar] [CrossRef]
  34. Guiñón, J.L.; Ortega, E.; García-Antón, J.; Pérez-Herranz, V. Moving average and Savitzki-Golay smoothing filters using Mathcad. Papers ICEE 2007, 2007, 1–4. [Google Scholar]
  35. Chen, J.; Jönsson, P.; Tamura, M.; Gu, Z.; Matsushita, B.; Eklundh, L. A simple method for reconstructing a high-quality NDVI time-series data set based on the Savitzky–Golay filter. Remote Sens. Environ. 2004, 91, 332–344. [Google Scholar] [CrossRef]
  36. Press, W.H.; Teukolsky, S.A. Savitzky-Golay smoothing filters. Comput. Phys. 1990, 4, 669–672. [Google Scholar] [CrossRef]
  37. van Brakel, J.P. Smoothed z-Score Algorithm (Stack Overflow). 2016. Available online: https://stackoverflow.com/questions/22583391/peak-signal-detection-in-realtime-timeseries-data (accessed on 17 June 2016).
  38. Dons, E.; Laeremans, M.; Orjuela, J.P.; Avila-Palencia, I.; de Nazelle, A.; Nieuwenhuijsen, M.; Van Poppel, M.; Carrasco-Turigas, G.; Standaert, A.; De Boever, P.; et al. Transport most likely to cause air pollution peak exposures in everyday life: Evidence from over 2000 days of personal monitoring. Atmos. Environ. 2019, 213, 424–432. [Google Scholar] [CrossRef]
  39. Perkins, P.; Heber, S. Identification of ribosome pause sites using a z-score based peak detection algorithm. In Proceedings of the 2018 IEEE 8th International Conference on Computational Advances in Bio and Medical Sciences (ICCABS), Las Vegas, NV, USA, 18–20 October 2018. [Google Scholar]
  40. Zou, L.; Lam, N.S.N.; Shams, S.; Cai, H.; Meyer, M.A.; Yang, S.; Lee, K.; Park, S.-J.; Reams, M.A. Social and geographical disparities in Twitter use during Hurricane Harvey. Int. J. Digit. Earth 2019, 12, 1300–1318. [Google Scholar] [CrossRef]
  41. Harán “Reclamo Masivo” en Humacao por el Servicio Eléctrico. Redacción EL Oriental. Available online: http://periodicoeloriental.com/noticias/haran-reclamo-masivo-en-humacao-por-el-servicio-electrico/ (accessed on 21 March 2018).
  42. Millán, R. Justo González Admite Siente la Presión de Restablecer Servicio. El Regional. Available online: https://www.elregionalpr.com/justo-gonzalez-admite-siente-la-presion-de-restablecer-servicio/ (accessed on 10 January 2018).
  43. Mayita Meléndez Habla de la Situación de Ponce tras seis Meses del Huracán María. Períodíco El Solpr. 20 March 2018. Available online: https://periodicoelsolpr.com/2018/03/20/mayita-melendez-habla-de-la-situacion-de-ponce-tras-seis-meses-del-huracan-maria/ (accessed on 20 March 2018).
  44. Alcalde Busca Alternativas para Acelerar Restablecimiento de Electricidad en Guayanilla. Voces del Sur. Available online: https://vocesdelsurpr.com/2018/03/alcalde-busca-alternativas-para-acelerar-restablecimiento-de-electricidad-en-guayanilla/ (accessed on 27 March 2018).
  45. Rodríguez, D.J. El Oeste Tendrá luz Total Después de Enero. Redacción One Red Media. Available online: https://laislaoeste.com/el-oeste-tendra-luz-total-despues-de-enero/ (accessed on 19 December 2017).
  46. Sharifi, A. Resilient urban forms: A macro-scale analysis. Cities 2019, 85, 1–14. [Google Scholar] [CrossRef]
  47. Acosta, R.J.; Kishore, N.; Irizarry, R.A.; Buckee, C.O. Quantifying the dynamics of migration after Hurricane Maria in Puerto Rico. Proc. Natl. Acad. Sci. USA 2020, 117, 32772–32778. [Google Scholar] [CrossRef]
  48. Lin, J.; Shi, W. Statistical correlation between monthly electric power consumption and VIIRS nighttime light. ISPRS Int. J. Geo-Inf. 2020, 9, 32. [Google Scholar] [CrossRef]
  49. Henderson, J.; Storeygard, V.A.; Weil, D.N. Measuring economic growth from outer space. Am. Econ. Rev. 2012, 102, 994–1028. [Google Scholar] [CrossRef]
  50. Henderson, J.; Storeygard, V.A.; Weil, D.N. Mapping urbanization dynamics at regional and global scales using multi-temporal DMSP/OLS nighttime light data. Remote Sens. Environ. 2011, 115, 2320–2329. [Google Scholar]
  51. United States Census Bureau. QuickFacts: Puerto Rico. 2022. Available online: https://www.census.gov/quickfacts/fact/table/PR/PST045222 (accessed on 13 September 2022).
  52. Kates, R.W.; Colten, C.E.; Laska, S.; Leatherman, S.P. Reconstruction of New Orleans after Hurricane Katrina: A research perspective. Proc. Natl. Acad. Sci. USA 2006, 103, 14653–14660. [Google Scholar] [CrossRef]
  53. Miller, S.D.; Straka, W.C.; Yue, J.; Seaman, C.J.; Xu, S.; Elvidge, C.D.; Hoffmann, L.; Azeem, I.; Straka, I.W.C. The dark side of hurricane matthew: Unique perspectives from the VIIRS day/night band. Bull. Am. Meteorol. Soc. 2018, 99, 2561–2574. [Google Scholar] [CrossRef]
  54. Miller, S.D.; Straka, W.C.; Yue, J.; Seaman, C.J.; Xu, S.; Elvidge, C.D.; Hoffmann, L.; Azeem, I.; Straka, I.W.C. Socioeconomic vulnerability and electric power restoration timelines in Florida: The case of Hurricane Irma. Nat. Hazards 2018, 94, 689–709. [Google Scholar]
  55. DeWaard, J.; Johnson, J.E.; Whitaker, S.D. Out-migration from and return migration to Puerto Rico after Hurricane Maria: Evidence from the consumer credit panel. Popul. Environ. 2020, 42, 28–42. [Google Scholar] [CrossRef]
  56. Martín, Y.; Cutter, S.L.; Li, Z.; Emrich, C.T.; Mitchell, J.T. Using geotagged tweets to track population movements to and from Puerto Rico after Hurricane Maria. Popul. Environ. 2020, 42, 4–27. [Google Scholar] [CrossRef]
  57. Rivera, F.I. Puerto Rico’s population before and after Hurricane Maria. Popul. Environ. 2020, 42, 1–3. [Google Scholar] [CrossRef] [PubMed]
  58. Schachter, J.; Bruce, A. Revising Methods to Better Reflect the Impact of Disaster. 2021. Available online: https://www.census.gov/library/stories/2020/08/estimating-puerto-rico-population-after-hurricane-maria.html (accessed on 8 November 2021).
  59. Simon, D. Urbanisation and global environmental change: New intergenerational challenges. Int. J. Green Econ. 2007, 1, 299–306. [Google Scholar] [CrossRef]
Figure 1. Regions and representative counties in Puerto Rico and the path of Hurricane Maria as it passed over the island.
Remotesensing 15 05471 g001
Figure 2. Comparison between the official recovery data from DOE and island-wide average nighttime light radiance before and after Hurricane Maria hits Puerto Rico.
Remotesensing 15 05471 g002
Figure 3. The analytical framework in this study.
Remotesensing 15 05471 g003
Figure 4. Sensitivity analysis on data smoothing using different filter order (from 1 to 5). The optimal filter order is found at 1.
Remotesensing 15 05471 g004
Figure 5. An illustration of three CDIs: the duration (the green line), the damage degree (the ratio of blue to purple lines), and the recovery level (the ratio of brown to purple lines).
Remotesensing 15 05471 g005
Figure 6. Sensitivity analysis of different thresholds on the outage duration estimation.
Remotesensing 15 05471 g006
Figure 7. An example of the sensitivity analysis of outage duration using different lengths of moving window (lag).
Remotesensing 15 05471 g007
Figure 8. Estimated tract-level outage duration derived from Automated Valley Detection.
Remotesensing 15 05471 g008
Figure 9. Histogram of the estimated outage duration result using AVD.
Remotesensing 15 05471 g009
Figure 10. (A) The AVD-estimated tract-level degree of damage; (B) hurricane threat based on tract-level averaged kernel density.
Remotesensing 15 05471 g010
Figure 11. The correlation between damage level and hurricane threat. The density of observations is displayed by a purple color gradient. The darker area represents a higher point density.
Remotesensing 15 05471 g011
Figure 12. The AVD-estimated tract-level recovery degree in the entire island (as of July 2019). Darker tracts (e.g., A to C) have a high recovery level, while lighter tracts (e.g., D to I) are those with low recovery levels. Some key power plants are shown as orange stars.
Remotesensing 15 05471 g012
Figure 13. Illustration of the raw NTL profiles of sample tracts with brighter post-disaster radiance than the pre-disaster level (AC with a recovery rate > 100%), and those with darker post-disaster radiance (DI with a recovery rate < 80%), where the red dashed lines show the pre-/post-disaster level using weighted average. The numbering follows the same tracts in Figure 12.
Remotesensing 15 05471 g013
Figure 14. Cumulative percentage of customers with power in the entire island over time.
Remotesensing 15 05471 g014
Figure 15. Comparisons between weighted average and simple average.
Remotesensing 15 05471 g015
Table 1. Comparison between outage duration from news reports and AVD estimates.
RegionCountyDuration from Local News Reports (in Months)AVD-Estimated Duration (in Months)
EastHumacao [41]>69.8
Maunabo [42]>411
SouthPonce [43]>66.6
Guayanilla [44]≥66
Patillas [42]>46.8
Coamo [42]>45.1
Salinas [42]>46.1
Santa Isabel [42]>45.8
CentralCayey [42]>46.5
WestMayagüez [45]>55.5
Disclaimer/Publisher’s Note: The statements, opinions and data contained in all publications are solely those of the individual author(s) and contributor(s) and not of MDPI and/or the editor(s). MDPI and/or the editor(s) disclaim responsibility for any injury to people or property resulting from any ideas, methods, instructions or products referred to in the content.

