Article

The Compound Effects of Highway Reconstruction and Climate Change on Vegetation Activity over the Qinghai Tibet Plateau: The G318 Highway as a Case Study

1
School of Surveying and Land Information Engineering, Henan Polytechnic University, Jiaozuo 454000, China
2
Key Laboratory of Land Surface Pattern and Simulation, Institute of Geographic Sciences and Natural Resources Research, Chinese Academy of Sciences, 11A Datun Rd, Beijing 100101, China
3
Academy of Plateau Science and Sustainability, Qinghai Normal University, Xining 810008, China
*
Author to whom correspondence should be addressed.
Remote Sens. 2023, 15(23), 5473; https://doi.org/10.3390/rs15235473
Submission received: 15 October 2023 / Revised: 15 November 2023 / Accepted: 19 November 2023 / Published: 23 November 2023
(This article belongs to the Special Issue Remote Sensing of Interaction between Human and Natural Ecosystem)

Abstract

:
The Qinghai–Tibet Plateau (QTP) is among one of the most sensitive regions to global environmental change worldwide. Although climate change and engineering construction on the QTP have jointly modified the regional vegetation activity, little is known about how this affects the vegetation variation. Using Moderate Resolution Imaging Spectroradiometer (MODIS) Enhanced Vegetation Index (EVI) data from 2000–2021, this study investigated the spatiotemporal variation of vegetation activity and the compound effects of climate change and reconstruction along the Tibetan section of the G318 national highway (TG318) through a novel contribution quantification model and partial correlation analysis, as well as through a structural equation model (SEM). The results showed that the mean growing-season EVI increased significantly at a rate of about 0.0020/year in the western side of the TG318 after reconstruction but fluctuated in the east. Reconstruction generally had a significant effect on the mean growing-season EVI, with contributions of 7.67%, 19.12%, 18.24%, and −4.15% in different sections of the TG318, whereas climate change contributed from −10.14% to 8.84% of the total variation. The mean growing-season EVI negatively correlated with snow cover and minimum temperature in humid and sub-humid regions, whereas it was positively related with vapor pressure in semi-arid regions. Moreover, there existed an obvious lag effect of climate change on the mean growing-season EVI, with lag time generally decreasing from west to east and apparent heterogeneity among different months and regions. These findings will help better understand the environmental impacts along the engineering corridors and provide a scientific basis for ecological conservation in the QTP regions.

1. Introduction

The Qinghai–Tibet Plateau (QTP), also known as the Third Pole, is the largest geographical entity with the highest elevation [1,2]. Due to its unique geographic location and hydrothermal conditions, the QTP promotes biodiversity by playing a crucial role in maintaining ecological security in China and Asia [3,4,5]. The QTP is among the most fragile environmental regions in China and is particularly sensitive to climate change and anthropogenic forces [6,7]. Warmer and wetter weather has been observed over the QTP during the past few decades, with warming rates of 0.16–0.67 °C/decade from the 1950s to the 2000s [8], 0.46 °C/decade from 1984 to 2009 [9], and 0.3–0.6 °C/decade from 2000 to 2015 [10,11,12], which are higher than those in the Northern Hemisphere and global values [9,10]. Precipitation has increased slightly, with strong spatial heterogeneity between the southern and northern regions [12,13], and these upward trends are predicted to continue until the end of the 21st century [14,15]. Anthropogenic activities on the QTP have intensified during the past several decades with rapid economic development. The number of towns and the urban land area increased approximately 3-fold during 1990–2020 [3,4]. Highway mileage rose from 65,200 to 120,700 km from 2012 to 2021 [16], and overgrazing has intensified since the late 1990s [17]. This intensification of anthropogenic activities and climate change has challenged the local vegetation dynamics by altering ecosystem processes and services. Therefore, it is of great scientific and practical merit to understand the anthropogenic and climate effects on QTP vegetation.
Assessing the dynamics of vegetation and its response to environmental factors is essential to understanding ecosystem changes. In past decades, great efforts have been made to quantify the relative impacts of human activities and climate change on vegetation changes, such as in China [18], India [19], and around the whole world [20]. Recently, an increasing number of studies have concentrated on the relative contributions in the QTP of grazing management [7] and the effects of ecological projects [21,22]. However, our understanding of the effects of road construction disturbance on vegetation is limited, which has been suggested to be a main factor driving increased human activities in Tibet [23]. Several methods have been used to separate the contributions of human activities and climate change to vegetation dynamics in the QTP, such as residual and regression analysis approaches [24,25]. Notwithstanding, a common drawback of residual analysis is that the contribution of human activity is considered residual in areas without human activity [26], whereas regression analysis does not consider the collinearity of independent variables and often cannot identify the relationships between vegetation dynamics and anthropogenic factors due to a lack of detailed spatial data, particularly with respect to road engineering [24]. A recent study conducted an innovative spatiotemporal invariant analysis along the Qinghai–Tibet Railway, which relied on residuals of the 12-month Global Inventory Monitoring and Modeling System normalized difference vegetation index (GIMMS NDVI) [26]. The vegetation growth period in the QTP is very short, and the effects of multiple environmental factors, such as snow cover on the NDVI during the non-growing season, leads to uncertainties in effects analyses [6,27]. It is still unclear how the combination of climate change and road construction affects the vegetation activities on the QTP. Moreover, the interactions among multiple variables cannot be predicted using regression analysis, and the indirect effects of multiple variables on vegetation dynamics should not be ignored in alpine ecosystems [28,29]. However, this underlying mechanism also remains poorly understood.
The G318 highway has a total length of 5476 km. It begins in the Huangpu district of Shanghai, China, and ends in Shigatse City, Tibet. This highway is of great significance for economic and cultural exchange between the east and west of China and is the main transportation route connecting Tibet and the provinces in southwest China. In this study, we used the Tibetan section of the G318 national highway (TG318) as a study area and developed a novel method to evaluate the dual effects of climate change and reconstruction on vegetation activity in the QTP using the Moderate Resolution Imaging Spectroradiometer (MODIS) Enhanced Vegetation Index (EVI) and ground-observed climate data. This study aims to quantify the spatial and temporal variation in vegetation activity along the reconstructed regions, distinguish the contributions of climatic forces and reconstruction to vegetation change, and explore the interactive mechanisms and lag impacts of climate factors on vegetation.

2. Materials and Methods
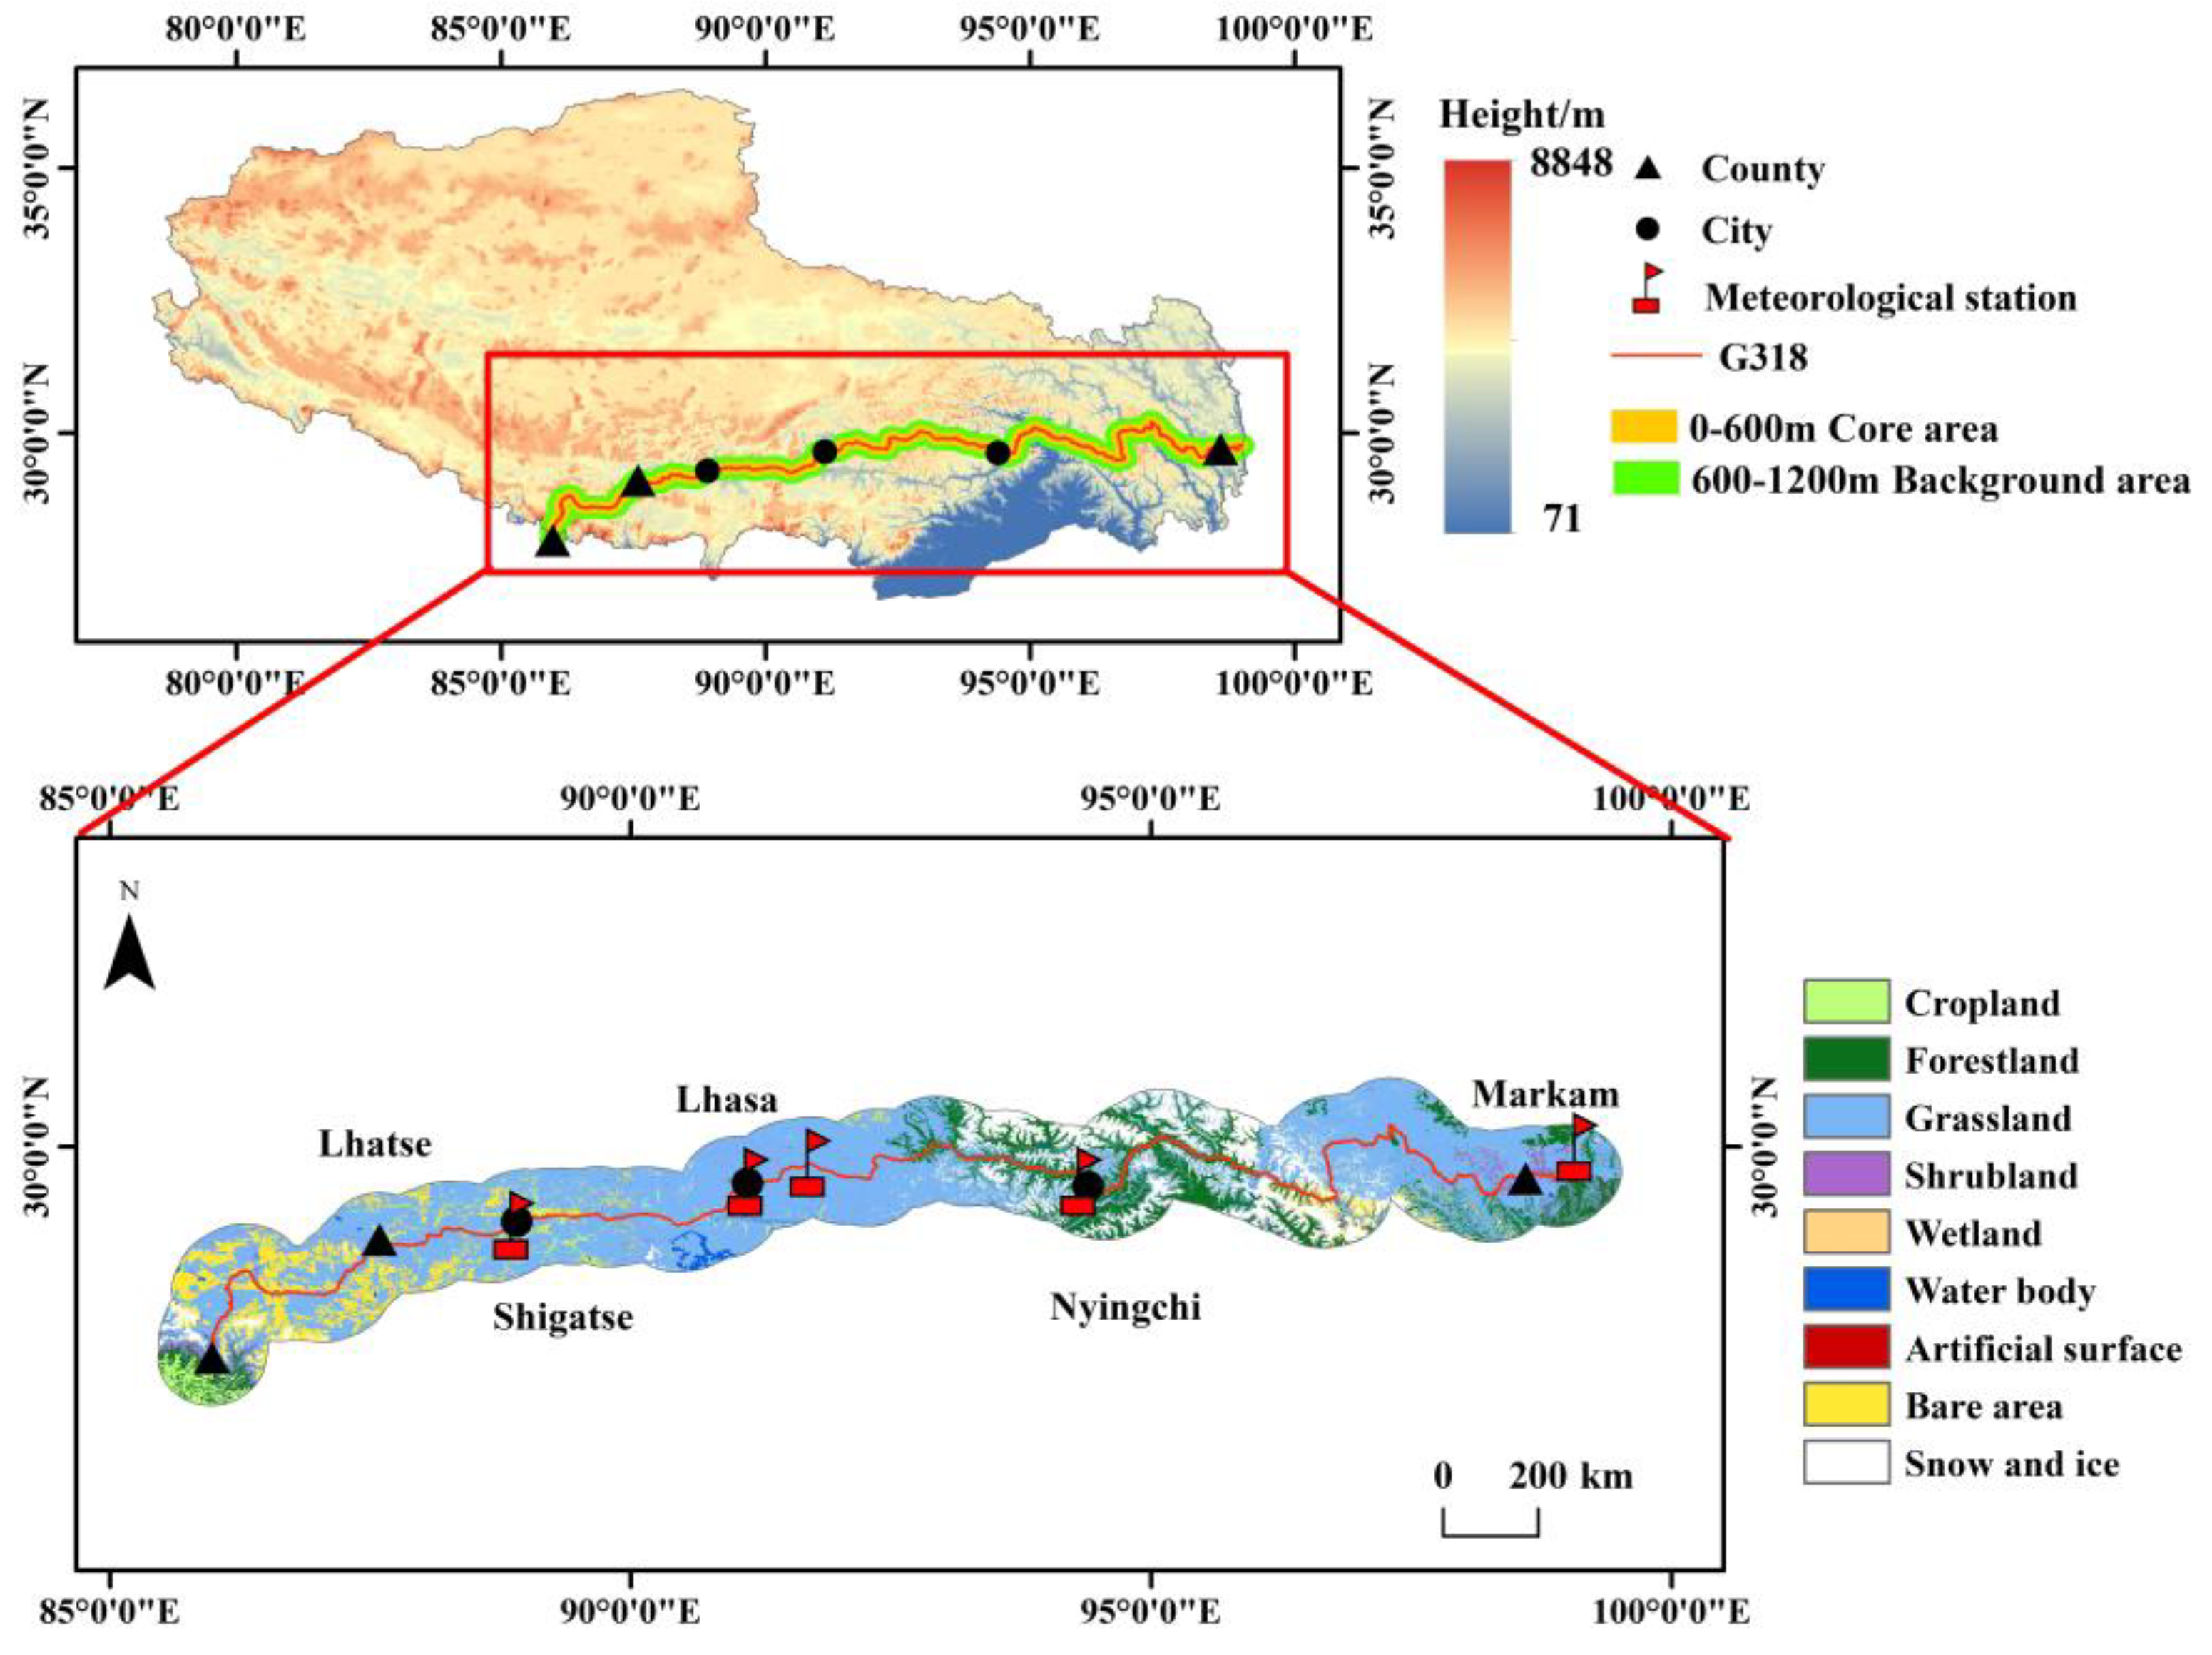
2.1. Study Area

Traffic has improved significantly with democratic reform in Tibet. The total length of highways open to traffic in Tibet is 89,300 km, and passenger and freight transportation has increased to 10.47 million person–time and 23.63 million tons over the past 60 years, representing 56% and 96% of the comprehensive transportation system, respectively, and laying the foundation for regional socioeconomic development. The TG318 is the main transportation route of Tibet and plays a significant role in Tibet’s economic and social development [30]. The highway was built in December, 1954, and extensive paving and reconstruction were mainly carried out section by section through the 1980s–2000s to develop the existing asphalt pavement [31] The topography of the highway is high in the west and low in the east due to uplift in the QTP (Figure 1). Large-scale construction, particularly black asphalt pavement, has inevitably boosted heat absorption and altered heat and moisture transfer between paving layers and the frozen soil structure, further inducing ecological and environmental problems [32,33].
Vegetation is frequently used as an ecological indicator. Long-term vegetation dynamic characteristics and the contributions of climate change and construction activity play significant roles in the ecological evolution and restoration of major projects in ecologically fragile areas. In this study, we selected our study area and designated a 600 m strip buffer zone around the G318 national highway as the core disturbance area (“C”), which experiences direct anthropogenic impacts, and a 600–1200 m ring buffer outside the G318 national highway as an ecological background area (“B”) (Figure 1), similar to previous studies [34,35].

2.2. Datasets

Vegetation index data: The EVI is proposed based on a feedback-based approach that incorporates both background adjustment and atmospheric resistance concepts into the NDVI, which is sensitive to soil and atmospheric effects and can be used to solve the easy saturation problem in NDVI to some extent. The EVI is widely used to infer vegetation activity and phenology [36,37]. In this study, we used the MOD13Q1 EVI datasets for 2000–2021 (https://modis.gsfc.nasa.gov, accessed on 12 April 2022). These data have a spatial resolution of 250 m and a temporal resolution of 8 days and have been reported to be of better quality than GIMMS data for the Tibetan Plateau [38]. The maximum value compositing method [39] was used to obtain the monthly EVIs from 2000 to 2021. Then, the monthly EVI time-series data of MOD13Q1 was obtained based on the maximum image value in the same month. To avoid environmental interference in the EVI during the non-growing season, the growing-season EVI (April–October) was chosen as the focus of this study.
Climate data: To analyze the relationships between climate factors and vegetation activity, monthly snow cover (GSS, cm), precipitation (PRE, mm), relative humidity (RHU, %), sunshine duration (SSD, h), mean temperature (T-mean, °C), maximum temperature (T-max, °C), minimum temperature (T-min, °C), and vapor pressure (VAP, hPa) were obtained from meteorological stations of the Resource and Environmental Science and Data Center (https://www.resdc.cn, accessed on 2 March 2023 ) for 2000–2019. For the few missing recorded values in the climatic dataset, we further interpolated them by using the average value from the same month of the two adjacent years. Considering the regional limitations of climate, when there were two or more stations within a given highway section, average values were calculated for five meteorological stations close to the road in the selected area and used as the monthly climate data.
Other data: We used the Global 30 land-cover datasets (Globelland30) in 2010 as a reference (http://www.globallandcover.com, accessed on 4 June 2023) and divided the land-use types into 9 categories within the 50 km buffer zone (Figure 1). A digital elevation model with the spatial resolution of 1 km was provided by the Resource and Environmental Science and Data Center (https://www.resdc.cn, accessed on 15 February 2023). Road reconstruction and expansion records were obtained from the Transport Planning Research Institute Ministry of Transport (https://www.tpri.org.cn, accessed on 6 August 2022). Road reconstruction and expansion are usually completed in a relatively short time to comply with local government regulations, and the completion time varied among regions. We divided the highway into four sections according to differences in their reconstruction periods and land use characteristics (Table 1). A list of definitions and abbreviations used in this study is presented in Appendix A (Table A1).

2.3. Methods

2.3.1. Trend Analyses

To comprehensively evaluate and compare regional vegetation trends, linear least-squares regression analysis was performed for the growing season and monthly scales before (pre) and after (post) reconstruction. The significance level was p < 0.05. Linear least-squares regression was used to investigate the vegetation index trend, as follows:
S l o p e   S = n × i = 1 n i × E V I i ( i = 1 n i ) × ( i = 1 n E V I i ) n × i = 1 n i 2 ( i = 1 n i ) 2
where n is the time series, E V I i is the value of the EVI at time i , and Slope (S) represents the strength of the change in vegetation activity. We established five categories of significant increase (SI; S > 0 and p ≤ 0.05), increase (IN; S > 0 and p > 0.05), no change (NO; S = 0), decrease (DE; S < 0 and p > 0.05), and significant decrease (SD; S < 0 and p ≤ 0.05).

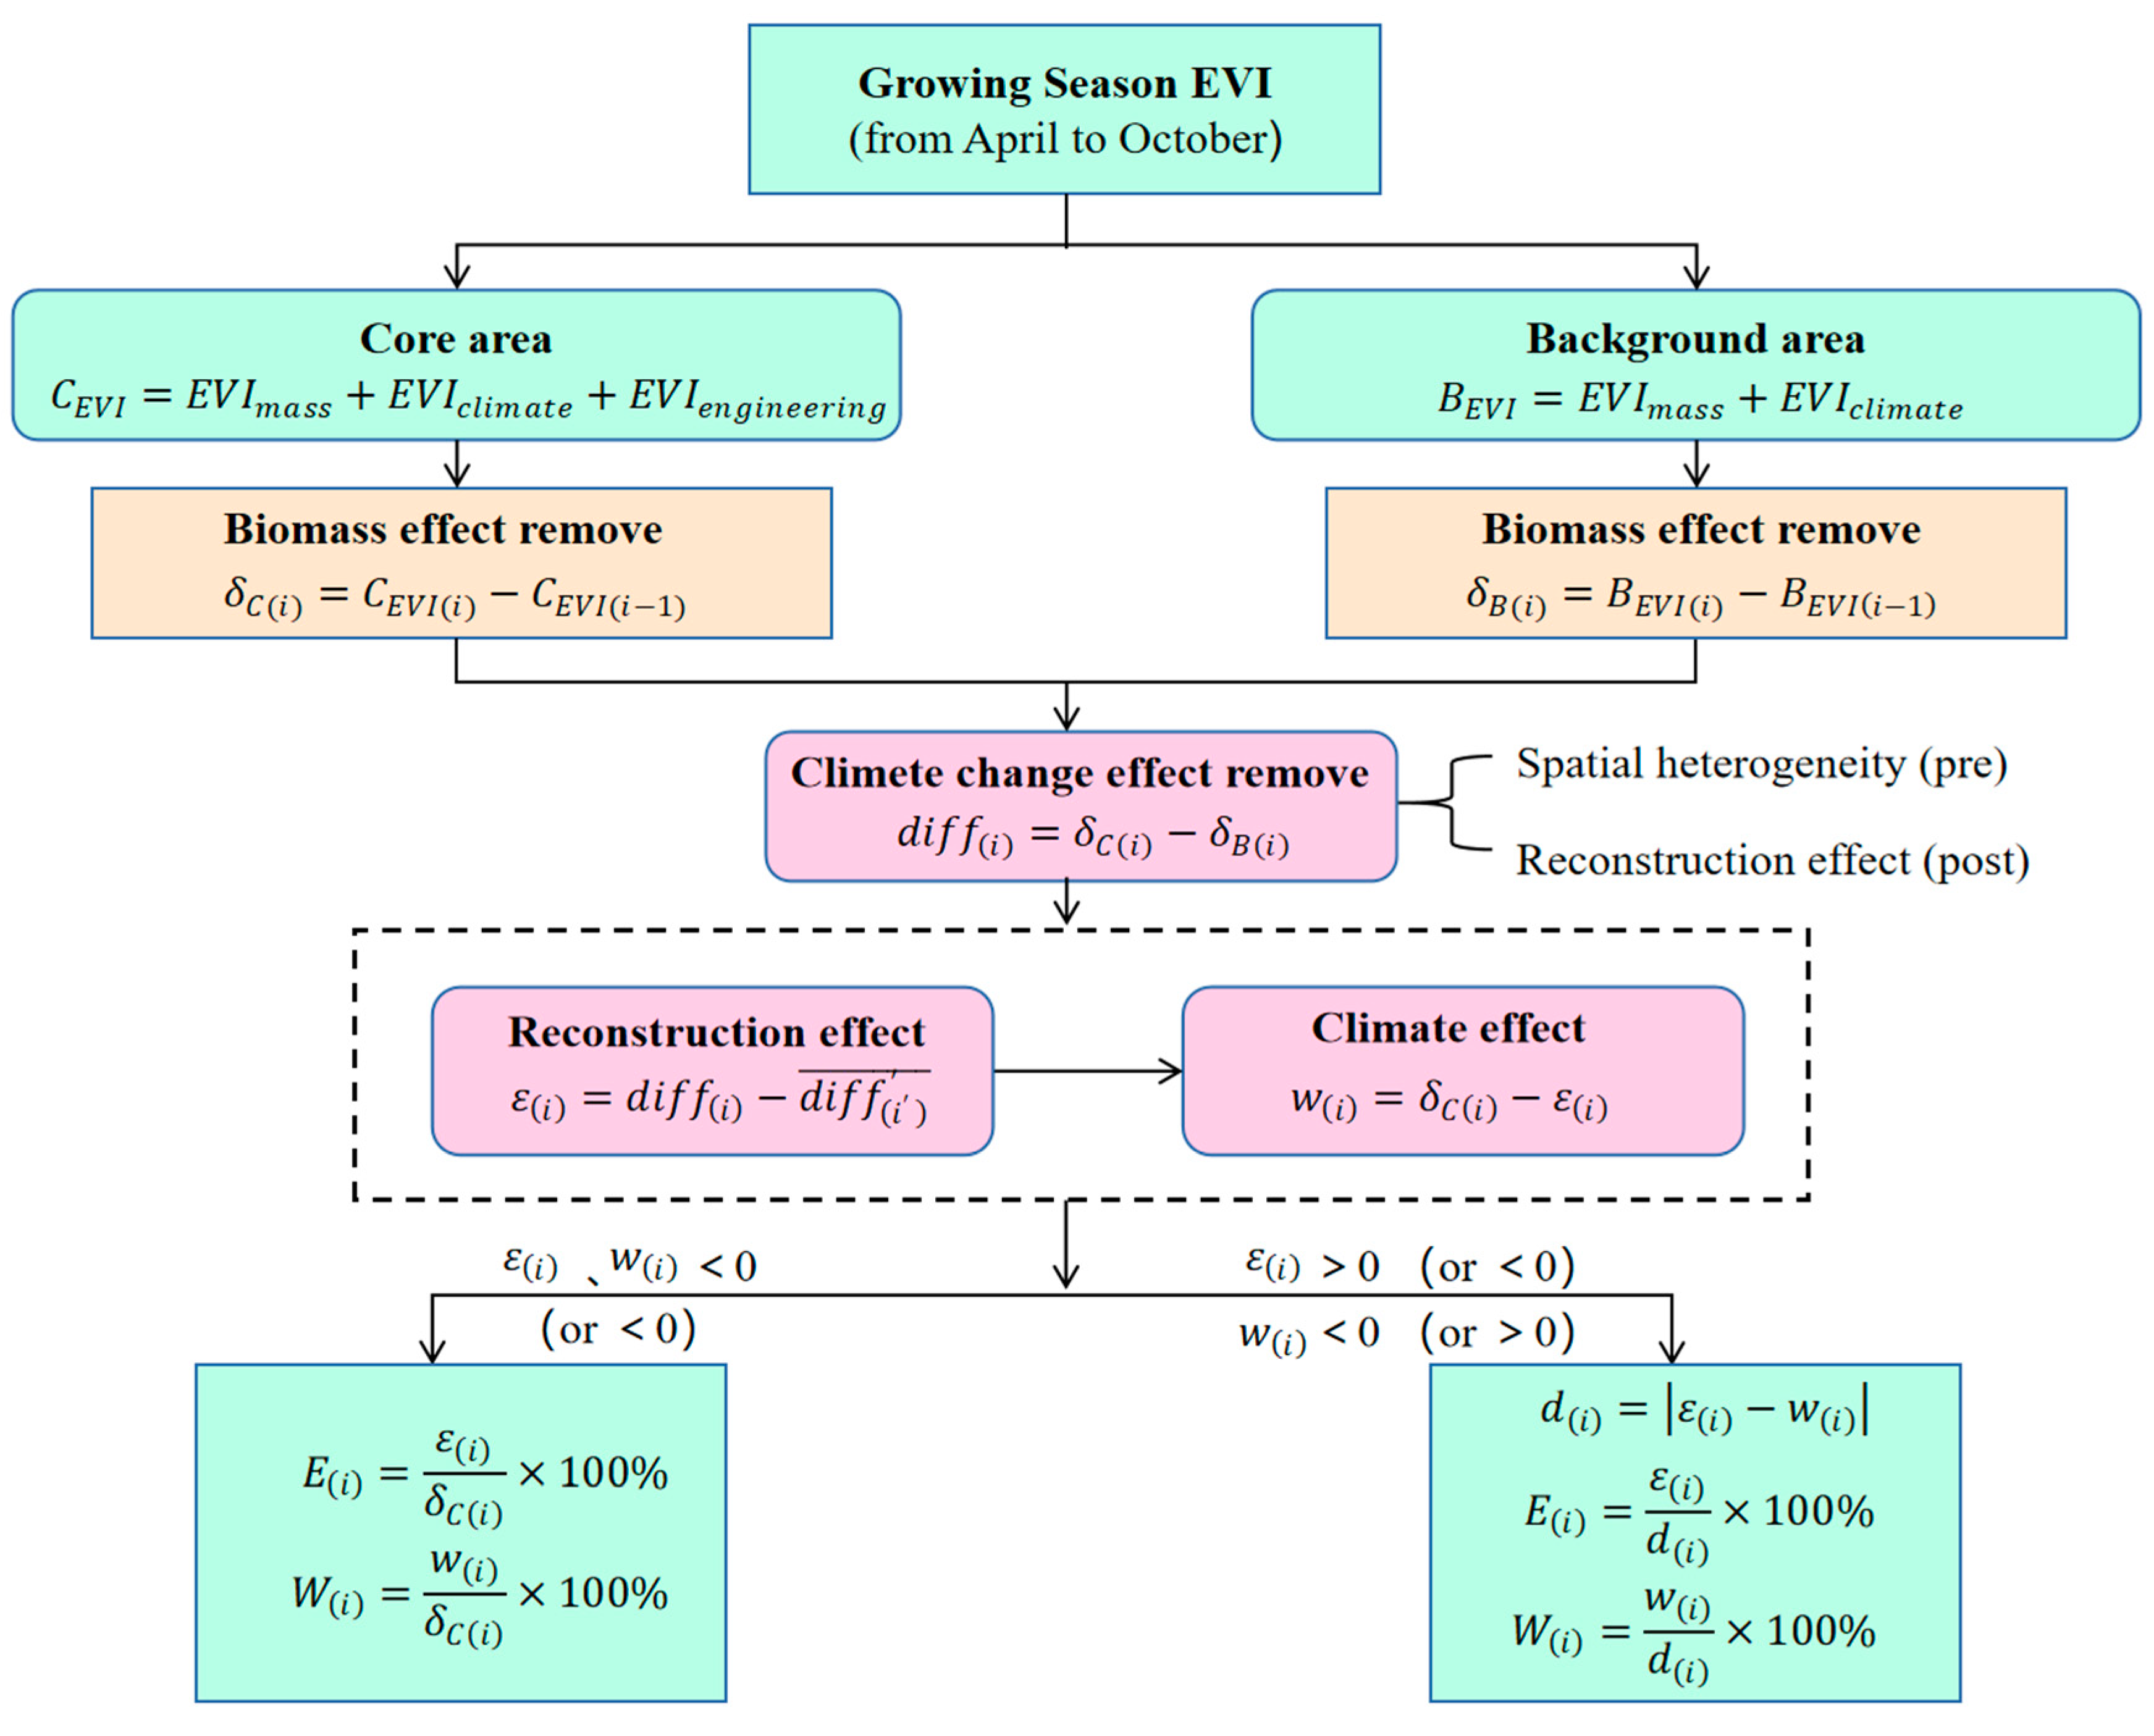
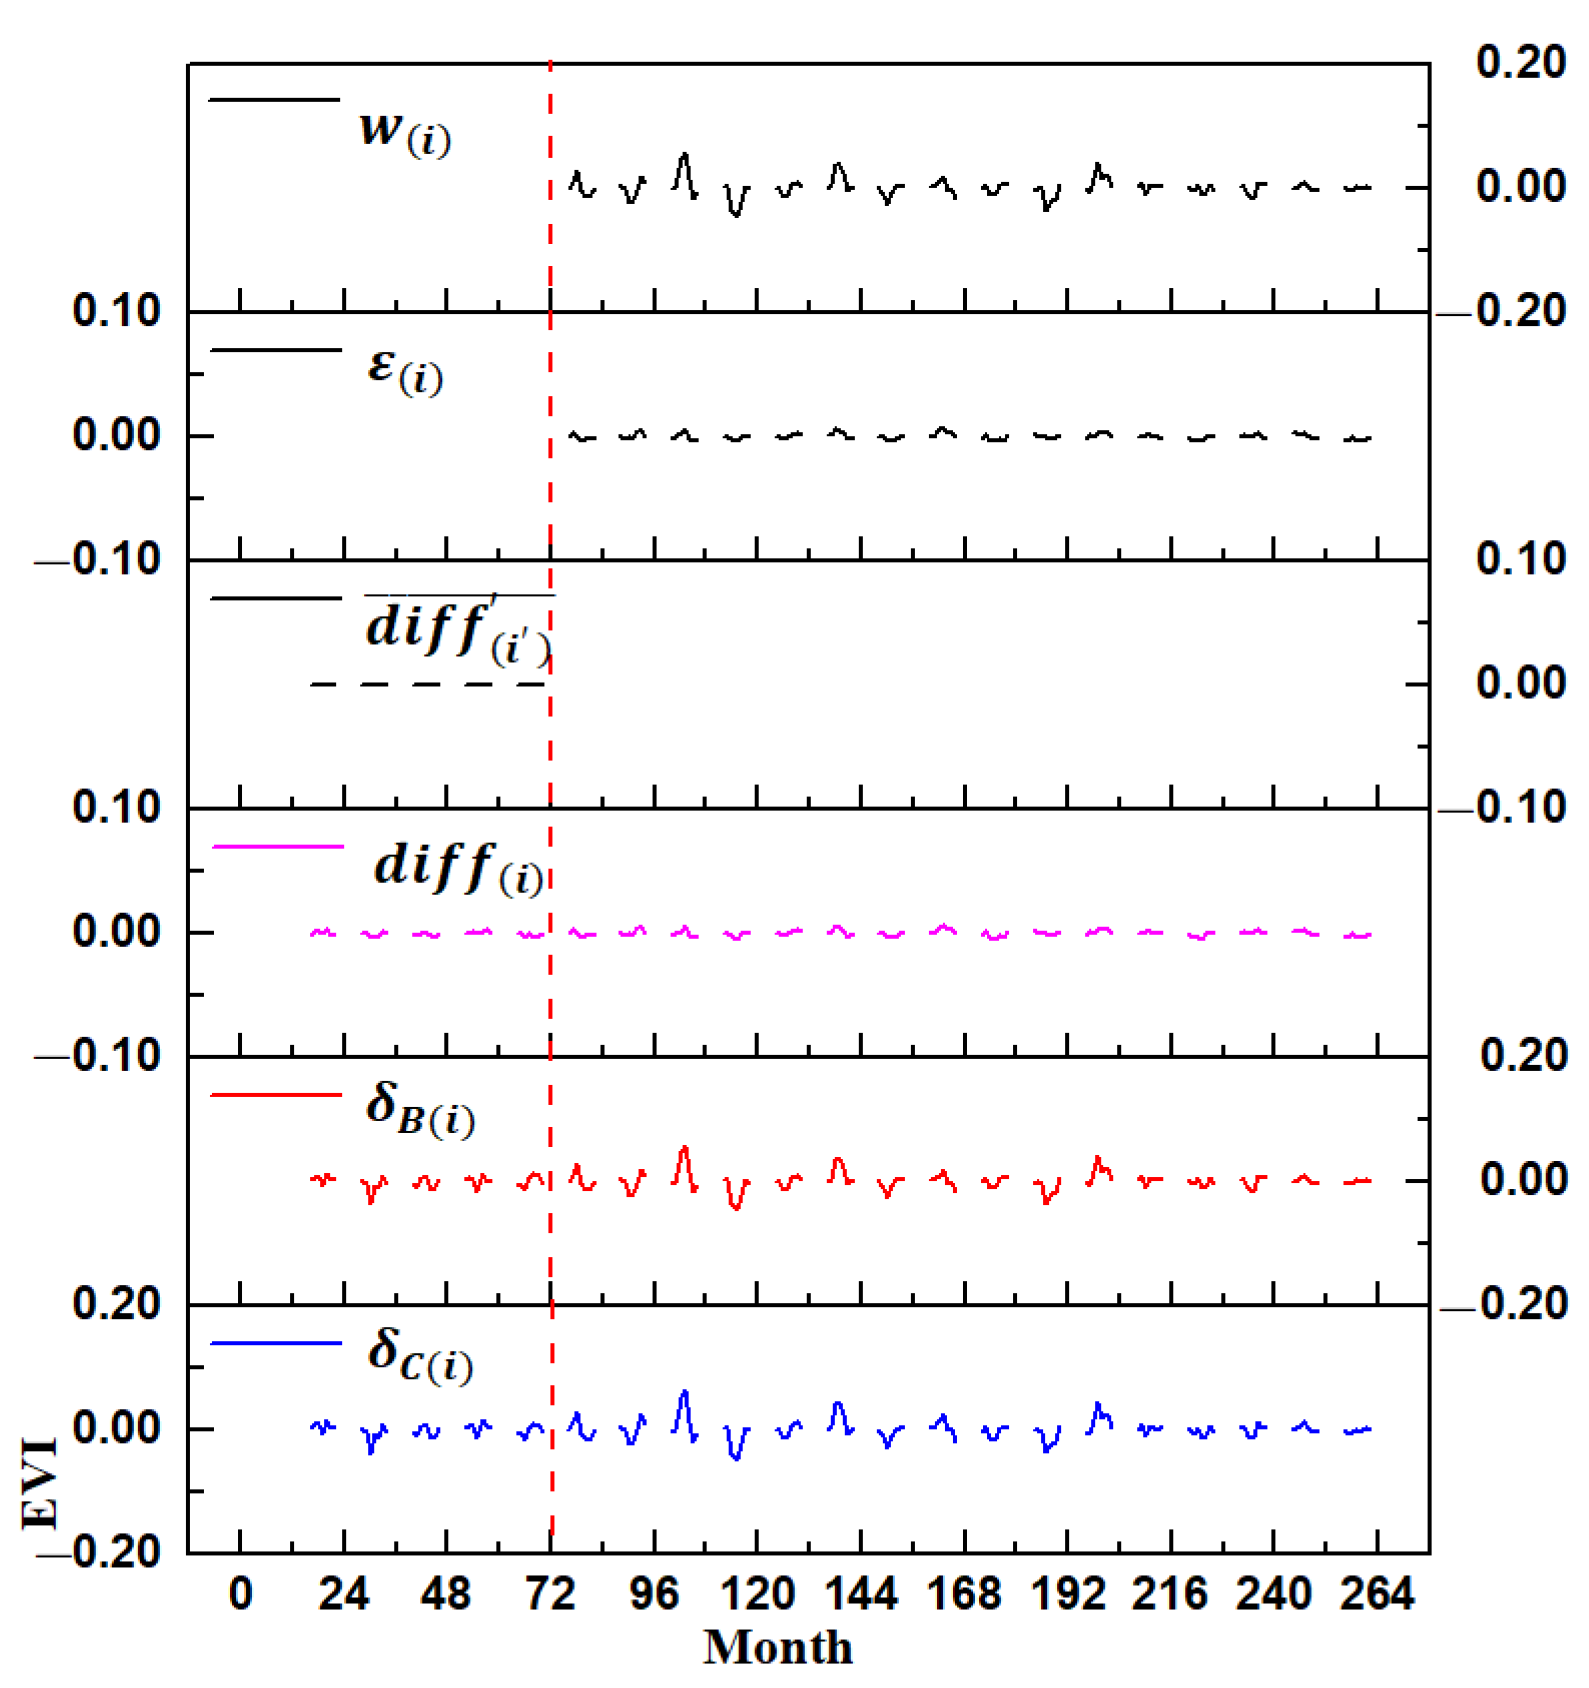
2.3.2. Quantitative Modeling of the Impacts of Climatic and Reconstruction Forces

We used a novel method to quantify the relative contributions of climatic and reconstruction forces to the EVI (Figure 2 and Figure 3).
Due to the periodicity of vegetative growth, we assumed that vegetation activity of the background area ( B E V I ) was affected only by the multi-year vegetation biomass ( E V I m a s s ) and the climate impact ( E V I c l i m a t e ), whereas that of the core area ( C E V I   ) was affected by these two factors and the reconstruction impact ( E V I r e c o n s t r u c t i o n ).
B E V I = E V I m a s s + E V I c l i m a t e
    C E V I = E V I m a s s + E V I c l i m a t e + E V I r e c o n s t r u c t i o n  
To eliminate the effects of the multi-year vegetation biomass as much as possible, we subtracted the EVI of the previous year ( E V I i 1 ) from the EVI of the current year ( E V I i ) to obtain the EVI variation of the background ( δ B i ) and core ( δ C i ) areas in that year.
δ B i = B E V I i B E V I i 1
δ C i = C E V I i C E V I i 1
Supposing adjacent areas have similar climate conditions, the difference ( d i f f i ) between the ( δ C i ) and ( δ B i ) was used to eliminate the effects of climate change.
d i f f i = δ C i δ B i
where d i f f i is the impact of reconstruction and spatial heterogeneity. Considering that there is no reconstruction impact before reconstruction, d i f f i was attributed to natural effects. We defined d i f f i before reconstruction as spatial heterogeneity ( d i f f i ¯ ) and calculated the impact of construction after reconstruction as follows:
ε i = d i f f i d i f f i ¯  
where ( d i f f i ¯ ) is the mean value of d i f f i before reconstruction and ε i is the reconstruction impact ( E V I r e c o n s t r u c t i o n ).
The effects of climate were calculated by removing the reconstruction impact as follows:
w i = δ C i ε i
Thus, the respective contributions of climate and reconstruction to vegetation dynamics were distinguished.
Distinguishing Dynamics: When the reconstruction and climate impact components were either positive or negative, the contribution ratios of climate ( W i ) and the reconstruction impact ( E i ) were calculated directly. The effect of climate was calculated by removing the reconstruction impact as follows:
E i = ε i δ C i × 100 %  
When the signs of the reconstruction and climate components were inconsistent, the difference between the two values ( d i ) was calculated, followed by the contribution ratio, and the effects of climate were calculated by removing the reconstruction impact as follows:
d i = ε i w i    
E i = ε i d i × 100 %
W i = w i d i × 100 %  

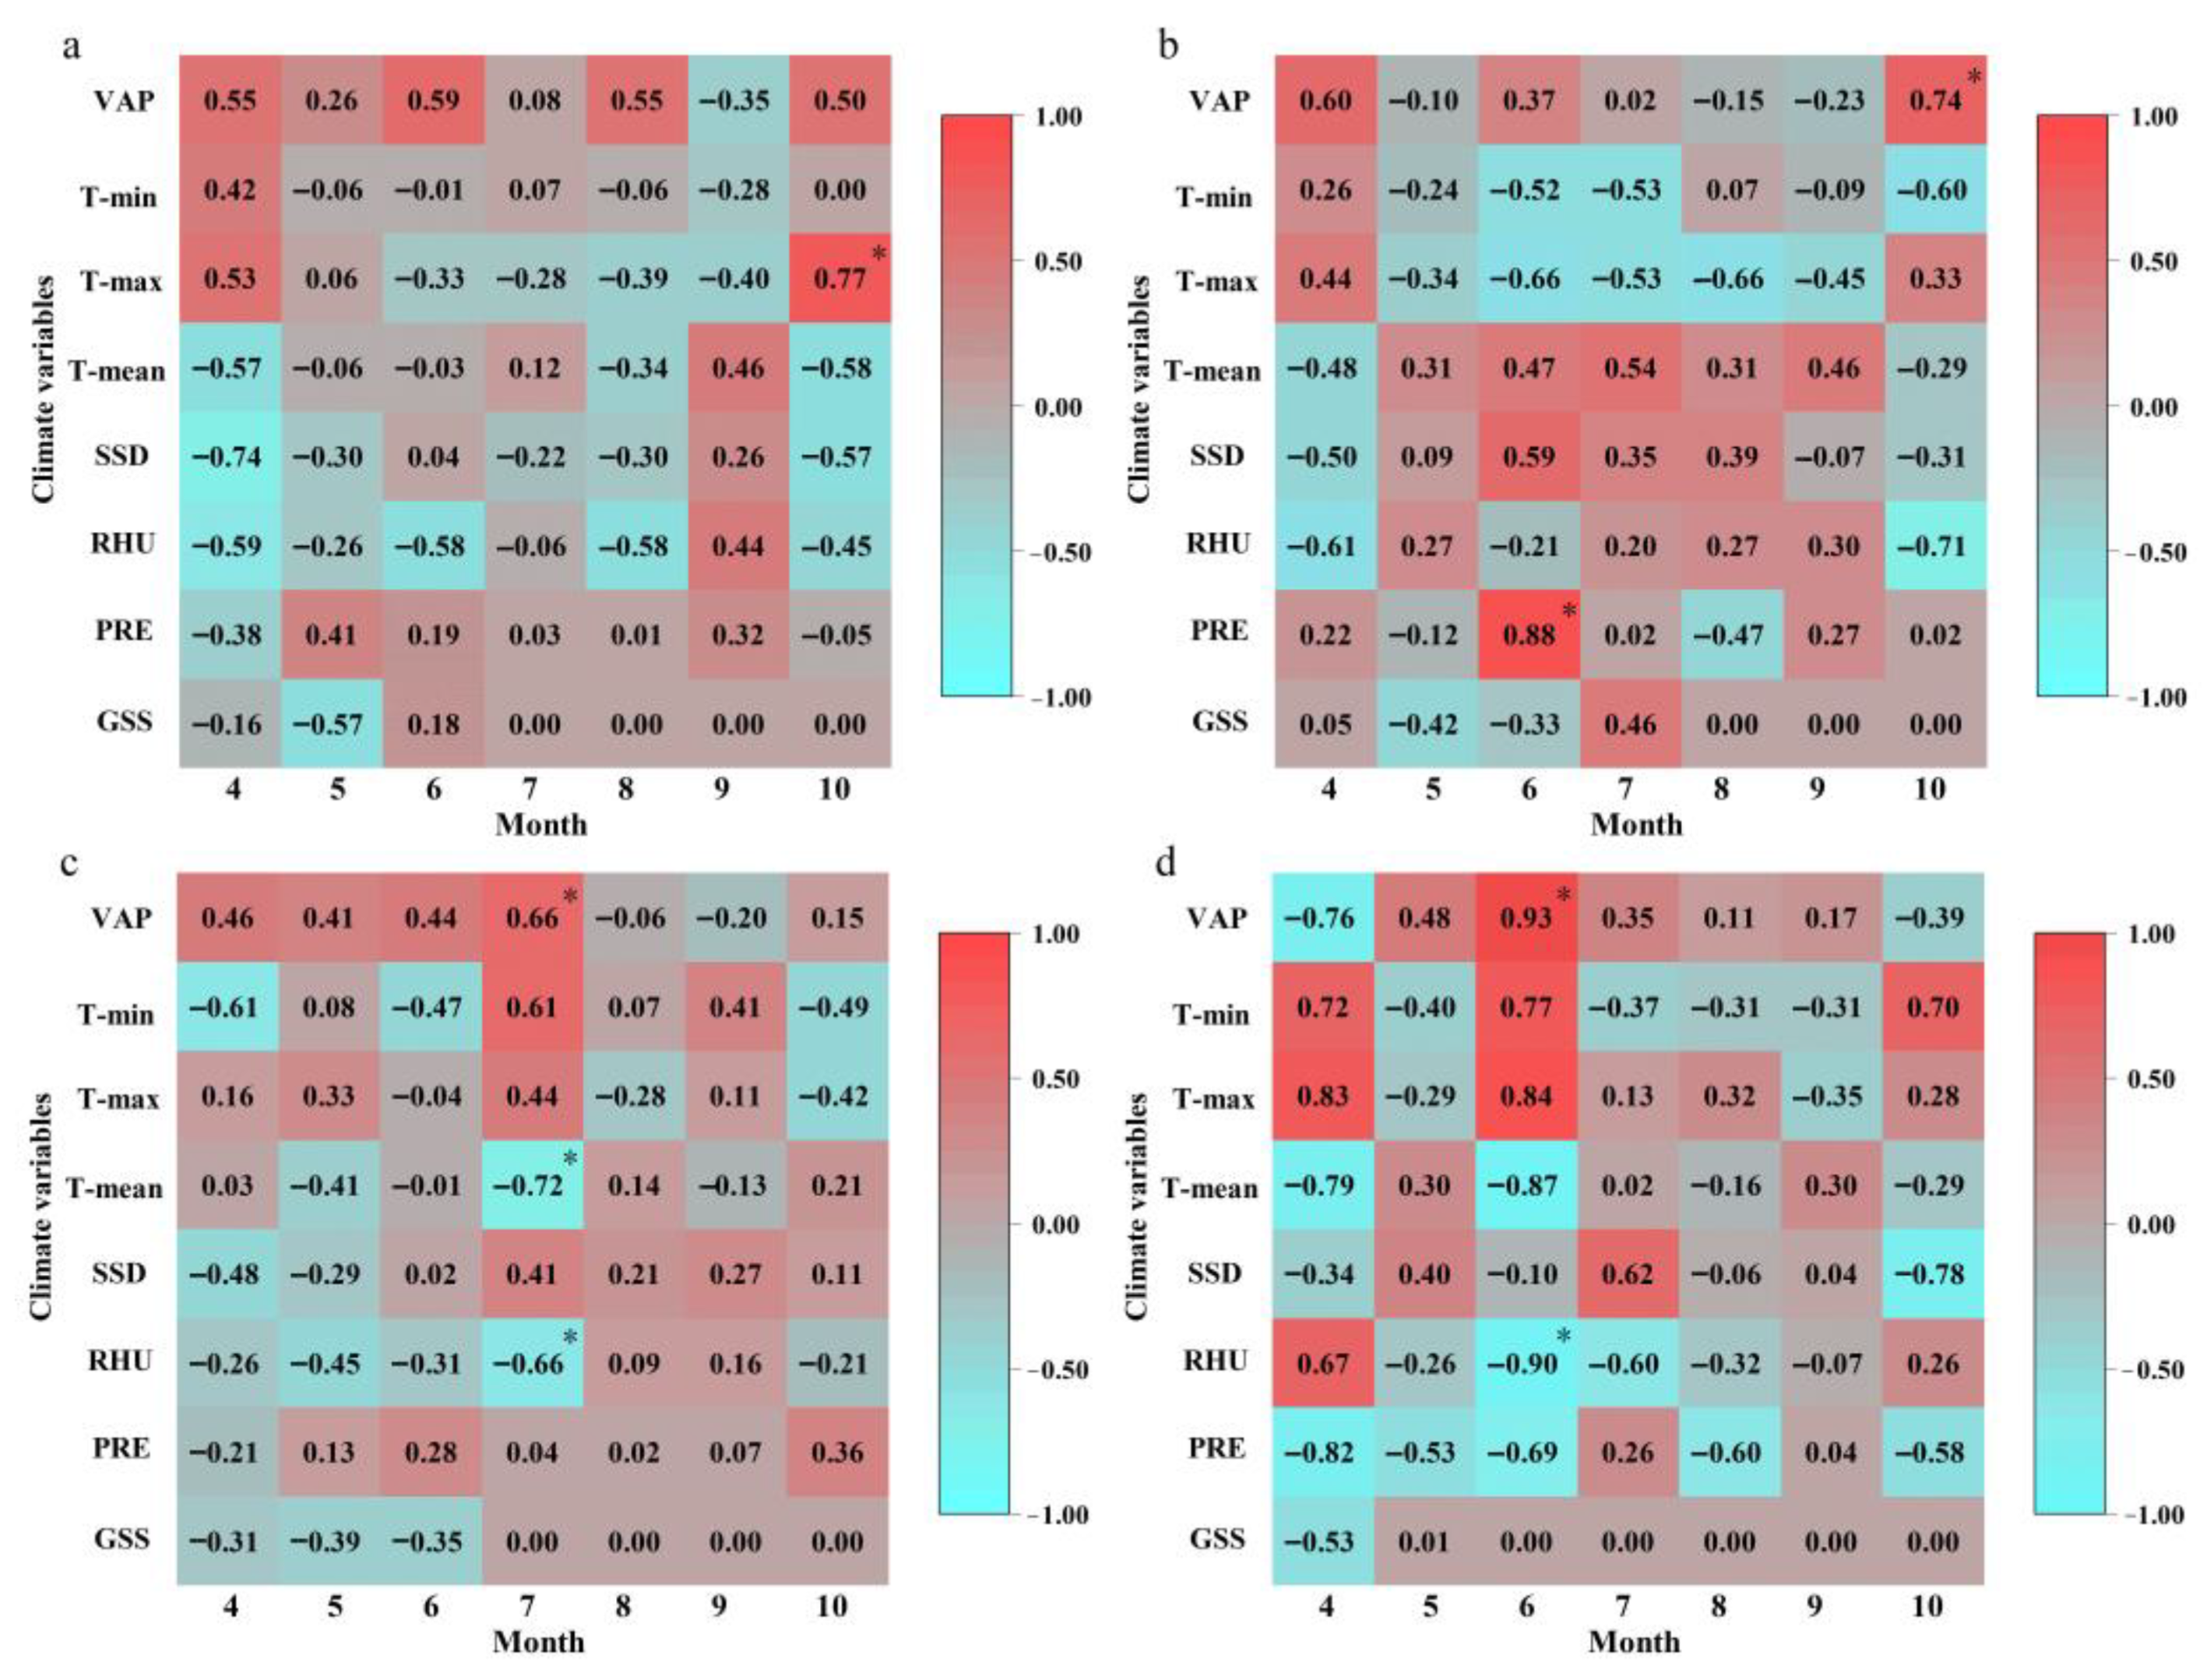
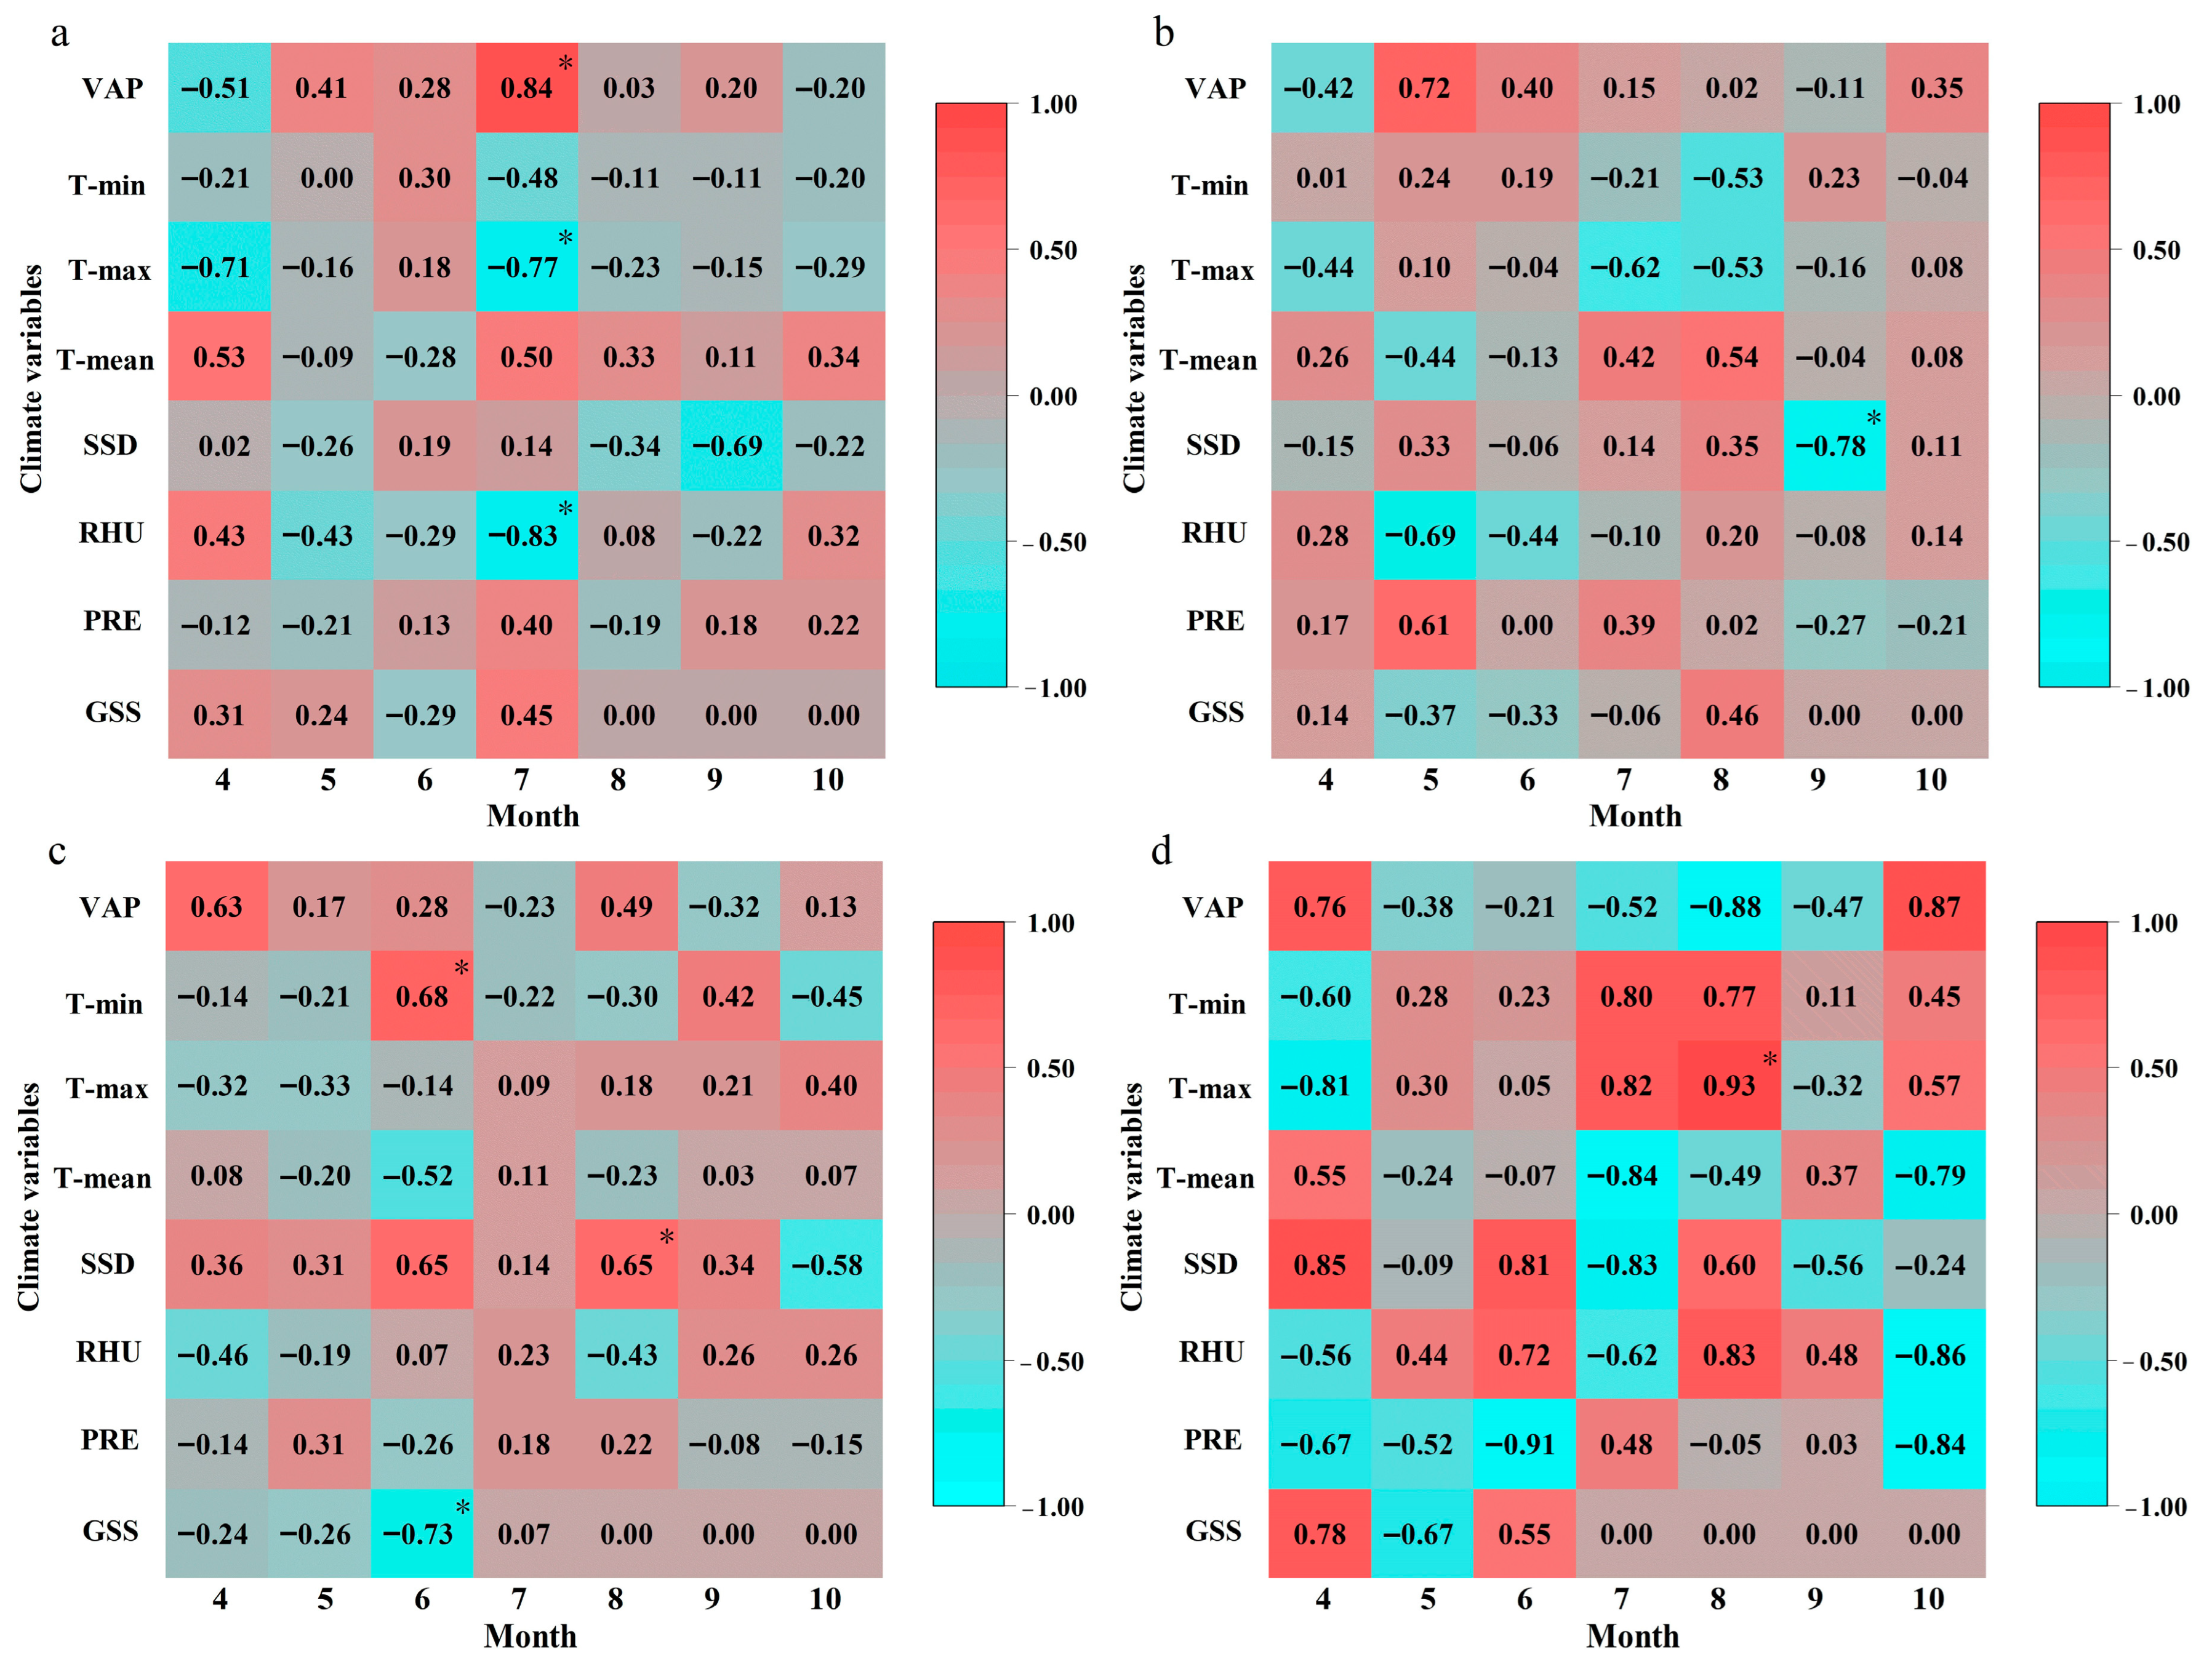
2.3.3. Relationships between Climatic Factors and Vegetation Activity

We used the structural equation model (SEM) to assess the direct and indirect effects of climatic factors on vegetation. The SEM is a multivariate statistical approach that synthesizes paths, factors, and maximum-likelihood analyses and provides inferences to underlying deterministic processes [28]. We performed a model with all possible paths with prior knowledge and then adjusted the paths according to the running result parameters to make them achieve the best-fit status. The best-fit SEM was selected by the root mean-square error of approximation (RMSEA) index (0 ≤ RMSEA ≤ 0.08), goodness-of-fit (GIF) index (GIF ≥ 0.80), and other indices [40,41]. SEM analysis was performed using the AMOS 24 software (Amos Development Corporation, Chicago, IL, USA) [42].
To further analyze the interactive mechanism and lag effects of climate variables, we calculated partial correlation coefficients (R) between time series of the EVI and the climate variables. Partial correlation analysis is a geostatistical method based on correlation analysis [43] that effectively eliminates other influencing factors and is more accurate and reliable [44]. Then, to investigate the time-lag effects of climatic factors on vegetation activity, the lag time was determined for each climatic variable as the months preceding the vegetation activity period in which the mean climatic variable had the largest partial correlation coefficient with the growing-season EVI. We limited the lag-time range to 0–3 months before the vegetative activity period during the growing season and to a monthly scale. A p-value of 0.05 was considered to indicate statistical significance.

3. Results

3.1. Spatiotemporal Changes in Vegetation Activity

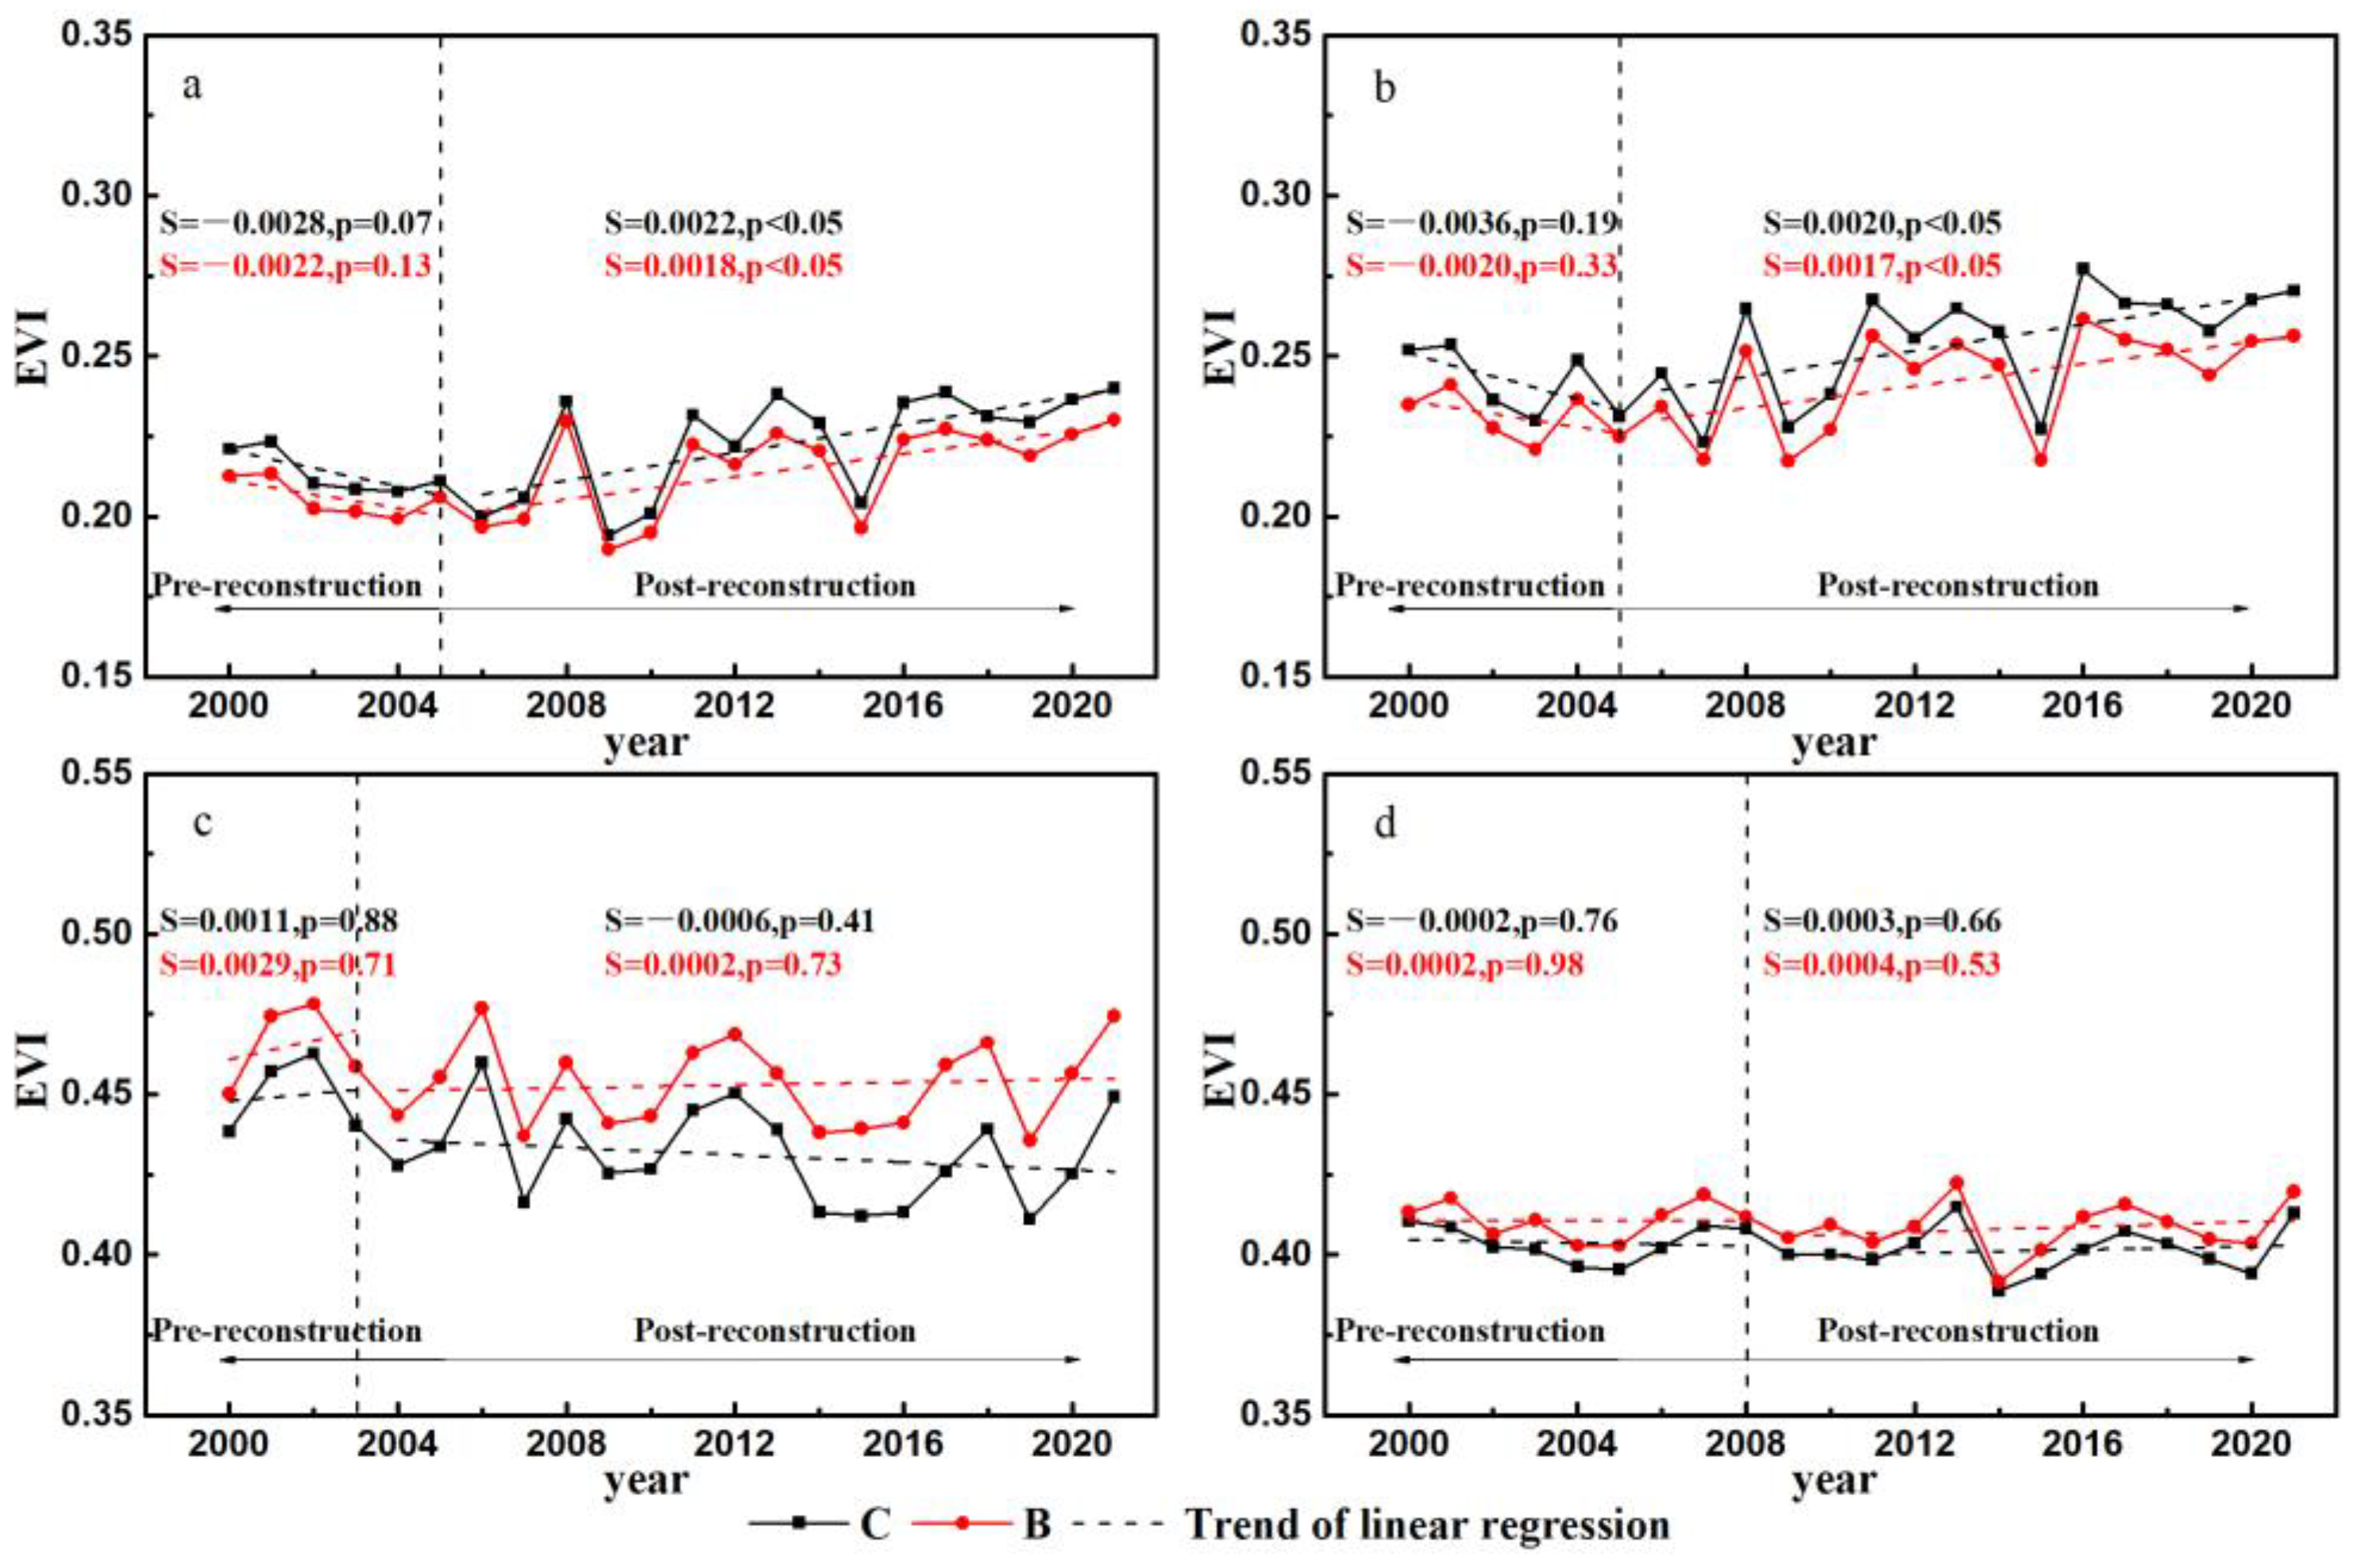
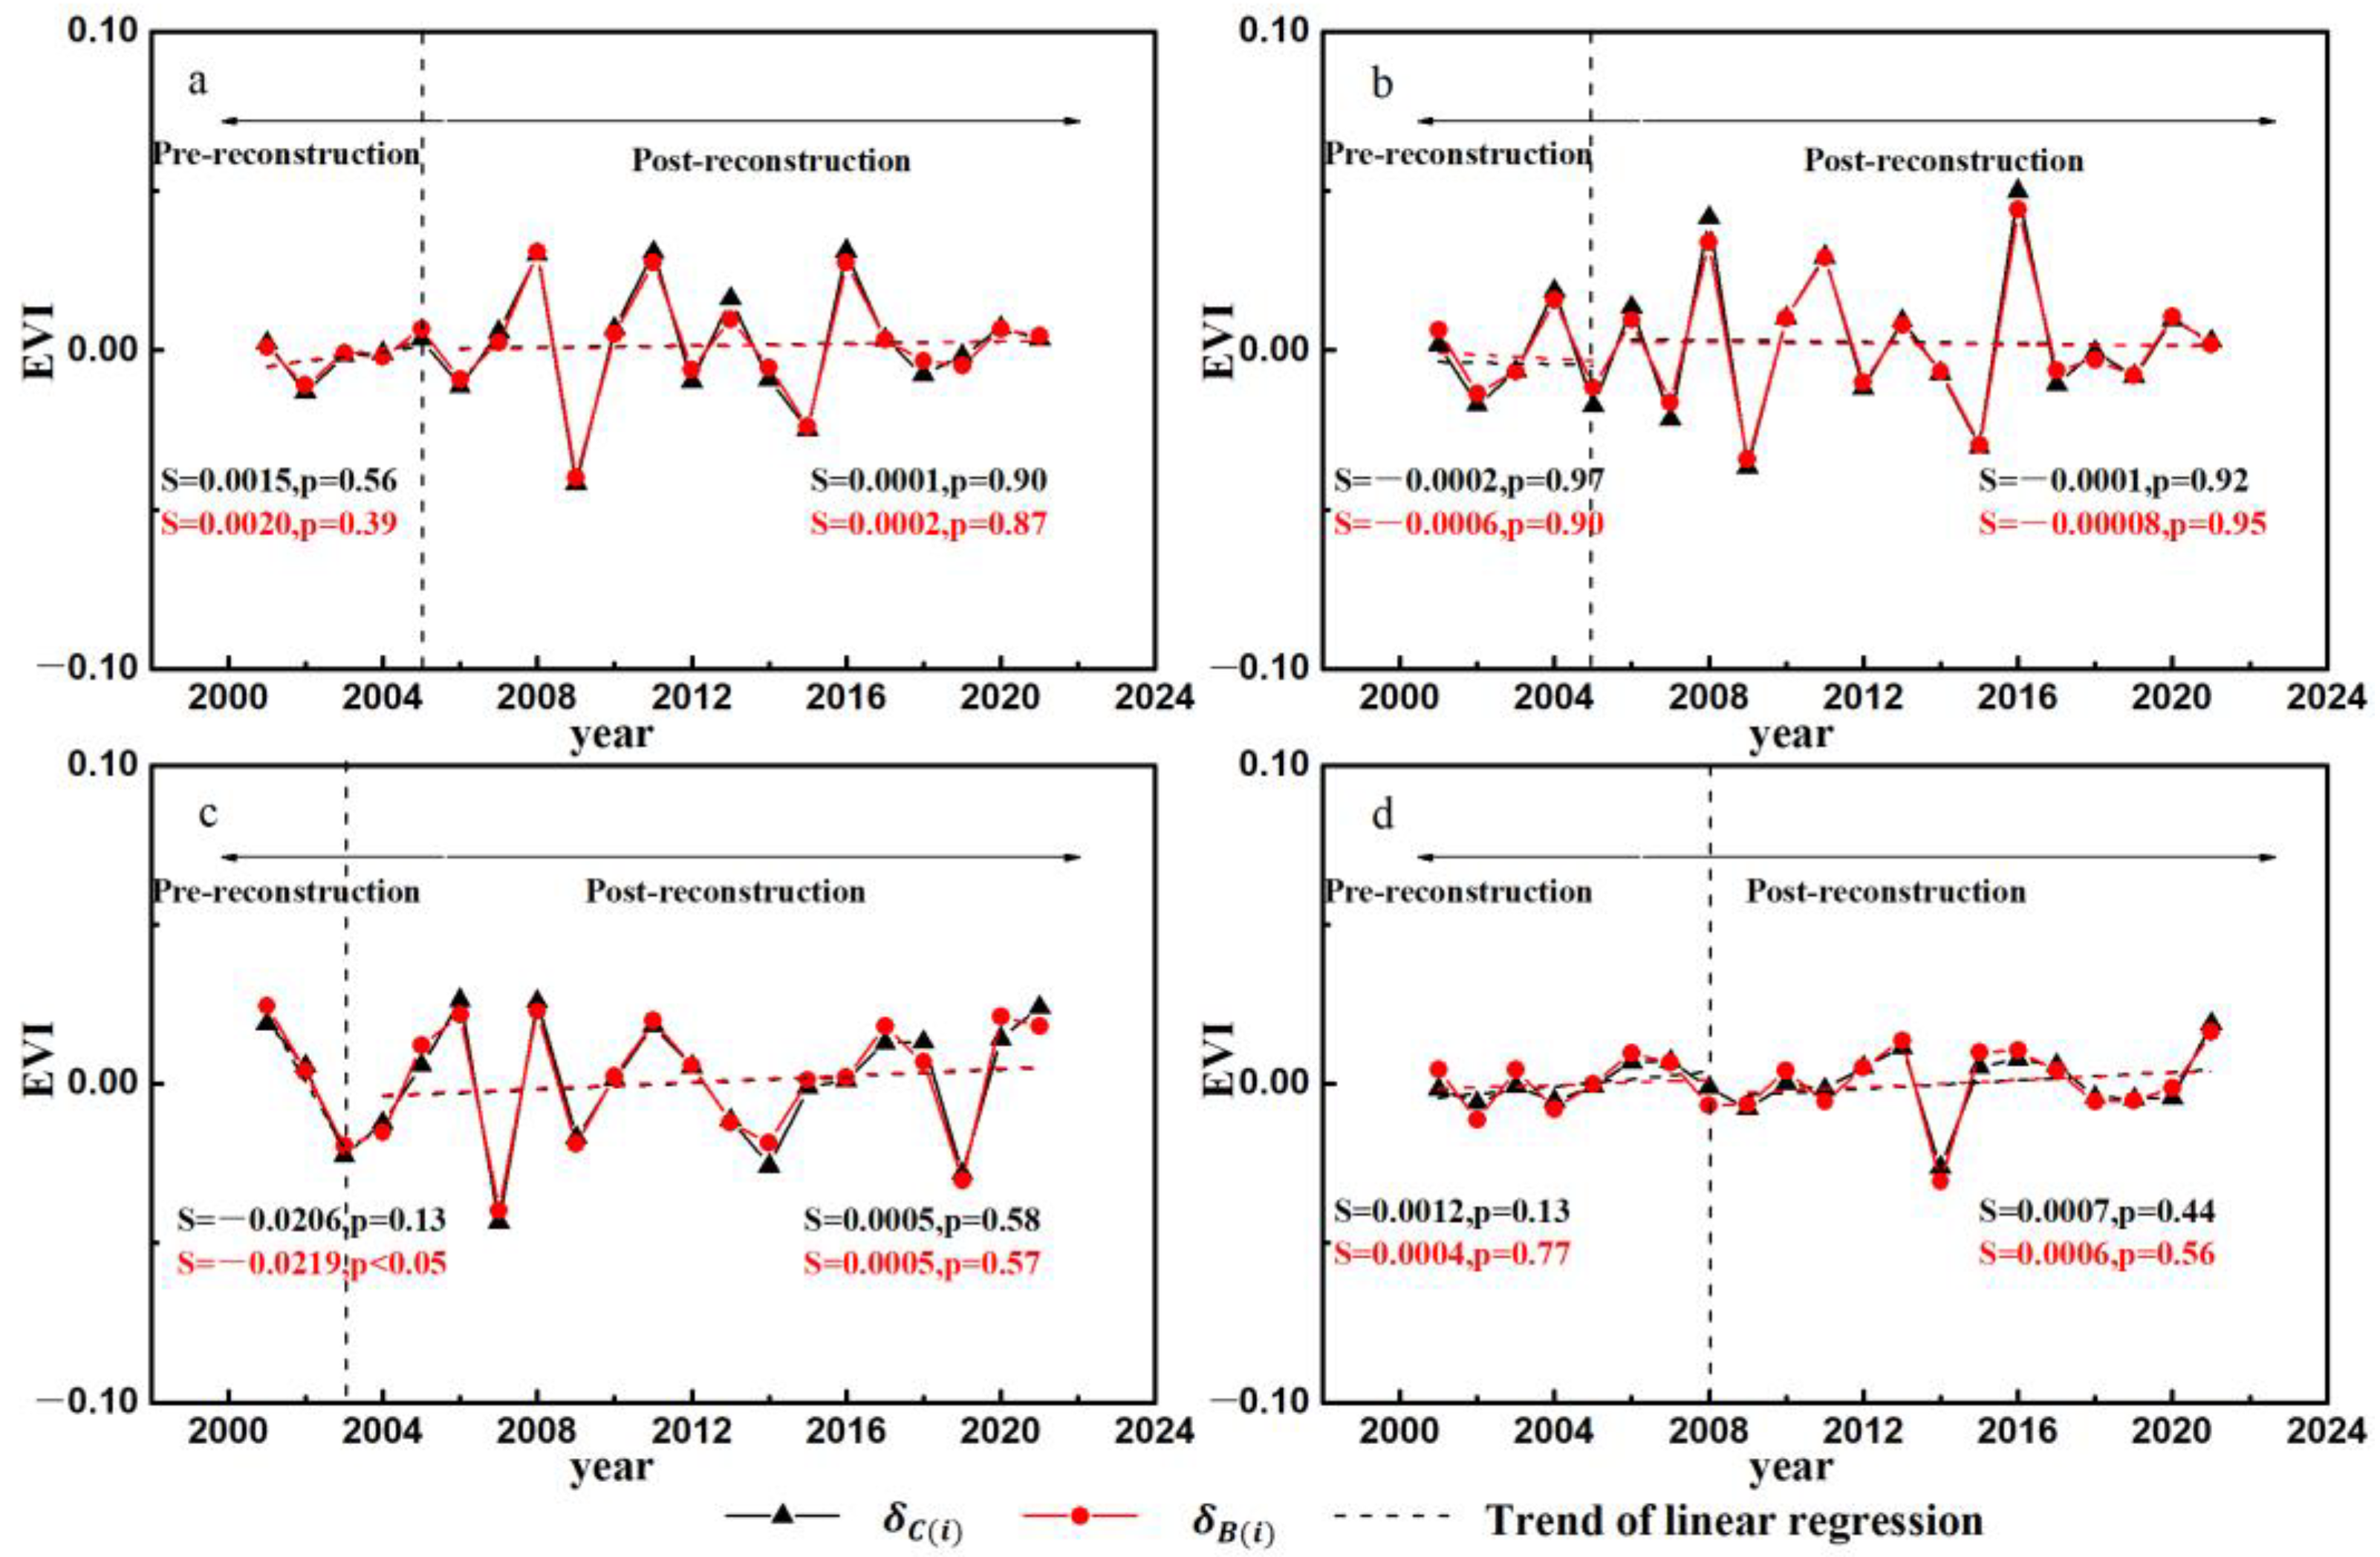
3.1.1. Trends and Interannual Variation in the Growing-Season EVI

Figure 4 illustrates the variation in the mean growing-season EVI before and after reconstruction. The mean growing-season EVI in the core area of the LN and NE sections was slightly shorter than that in the background area, and both showed less variation after reconstruction, whereas these were larger in the core area of the western sections (WS and SL), with significant trends of 0.0022 year−1 and 0.0020 year−1, respectively, (p < 0.05) after reconstruction. These results suggest that vegetation activity increased after highway G318 reconstruction in the western sections of the TG318, whereas vegetation activity was inhibited in the central and eastern sections after reconstruction.
We further investigated variations in the EVI on a monthly scale to assess the vegetation changes during the growing season. Although a single-peaked distribution was prevalent, with maximum EVI values in July across the TG318, variations in the monthly trend of the EVI showed significant spatial heterogeneity in different sections (Figure 5). The EVI increased significantly after reconstruction in the WS and SL sections during the almost-growing-season months (except June and July), particularly during August–October. However, the EVI along the two eastern sections showed a significant increase only in October, with rates of 0.010 decade−1 and 0.014 decade−1 for the core and background areas in the LN section and 0.030 decade−1 and 0.027 decade−1 in the NE section, respectively.

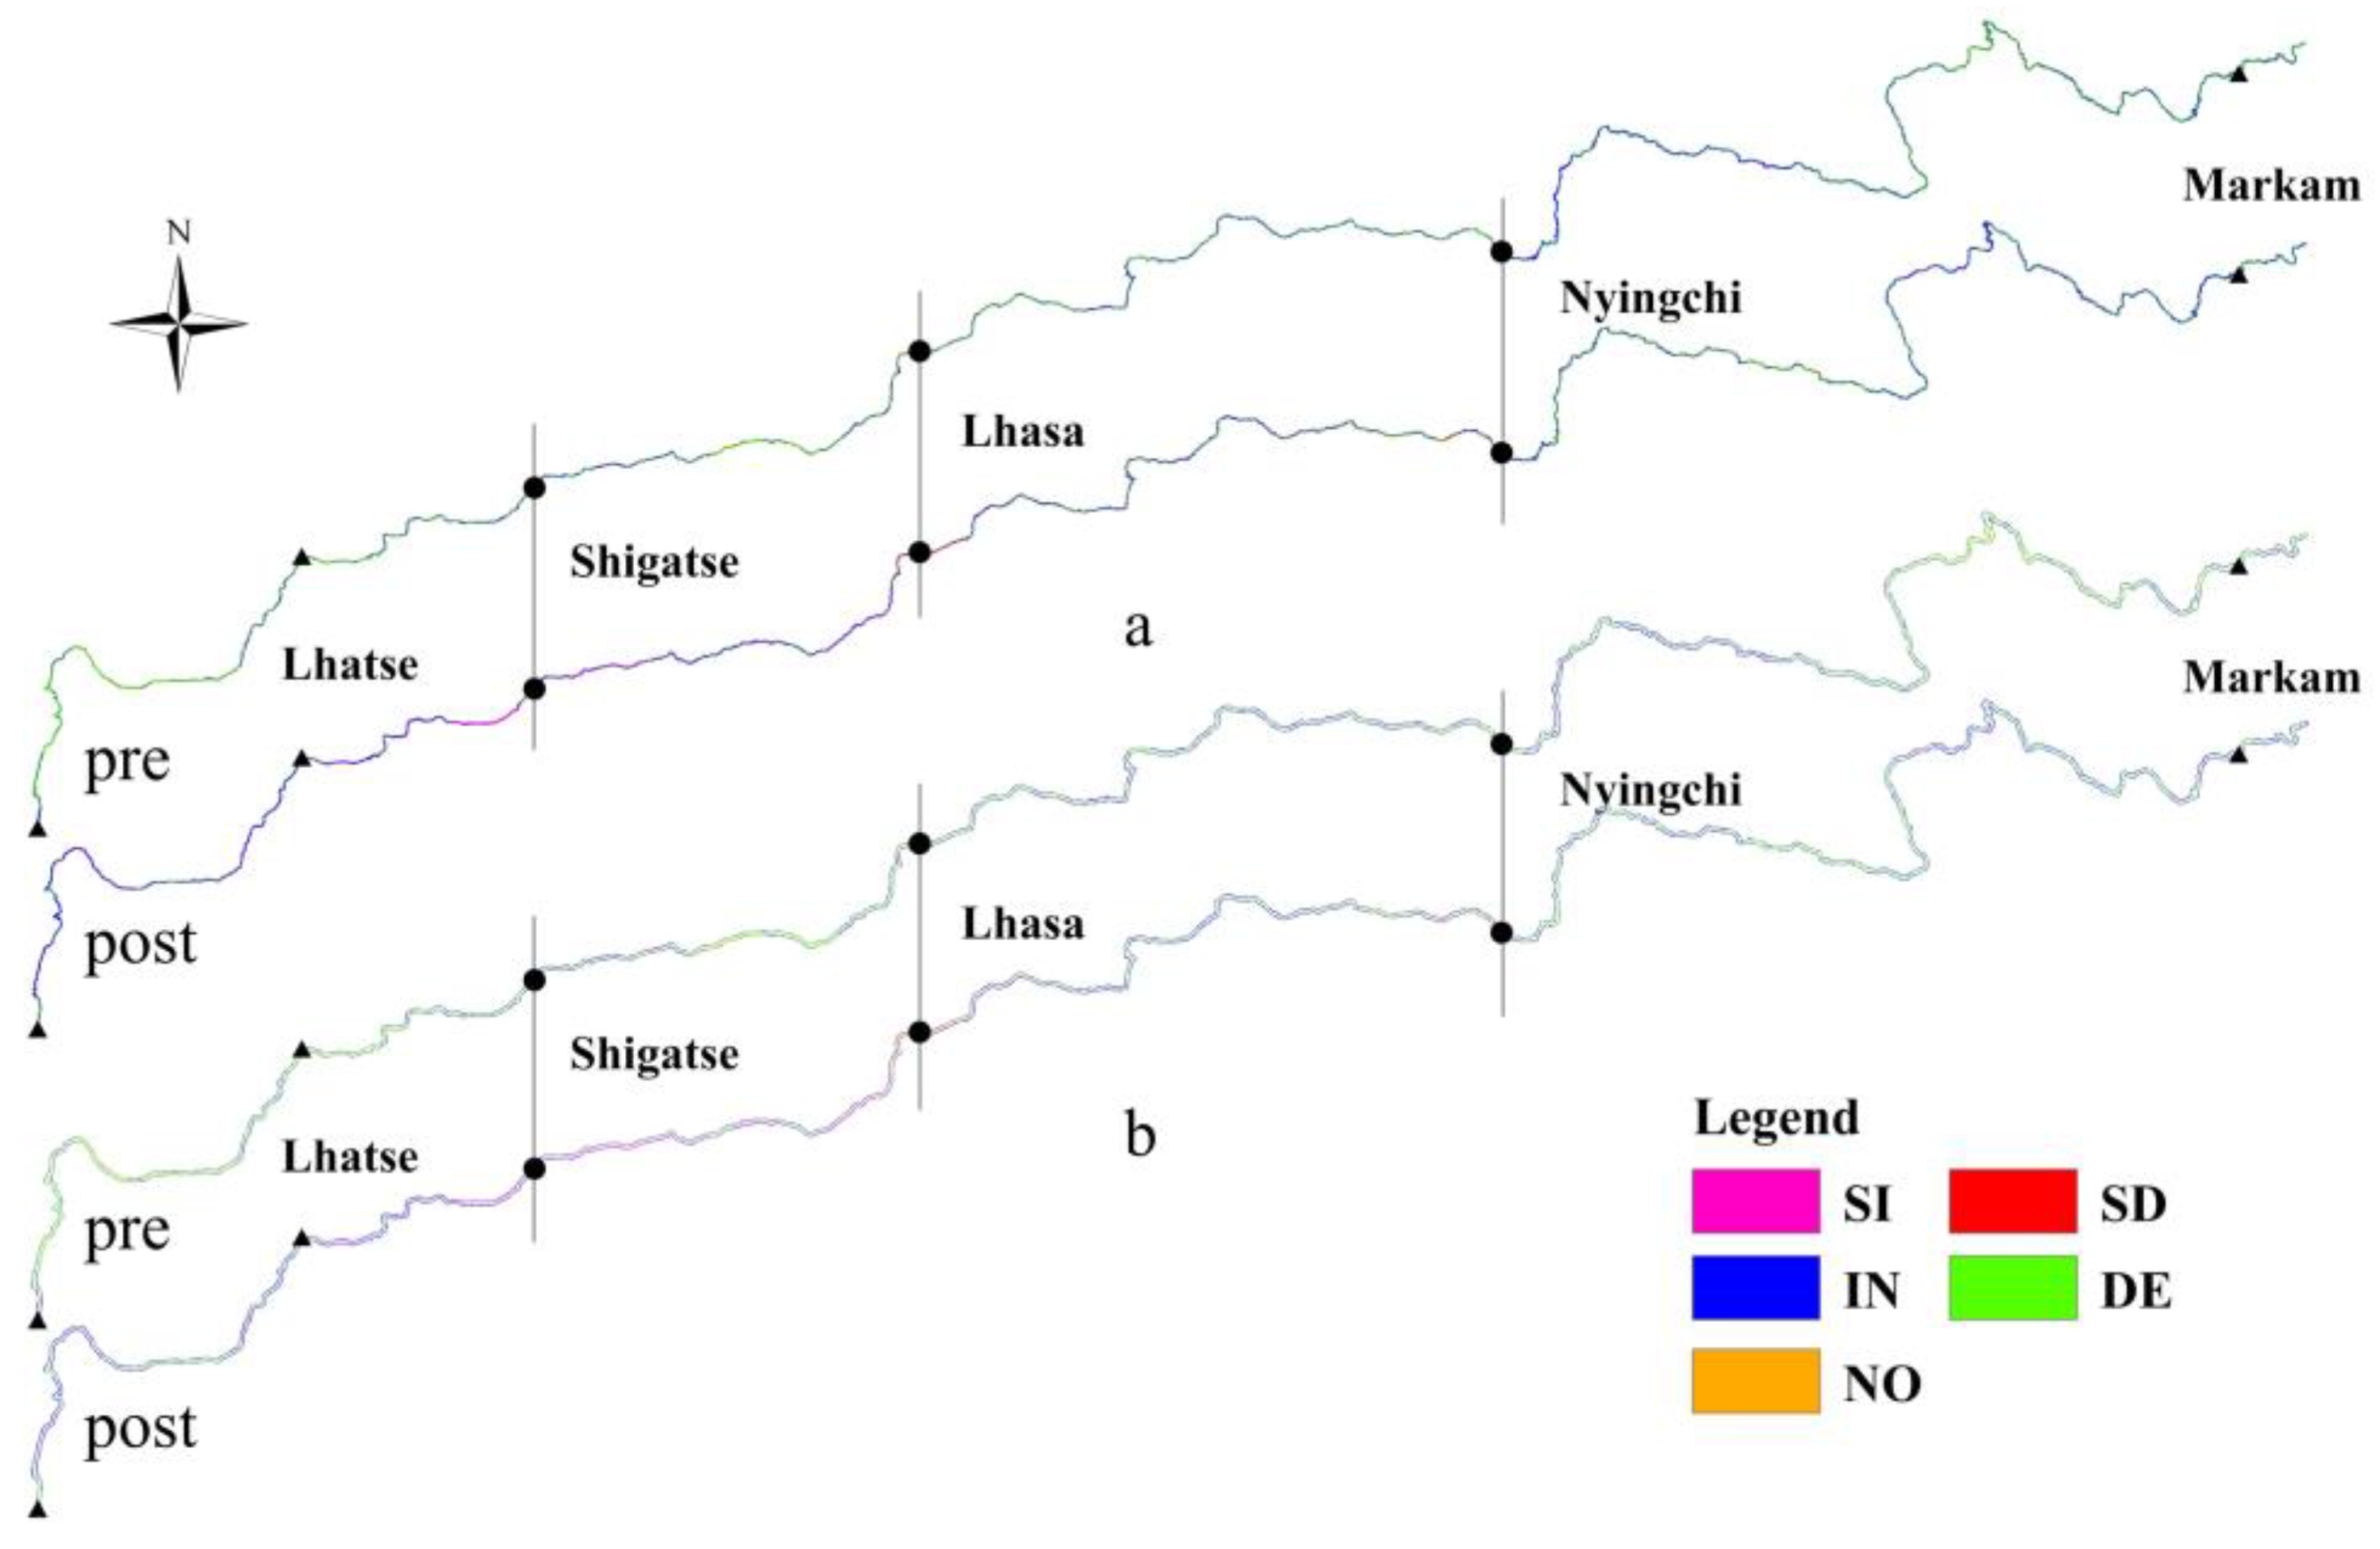
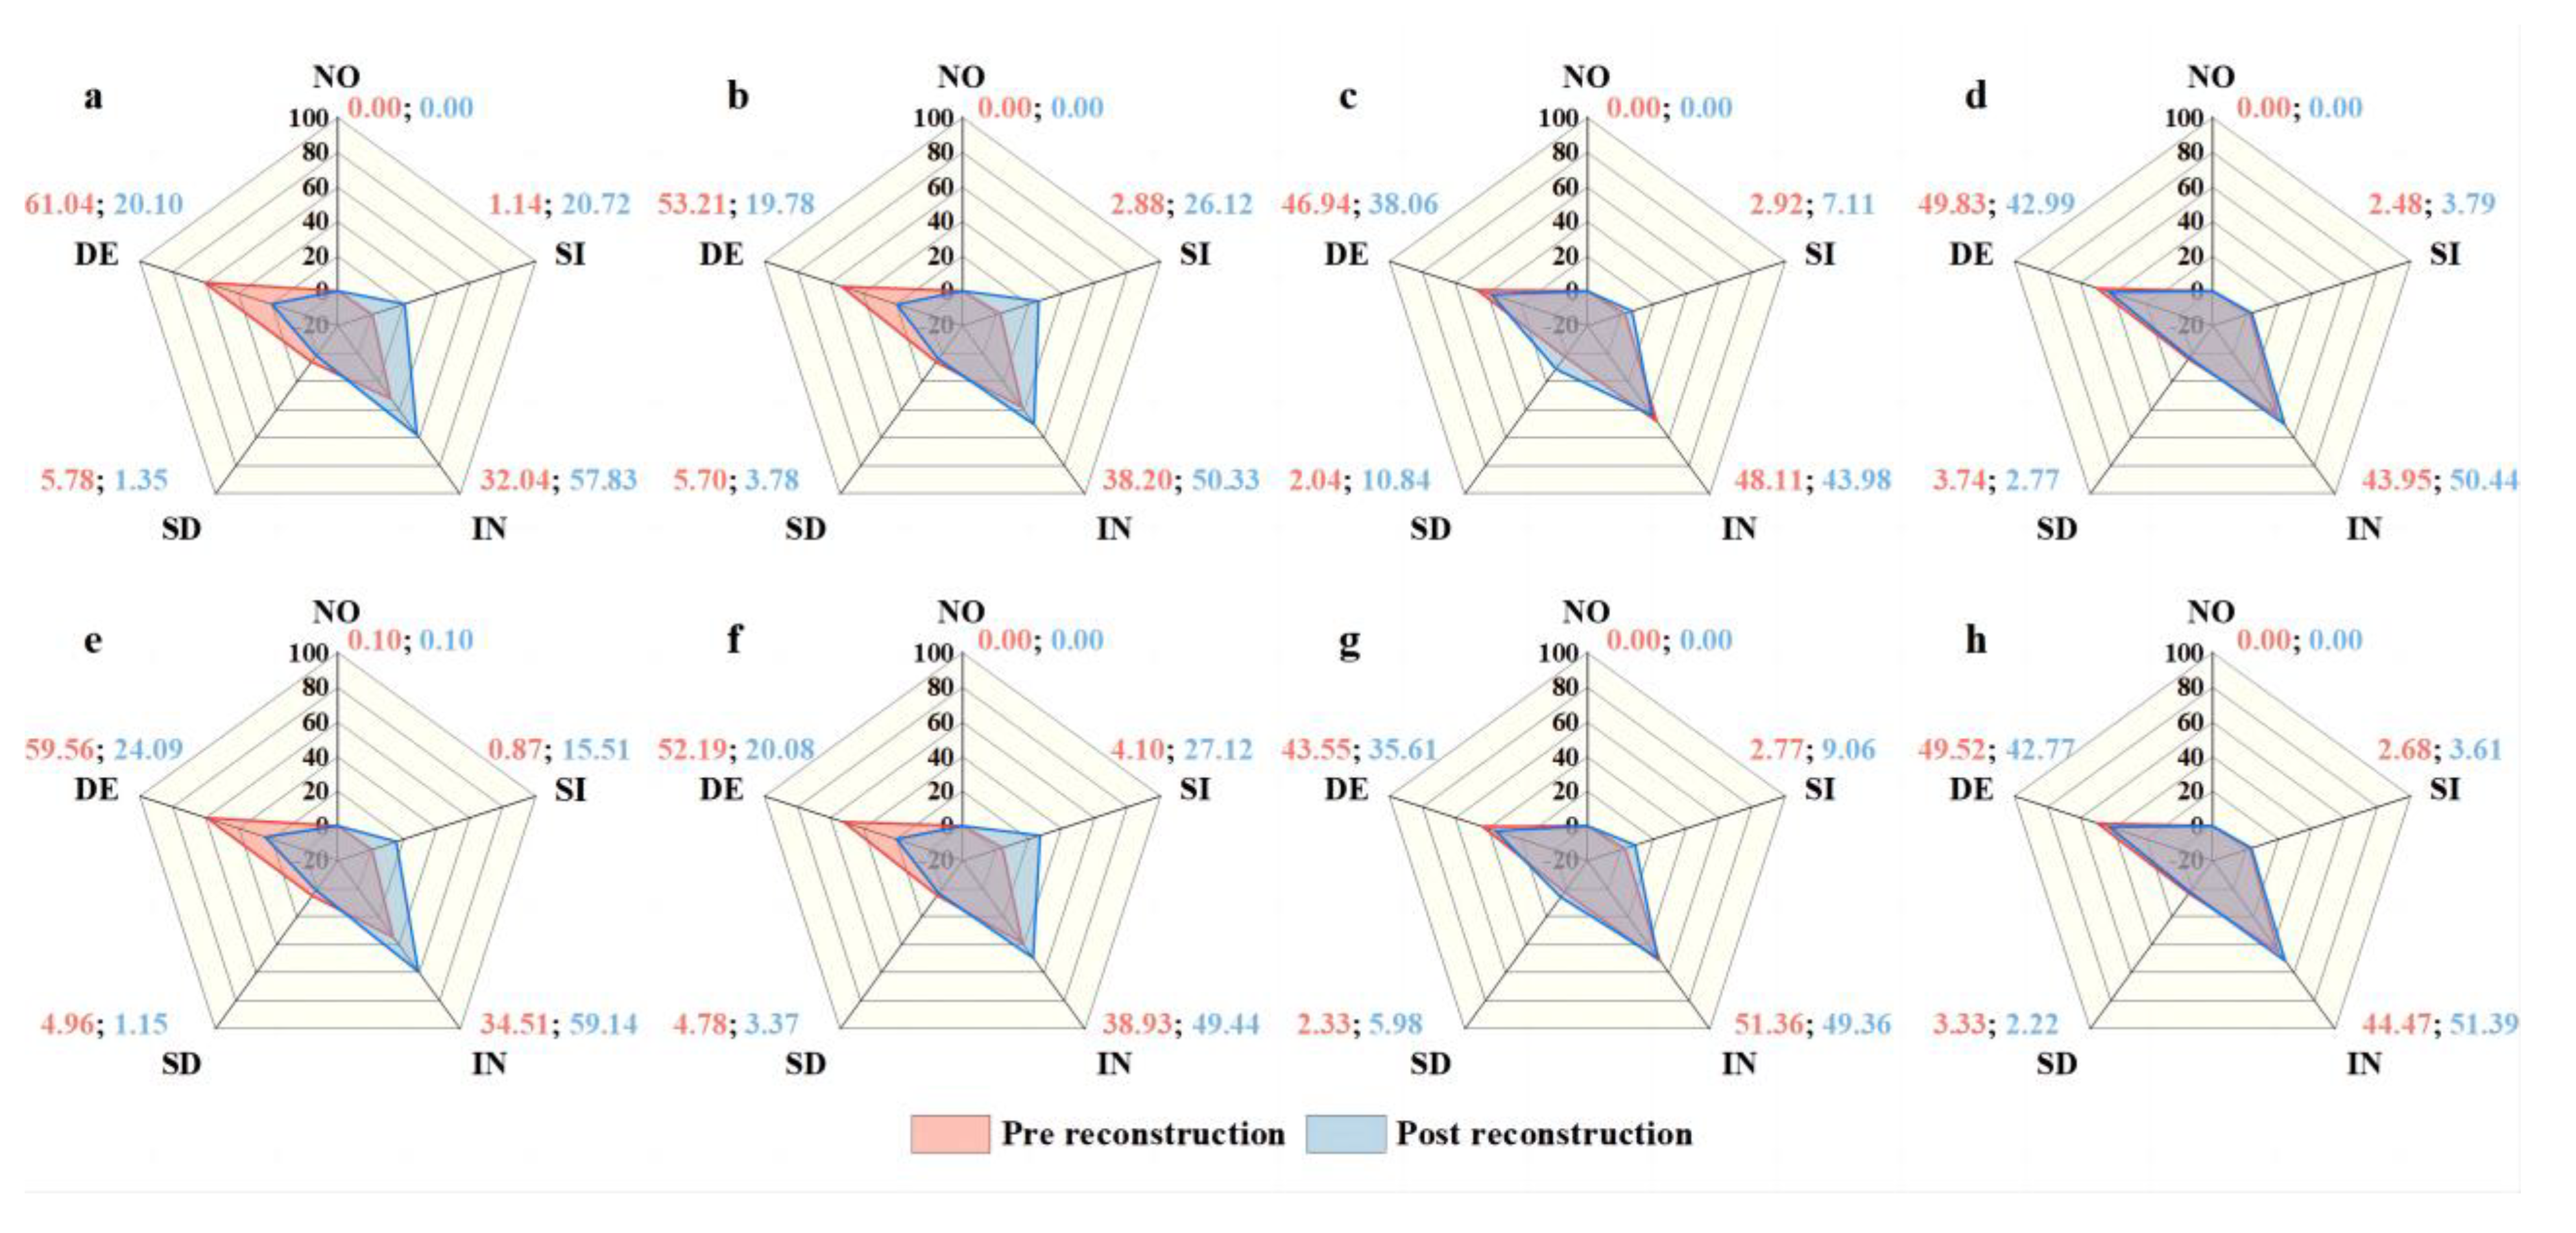
3.1.2. Spatial Variation of the EVI

Spatial heterogeneity in the EVI was noticeable at the growing-season scale (Figure 6). The mean growing-season EVI increased in the core area across the sections WS and SL after reconstruction, representing 78.65% (20.72% significant) and 76.45% (26.12% significant) of all pixels, respectively, whereas the pre-reconstruction stage was mainly dominated by decreases. In contrast, areas toward the eastern sections of the TG318 core area exhibited a notable spatial difference, with increases accounting for only 51.09% (7.11% significant) after reconstruction in the LN section and 54.23% (3.79% significant) in the NE section, which was consistent with the pre-reconstruction period. Similar patterns were detected for the background area of these sections (Figure 7).

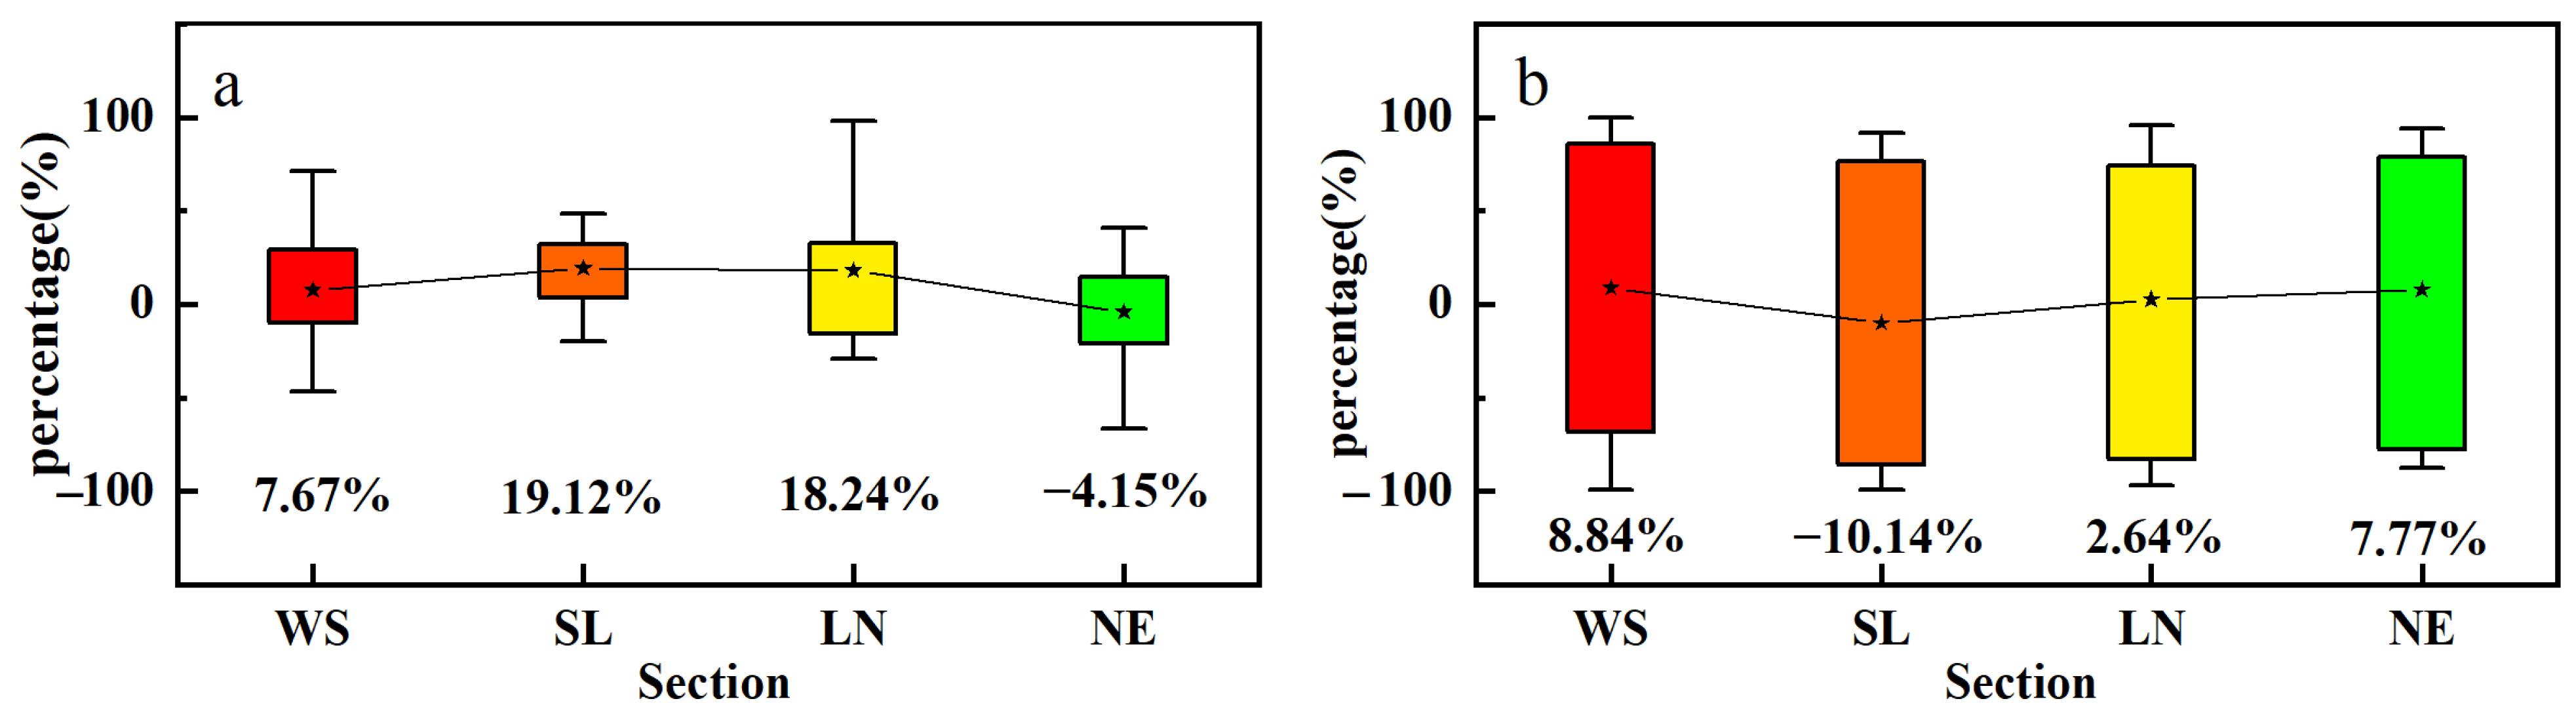
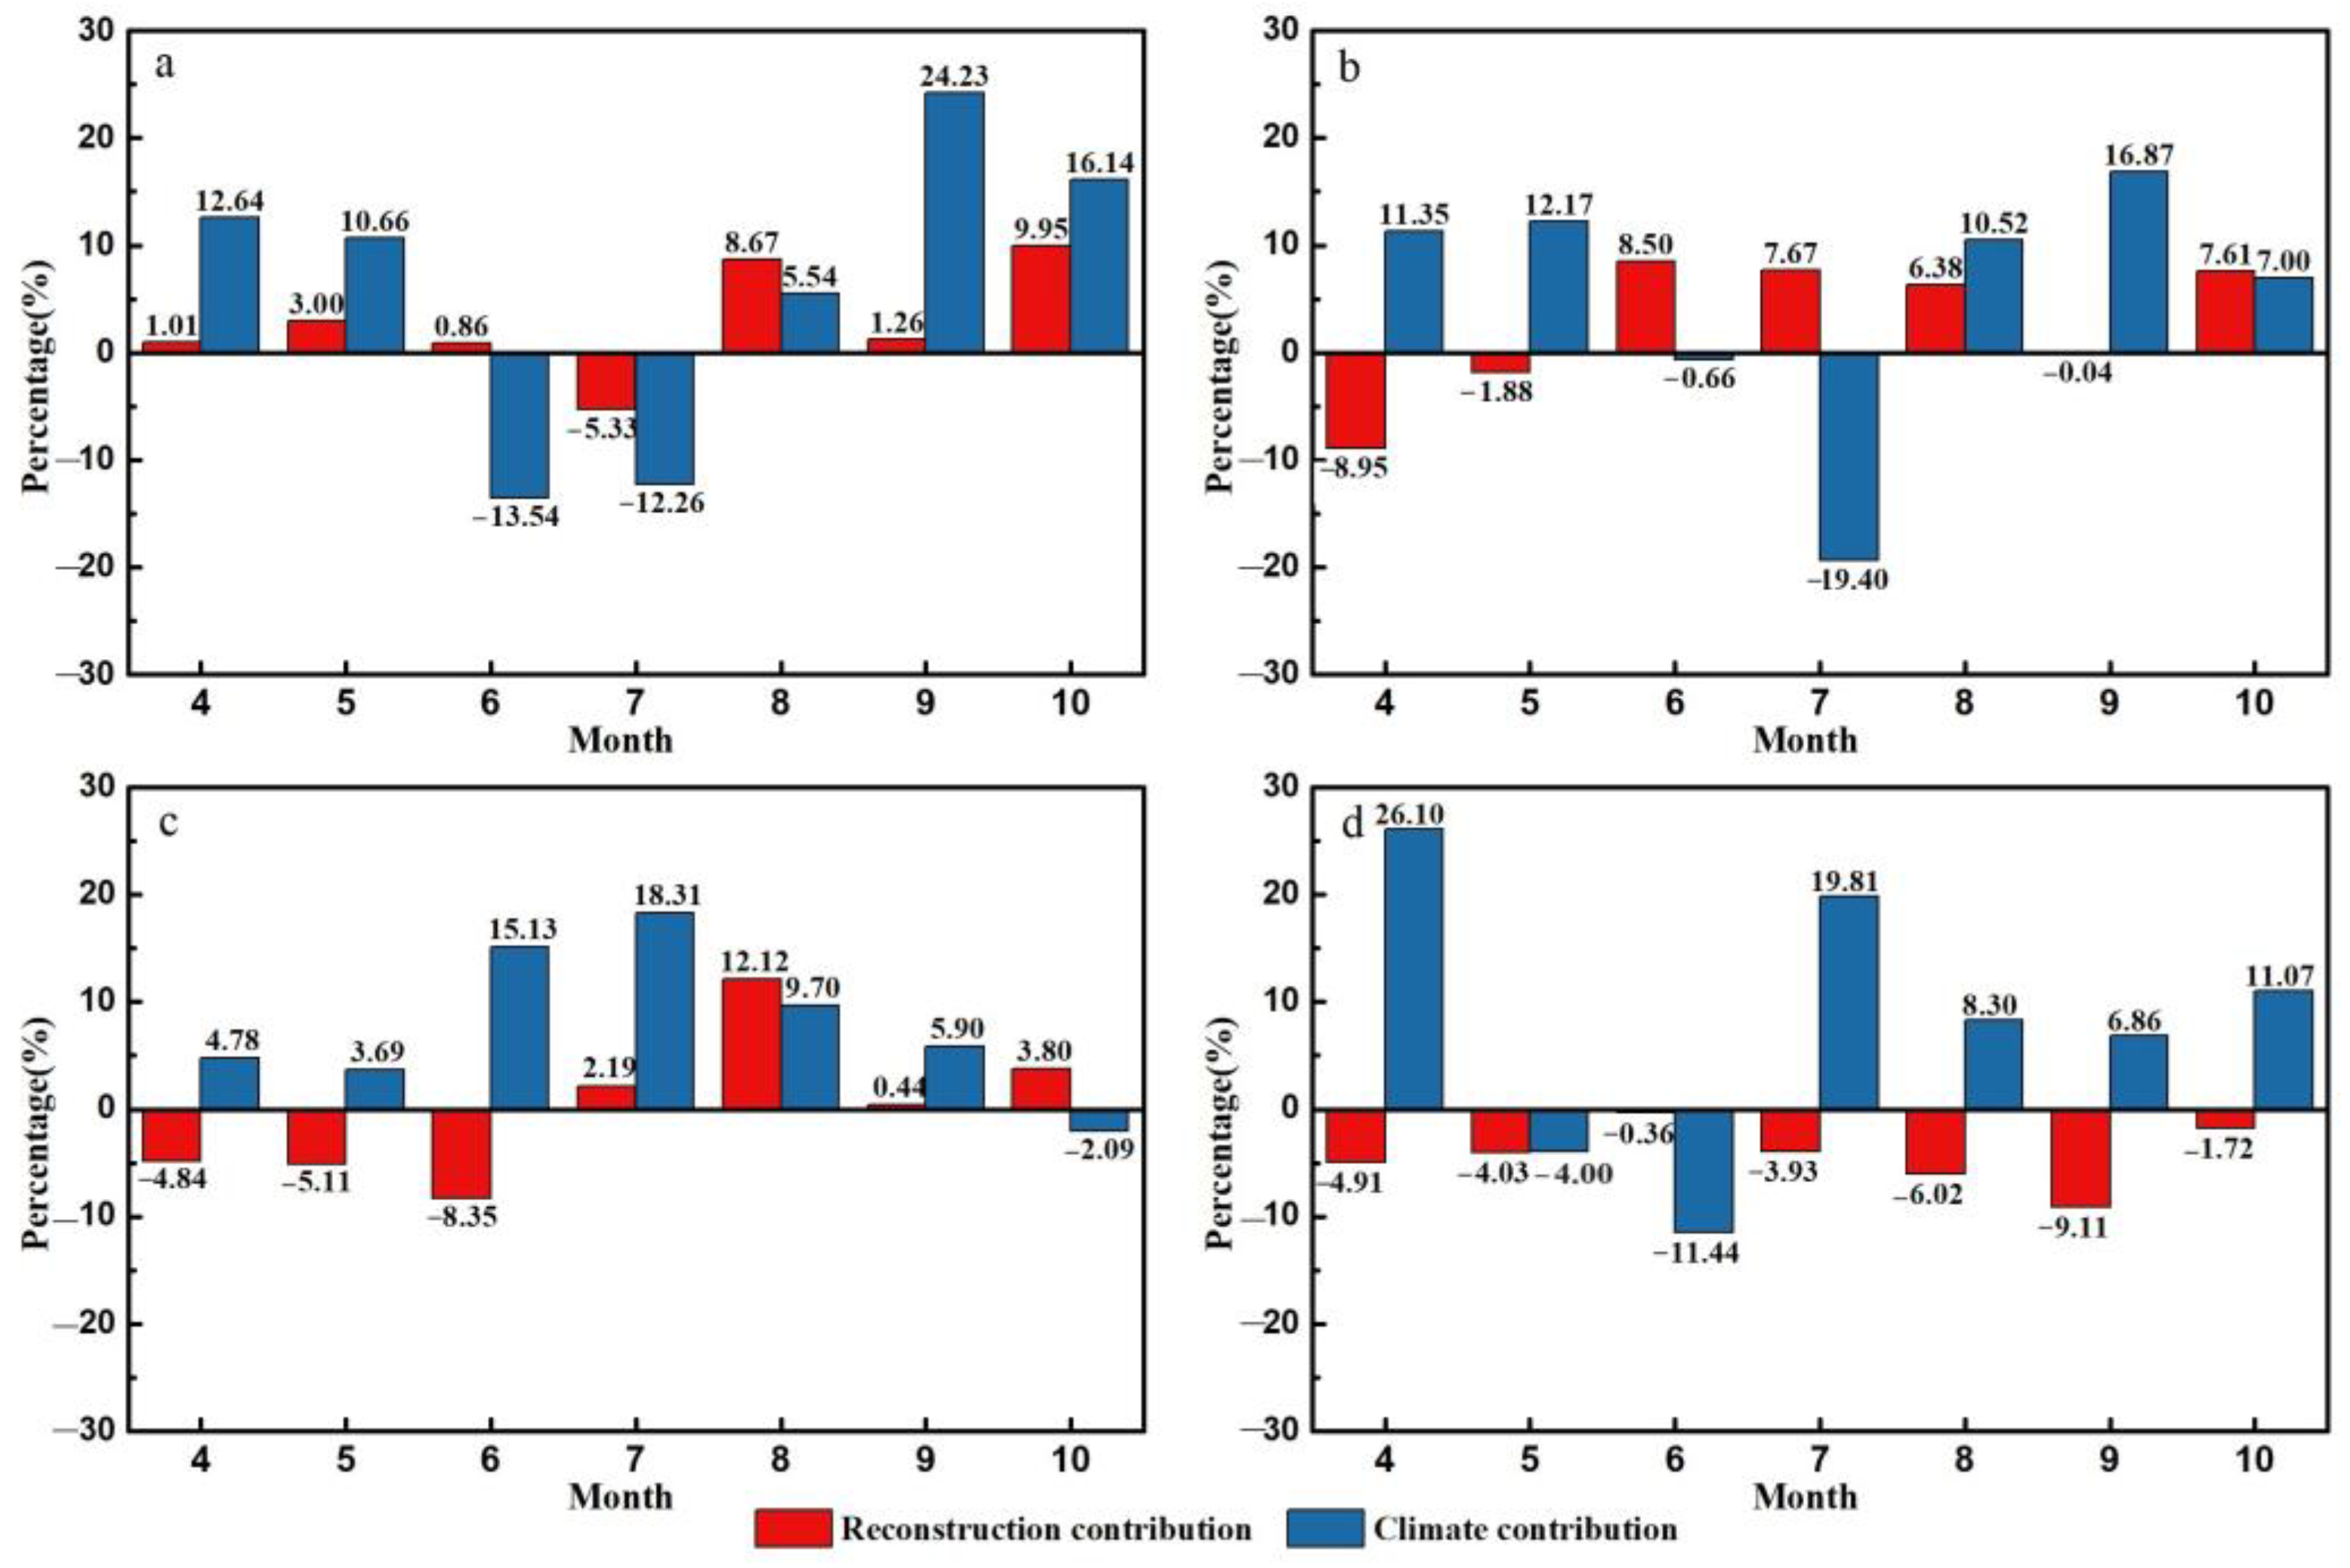
3.2. Impacts of Climate Change and Reconstruction on Vegetation Activity

The fluctuation in the growing season δ C i and δ B i was greater after reconstruction than that before (Figure 8). For example, the growing season δ C i and δ B i of the WS and SL sections varied from −0.04 in 2009 to 0.05 in 2016, with obvious peak values in 2008, 2011, and 2016 and relatively low values in 2009 and 2015. For the NE section, peak growing season δ C i and δ B i values were reached mainly in 2013, 2015, and 2021, while lowest values were observed in 2014. Additionally, it can be seen that the growing season δ C i and δ B i for three highway sections clearly increased from 2001 to 2021 (except for the SL section).
We further assessed the change in δ C i and δ B i from April to October before and after reconstruction to investigate the monthly variation features (Figure 9). Generally, although the monthly δ C i and δ B i differed greatly before and after reconstruction, they appeared to show the same change tendency for the WS, SL, and LN sections after reconstruction, which were greater than zero across the whole growing season. The results suggested that climate change and reconstruction forces can promote the development of vegetation activity in general. Compared with the pre-reconstruction period, the monthly δ C i and δ B i showed a marked increase from August to October for the WS section, in May, September, and October for the SL section, and for most months for the other two sections after reconstruction, with the largest rate of 0.0032 year−1 and 0.0033 year−1 in June for the NE section, respectively.
The contributions of reconstruction to the EVI were mostly positive at the growing-season level, with 7.67%, 19.12%, and 18.24% in the WS, SL, and LN sections, respectively, whereas a negative effect was detected only in the eastern part of the TG318. These results suggest that reconstruction likely promoted vegetative activity in a widespread area of the TG318, while an inhibitory effect was detected in the eastern parts. In contrast, a significant positive effect of climate change on vegetation activity was observed in most sections (Figure 10).
We further examined the monthly contributions of reconstruction and climate change to vegetation activity (Figure 11). Reconstruction had a similar inhibitory effect on the EVI for the three eastern parts at the beginning of the growing season, but it had a positive effect on the EVI in the SL and LN sections and a negative effect in the NE section during the mid- to late-growing season, suggesting that reconstruction did not likely promote vegetative activity during the germination stage across the central and eastern parts of the TG318. In contrast, there was an obvious promotion effect of reconstruction on the EVI in the WS section during most of the growing season, particularly in August (8.67%) and October (9.95%).
Climate change had a positive effect on the EVI during most months, excluding June and July in the WS and SL sections, with maximum contributions of 24.23% and 16.87% in September, respectively. A positive effect of climate change on the EVI was detected in the LN and NE sections, excluding October in the LN section and May and June in the NE section. However, the contributions differed greatly with time; for example, the effects of climate change increased during summer in the LN section but peaked in April and July in the NE section.

3.3. Response of Vegetation Activity to Climate Change and Lag Time

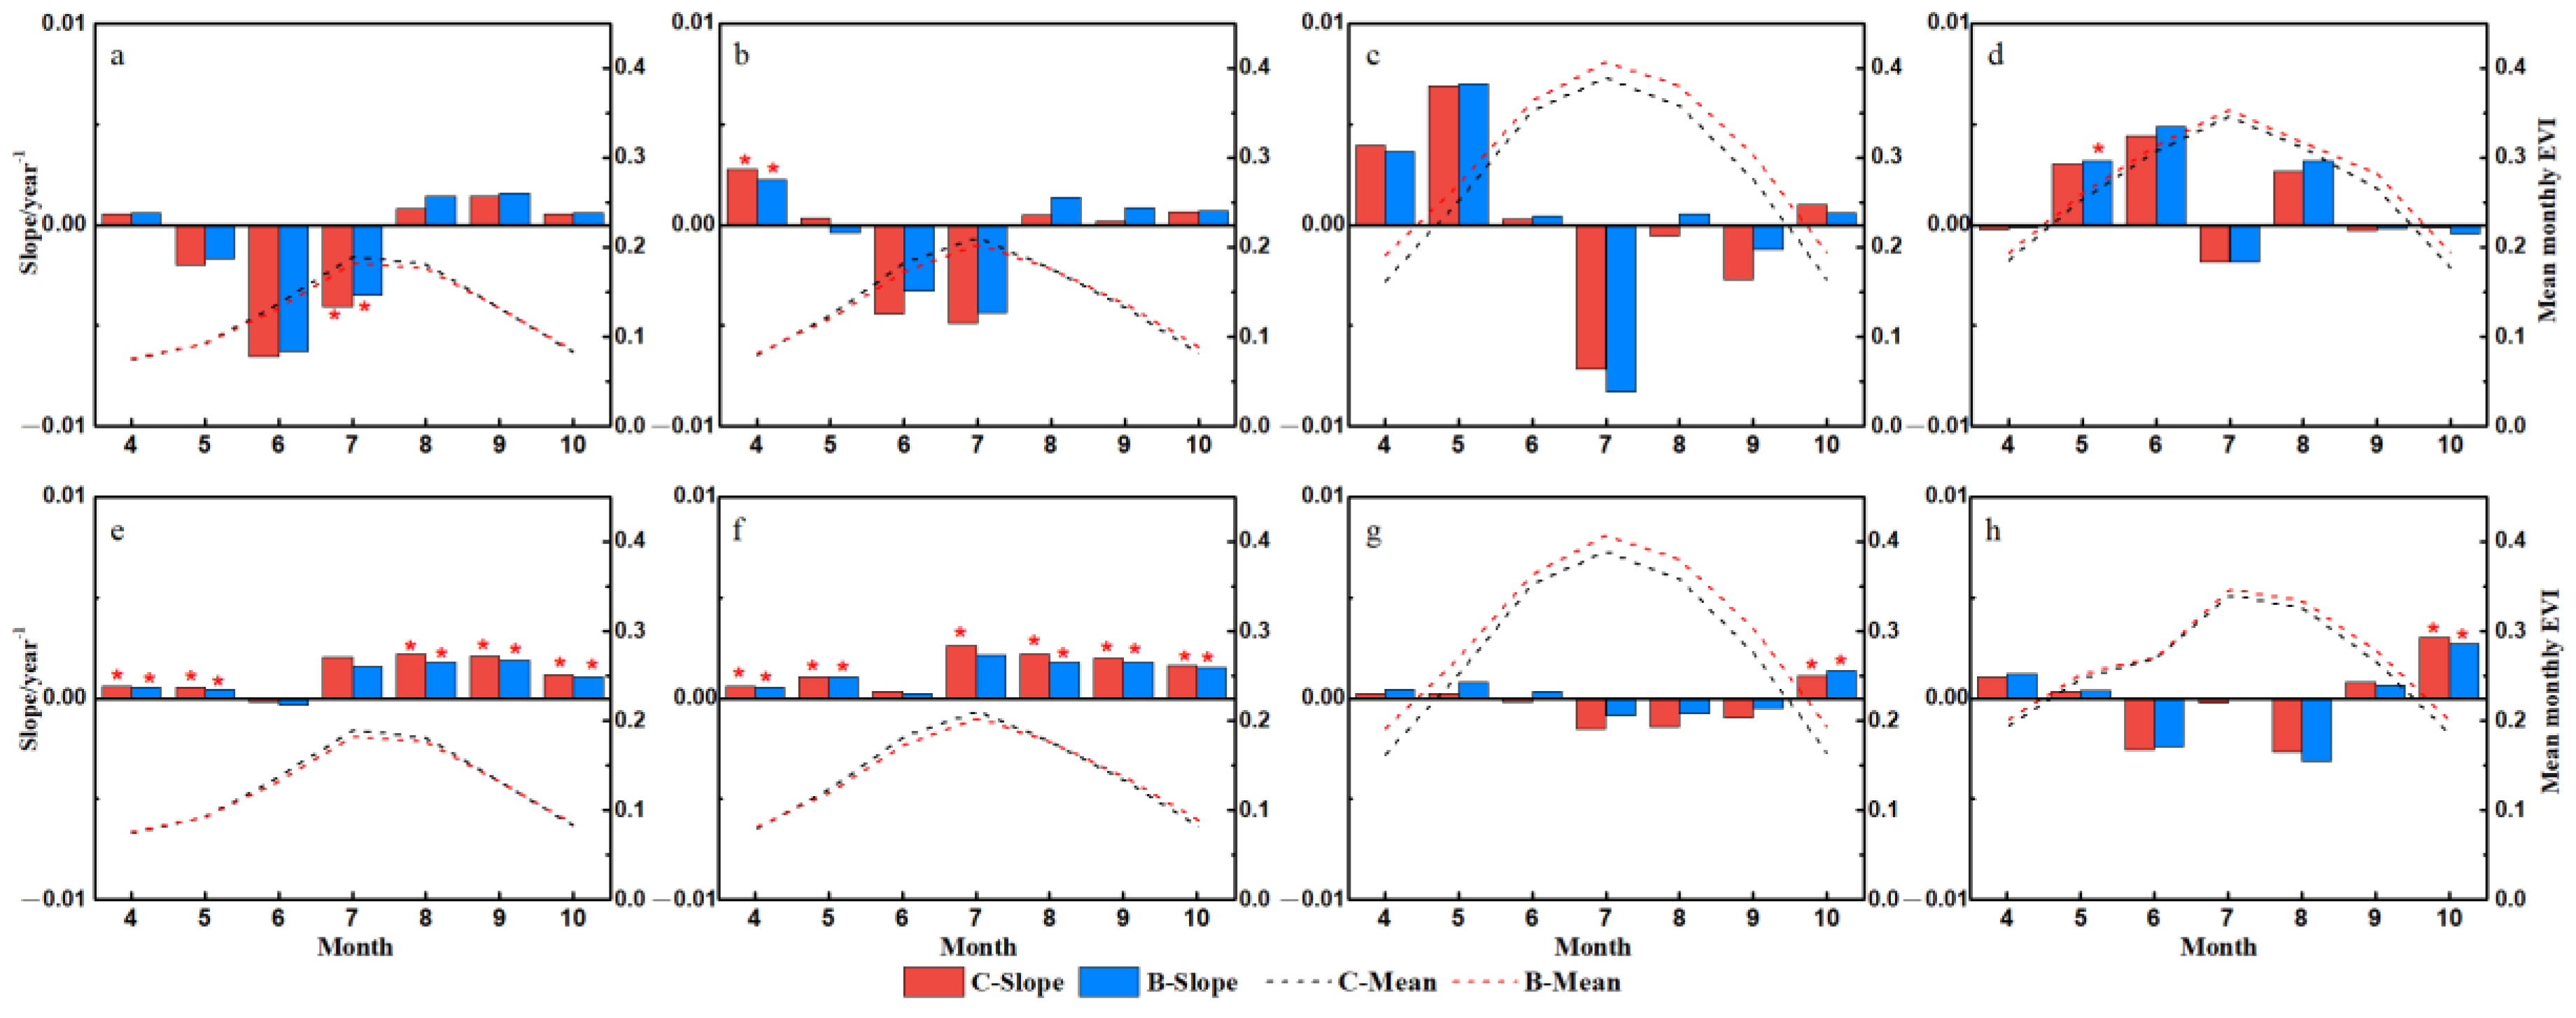
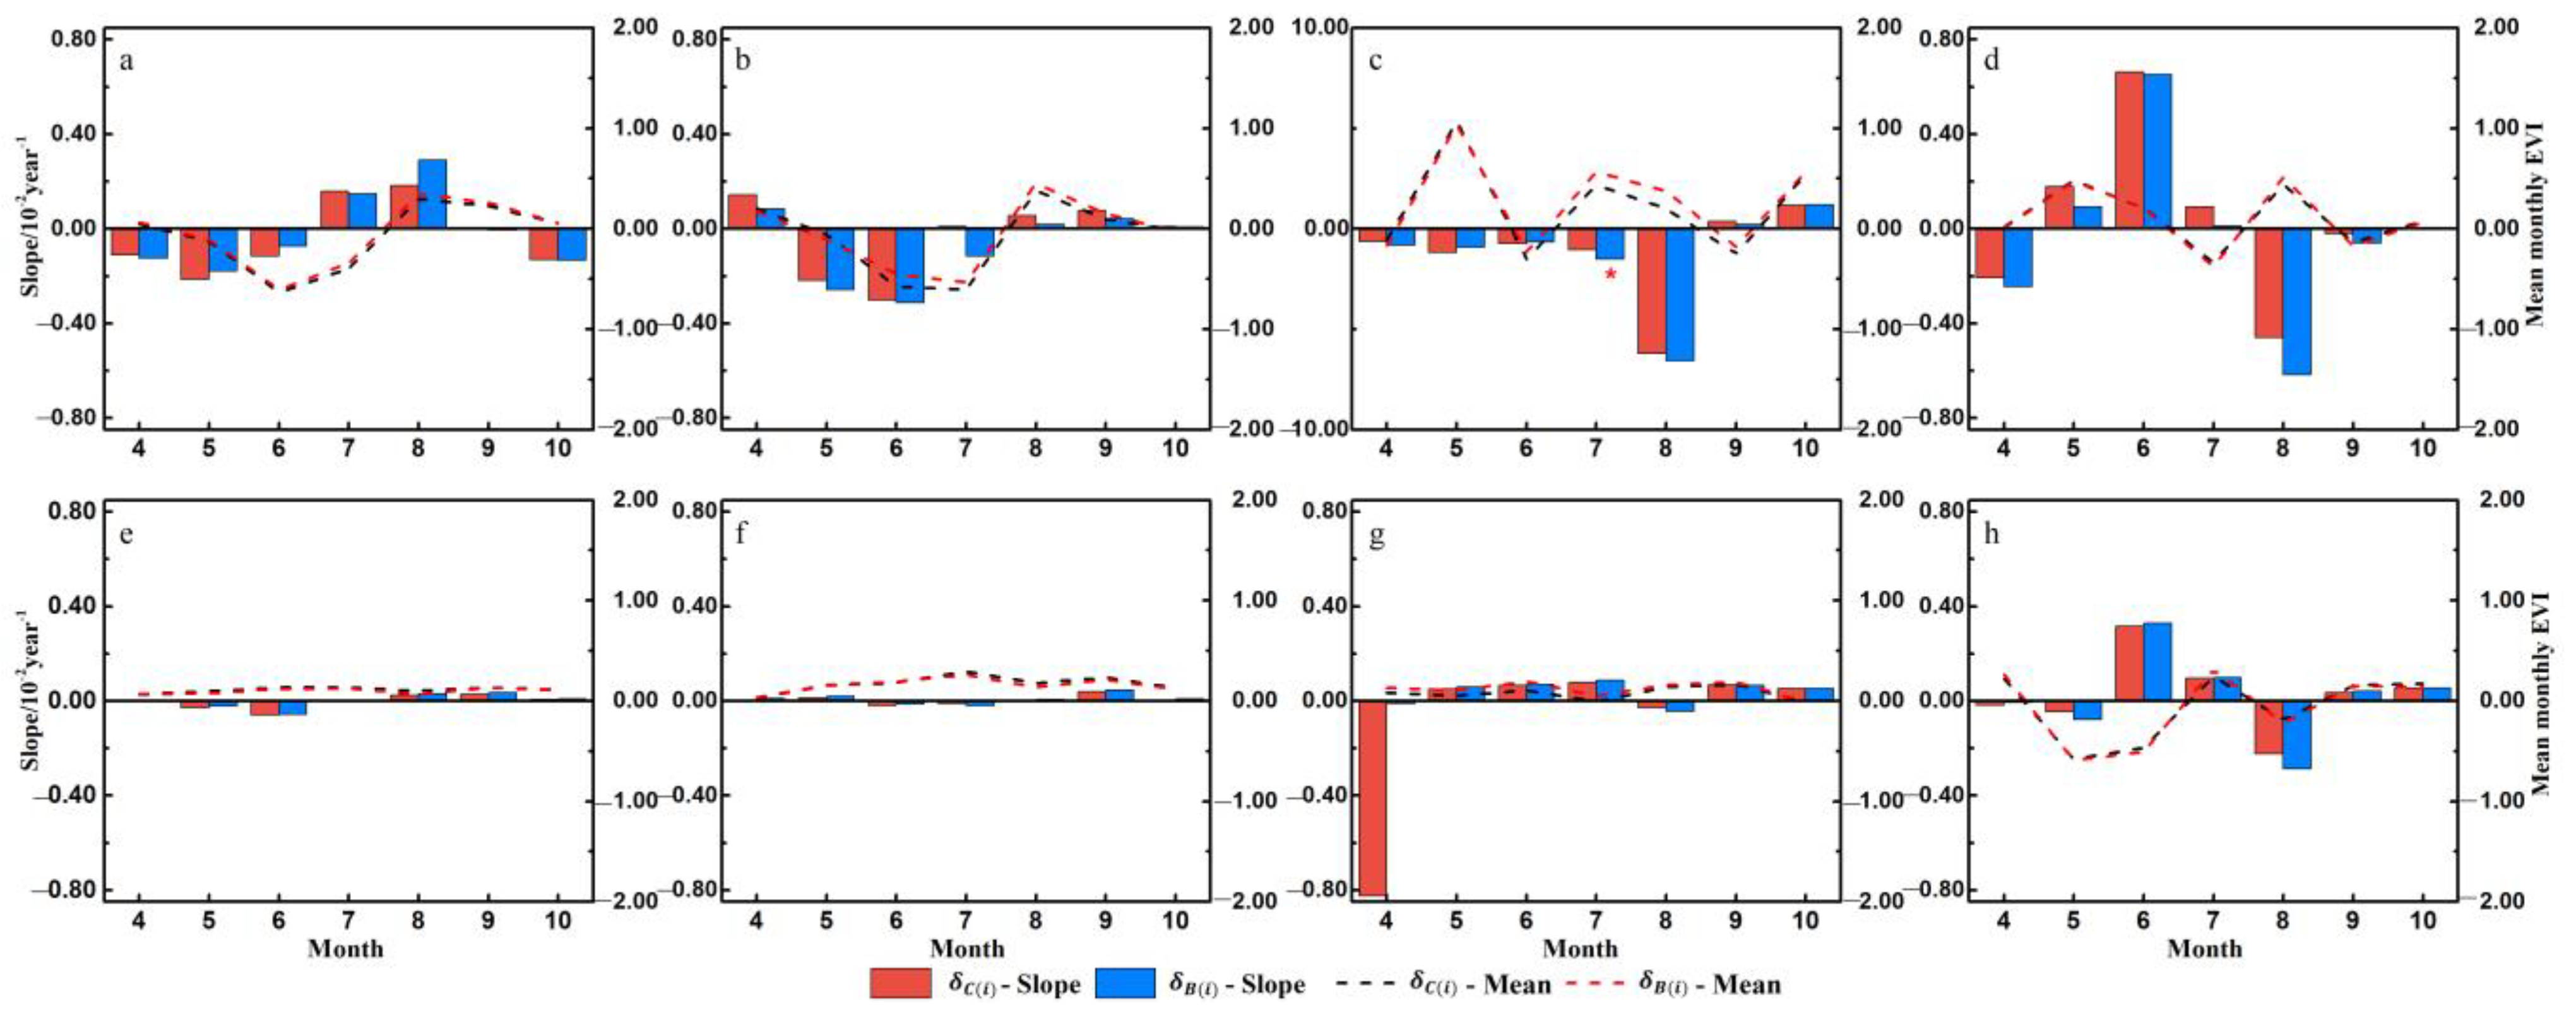
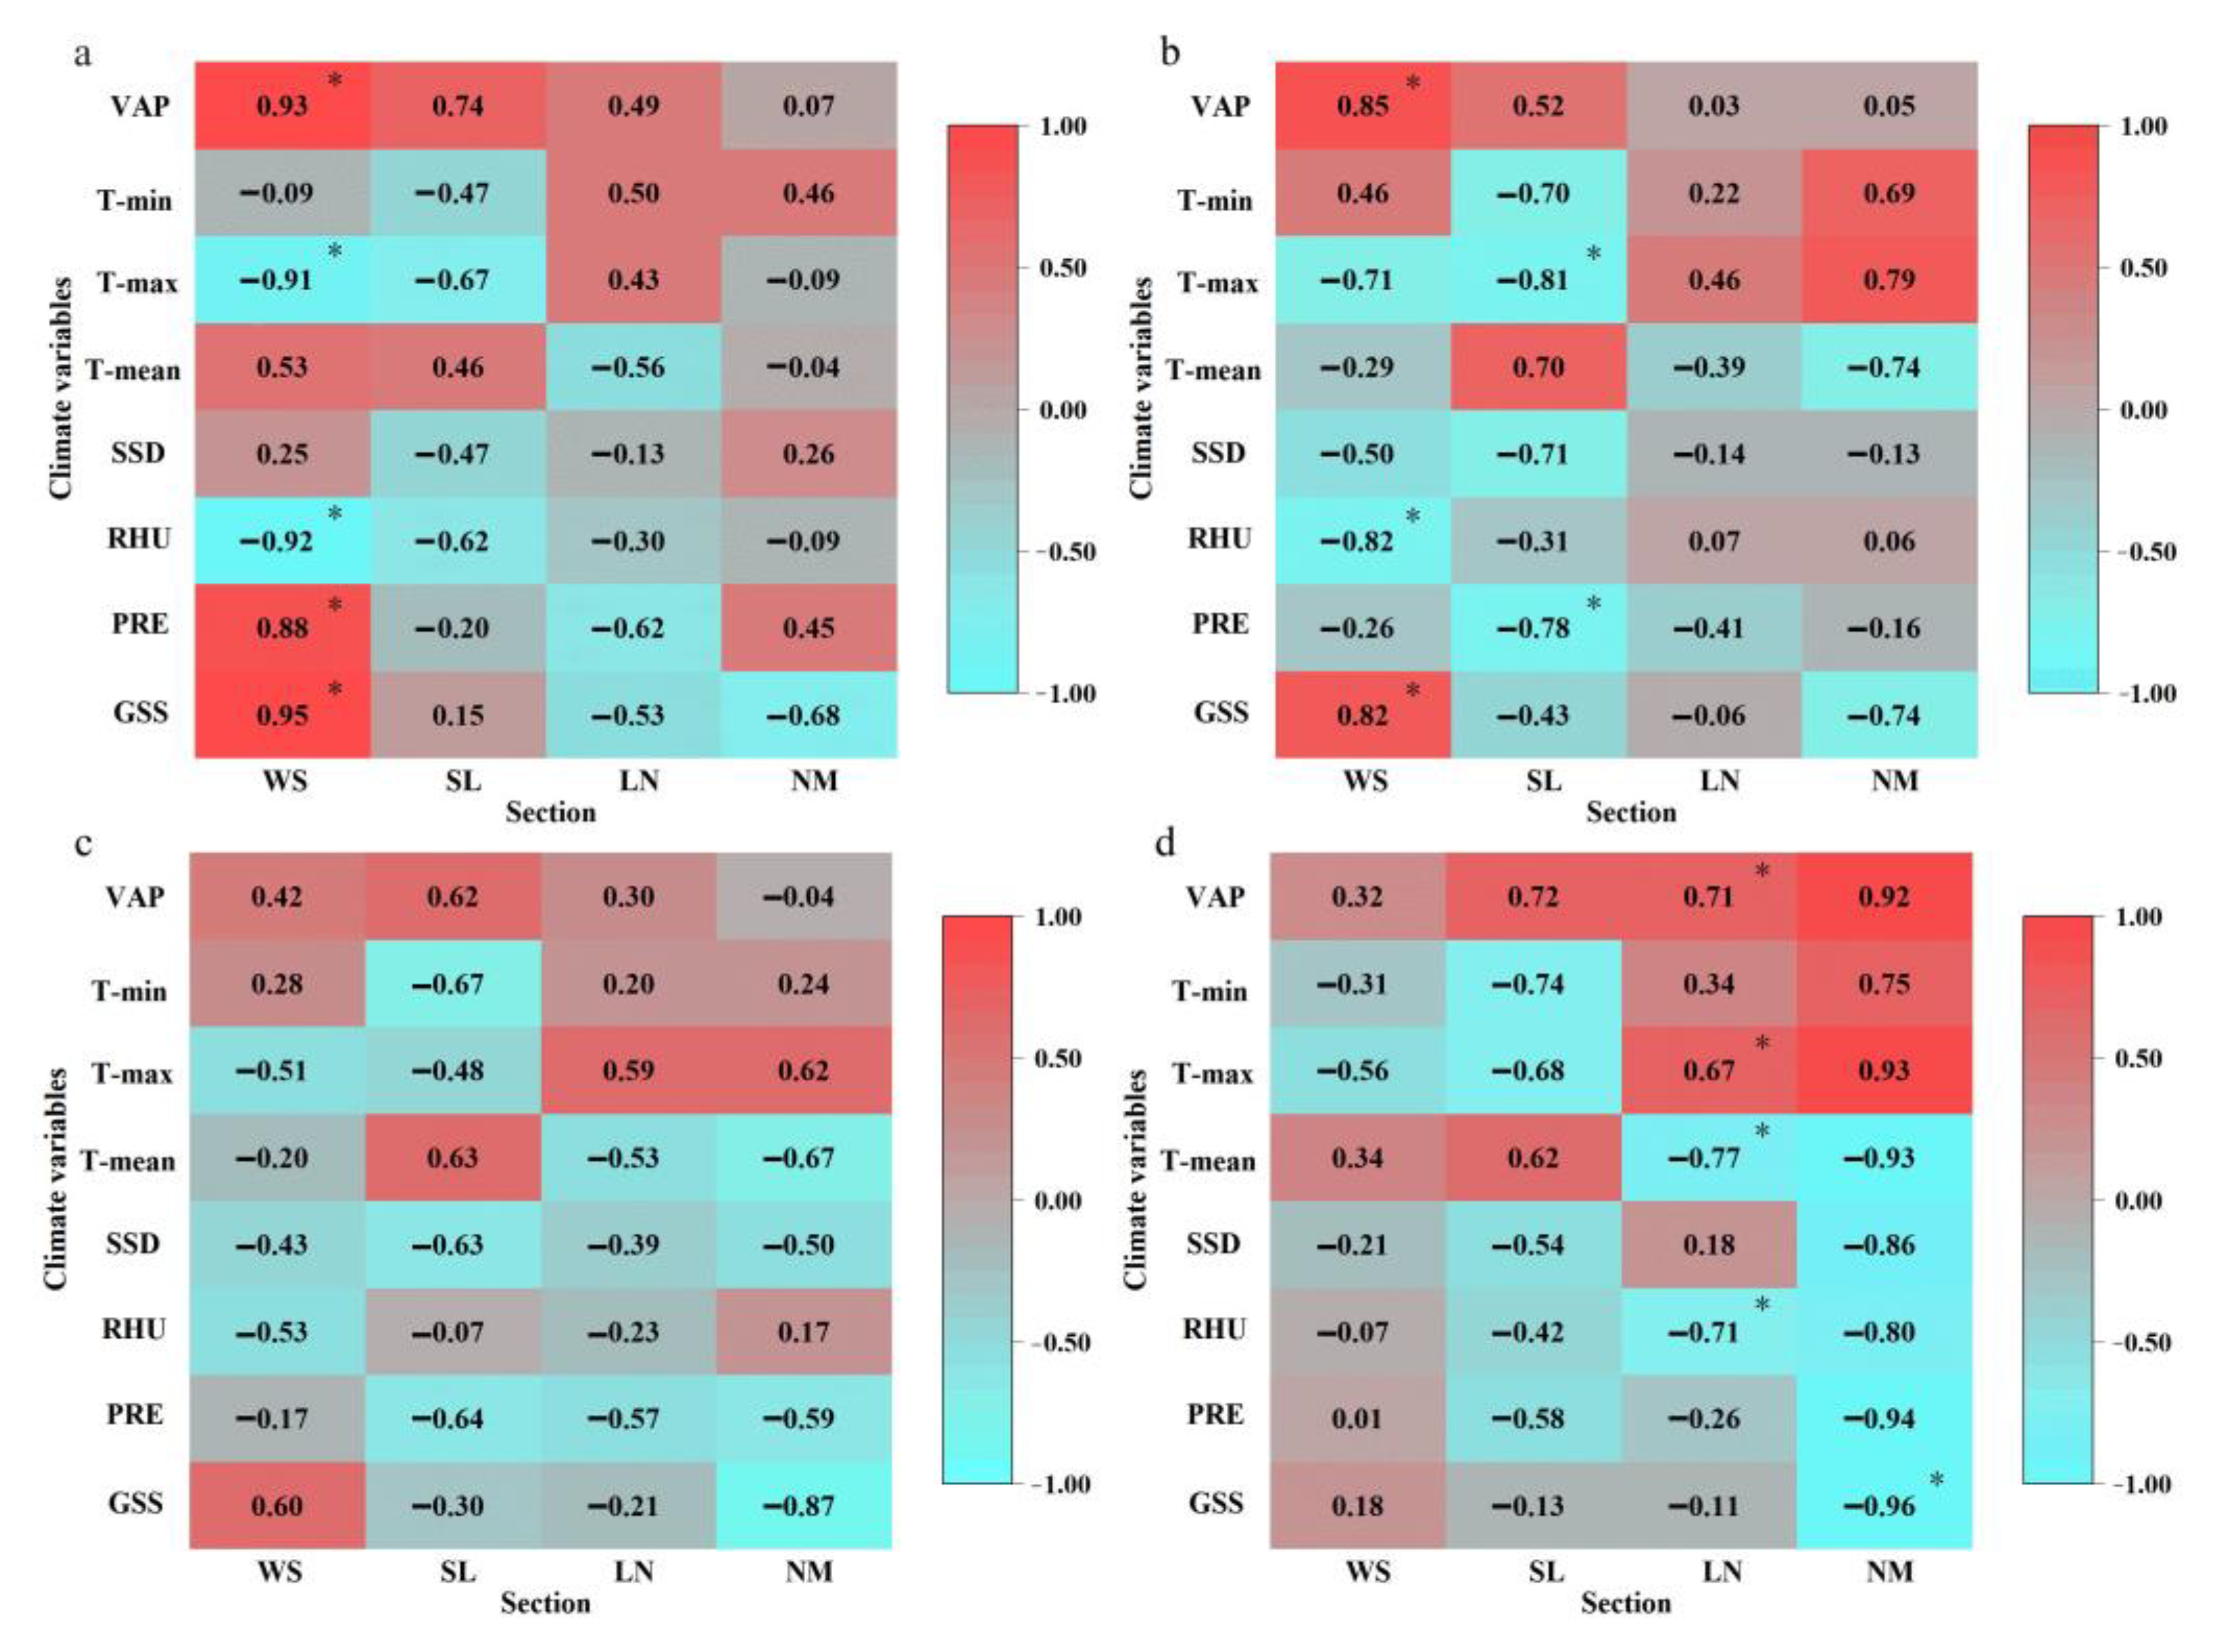
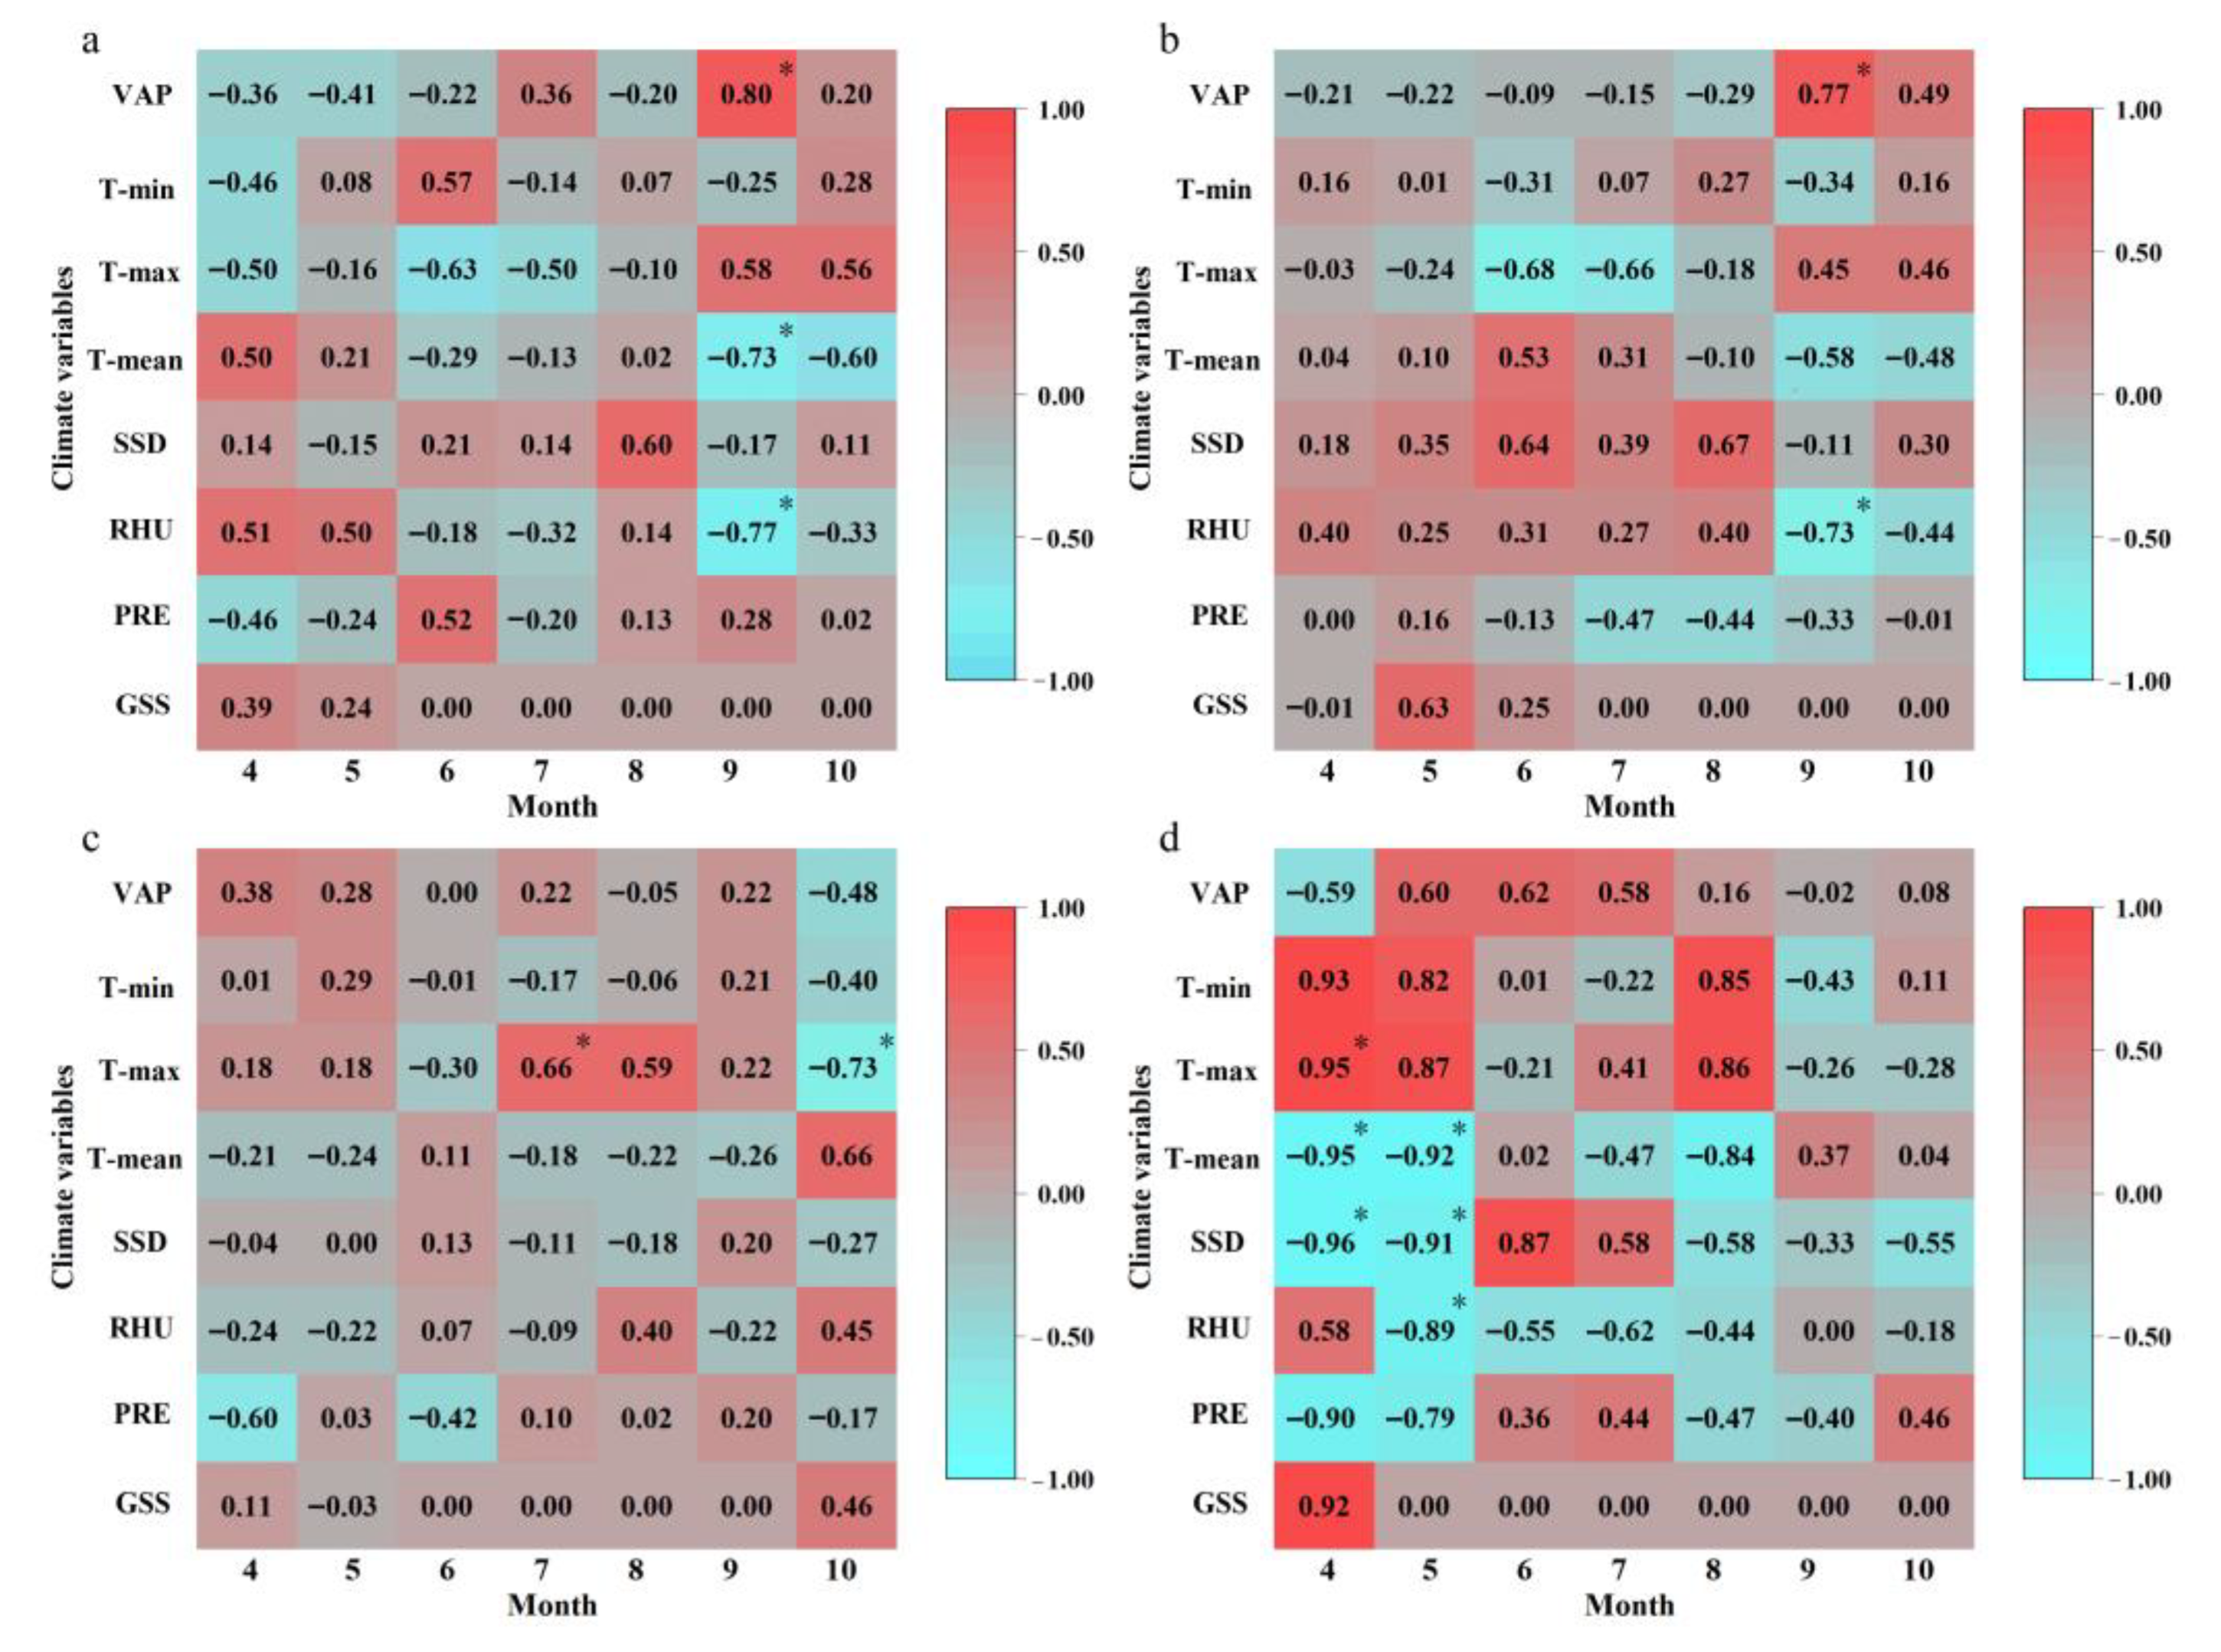
3.3.1. The Effects of Climate Factors on the Vegetation Variation

We fitted a piecewise SEM to infer the direct and indirect effects of climate factors on the vegetation variation in different sections along the TG318 (Figure 12). The SEM indicated that the main limiting factors were the VAP, PRE, GSS, SSD, and T-min, although high spatial heterogeneity was detected among these sections. The results identified a significant positive effect of the growing-season VAP and PRE on the EVI, with path coefficients of 0.30 and 0.39, respectively, whereas the T-mean during the growing season was negatively associated with the EVI in the WS section. In contrast, the growing-season VAP (0.67) had a positive effect on the EVI in the SL section, whereas the growing-season T-min, PRE, SSD, and GSS were generally negatively associated with the EVI in the SL and LN sections. However, the effects of the growing-season T-min (−0.69) on the EVI in the LN section were stronger than those in the SL section (−0.28). Additionally, the mean growing-season EVI was mainly related to the direct negative effects of GSS in the NE section, suggesting that monthly snow cover may be a key factor influencing vegetation activity in the alpine and canyon regions.

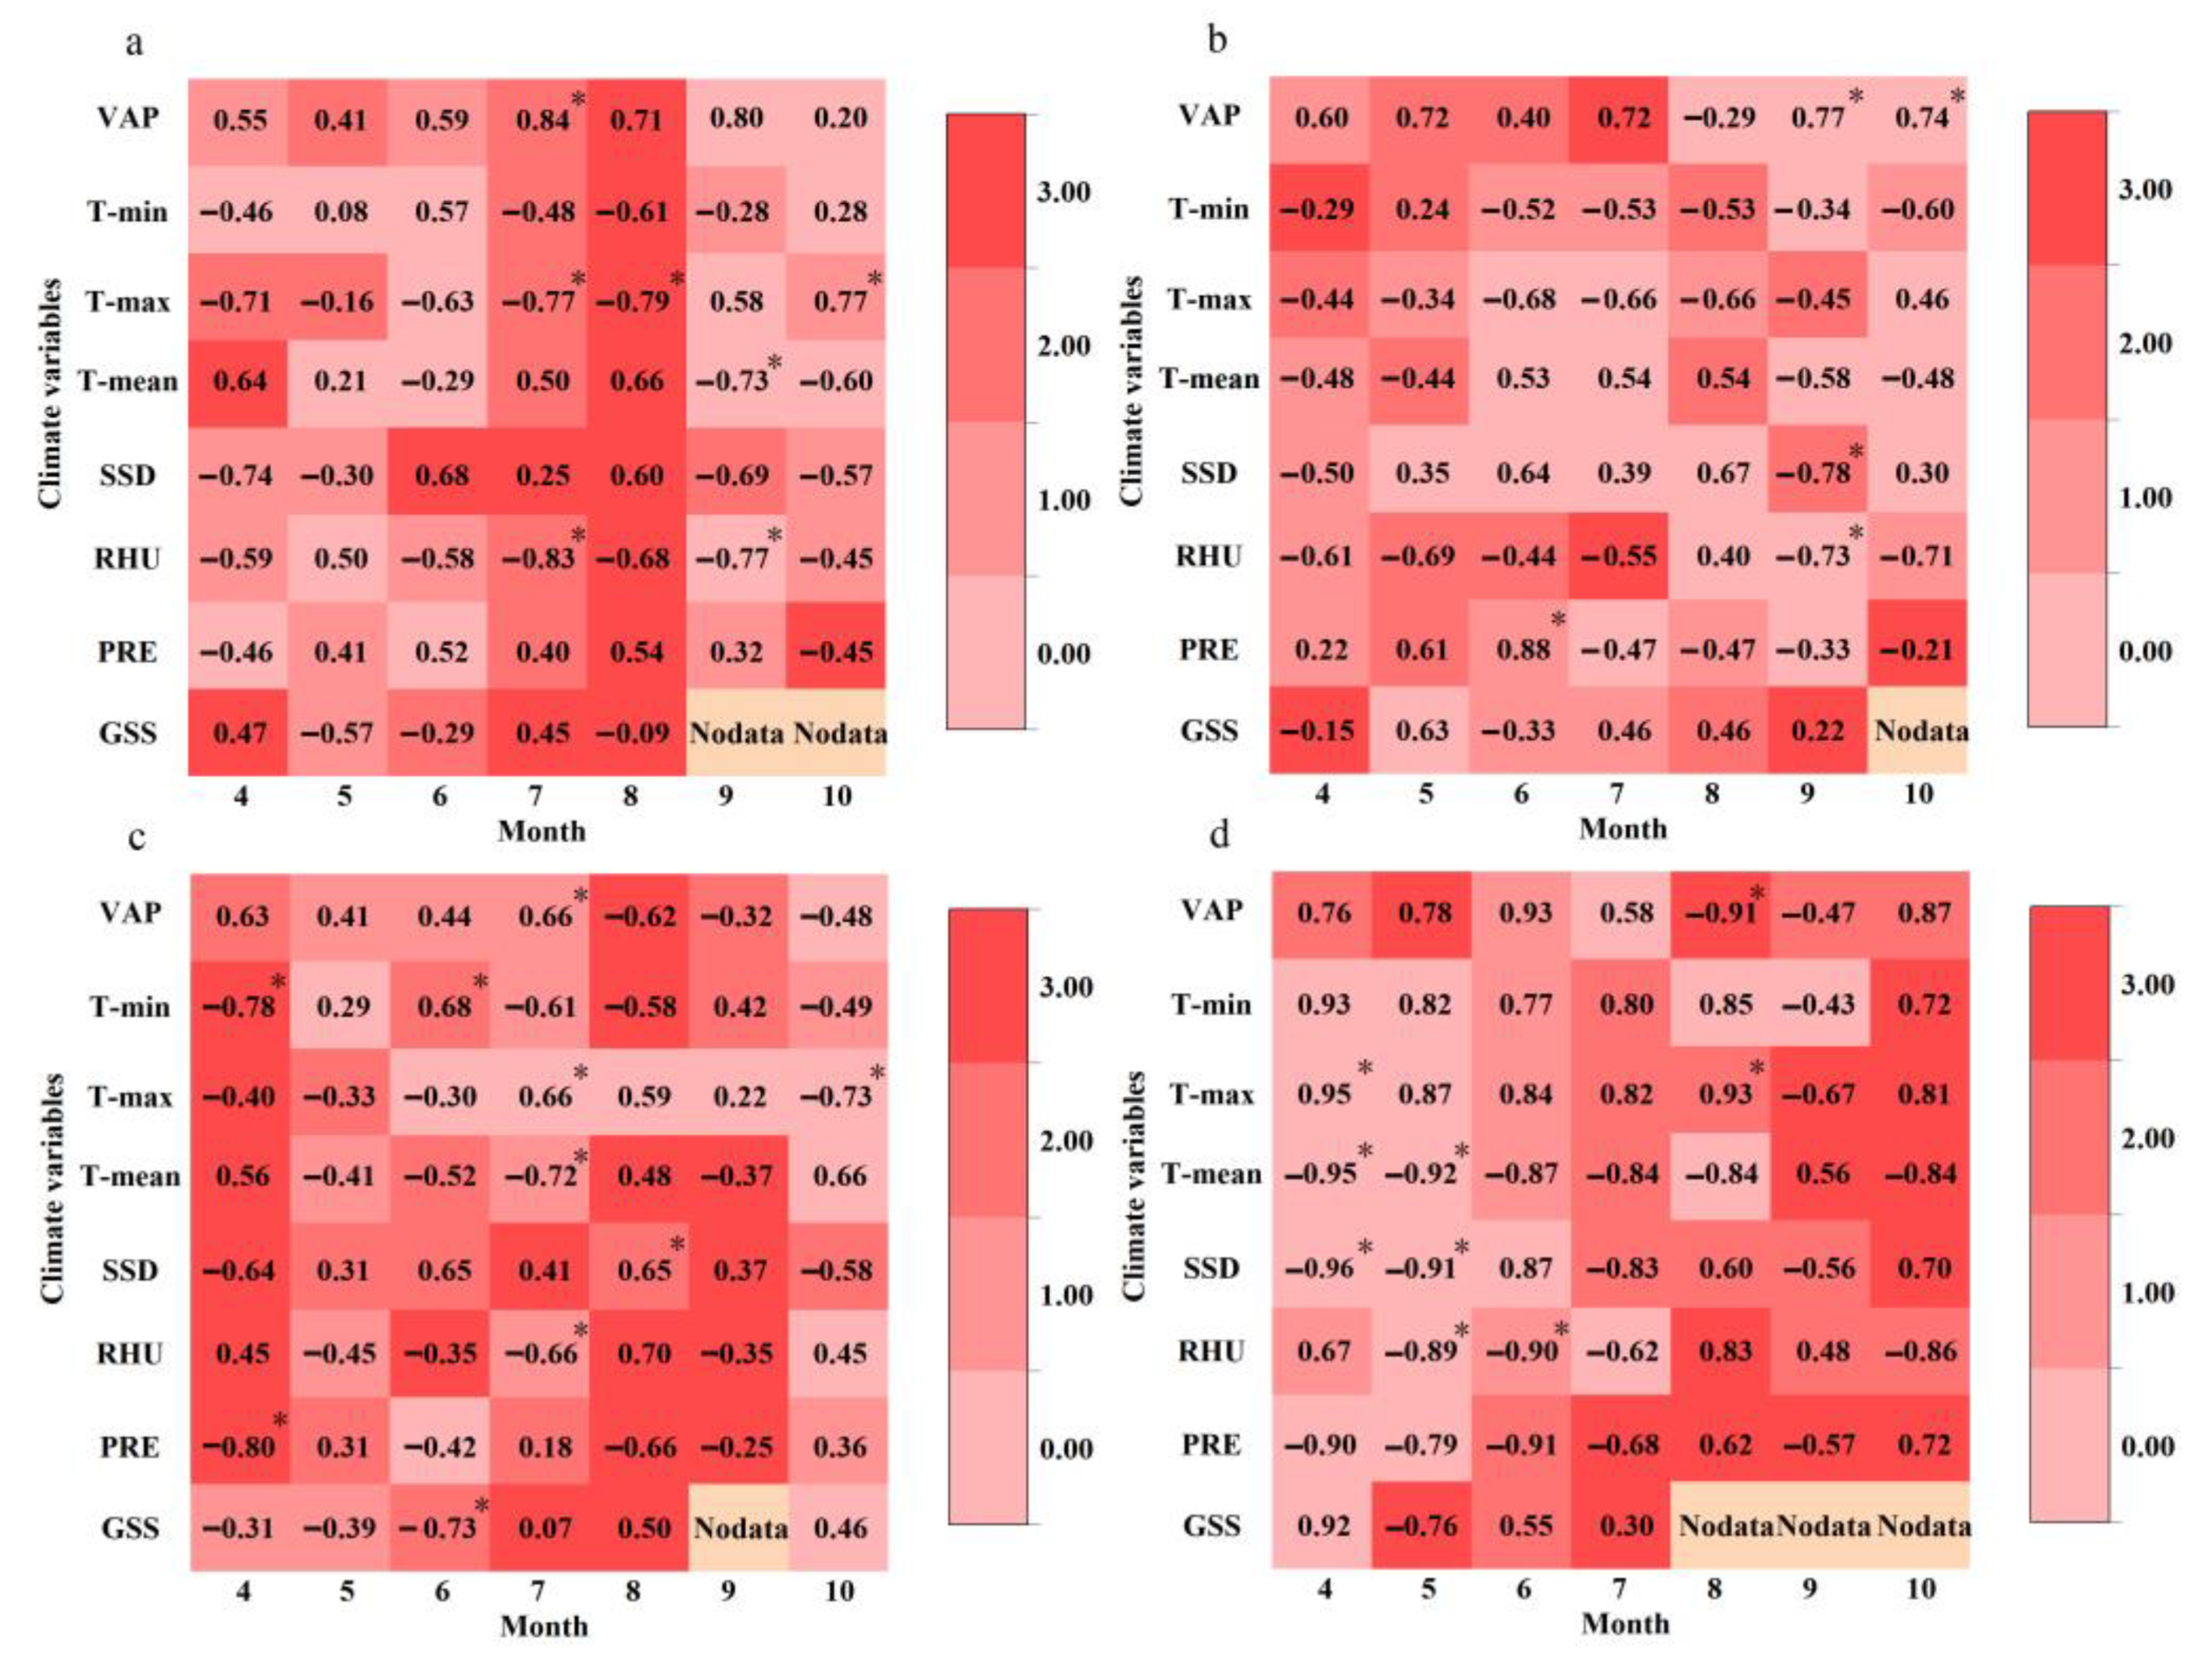
3.3.2. The Lagging Effect of Vegetation Activity on Climate Change

We performed the partial correlation analysis with the EVI and climate variables at the growing-season and monthly scales to determine whether there was a lag effect of the climate variables on vegetation activity (Figure 13 and Figure 14). As shown in Figure 13, the mean growing-season EVI was positively correlated with the pre-growing-season GSS and VAP in the WS section, with coefficients increasing from a 0-month lag to a 3-month lag, whereas similar negative correlations were detected for the pre-growing-season T-max and RHU. The correlation between pre-growing-season climate variables and the mean growing-season EVI is stronger than that between the corresponding climate variables and the mean growing season, indicating that vegetation activity in the WS section of the TG318 was more closely associated with pre-growing-season climate variables during the past few decades. Negative correlations between the mean growing-season EVI and the pre-growing-season PRE, RHU, SSD, T-max, and T-min were primarily found with a 0–3-month lag for the SL section, whereas the mean growing-season EVI was positively correlated with the T-mean and VAP, with a 2-month lag generally, suggesting that vegetation has a 2-month lag response to the hydrothermal conditions. However, strong correlations between the mean growing-season EVI and corresponding climate variables were observed for the LN and NE sections. For example, the mean growing-season EVI was positively correlated with the VAP, T-min, and T-max but negatively correlated with other variables (with GSS significantly) during the same period in the NE section. A positive correlation was also detected between the mean growing-season EVI and the corresponding T-max (R = 0.67), T-min (R = 0.34), and VAP (R = 0.71) in the LN section, whereas it was negatively correlated with the T-mean (R = −0.77), RHU (R = −0.71), PRE (R = −0.26), and GSS (R = −0.11). These results suggest that increases in the T-min, T-max, and VAP during the same period were likely to improve vegetation activity in a widespread area of the central and eastern parts of the TG318, but moisture was a limiting factor.
The relationships between the EVI and climate variables differed at the monthly scale (Figure 14). The EVI was positively correlated with the T-mean, RHU, and GSS for the WS section in April, with a stronger positive relationship with a 2–3-month lag (Figure A3), whereas the opposite relationships were detected for a 1-month lag (Figure A1). This finding indicates that moisture during the early stage may promote vegetation activity, but this could inhibit vegetation activity one month before the start of the growing season. Close correlations were detected between the EVI and climate variables with a 2-month lag in July, a 3-month lag in August, and no lag in September (Figure 15). The EVI in the LN section was closely correlated with climate variables with a 3-month lag in April, a 1-month lag in July, and a 3-month lag in August. In particular, significantly negative correlations were detected between the EVI and T-min (R = −0.78) and PRE (R = −0.80) with a 3-month lag in April. A significant negative correlation was detected with GSS (R = −0.73), and a positive correlation was observed with the T-min (R = 0.68) with a 2-month lag in June. The EVI was significantly negatively correlated with the T-mean (R = −0.72) and RHU (R = −0.66) and positively correlated with VAP (R = 0.66), with a 1-month lag in July (Figure 15). There was also a 1-month lag response of the EVI to climate variables in April and May and a 2–3-month lag response during the later growing season in the NE section. Notably, the highest partial correlation coefficients between the EVI and the pre-growing-season T-min and T-max were mainly positive from April to October (excluding September), whereas those between the EVI and the pre-growing-season T-mean (excluding September) and PRE (excluding August and October) were negative.

4. Discussion

4.1. Regional Vegetation Changes and Anthropogenic Forces

Based on the linear least-squares regression, the mean growing-season EVI increased significantly in western sections along the TG318 during 2000–2021, whereas greater fluctuations were observed in the eastern sections, which is consistent with previous studies [45,46]. For example, the changes in the mean growing-season NDVI in most western area of the Lhasa City was between 0 and 0.15/decade during 1992–2020 [47]. However, the annual NDVI varies greatly in humid and sub-humid areas of the QTP, and a large decreasing area appeared near Nyingchi City from 1998 to 2018 [48]. These differences may be related to the vegetation type to some extent. According to the Globelland30 land use distribution in 2010, the WS section was mainly dominated by grassland (64.04%) and bare area (11.15%) within 600 m of the core area, whereas the SL section was dominated by grassland (61.42%) and cropland (21.25%), both in the temperate and semi-arid plateau regions. The eastern sections (LN and NE), in the temperate humid and sub-humid plateau regions, are characterized by grassland (71.59% and 57.61%, respectively) and forestland (17.21% and 24.83%, respectively). The mean growing-season EVI in the WS and SL sections (~0.25) was lower than that in the eastern sections (~0.40). A previous study reported that areas with high vegetation coverage were less sensitive to environment changes than those with low coverage [49]. This may be caused by the fact that vegetation in different geographic regions has different variables in response to climate change and human activities [50]. For example, a slight increase in precipitation (0.93–1.28 mm/year) was observed in all sections during the study period, and vegetative activity would be more active, like when the moisture content increased in the semi-arid area. The intensity of human activity was gradually increasing in the QTP during 1997–2018 [51], but it promoted the desertification mitigation on the western region of Lhasa City from 2000 to 2014 [52] and had negative effects on the change in net primary production in the eastern region of Lhasa City from 2001 to 2015 [53].
We used a novel method to quantify the relative contributions of climatic and anthropogenic forces to vegetation activity. Unlike traditional multiple-regression residual analyses [54] and prediction models, we constructed a core area (0–600 m) and a background area (600–1200 m) as suggested by previous findings [35]. The results indicated that reconstruction was likely to promote vegetative activity in a widespread area of the TG318, with contributions of 7.67%, 19.12%, and 18.24% in the WS, SL, and LN sections, respectively. However, a previous study reported an inhibitory effect of engineering activity along the Qinghai–Tibet railway, with contributions of −0.24% in the south and −0.04% in the north [55]. This divergence may be attributed to the time scale. The mean growing-season EVI better reflects vegetative activity and reduces the effects of environmental interference [36]. Thus, we focused on the growing-season EVI (April to October) to avoid the effects of environmental interference as much as possible in this study. Second, this difference may also be influenced by the spatial resolution of remote-sensing data and the road features. Ma et al. [25] used datasets with a 0.0833° spatial resolution, and lower temporal resolution usually leads to poorer results to some extent. Furthermore, compared with railways, it is necessary to consider that highway construction produces thermal influences on the permafrost in the QTP [56]. Reconstruction activity, especially asphalt paving, can significantly reduce the surface albedo and even make it degrade [57,58,59]. On the other hand, most surface precipitation is discharged horizontally or vertically through the road slope, and only a small amount of precipitation infiltrates into the pavement through cracks [60], which may be responsible for promoting the vegetation activity in plateau temperate semi-arid regions. Environment changes in the QTP permafrost have strong impacts on the ecosystems of alpine meadows and alpine swamp meadows, resulting in an obvious decrease in alpine meadow coverage and biomass production as the permafrost depth increases.

4.2. Relationships between Climate Factors and Vegetation Variation

The vegetation of the QTP is extremely sensitive to climate change due to the harsh geographical environment [61,62], and it demonstrates different responses to climatic variables [63]. The results indicated that there exist negative correlations between the mean growing-season EVI and the corresponding T-max and T-min in the WS and LS sections and positive correlations between the mean growing-season EVI and the corresponding T-max and T-min in the LN and NE sections (Figure 14d). Similarly, a negative spatial correlation was detected between the NDVI and two temperature indices (T-max and T-min) in semi-arid regions of the QTP using geographically weighted regression during 1982–2015 [64], which was mainly related to the finding that temperature increases accelerate soil moisture loss and nutrient consumption [65]. For humid and semi-humid areas with high vegetation coverage, temperature may be an important limiting factor and it increases the facilitation of photosynthesis until the optimum temperature is reached [66]. Negative relationships between the mean growing-season EVI and the corresponding PRE, RHU, and GSS in the LN and NE sections are consistent with these findings. The SEM showed that the T-max and PRE affected the mean growing-season EVI through VAP in the western sections, and these variables may play a role in affecting the EVI by the GSS or T-mean, suggesting a complex influence of climatic variables on the mean growing-season EVI, apart from a possible direct influence. Therefore, the mechanisms driving these influences require further study. The mean growing-season EVI of the western sections is more sensitive to climate variables in the pre-growing season than these in the corresponding period, which are generally in line with the findings of a previous study [67], and may be associated with the sensitivity difference of vegetation to hydrothermal conditions.
Vegetation responded differently to hydrothermal conditions at different growth stages. In the NE section, there was generally no lag time for vegetative activity during April and May, whereas a 2–3-month lag was observed from July to October. In contrast, the strongest correlation between the monthly EVI and climate variables from April to May occurred with over a 1-month lag in the other three sections. Vegetation activity during spring was mainly dependent on pre-growing-season snowmelt or precipitation due to the low precipitation during winter in the western QTP. Warming not only promotes snow melting but accelerates moisture evapotranspiration. The positive relationships between the EVI and T-max and T-min with a 1-month lag in April and negative relationships in the previous 2–3 months in the three western sections seem to be practicable in reflecting these relationships. Additionally, the spring temperature increase occurs more rapidly in the eastern QTP than in the western QTP [36], which may explain why the lag time in temperature is longer in the western QTP than in the eastern QTP. Most vegetation along the TG318 exhibited a 2–3-month lag in temperature and precipitation variation during autumn, and a 1-month lag in winter from 1981 to 2010 [68], which was inconsistent with our findings, perhaps due to the cumulative effects of climate change during the early growing season [69,70].

4.3. Uncertainties

Numerous studies have explored the impacts of climate change on vegetation dynamics over the Qinghai–Tibet Plateau, but there has been relatively little research on the ecological effects of highway construction. In this study, we conducted quantitative analyses on the combined effects of highway reconstruction and climate change on vegetation activity, but there are still some uncertainties. First, although the MODIS EVI dataset is widely used for its high precision and resolution [71] and is more in line with vegetative activity characteristics in the QTP [72], remote-sensing products are subject to the physical limitations of the sensors, limited temporal and spatial coverage, and spatial resolution, which may result in uncertainty regarding the analysis results [73]). Second, to avoid largely environmental interference with the EVI during the non-growing season, we focused only on vegetation activity during the growing season. However, the spatial pattern of vegetation phenology along the G318 national highway in the QTP is not yet clearly identified. In addition, various segments of the TG318 underwent reconstruction and expansion at different times. Although we divided the study period into two periods, mainly according to the average reconstruction time of each section, the determination of the time points before and after reconstruction may lead to some uncertainties. We also defined the core and background area by referring to areas suggested in a previous study. However, the ecological sensitivity experiments need to be further explored due to the spatial heterogeneity in different regions.

5. Conclusions

In this study, we examined the effects of climate change and reconstruction on the spatial and temporal variations in vegetative growth along the G318 national highway in Tibetan autonomous regions during 2000–2021 based on MODIS EVI data. The variation in mean growing-season EVI differed among highway sections, with a significant increase in the WS section to a slight decrease in the LN section. We performed a novel residual analysis to identify the relative contributions of reconstruction and climate change to vegetation activity and found that these likely promoted vegetative growth in a widespread area of the TG318, whereas inhibitory effects were limited to very small regions. The reconstruction at a monthly scale positively contributed to vegetation activity from August to October in the WS section but negatively in the NE section during the growing season. The mean growing-season EVI was closely correlated with pre-growing-season climate variables, with lag times of approximately 2 and 3 months in the WS and SL sections, respectively, and no lag in the LN and NE sections, although these relationships varied widely across different regions and months along the TG318. This diverse response of vegetation to climate change and human activity suggests differences in the mechanisms of the EVI response to hydrothermal conditions along the TG318. However, more detailed studies based on long-term observation data are needed to better understand implications of highway reconstruction on vegetation activity.

Author Contributions

Data curation, Y.L. (Yao Li); Investigation, L.G. and J.G.; Resources, Y.L. (Yao Li) and L.G.; Software, Y.L. (Yao Li) and Y.L. (Yuanyuan Luo); Supervision, H.Z., Y.Z. and S.W.; Validation, Y.L. (Yuanyuan Luo) and J.G.; Writing—original draft, Y.L. (Yao Li); Writing—review and editing, L.G., J.G. and S.W. All authors have read and agreed to the published version of the manuscript.

Funding

This study is supported by the National Second Qinghai–Tibet Plateau Investigation (No. 2019QZKK0403-01), the Qinghai Kunlun High-end Talents Project, the National Natural Science Foundation of China (No. 42271124), the Science and Technology Project of the Henan Province (No. 212102310028), the Young Backbone Teachers of Henan Polytechnic University, China (No. 2020XQG-02).

Data Availability Statement

Data are contained within the article.

Conflicts of Interest

The authors declare no conflict of interest.

Appendix A

Figure A1. Partial correlation coefficients for the monthly EVI and climate variables of the previous one month for the four sections. (a) WS; (b) SL; (c) LN; (d) NE. * indicates significance at the 0.05 level.
Remotesensing 15 05473 g0a1
Figure A2. Partial correlation coefficients for the monthly EVI and climate variables of the previous two months for the four sections. (a) WS; (b) SL; (c) LN; (d) NE. * indicates significance at the 0.05 level.
Remotesensing 15 05473 g0a2
Figure A3. Partial correlation coefficients for the monthly EVI and climate variables of the previous three months for the four sections. (a) WS; (b) SL; (c) LN; (d) NE. * indicates significance at the 0.05 level.
Remotesensing 15 05473 g0a3
Table A1. The list of main abbreviations used throughout this study.
FactorsDefinitionAbbreviations
RoadsWest of Shigatse WS
Shigatse to Lhasa SL
Lhasa to Nyingchi LN
East of Nyingchi NE
The Tibetan section of the G318 national highwayTG318
Climate factorsMonthly snow coverGSS
PrecipitationPRE
Relative humidityRHU
Sunshine durationSSD
Mean temperatureT-mean
Maximum temperatureT-max
Minimum temperatureT-min
Vapor pressureVAP
Vegetation indexThe Moderate Resolution Imaging Spectroradiometer Enhanced Vegetation IndexMODIS EVI
Buffer zoneCore areaC
Background areaB

References

  1. Kang, S.; Zhang, Y.; Chen, P.; Guo, J.; Zhang, Q.; Cong, Z.; Kaspari, S.; Tripathee, L.; Gao, T.; Niu, H.; et al. Black carbon and organic carbon dataset over the Third Pole. Earth Syst. Sci. Data 2022, 14, 683–707. [Google Scholar] [CrossRef]
  2. Yao, T.; Bolch, T.; Chen, D.; Gao, J.; Immerzeel, W.; Piao, S.; Su, F.; Thompson, L.; Wada, Y.; Wang, L.; et al. The imbalance of the Asian water tower. Nat. Rev. Earth Environ. 2022, 3, 618–632. [Google Scholar] [CrossRef]
  3. Fang, C. Special thinking and green development path of urbanization in Qinghai-Tibet Plateau. Acta Geogr. Sin. 2022, 77, 1907–1919. (In Chinese) [Google Scholar]
  4. Fu, B.; Ouyang, Z.; Shi, P.; Fan, J.; Wang, X.; Zheng, H.; Zhao, W.; Wu, F. Current Condition and Protection Strategies of Qinghai-Tibet Plateau Ecological Security Barrier. Bull. Chin. Acad. Sci. 2021, 36, 1298–1306. (In Chinese) [Google Scholar]
  5. Jiang, W.; Lu, Y.; Liu, Y.; Gao, W. Ecosystem service value of the Qinghai-Tibet Plateau significantly increased during 25 years. Ecosyst. Serv. 2020, 44, 101146. [Google Scholar] [CrossRef]
  6. Shen, M.; Piao, S.; Chen, X.; An, S.; Fu, Y.S.; Wang, S.; Cong, N.; Janssens, I.A. Strong impacts of daily minimum temperature on the green-up date and summer greenness of the Tibetan Plateau. Glob. Chang. Biol. 2016, 22, 3057–3066. [Google Scholar] [CrossRef] [PubMed]
  7. Wang, Y.; Lv, W.; Xue, K.; Wang, S.; Zhang, L.; Hu, R.; Zeng, H.; Xu, X.; Li, Y.; Jiang, L.; et al. Grassland changes and adaptive management on the Qinghai–Tibetan Plateau. Nat. Rev. Earth Environ. 2022, 3, 668–683. [Google Scholar] [CrossRef]
  8. Kuang, X.; Jiao, J. Review on climate change on the Tibetan Plateau during the last half century. J. Geophys. Res. Atmos. 2016, 121, 3979–4007. [Google Scholar] [CrossRef]
  9. Zhang, D.; Huang, J.; Guan, X.; Chen, B.; Zhang, L. Long-term trends of precipitable water and precipitation over the Tibetan Plateau derived from satellite and surface measurements. J. Quant. Spectrosc. Radiat. Transf. 2013, 122, 64–71. [Google Scholar] [CrossRef]
  10. Cai, D.; You, Q.; Fraedrich, K.; Guan, Y. Spatiotemporal Temperature Variability over the Tibetan Plateau: Altitudinal Dependence Associated with the Global Warming Hiatus. J. Clim. 2017, 30, 969–984. [Google Scholar] [CrossRef]
  11. Hua, S.; Liu, Y.; Jia, R.; Chang, S.; Wu, C.; Zhu, Q.; Shao, T.; Wang, B. Role of clouds in accelerating cold-season warming during 2000–2015 over the Tibetan Plateau. Int. J. Climatol. 2018, 38, 4950–4966. [Google Scholar] [CrossRef]
  12. Ma, S.; Wang, L.; Jiang, J.; Chu, L.; Zhang, J. Threshold effect of ecosystem services in response to climate change and vegetation coverage change in the Qinghai-Tibet Plateau ecological shelter. J. Clean. Prod. 2021, 318, 128592. [Google Scholar] [CrossRef]
  13. Chen, D.; Xu, B.; Yao, T.; Guo, Z.; Cui, P.; Chen, F.; Zhang, R.; Zhang, X.; Zhang, Y.; Fan, J.; et al. Assessment of past, present and future environmental changes on the Tibetan Plateau. Chin. Sci. Bull. 2015, 60, 3025–3035. (In Chinese) [Google Scholar]
  14. Liu, X.; Cheng, Z.; Zhang, R. The A1B scenario projection for climate change over the Tibetan Plateau in the next 30–50 years. Plateau Meteorol. 2009, 28, 475–484. (In Chinese) [Google Scholar]
  15. Zhou, M.; Yu, Z.; Gu, H.; Ju, Q.; Gao, Y.; Wen, L.; Huang, T.; Wang, W. Evaluation and projections of surface air temperature over the Tibetan Plateau from CMIP6 and CMIP5: Warming trend and uncertainty. Clim. Dyn. 2023, 60, 3863–3883. [Google Scholar] [CrossRef]
  16. Lin, J.; Zhang, J.; Lv, Q.; Liu, H.; Liu, Y. How Transport Has Changed on the Snowy Plateau over the Past Decade. China’s Tibet 2022, 33, 4–13. [Google Scholar]
  17. Zhang, J.; Yuan, M.; Zhang, J.; Li, H.; Wang, J.; Zhang, X.; Ju, P.; Jiang, H.; Chen, H.; Zhu, Q. Responses of the NDVI of alpine grasslands on the Qinghai-Tibetan Plateau to climate change and human activities over the last 30 years. Acta Ecol. Sin. 2020, 40, 6269–6281. (In Chinese) [Google Scholar]
  18. Ge, W.; Deng, L.; Wang, F.; Han, J. Quantifying the contributions of human activities and climate change to vegetation net primary productivity dynamics in China from 2001 to 2016. Sci. Total Environ. 2021, 773, 145648. [Google Scholar] [CrossRef]
  19. Banerjee, A.; Kang, S.; Meadows, M.E.; Xia, Z.; Sengupta, D.; Kumar, V. Quantifying climate variability and regional anthropogenic influence on vegetation dynamics in northwest India. Environ. Res. 2023, 234, 116541. [Google Scholar] [CrossRef]
  20. Zhao, L.; Dai, A.; Dong, B. Changes in global vegetation activity and its driving factors during 1982–2013. Agric. For. Meteorol. 2018, 249, 198–209. [Google Scholar] [CrossRef]
  21. Xu, H.; Wang, X.; Zhang, X. Alpine grasslands response to climatic factors and anthropogenic activities on the Tibetan Plateau from 2000 to 2012. Ecol. Eng. 2016, 92, 251–259. [Google Scholar] [CrossRef]
  22. Zhang, Q.; Yuan, R.; Singh, V.P.; Xu, C.; Fan, K.; Shen, Z.; Wang, G.; Zhao, J. Dynamic vulnerability of ecological systems to climate changes across the Qinghai-Tibet Plateau. China Ecol. Indic. 2022, 134, 108483. [Google Scholar] [CrossRef]
  23. Li, S.; Wu, J.; Gong, J.; Li, S. Human footprint in Tibet: Assessing the spatial layout and effectiveness of nature reserves. Sci. Total Environ. 2018, 621, 18–29. [Google Scholar] [CrossRef] [PubMed]
  24. Wei, Y.; Lu, H.; Wang, J.; Wang, X.; Sun, J. Dual influence of climate change and anthropogenic activities on the spatiotemporal vegetation dynamics over the Qinghai-Tibetan Plateau from 1981 to 2015. Earth’s Future 2022, 10, e2021EF002566. [Google Scholar] [CrossRef]
  25. Zhu, B.; Zhang, Z.; Tian, J.; Kong, R.; Chen, X. Increasing Negative Impacts of Climatic Change and Anthropogenic Activities on Vegetation Variation on the Qinghai–Tibet Plateau during 1982–2019. Remote Sens. 2022, 14, 4735. [Google Scholar] [CrossRef]
  26. Ma, C.; Li, T.; Liu, P. GIMMS NDVI3g+ (1982–2015) response to climate change and engineering activities along the Qinghai–Tibet Railway. Ecol. Indic. 2021, 128, 107821. [Google Scholar] [CrossRef]
  27. Cong, N.; Shen, M.; Yang, W.; Yang, Z.; Zhang, G.; Piao, S. Varying responses of vegetation activity to climate changes on the Tibetan Plateau grassland. Int. J. Biometeorol. 2017, 61, 1433–1444. [Google Scholar] [CrossRef] [PubMed]
  28. Lian, X.; Piao, S.; Chen, A.; Wang, K.; Li, X.; Buermann, W.; Huntingford, C.; Penuelas, J.; Xu, H.; Myneni, R.B. Seasonal biological carryover dominates northern vegetation growth. Nat. Commun. 2021, 12, 983. [Google Scholar] [CrossRef]
  29. Sun, Y.; Liu, S.; Liu, Y.; Dong, Y.; Li, M.; An, Y.; Shi, F.; Beazley, R. Effects of the interaction among climate, terrain and human activities on biodiversity on the Qinghai-Tibet Plateau. Sci. Total Environ. 2021, 794, 148497. [Google Scholar] [CrossRef]
  30. Ye, C.; Wei, R.; Ge, Y.; Li, Y.; Marcato, J.; Li, J. GIS-based spatial prediction of landslide using road factors and random forest for Sichuan-Tibet Highway. J. Mt. Sci. 2022, 19, 461–476. [Google Scholar] [CrossRef]
  31. Tao, T.; Zhang, X. Difficulties and strategies of G318 extension and reconstruction design in Tibet. Shanxi Arch. 2014, 40, 145–146. (In Chinese) [Google Scholar]
  32. Jiang, G.; Zhao, H.; Liu, Y.; Wu, Q.; Gao, S. Discrepancies of permafrost variations under thermal impacts from highway and railway on the Qinghai-Tibet Plateau. Cold Reg. Sci. Technol. 2023, 208, 103784. [Google Scholar] [CrossRef]
  33. Zhang, Z.; Wu, Q.; Liu, Y.; Wen, Z. Analysis on hydrothermal difference changes of highway pavement structure on the Qinghai-Tibet Plateau. J. Southeast Univ. Nat. Sci. Ed. 2015, 45, 975–979. (In Chinese) [Google Scholar]
  34. Cai, B.; Lu, R. Application of RS and GIS to road ecological effect assessment. J. Chang’an Univ. Nat. Sci. Ed. 2009, 29, 54–58. (In Chinese) [Google Scholar]
  35. Liang, K.; Zhang, G.; Li, H.; Wen, J. The road-region boundary based on vegetation index. Acta Sci. Nat. Univ. Sunyatseni 2020, 59, 101–109. (In Chinese) [Google Scholar]
  36. Li, W.; Qin, Z.; Li, W.; Yang, Q. Comparison and analysis of MODIS NDVI and MODIS EVI. Remote Sens. Inf. 2010, 2010, 73–78. (In Chinese) [Google Scholar]
  37. Zhang, Y.; Wang, J.; Nong, L.; Cheng, F.; Zhang, Y. Spatio-temporal variation of vegetation phenology and its response to climate in the tropic of cancer (Yunnan section) based on MODIS time-series data. Ecol. Environ. Sci. 2021, 30, 274–287. (In Chinese) [Google Scholar]
  38. Zhang, G.; Zhang, Y.; Dong, J.; Xiao, X. Green-up dates in the Tibetan Plateau have continuously advanced from 1982 to 2011. Proc. Natl. Acad. Sci. USA 2013, 110, 4309–4314. [Google Scholar] [CrossRef]
  39. Gu, Y.; Pang, B.; Qiao, X.; Xu, D.; Li, W.; Yan, Y.; Dou, H.; Ao, W.; Wang, W.; Zou, C.; et al. Vegetation dynamics in response to climate change and human activities in the Hulun Lake basin from 1981 to 2019. Ecol. Indic. 2022, 136, 108700. [Google Scholar] [CrossRef]
  40. Wang, X.; Zhu, J.; Peng, S.; Zheng, T.; Qi, Z.; Hu, J.; Ji, C. Patterns of grassland community composition and structure along an elevational gradient on the Qinghai-Tibet Plateau. J. Plant Ecol. 2022, 15, 808–817. [Google Scholar] [CrossRef]
  41. Zhang, L.; Wang, J.; Zhao, R.; Guo, Y.; Hao, L.; Hu, Z. Aboveground net primary productivity and soil respiration display different responses to precipitation changes in desert grassland. J. Plant Ecol. 2022, 15, 57–70. [Google Scholar] [CrossRef]
  42. Dai, Y.; Gong, F.; Yang, X.; Chen, X.; Su, Y.; Liu, L.; Wu, J.; Liu, X.; Sun, Q. Litterfall seasonality and adaptive strategies of tropical and subtropical evergreen forests in China. J. Plant Ecol. 2022, 15, 320–334. [Google Scholar] [CrossRef]
  43. Sun, Y.; Shan, M.; Pei, X.; Zhang, X.; Yang, Y. Assessment of the impacts of climate change and human activities on vegetation cover change in the Haihe River basin, China. Phys. Chem. Earth 2020, 115, 102834. [Google Scholar] [CrossRef]
  44. Zhang, G.; Xu, X.; Zhou, C.; Zhang, H.; Ouyang, H. Responses of grassland vegetation to climatic variations on different temporal scales in Hulun Buir Grassland in the past 30 years. J. Geogr. Sci. 2011, 21, 634–650. [Google Scholar] [CrossRef]
  45. Wang, L.; Wei, X.; Zhang, Z.; Guo, Z.; Huang, S. NDVI variation and its relationship with temperature and precipitation on the Tibetan Plateau. J. For. Environ. 2022, 42, 141–148. (In Chinese) [Google Scholar]
  46. Yang, C.; Wang, S.; Yang, C.; Feng, C.; Gao, Y.; Sun, Q. Spatial-temporal variation characteristics of vegetation coverage along Sichuan-Tibet railway. J. Arid Land Resour. Environ. 2021, 35, 174–182. (In Chinese) [Google Scholar]
  47. Pan, Y.; Wang, Y.; Zheng, S.; Huete, A.R.; Shen, M.; Zhang, X.; Huang, J.; He, G.; Yu, L.; Xu, X.; et al. Characteristics of Greening along Altitudinal Gradients on the Qinghai-Tibet Plateau Based on Time-Series Landsat Images. Remote Sens. 2022, 14, 2408. [Google Scholar] [CrossRef]
  48. Zhang, X.; Wang, J.; Gao, Y.; Wang, L. Variations and controlling factors of vegetation dynamics on the Qingzang Plateau of China over the recent 20 years. Geogr. Sustain. 2021, 2, 74–85. [Google Scholar] [CrossRef]
  49. Song, Y.; Jin, L.; Chen, J. Study of the vegetation change due to the reinforcement and rebuilding along the Qinghai-Tibet Highway. J. Glaciol. Geocryol. 2014, 36, 1017–1025. (In Chinese) [Google Scholar]
  50. Zhou, D.; Fan, G.; Huang, R.; Fang, Z.; Liu, Y.; Li, H. Interannual variability of the normalized difference vegetation index on the Tibetan plateau and its relationship with climate change. Adv. Atmos. Sci. 2007, 24, 474–484. [Google Scholar] [CrossRef]
  51. Yang, H.; Xu, Y.; Wang, L.; Xu, L. Spatio-temporal variation of human activity intensity and its driving factors on the Qinghai-Tibet Plateau. Acta Ecol. Sin. 2023, 43, 3995–4009. (In Chinese) [Google Scholar]
  52. Li, Q.; Zhang, C.; Shen, Y.; Jia, W.; Li, J. Quantitative assessment of the relative roles of climate change and human activities in desertification processes on the Qinghai-Tibet Plateau based on net primary productivity. Catena 2016, 147, 789–796. [Google Scholar] [CrossRef]
  53. Luo, Z.; Wu, W.; Yu, X.; Song, Q.; Yang, J.; Wu, J.; Zhang, H. Variation of Net Primary Production and Its Correlation with Climate Change and Anthropogenic Activities over the Tibetan Plateau. Remote Sens. 2018, 10, 1352. [Google Scholar] [CrossRef]
  54. Jin, K.; Wang, F.; Han, J.; Shi, S.; Ding, W. Contribution of climatic change and human activities to vegetation NDVI change over China during 1982–2015. Acta Geogr. Sin. 2020, 75, 961–974. (In Chinese) [Google Scholar]
  55. Ma, C.; Cui, P.; Zhong, G.; Meng, M.; Yang, C.; Ma, W. Impact of climate change and engineering activities on spatiotemporal changes of vegetation index along Qinghai-Tibet Railway. Geogr. Res. 2021, 40, 35–51. (In Chinese) [Google Scholar]
  56. Jiang, G.; Wang, L.; Yun, H.; Gao, S.; Wu, Q. Thermal influences of road engineering on permafrost underneath different surface condition in the Qinghai-Tibet Plateau. Cold Reg. Sci. Technol. 2020, 173, 103028. [Google Scholar] [CrossRef]
  57. Santero, N.J.; Masanet, E.; Horvath, A. Life-cycle assessment of pavements Part II: Filling the research gaps. Resour. Conserv. Recycl. 2011, 55, 810–818. [Google Scholar] [CrossRef]
  58. Sen, S.; Roesler, J. Aging albedo model for asphalt pavement surfaces. J. Clean. Prod. 2016, 117, 169–175. [Google Scholar] [CrossRef]
  59. Wu, Q.; Niu, F. Permafrost changes and engineering stability in Qinghai-Xizang Plateau. Chin. Sci. Bull. 2013, 58, 1079–1094. [Google Scholar] [CrossRef]
  60. Wei, G.; Gao, W.; Dong, N.; Wang, X.; Zeng, M. Test analysis on drainage base mixture of asphalt pavement in cold area. IOP Conf. Ser. Earth Environ. Sci. 2020, 510, 52006. [Google Scholar]
  61. Ding, M.; Zhang, Y.; Sun, X.; Liu, L.; Wang, Z.; Bai, W. Spatiotemporal variation in alpine grassland phenology in the Qinghai-Tibetan Plateau from 1999 to 2009. Chin. Sci. Bull. 2013, 58, 396–405. [Google Scholar] [CrossRef]
  62. Yang, Y.; Piao, S. Variations in grassland vegetation cover in relation to climatic factors on the Tibetan Plateau. Chin. J. Plant Ecol. 2006, 30, 1. (In Chinese) [Google Scholar]
  63. Zhang, Q.; Kong, D.; Shi, P.; Singh, V.P.; Sun, P. Vegetation phenology on the Qinghai-Tibetan Plateau and its response to climate change (1982–2013). Agric. For. Meteorol. 2018, 248, 408–417. [Google Scholar] [CrossRef]
  64. Jiao, K.; Gao, J.; Liu, Z. Precipitation Drives the NDVI Distribution on the Tibetan Plateau While High Warming Rates May Intensify Its Ecological Droughts. Remote Sens. 2021, 13, 1305. [Google Scholar] [CrossRef]
  65. Crausbay, S.D.; Ramirez, A.R.; Carter, S.L.; Cross, M.S.; Hall, K.R.; Bathke, D.J.; Betancourt, J.L.; Colt, S.; Cravens, A.E.; Dalton, M.S.; et al. Defining Ecological Drought for the Twenty-First Century. Bull. Am. Meteorol. Soc. 2017, 98, 2543–2550. [Google Scholar] [CrossRef]
  66. Michaletz, S.T.; Cheng, D.; Kerkhoff, A.J.; Enquist, B.J. Convergence of terrestrial plant production across global climate gradients. Nature 2014, 512, 39–43. [Google Scholar] [CrossRef]
  67. Liu, X.; Chen, Y.; Li, Z.; Li, Y.; Zhang, Q.; Zan, M. Driving Forces of the Changes in Vegetation Phenology in the Qinghai-Tibet Plateau. Remote Sens. 2021, 13, 4952. [Google Scholar] [CrossRef]
  68. Yu, H. Dynamics of Grassland Growth and Its Response to Climate Change on Tibetan Plateau. Ph.D. Thesis, Lanzhou University, Lanzhou, China, 2013. (In Chinese). [Google Scholar]
  69. Guo, L.; Cheng, J.; Luedeling, E.; Koerner, S.E.; He, J.-S.; Xu, J.; Gang, C.; Li, W.; Luo, R.; Peng, C. Critical climate periods for grassland productivity on China’s Loess Plateau. Agric. For. Meteorol. 2017, 233, 101–109. [Google Scholar] [CrossRef]
  70. Luedeling, E.; Guo, L.; Dai, J.; Leslie, C.; Blanke, M.M. Differential responses of trees to temperature variation during the chilling and forcing phases. Agric. For. Meteorol. 2013, 181, 33–42. [Google Scholar] [CrossRef]
  71. Xu, L.; Myneni, R.B.; Chapin, F.S.; Callaghan, T.V.; Pinzon, J.E.; Tucker, C.J.; Zhu, Z.; Bi, J.; Ciais, P.; Tommervik, H.; et al. Temperature and vegetation seasonality diminishment over northern lands. Nat. Clim. Chang. 2013, 3, 581–586. [Google Scholar] [CrossRef]
  72. Shen, M.; Piao, S.; Cong, N.; Zhang, G.; Janssens, I.A. Precipitation impacts on vegetation spring phenology on the Tibetan Plateau. Glob. Chang. Biol. 2015, 21, 3647–3656. [Google Scholar] [CrossRef]
  73. Knoche, M.; Fischer, C.; Pohl, E.; Krause, P.; Merz, R. Combined uncertainty of hydrological model complexity and satellite-based forcing data evaluated in two data-scarce semi-arid catchments in Ethiopia. J. Hydrol. 2014, 519, 2049–2066. [Google Scholar] [CrossRef]
Figure 1. Location and schematic diagram of the core and background areas of the study regions along the TG318 in Tibet.
Remotesensing 15 05473 g001
Figure 2. Framework for quantifying the relative contribution of climate and reconstruction effects.
Remotesensing 15 05473 g002
Figure 3. Diagram of the respective climate and reconstruction effects in the section of the TG318, taking the WS section as an example.
Remotesensing 15 05473 g003
Figure 4. Interannual changes in the mean growing-season EVI for different sections of the TG318 before and after reconstruction. (a) WS; (b) SL; (c) LN; (d) NE.
Remotesensing 15 05473 g004
Figure 5. Variation in the monthly EVI in different sections of the TG318 before and after reconstruction. (ad) For WS, SL, LN, NE before reconstruction. (eh) For WS, SL, LN, NE after reconstruction. * indicates significance at the 0.05 level.
Remotesensing 15 05473 g005
Figure 6. Spatial distribution of the mean growing-season EVI trend in the four sections of the TG318 before and after reconstruction. (a) Core area. (b) Background area.
Remotesensing 15 05473 g006
Figure 7. Percentages of the mean growing-season EVI in the four sections of the TG318 before and after reconstruction. (ad) The core area in the WS, SL, LN, and NE section. (eh) The background area in the WS, SL, LN, and NE section.
Remotesensing 15 05473 g007
Figure 8. Interannual variation of the growing season δ C i and δ B i for different sections of TG318 before and after reconstruction. (a) WS; (b) SL; (c) LN; (d) NE.
Remotesensing 15 05473 g008
Figure 9. Changes in the monthly δ C i and δ B i for different sections of the TG318 before and after reconstruction. (ad) For WS, SL, LN, NE before reconstruction. (eh) For WS, SL, LN, NE after reconstruction. * indicates significance at the 0.05 level.
Remotesensing 15 05473 g009
Figure 10. Relative contributions of (a) reconstruction and (b) climate change to the mean growing-season EVI. (The stars indicate the mean values of the contributions).
Remotesensing 15 05473 g010
Figure 11. Relative monthly contributions of reconstruction and climate change to the EVI. (a) WS; (b) SL; (c) LN; (d) NE.
Remotesensing 15 05473 g011
Figure 12. Structural equation model of the drivers of vegetation activity. (a) WS; (b) SL; (c) LN; (d) NE. Double-headed gray arrows indicate the covariance between these variables. Single-headed arrows indicate the hypothesized direction of causation, with positive and negative relationships in pink and blue, respectively. Arrow thickness is proportional to the strength of the relationships, and the standard path coefficients are adjacent to each arrow.
Remotesensing 15 05473 g012
Figure 13. Partial correlation coefficients for the mean growing-season EVI and corresponding climate variables for the four sections. (a) January–July; (b) February–August; (c) March–September; (d) April–October. * indicates significance at the 0.05 level.
Remotesensing 15 05473 g013
Figure 14. Partial correlation coefficients for the monthly EVI and corresponding climate variables for the four sections. (a) WS; (b) SL; (c) LN; (d) NE. * indicates significance at the 0.05 level.
Remotesensing 15 05473 g014
Figure 15. Maximum partial correlation coefficients between the monthly EVI and pre-growing-season climate variables for the four sections. (a) WS; (b) SL; (c) LN; (d) NE. * indicates significance at the 0.05 level.
Remotesensing 15 05473 g015
Table 1. Classification of the TG318 based on reconstruction time.
Road SectionLength (km)Pre-Reconstruction
Period (a)
Post-Reconstruction
Period (a)
West of Shigatse (WS)5102000–20052006–2021
Shigatse to Lhasa (SL)2962000–20052006–2021
Lhasa to Nyingchi (LN)4302000–20032004–2021
East of Nyingchi (NE)7902000–20082009–2021
Disclaimer/Publisher’s Note: The statements, opinions and data contained in all publications are solely those of the individual author(s) and contributor(s) and not of MDPI and/or the editor(s). MDPI and/or the editor(s) disclaim responsibility for any injury to people or property resulting from any ideas, methods, instructions or products referred to in the content.

