Abstract
Differential code bias (DCB) of satellite is an error that cannot be ignored in precise positioning, timing, ionospheric modeling, satellite clock correction, and ambiguity resolution. The completion of the third generation of BeiDou Navigation Satellite System (BDS-3) has extended DCB to multichannel code bias observations and observable-specific signal bias (OSB). In this paper, the DCB and OSB products provided by the Chinese Academy of Sciences (CAS) are analyzed and compared. The DCB parameters for the BDS satellites are applied in both single- and dual-frequency single point positioning (SPP), and the results are intensively investigated. Based on the satellite DCB parameters of the BDS, the performance of precise point positioning (PPP) with different frequency combinations is also analyzed in terms of positioning accuracy and convergence time. The standard deviations (STDs) of DCBs at each signal pair fluctuate from 0.2 ns to 1.5 ns. The DCBs of BDS-2 are slightly more stable than those of BDS-3. The mean values and STDs of C2I and C7I OSBs for BDS-2 are at the same level and are numerically smaller than their counterparts for the C6I OSBs. The mean OSBs for each signal of the BDS-3, excluding C2I, fluctuate between 12.35 ns and 12.94 ns, and the STD fluctuates between 2.11 ns and 3.10 ns. The DCBs and OSBs of the BDS-3 of the IGSO satellites are more stable than those of the MEO satellites. The corrections for TGD and DCB are able to improve the accuracy of single-frequency SPP by 44.09% and 44.07%, respectively, and improve the accuracy of dual-frequency SPP by 6.44% and 12.85%, respectively. The most significant improvements from DCB correction are seen in single-frequency positioning with B1I and dual-frequency positioning with B2a+B3I. DCB correction can improve the horizontal and three-dimensional positioning accuracy of the dual-frequency PPP of different ionosphere-free combinations by 13.53% and 13.84% on average, respectively, although the convergence is slowed.
1. Introduction
Since 31 July 2020, the third generation of BDS-3 independently developed by China has been providing all-weather, all-day, high-precision positioning, speed measurement and timing services for free to global users. GNSS hardware and physical limitations cause hardware delays in code and phase measurements during the signal’s transmission from a satellite or reception in a GNSS receiver [1]. The transmitter links of navigation signals are different from frequency to frequency, and the parameter used to describe the difference in hardware delays between two different frequencies is called DCB [2]. Due to the difference in the signal structure, signal regime, signal modulation method, and frequency of different navigation systems, the observables are affected by DCBs at both the satellite and receiver terminals. Satellite DCB is usually called timing group delay (TGD), while receiver DCB is called inter-frequency bias (IFB) [3,4]. The TGD parameters are broadcast in the navigation message. The IFB parameters are usually absorbed by the receiver clock or ambiguity parameters because the DCB at a certain signal at the receiver is the same for all satellites and is not considered when the receiver clock is an unknown parameter.
The broadcast TGDs in navigation messages agree well (within about 2 ns) with the MGEX DCBs after zero-mean normalization, and these parameters have the equivalent beneficial effect on positioning [5]. The position accuracy of triple-frequency SPP with the BDS only was improved by 74.6% after DCB correction [6]. The positioning accuracy of dual-frequency SPP with B1I/B3I and B1C/B2a showed that the improvement range for horizontal components is 60.2% to 74.4%, and the vertical components improved by about 50% after the modification of TGD and DCB [7]. The DCB correction resulted in millimeter- to centimeter-scale improvements in static PPP and centimeter- to decimeter-scale improvements in dynamic PPP for both GPS and BDS [8]. Static PPP accuracy exhibited a millimeter-level improvement and accuracy was improved by about 10% after DCB correction [9]. The uncorrected code biases can pollute the receiver clock and carrier phase ambiguities and impede the rapid convergence of PPP [5]. The convergence of PPP with B1I/B3I and B1C/B2a can be accelerated by up to 50% when the DCBs are corrected [7]. With DCB products, the convergence time of single-frequency PPP with BDS-2 can also be shortened significantly [10]. Although the DCB had no influence on the accuracy of PPP with any ionosphere-free combinations, the convergence speeds were greatly improved by the TGD/DCB correction [11]. Zhang et al. demonstrated DCB slightly better than TGD and could also speed up the convergence of PPP with B1I/B3I [12]. These analyses of positioning accuracy and the convergence of PPP under different combinations of DCB and TGD are far from comprehensive and are worthy of further study.
With the completion of BDS-3 and the upgrade to BDS ground receivers, more comprehensive observation data, navigation messages, and DCB products can be obtained, which provide a good basis for DCB research. In order to directly apply kinds of code bias to GNSS original observation data [13], directly describe the bias of individual pseudo-range measurements without difference, and reduce the associated redundant code bias, the Bias and Calibration Working Group (BCWG) established by the IGS advocates for the expansion of traditional DCB to the absolute parameter of OSB to adapt to multi-mode and multi-frequency GNSS applications and developments [14,15]. Nevertheless, a comprehensive study of each signal channel of DCBs and OSBs is lacking in the existing literature. Furthermore, the stability, correlation, and influence of TGD and multichannel DCBs on BDS positioning are still unclear. There are few studies on the stability of the multichannel DCB of BDS-3 and its comparative analysis with OSB. In this paper, we describe the linear combination relationship between DCB and OSB by analyzing their time-varying characteristics, and, on this basis, we comprehensively analyze the effect of multichannel DCB on the positioning performance of SPP and PPP considering the new signal of BDS-3.
2. BDS Satellite DCB and OSB Parameters
Occurring at both satellite and receiver ends, DCB is caused by differences in the time delays of signals between different channels, and it can be subdivided into inter-frequency bias and intra-frequency bias [16]. The clock of each satellite or receiver is relative to a certain frequency or combination of frequencies. When calculating the satellite and receiver clock of different frequencies, DCB or TGD correction is required due to the differences in hardware delays. The clock reference for BDS broadcast ephemeris is based on the B3I signal [17]. Different analysis centers may choose different combinations of observation values when generating the precise clock and orbit products of different systems, which need to be distinguished in practical applications. At present, the precise satellite orbit and clock products of GFZ and Wuhan University (WHU) are based on the ionosphere-free combination of B1I and B3I for both the BDS-2 and BDS-3 satellites [18].
The BDS-2 satellites transmit public signals at frequencies of B1I, B2I, and B3I, while the B1I, B1c, B2a, B2b, and B3I signals are transmitted on BDS-3 satellites [19]. The new signal structure for the BDS makes it possible to generate code and phase observations based on one channel or a combination of several channels. In order to simply reflect the detailed characterization of the actual signal generation, three characters are employed to indicate observation code types (C/L/D/S), frequency bands or frequencies (1, 2, …, 8),and trace modes or channels (I, Q, etc.); relevant information concerning all BDS signals is listed in Table 1.

Table 1.
Information for BDS-2 and BDS-3.
DCB parameters can usually be estimated together with ionospheric model coefficients from international GNSS service stations. The DCB products of the BDS are mainly currently provided by two analysis centers, i.e., the Wuhan Institute of Geodesy and Geophysics (IGG) of the CAS and the German Aerospace Agency (DLR). The CAS has been providing multi-system DCB products in the format of Bias SINEX (BSX) to the IGS based on the extended IGGDCB method since 2015 [20]. The DCB products provided by the CAS are updated daily with a latency of 2~3 days and contain 11 main DCB parameters that are listed in Table 2. The DCB products provided by the DLR are updated every three months, including GPS, GLONASS, Galileo, and BDS data. The types of DCB observed by the DLR include C1X–C2I, C2I–C5X, C2I–C8X, C2I–C6I, C2I–C7I, and C2I–C7Z DCB [21]. Although MGEX DCBs from the CAS and DLR exhibit consistency at the level of 0.3 ns and 0.4 ns for C2I–C7I and C2I–C6I, respectively [22], there is no specific analysis of the short- and long-term time-varying characteristics of the DCB and OSB parameters of BDS-3.

Table 2.
Statistics of observed values and display satellites in DCB products of the CAS.
Actually, the defined DCBs are not completely independent from each other. Taking the OSBs of BDS-3 as an example, the B3I signal is selected as the reference signal and data component of each signal to act as the reference observation type to characterize the intra- and inter-frequency code bias parameters in the form of absolute parameters [23]. In this way, the code bias parameters are independent and uncorrelated with each other. The code bias between any two observations can be obtained by the linear combination of the above defined OSB. OSB is more flexible since it is not concerned with the reference frame of the code bias and is directly confronted with the raw data [24]. The main OSB products provided by the CAS and corresponding satellites are shown in Table 3.

Table 3.
Statistics of observed values and display satellites in OSB products of the CAS.
In addition to DCB products, BDS navigation messages also contain group delay correction parameters to compensate for the influence of hardware delays. The navigation message types, modulation modes, and symbol rates for different types of satellites and signals are shown in Table 4. Attention should be paid to the different types of BDS navigation messages when correcting the group delay.

Table 4.
BDS navigation message type and signal structure.
3. BDS DCB Positioning Correction Model
3.1. BDS Pseudo-Range Observation Equation
At the present stage, the BDS has disclosed the single- and dual-frequency services of four signals, i.e., B1I, B3I, B1C, and B2a. The B1I or B1C signals are recommended for single-frequency services, while the signal combinations B1I/B3I and B1C/B2a are recommended for dual-frequency services [25]. With the satellite hardware delay considered, the observation equation of the BDS pseudo-range measurement can be expressed as
where the subscript i (=1, 2, 3, 4) indicates the signals of B1I, B2a, B3I, and B1C and represents the geometric distance between satellite and receiver. and stand for the satellite and receiver clock errors, respectively. and are the tropospheric delay and the corresponding slant ionospheric delay on the frequency , respectively. equals is the ionospheric multiplier factor and is the corresponding frequency, with c representing the velocity of light in a vacuum. The multipath errors and other unmolded errors for pseudo-range observations are ignored in the above equation for simplicity. The receiver hardware delay is the same for common-view satellites with the same frequency at each epoch, and it is usually absorbed into the receiver clock or ambiguity parameters. Therefore, the receiver hardware delay is no longer considered, and only represents the satellite hardware delay in the following sections.
3.2. DCB Correction Based on the BDS Broadcast Satellite Clock
The hardware delay in the BDS navigation message is referenced to the B3I signal. The satellite clock of the BDS’s broadcast ephemeris is also based on the B3 signal; thus, for SPP using only the broadcast ephemeris and the observation file data, the signals of all frequencies need to take into account the hardware delay introduced by the broadcast ephemeris clock reference. The TGD parameters (TGD1/TGD2) provided by D1 and D2 navigation messages are the hardware delays of B1I and B2I signals with respect to those of the B3I reference signal [26]. Since the B1C and B2a signals contain pilot components and data components, the B-CNAV1 and B-CNAV2 navigation messages contain delay difference compensation for B1C and B2a pilot components to compensate for delay differences between the data components and pilot components of corresponding signals. The broadcast clock information of the BDS contains the hardware delay of B3I, which can be defined as follows:
where represents the satellite clock from the IGS broadcast ephemeris.
Combined with Equation (1) and considering the definition of DCB, the single-frequency pseudo-range observation quantity of the BDS can be written as follows [27]:
where (i, j = 1, 2, 3, 4) is defined as the DCB and represents the difference in hardware delay from signal i to signal j. For the dual-frequency ionosphere-free linear combination, the satellite hardware delay relative to the benchmark for any two signal combinations is
The DCB correction model of the dual-frequency observation equation of different signal combinations based on Equation (4) can be written as
3.3. DCB Correction Based on the Precise Satellite Clock of the BDS
The satellite hardware delay corrections of the precise satellite clock based on the ionosphere-free combination of B1I and B3I can be expressed as
Substituting Equation (6) into Equation (1), the single-frequency observation equation with DCB correction for the precision satellite clock can be described as
The ionosphere-free combinations of pseudo-ranges with hardware delay corrections based on DCBs can be written as
where , and can be obtained directly from DCB products in the BSX format. The other DCBs can be calculated through linear combination of the existing DCBs or OSBs, and the equations can be expressed as
4. Time-Varying Characteristics of DCB and OSB on BDS Satellites
More detailed analyses were conducted with DCB and OSB products from Jun 2020 to Jun 2021 that were provided by the CAS. In the following sections, the long-term and short-term stability of BDS DCBs and OSBs are comprehensively analyzed from the perspectives of the mean, STD, and monthly STD. As an absolute bias, OSB can be converted into the corresponding DCB. The differences between DCBs and combined OSBs are also compared.
4.1. Stability of DCB and OSB Obtained from the CAS
The temporal variations in DCBs for the signals of BDS-2 and BDS-3 from the CAS are shown in Figure 1 and Figure 2, respectively. Each satellite is represented by a different color in the sequence diagram, and the satellites in bold font are IGSO satellites (i.e., C07, C08, C09, C10, C13, C16, C38, C39, and C40). As can be seen from Figure 1, there is no obvious fluctuation in the DCBs of C2I-C7I. In January 2021, the DCBs of C2I-C6I for the IGSO satellites jump up about 4 ns to 13 ns, while those of MEO and GEO satellites drop by about 2 ns. We learned through consultation that it was due to a change in the carrier-to-noise ratio (C/N0) of B3I that corresponded to several IGSO satellites of BDS-2 for a period of time in early 2021. There will be a maximum variation of about 10 dB from station to station, and anomalous changes in the C/N0 of these satellites (possibly from on-board adjustments or tests) lead to changes in the corresponding B3I pseudo-range observations, which in turn cause changes in the C2I–C6I DCB. The reasons for the inconsistent jumps between different satellites are mainly related to the different observation times, geometries, and orbit repetition periods of different types of satellites. As shown in Figure 2, the DCBs of C1P–C5P and C1P–C6I are more stable in 2020 than in 2021. The DCBs of C1X–C5X, C1X–C6I, C1X–C7Z, and C1X–C8X have good stability. The DCBs of C1P–C5P and C1P–C6I for every satellite show obvious jumps on Day of Year (DOY) 8 and DOY 90. This is because the DCBs of C1P–C5P and C1P–C6I for satellite C41~C46 were observed from DOY 8. The DCBs of C1P–C5P and C1P–C6I for C38, C39, and C40 were just obtained from DOY 21 to DOY 90 in 2021. Instead of daily DCB values, the DCB of each signal pair of each satellite stays the same for every ten days from DOY 101 in 2021 onwards.
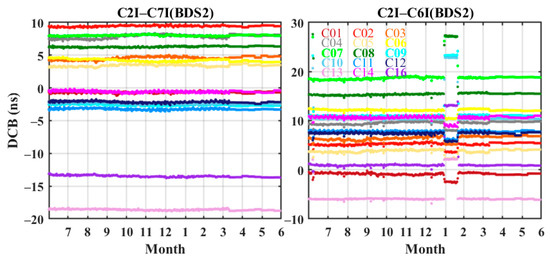
Figure 1.
Time series of CAS BDS-2 DCBs from July in 2020 to June in 2021.
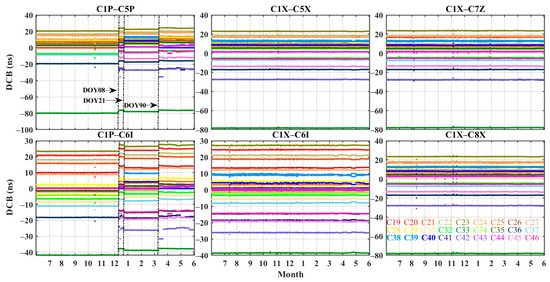
Figure 2.
Time series of CAS BDS-3 DCBs from July in 2020 to June in 2021.
Figure 3 shows the temporal variations in OSBs for the three frequencies of BDS-2. The OSBs of C2I, C6I, and C7I remain stable from July to December 2020. In February 2021, the OSBs of C2I, C6I, and C7I for the six IGSO satellites (in bold), i.e., C07, C08, C09, C10, C13, and C16, decrease by 20.73, 31.39, and 20.73 ns on average, respectively. The OSBs of C2I, C6I, and C7I for the MEO and GEO satellites increase by 3.31, 5.01, and 3.30 ns on average, respectively. The fluctuations in the OSBs of the MEO and GEO satellites are consistent and obviously different from the fluctuations of the IGSO satellites. The variation in the B3I signal C/N0 value corresponding to the satellites of the IGSO of BDS-2 affects the B3I pseudo-range observation, which in turn affects the OSB estimation of C6I, leading to anomalous fluctuations in the OSB of the IGSO satellites. Figure 4 shows the temporal variations of the eight OSBs of BDS-3. The OSB variations in C1X, C2I, C5X, C6I, C7Z, and C8X tend to be consistent for all satellites. The OSB files provided by the CAS do not contain the OSBs of C1P and C5P for satellites C38 to C46 until 2021. As the observables of the new satellites are involved in the estimation of the OSBs, the OSBs of C1P and C5P have a significant jump in the beginning of 2021. All OSBs jump about 5 ns in February 2021, and the subsequent fluctuations are consistent with the changes in DCB. The fluctuation in the OSB of each satellite in this time period is mainly caused by the change in the B3I (C6I) pseudo-range signal. In the processing strategy of the OSB of the CAS, to ensure the derived OSBs are compatible with the IGS clock product, the constraint between the two signals, which is conventionally employed in the generation of satellite clock offsets, is applied [15]. When the C6I (B3I) OSB changes abnormally, it will also cause a change in the OSB of other signals. Thus, in February 2021, the OSB of all signals fluctuated.

Figure 3.
Time series of CAS BDS-2 OSBs from July in 2020 to June in 2021.
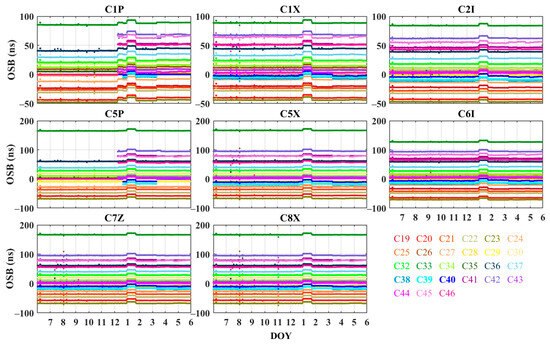
Figure 4.
Time series of CAS BDS-3 OSBs from July in 2020 to June in 2021.
Figure 5 shows the mean values and STDs of DCBs and the combined OSB values of the BDS. In general, the stability of DCBs and the combined OSB values of BDS-2 are equivalent. The mean STD of the C2I–C7I DCBs of the IGSO satellites is 0.12 ns, slightly better than the 0.13 ns of the MEO satellites and the 0.18 ns of the GEO satellites. The mean STD of the C2I–C6I DCBs of the IGSO satellites is 2.28 ns, larger than the 0.43 ns of the MEO satellites and the 0.44 ns of the GEO satellites. The BDS-3 DCBs are more stable than the corresponding values computed with the OSBs. The BDS-3 DCBs of the IGSO satellites are obviously more stable than those of the MEO satellites, with mean STDs of 0.42 ns and 0.84ns on average, respectively. The better stability of DCBs for the IGSO satellites is due to the longer observation arcs and wider geographic coverage [28]. The observables of the MEO satellites are more prone to being affected by elevation-dependent bias than those of the GEO and IGSO satellites, leading to less stability in the solution results.
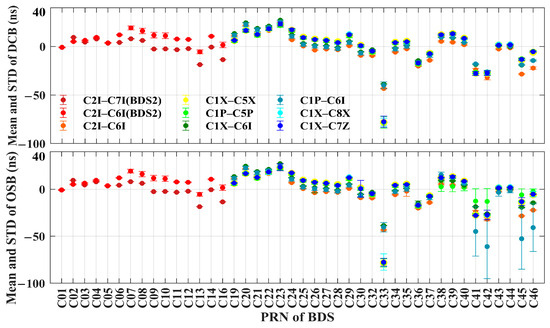
Figure 5.
Mean values and STDs of DCBs and combined OSB values.
As can be seen from Table 5, the BDS-2 DCBs of C2I–C7I and the BDS-3 DCBs of C1X–C5X are stable, with mean STDs of 0.14 ns and 0.15 ns, respectively. The BDS-3 DCBs of C1P–C5P and C1P–C6I have larger fluctuations, with mean STDs of 1.53 ns and 1.55 ns. The annual means of C2I–C7I, C1X–C5X, C1P–C5P, C1X–C6I, C1P–C6I, C1X–C7Z, and C1X–C8X DCBs are close to zero, and this is mainly attributed to the constraint of the “zero mean” benchmark in the estimation of DCB parameters. The annual means of C1P–C5P and C1P–C6I DCBs deviate from the zero-mean values due to the addition of new satellites to C1P and C5P in 2021. The mean values and STDs of C2I–C7I and C2I–C6I DCBs and the combined OSB values of BDS-2 are highly consistent. Among the combined OSB values of BDS-3, C1X–C5X has the smallest fluctuation and C1P–C6I has the largest fluctuation, with mean STDs of 0.22 and 2.16 ns, respectively. The mean difference between the DCBs and combined OSB values for each channel is 0.18 ns, and the mean STD is 0.23 ns.

Table 5.
Mean values and STDs of DCBs and combined OSB values for each signal channel.
The mean values and STDs of the raw BDS OSBs for each satellite and each signal are given in Figure 6 and Table 6. The mean values are positive for BDS-3 OSBs and mostly negative for BDS-2 OBSs. The differences between the means of C2I and C7I OSBs for BDS-2 and C1X, C5X, C6I, C7Z, and C8X OSBs for BDS-3 are all no more than 0.01 ns. The STD of BDS-3 OSBs after removing some of the more volatile satellites is less than that of BDS-2 OSBs and generally fluctuates between 1 and 4 ns.
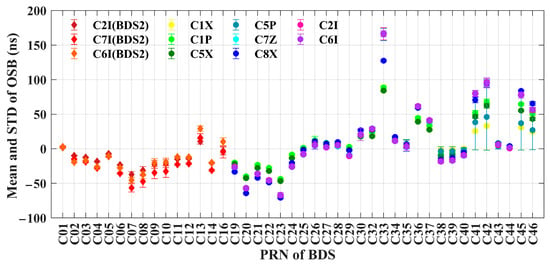
Figure 6.
Mean values and STDs of the BDS OSBs.

Table 6.
Mean values and STDs of the BDS OSBs.
We further analyzed the short-term stability of DCBs and OSBs on a monthly basis. Figure 7, Figure 8 and Figure 9 show the monthly STDs of the BDS DCBs. The bars in different colors represent the monthly stability of DCB in different months. The mean monthly STDs of C2I–C7I DCBs for the GEO, MEO, and IGSO satellites are 0.10, 1.17, and 0.08 ns, while those of C2I–C6I DCBs are 0.22, 3.04, and 9.40 ns, respectively. The monthly stability of C2I–C7I DCBs is higher than that of C2I–C6I DCBs for BDS-2 in Figure 7. The stability of the DCB of C2I–C6I for the C07, C08, C09, C10, C13, and C16 satellites is worse in July 2020, January 2021, and February 2021. For the DCBs of BDS-3, the mean monthly STDs of every signal pair of the MEO satellites are all smaller than those of the IGSO satellites, which indicates the better monthly stability of MEO satellites. Overall, the DCBs of C1X–C5X and C1P–C5P for BDS-3 have the best and worst stability, with mean monthly STDs of 0.12 ns and 0.63 ns, respectively. The monthly stabilities of the C1P–C5P and C1P–C6I DCBs are similar. The overall stabilities of the C1X–C5X and C1X–C6I DCBs are consistent and good in Figure 8. The sum of STDs of C1X–C5X and C1X–C6I DCBs are less than 2 ns for all the displayed satellites except C36, C38, C39, C40, and C46. The maximum values of the monthly STDs of the C1X–C7Z and C1X–C8X DCBs are found for satellite C33, with values of 14.26 ns and 14.42 ns, respectively. The stability of the DCBs for satellite C33 is very poor for C1X–C7Z, C1P–C5P, C1X–C6I, and C1X–C8X, and the STD varies greatly from month to month.
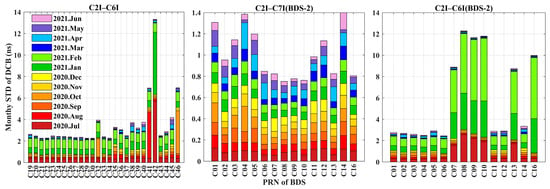
Figure 7.
Monthly STDs of C2I–C6I, C2I–C7I (BDS-2), and C2I–C6I (BDS-2) DCBs.
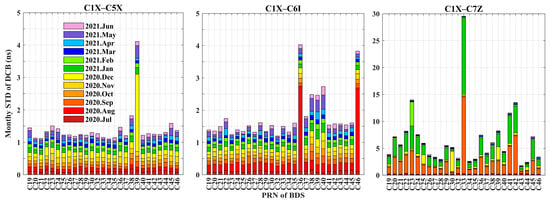
Figure 8.
Monthly STDs of C1X–C5X, C1X–C6I, and C1X–C7Z DCBs.
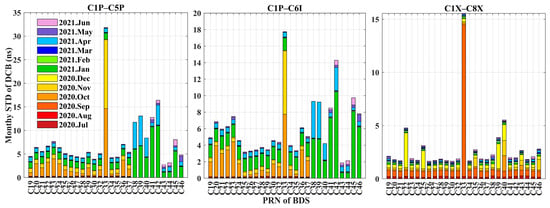
Figure 9.
Monthly STDs of C1P–C5P, C1P–C6I, and C1X–C8X DCBs.
The monthly STDs of the raw BDS OSB values are shown in Figure 10, Figure 11 and Figure 12. The monthly stabilities of the C6I, C2I, and C7I OSBs of BDS-2 remain highly consistent in Figure 10. The mean monthly STDs of the C6I, C2I, and C7I OSBs are 0.21, 0.33, and 1.69 ns for the GEO satellites, 5.95, 9.01, and 6.75 ns for the MEO satellites, and 18.22, 27.59, and 18.63 ns for the IGSO satellites, respectively. The OSBs of the GEO satellites have the best monthly stability. The OSBs of the IGSO satellites of BDS-2 were less stable during July, January, and February. For the OSBs of BDS-3, the mean monthly STDs of the IGSO satellites are less than 1.33 ns and those of the MEO satellites are less than 3.45 ns. Overall, the OSBs of C2I and C8X for BDS-3 have the best and worst stability, with mean monthly STDs of 0.53 ns and 3.18 ns, respectively. Satellites C38~C46 started broadcasting the OSBs of C1P and C5P in 2021, as shown in Figure 11. Perhaps because the number of satellites participating in OSB calculations in January and February was not stable, the STDs of the OSBs of all satellites in January and February were higher than those of the previous month. The OSBs of the BDS-3 pilot components of the C1P signals are as stable as those of the C5P signals. The CIP and C5P OSBs for satellites C32, C33, C38, C39, C40, C41, C42, C45, and C46 fluctuate considerably during October, November, and January. The OSBs of mixed pilot and data components of C1X are as stable as the OSBs of C5X. The C1X and C5X OSBs of satellites C26, C32, C35, C36, C41, C42, and C46 were not stable between August and October. The OSBs of C6I and C2I for satellites C32, C41, C42, and C46 were not stable in August and October, as shown in Figure 12. In addition, the satellites with the larger monthly STDs of C7Z OSBs are basically the same as those of C8X OSBs. Both C7Z and C8X are mixed component signals. These all indicate that OSBs with the same signal channel or signal component (i.e., I, P, X) have consistent monthly stability. The monthly STDs of OSBs more intuitively reflect the stability of a signal’s code biases than those of DCBs.
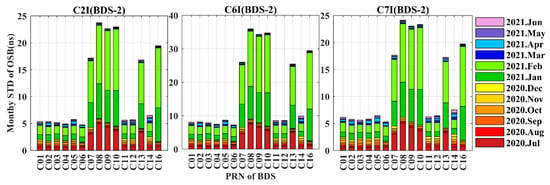
Figure 10.
Monthly STDs of C2I, C6I, and C7I OSBs for BDS-2.
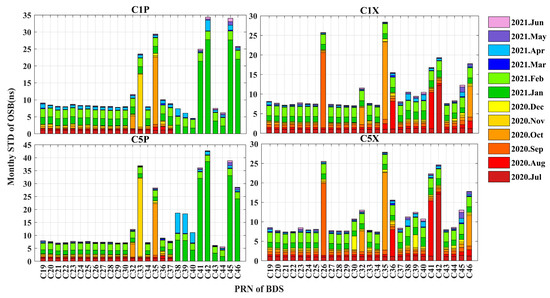
Figure 11.
Monthly STDs of C1P, C1X, C5P, and C5X OSBs for BDS-3.
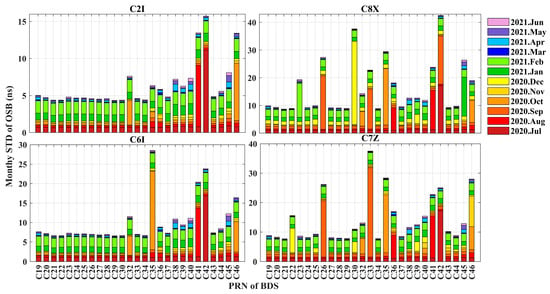
Figure 12.
Monthly STDs of C2I, C8X, C6I, and C7Z OSBs for BDS-3.
4.2. Comparison of DCB and OSB Obtained from the CAS
To compare DCB and OSB products released by the CAS, we calculated the differences between the DCBs and the combined OSB values of different satellites. Figure 13 shows the time series of the differences between DCBs and combined OSB values for nine signal pairs for BDS. As shown in Figure 13, the average differences of each signal pair are stable, varying between −3 ps and 3 ps. The smallest mean difference is −0.1 ps, appearing in the C2I–C7I channel of BDS-2, while the largest mean difference reaches 2.7 ps, appearing in the C1P–C6I channel of BDS-3. The mean values of the differences between DCBs and the combined OSB values of each signal pair of satellite C35 are higher than those of other satellites, except for C2I–C6I. The differences between DCBs and combined OSB values for C1X–C8X fluctuate between −20 ps and −10 ps. It can also be seen that the differences between DCBs and the combined OSB values of different signal pairs of different satellites have remained constant every ten days since March 2021. Figure 14 shows the mean values of the differences between DCBs and the combined OSB values of different satellites with different markers. The mean values and STDs of the differences between DCBs and the combined OSB values of C2I–C7I are both the smallest. The overall magnitude of the differences between DCBs and combined OSBs is very small, which indicates that the DCBs and combined OSBs have good consistency. Combined OSB values should have the same impact on positioning as DCBs.
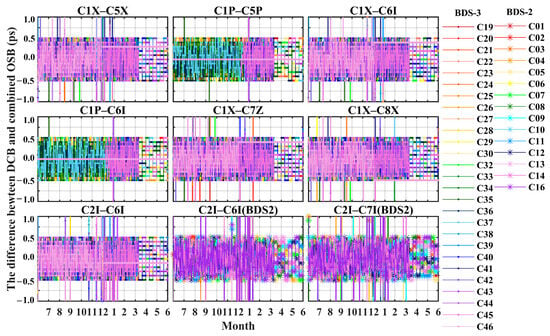
Figure 13.
The differences between DCBs and the combined OSB values.
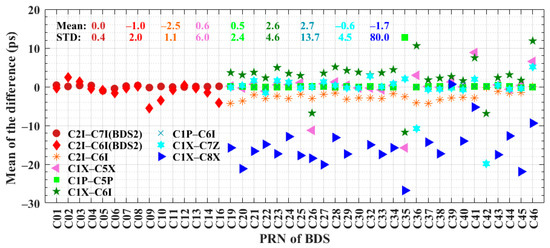
Figure 14.
Mean values and STDs of the differences between DCBs and the combined OSB values of BDS satellites.
5. Impact of BDS Satellite DCB on Positioning
5.1. Performance of SPP
Six global GNSS tracking stations that could simultaneously observe BDS B1I, B2a, B3I, and B1C signals on DOY 158 of 2021 were selected in this SPP experiment, including JFNG, POTS, SGOC, ULAB, URUM, and WUH2. Multi-system DCB products provided by the CAS were selected to correct the code bias. The broadcast ephemeris and the reference coordinates were provided by the IGS.
The experimental single-frequency SPP adopted B1I, B2a, B3I, and B1C signals, and the dual-frequency SPP adopted B1I+B2a, B1I+B3I, B1I+B1C, B2a+B3I, B2a+B1C, and B3I+B1C signal combinations. Three strategies were adopted in the experiment: (1) strategy Ⅰ (no-corr): SPP without any time delay correction; (2) strategy Ⅱ (tgd-corr): SPP for time delay correction using the IGS broadcast ephemeris or complementary use of TGD from the broadcast ephemeris (D1 and D2 broadcast ephemerides from B1I and B3I signals and B-CNVA1 and B-CNVA2 broadcast ephemerides from B1C and B2a signals of BDS-3) provided by the Test and Assessment Research Center (TARC) of the China Satellite Navigation Office; (3) strategy Ⅲ (dcb-corr): SPP using DCB for delay correction. The impact of DCB on the positioning accuracy of the BDS was analyzed by comparing the correction effect of the TGD provided in the broadcast ephemeris. SPP selects least squares for parameter estimation. The tropospheric delay is corrected using the Saastamoinen model. The ionospheric delay is corrected by the Klobuchar model. Shown in Figure 15 are the single-frequency SPP errors in the east (E), north (N), and up (U) directions with the signals of B1I, B2a, B3I, and B1C for the WHU2 station with different strategies. The positioning errors in the E, N, and U directions are displayed in the top, middle, and bottom rows of the panels. Each column of panels corresponds to results with one of the four signals, i.e., B1I, B2a, B3I, and B1C from left to right. In each panel, the positioning errors with no correction, TGD correction, and DCB correction are displayed as green, blue, and red points, and the corresponding mean values and root mean square (RMS) values are also marked. The positioning accuracy of single-frequency SPP was obviously improved after TGD or DCB correction, as shown in Figure 15. The mean values of positioning errors in the E, N, and U directions are 1.06, 0.33, and 0.39 m with TGD correction and 1.06, 0.32, and 0.38 m with DCB correction, which are improved by an average of 23.21% and 23.54% compared with no correction. The mean values of positioning errors of B1I, B2a, and B1I SPP in the three directions are improved by an average of 34.40%, 21.37%, and 37.09% with TGD correction and by an average of 34.99%, 21.33%, and 37.84% with DCB correction, respectively. The TGD and DCB correction effects for B1I, B1C, and B2a are basically the same. As the satellite clock of the broadcast ephemeris refers to the B3I signal, there is no difference in the B3I results under the three strategies, as shown in Figure 15.
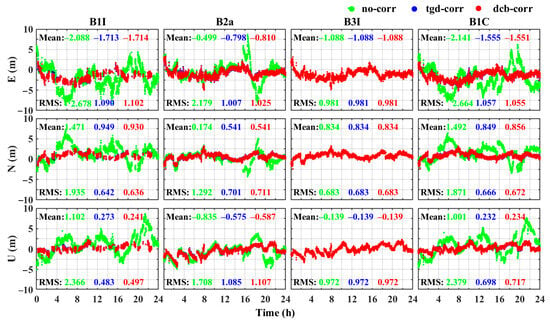
Figure 15.
Positioning errors of single-frequency SPP for the WHU2 station with the three strategies.
The horizontal (2D) and three-dimensional (3D) mean values and RMS values of positioning errors with the three strategies were calculated and are shown in Figure 16. After TGD and DCB correction of single-frequency SPP, horizontal and 3D positioning accuracies were significantly improved compared with no correction, and the improvement effect of TGD and DCB correction was basically identical. Considering the results of the six stations, the horizontal positioning and 3D positioning accuracies were improved by 41.94% and 41.93% with TGD correction and by 44.09% and 44.07% with DCB correction, respectively. The mean values of horizontal positioning errors for B1I, B2a, and B1C were reduced by an average of 35.94%, 30.70%, and 34.87% with TGD correction and by an average of 34.20%, 29.82%, and 35.33% with DCB correction, respectively (all compared with the positioning results with no correction). The 3D positioning errors of B1I, B2a, and B1C were reduced by 43.80%, 29.76%, and 41.33% with TGD correction and by 42.53%, 29.22%, and 41.76% with DCB correction, respectively. The DCB correction effect of B1I was better than that of B1C and B2a. DCB products provided by the CAS and TGD from the TARC and IGS had the same effect on positioning.
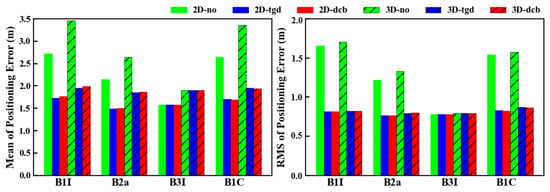
Figure 16.
Horizontal and 3D positioning errors of single-frequency SPP with the three strategies.
Figure 17 and Figure 18 describe the positioning errors of the BDS dual-frequency ionosphere-free combination SPP under the above three strategies (taking the WUH2 station as an example). The red and blue sequences are more concentrated and continuous than the green ones in Figure 17 and Figure 18, especially the solution result of B3I+B1C, which indicates that the positioning results are improved after TGD and DCB correction. Comprehensively considering the calculation results of the six stations, the positioning accuracies were improved by 49.12% with TGD correction and by 51.95% with DCB correction compared with the positioning results with no correction. The mean values of positioning errors in the E, N, and U directions were 0.47, 0.33, and 0.60 m with TGD correction and 0.39, 0.26, and 0.62 m with DCB correction. The effect of DCB and TGD correction on the E and N directions was better than that on the U direction. The mean RMS values of positioning errors in the E, N, and U directions were on average 1.30 m with no correction, 1.13 m with TGD correction, and 0.97 m with DCB correction.
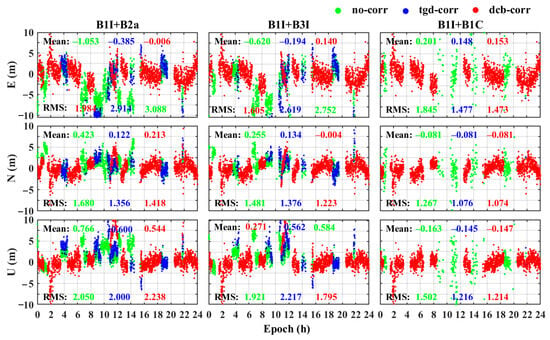
Figure 17.
Positioning errors of BDS dual-frequency SPP (combination of B1I+B2a, B1I+B3I, and B1I+B1C) for the WUH2 station with the three strategies.
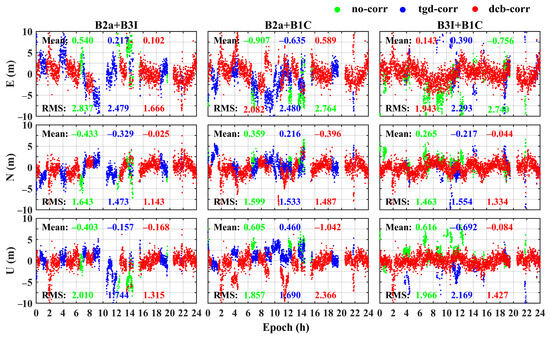
Figure 18.
Positioning error of BDS dual-frequency SPP (combination of B2a+B3I, B2a+B1C, and B3I +B1C) for the WUH2 station with the three strategies.
Figure 19 shows the mean values and RMS values of horizontal and 3D positioning errors under different strategies. Compared with the performance of single-frequency SPP in Figure 15, the corrective effect of dual-frequency combination is more obvious. As can be seen from Figure 19, the horizontal and 3D positioning accuracies were improved by 8.21% and 6.44% with TGD correction and improved by 18.99% and 12.85% with DCB correction, respectively. The mean values of horizontal positioning errors with no correction, TGD correction, and DCB correction are 2.23, 2.05, and 1.81 m, respectively, and the corresponding mean 3D positioning errors are 2.86, 2.68, and 2.44 m, respectively. The RMS values for horizontal positioning errors are 1.73, 1.62, and 1.39 m, respectively, and the RMS values of 3D positioning errors are 2.10, 1.99, and 1.85 m in the three strategies. For the positioning results with different signal combinations, the correction effect of DCB was obviously better than that of TGD, and B1I+B1C and B3I+B1C had the best and worst correction effect in terms of DCB. Using the positioning results with no correction as a reference, the positioning accuracies of B1I+B2a, B1I+B1C, B2a+B3I, B2a+B1C, and B3I+B1C with TGD correction are respectively increased by 16.66%, 34.69%, 11.49%, 4.19%, and 1.11%. Meanwhile, the positioning accuracies of B1I+B2a, B1I+B3I, B1I+B1C, B2a+B3I, and B2a+B1C with DCB correction are increased by 17.61%, 24.75%, 40.48%, 30.50%, and 12.87%, respectively.

Figure 19.
Horizontal and 3D positioning errors of dual-frequency SPP with the three strategies.
5.2. Performance of PPP
To further analyze the static PPP performance of DCB corrections, a dual-frequency PPP experiment based on DCB was carried out on observation data from the six stations using the strategy shown in Table 7. Figure 20 indicates the positioning errors of dual-frequency PPP with the two strategies for the E, N, and U directions of the ULAB, URUM, and WUH2 stations. Strategy Ⅰ (no-corr) and strategy Ⅱ (dcb-corr) are indicated by solid and dotted lines. The red, yellow, blue, green, and purple lines indicate B1I+B2a, B1I+B3I, B2a+B3I, B2a+B1C, and B3I+B1C PPP, respectively. The convergence criteria are that deviation in the E and N directions is less than 0.05 m and that subsequent epochs are stable within 0.05 m, with the convergence time of the PPP being the time taken from the beginning of the solution to the epoch.

Table 7.
BDS PPP processing strategy.
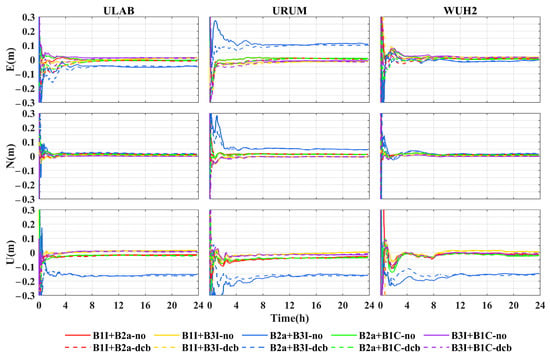
Figure 20.
PPP positioning errors of the ULAB, URUM, and WUH2 stations.
As can be seen from Figure 20, DCB can effectively improve PPP accuracy and the results are more stable, though the improvement in convergence time is not obvious. The positioning results of B2a+B3I are significantly different from those of other signal combinations at the following three stations. Compared with the positioning results with no correction, positioning accuracy in the E, N, and U directions was improved by 6.23%, 20.97%, and 17.07% with DCB correction. The convergence time of B2a+B3I PPP with DCB correction was shorter than that with no correction, as shown in Figure 20. The convergence time of the B1I+B2a, B1I+B3I, B2a+B1C, and B3I+B1C signal combinations of PPP decreased. Only the convergence of the B2a+B3I signal combination was accelerated by 27.96%. Mean deviation in the E, N, and U directions under the five signal combinations after correcting DCB reached the centimeter level. The mean values of the positioning errors in the E, N, and U directions with DCB correction were 1.79, 1.13, and 3.77 cm, respectively, which were reduced by 39.40%, 9.42%, and 8.36% compared with the positioning results with no correction. The PPP of B2a+B1C signal combinations with DCB correction had the largest improvement, and the positioning errors of the three directions were reduced by 25.84% on average after DCB correction. The mean RMS values of the positioning errors in the E, N, and U directions changed from 1.29, 0.57, and 1.60 cm with no correction to 1.21, 0.58, and 1.59 cm after DCB correction. Considering that the DCB of the new signal of BDS-3 may affect the estimation of the receiver clock and the combined ionosphere-free ambiguity parameters of the parameters to be estimated, this may lead to longer convergence time for PPP. Overall, the correction of DCBs has a negative impact on the convergence time of PPP.
Figure 21 shows the mean values and RMS values of the horizontal and 3D positioning errors for BDS dual-frequency PPP with the two strategies. The mean horizontal and 3D positioning errors are less than 2 cm and 3 cm, respectively. Without considering the DCB correction effect of B1C+B2C, the horizontal and 3D positioning accuracies are improved by 13.53% and 13.84% with DCB correction. The DCB correction for B1I+B3I shows the greatest improvement in positioning accuracy, with an improvement of 21.00% in horizontal direction and 17.68% in 3D. The mean values of the horizontal and 3D positioning errors are reduced from 2.46 cm and 5.03 cm with no correction to 2.16 cm and 4.68 cm with DCB correction, as shown in Figure 21 The mean RMS values of the horizontal and 3D positioning errors are changed from 1.22 cm and 1.78 cm with no correction to 1.03 cm and 2.01 cm with DCB correction. With DCB correction, the mean horizontal positioning errors of B1I+B2a, B1I+B3I, B2a+B3I, B2a+B1C, and B3I+B1C PPP are reduced by 4.11%, 17.65%, 7.64%, 24.21%, and 11.23%, respectively. Meanwhile, the mean 3D positioning errors are also reduced by 2.52%, 20.01%, 2.03%, 12.03%, and 9.42%, respectively.
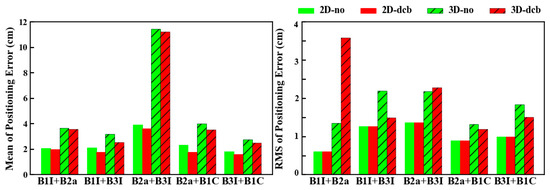
Figure 21.
The mean values and RMS values of positioning errors with and without DCB correction for dual-frequency PPP.
6. Discussion
DCB and OSB characterize pseudo-range hardware bias in differential and absolute form, respectively. The CAS offers DCB and OSB products with high stability in timing. However, large numerical variations occur when new satellites are added, and the data quality of the solved observations is poor. The stability of DCB and OSB at the satellite end varies among different types of satellites and over different time periods and is influenced by differences in observation time, geometry, and orbital repetition period and the quality of the solution data. We verified the linear correlation between DCB and the OSB of the CAS from the perspective of numerical analysis, and the difference between different OSB combination values and multichannel DCB was very small. OSB has more flexibility and scalability as a pseudo-range absolute bias parameter. DCB and OSB can reflect satellite hardware performance to some extent and can be used as an evaluation indicator.
For the positioning impact of the multichannel DCB of the BDS in SPP and PPP, correcting either DCB or TGD can improve the positioning accuracy of SPP and PPP. However, compared to the case of correcting TGD, the improvement in localization performance after DCB correction for dual-frequency SPP is more obvious than that of DCB correction for single-frequency SPP, and the effect of DCB correction for the dual-frequency case will be more obvious considering more frequency information. The contribution of pseudo-range bias correction to PPP is based on the contribution of pseudo-range to PPP. The PPP positioning accuracy of the dual-frequency ionosphere-free model with different combinations of observations differs due to the quality of the observed data, the signal combination factor, and the combination noise. It should be considered that different DCB combinations of pseudo-range bias correction in different signal combinations of PPP also have different degrees of positioning influence. Additionally, the inclusion of DCB affects the estimation of two types of parameters to be estimated (receiver clock and ionosphere-free combined ambiguity), which in turn affects the convergence time of PPP.
In this paper, only the time-varying characteristics of the OSB and DCB of the BDS provided by the CAS and the positioning effects of DCB on single- and dual-frequency SPP and dual-frequency PPP were analyzed. With the development of DCB and OSB products and the increasing abundance of multi-frequency and multi-constellation GNSS observation data, the application of DCB and OSB in positioning with different analysis centers from multiple systems is also worth exploring. The OSB products can be extended to correct the effect of phase hardware delays in the carrier phase, which is more flexible. Further analysis of pseudo-range and phase OSB products for multiple systems can be performed in the future for applications in PPP and PPP ambiguity resolution.
7. Conclusions
In this paper, we systematically introduced the BDS DCB and OSB products and derived correction formulas for the positioning of BDS DCB under broadcast ephemerides and precise ephemerides. Subsequently, we analyzed the stability and correlation of the short- and long-term DCB and OSB products provided by the CAS. Finally, the results of BDS positioning based on DCB and TGD were analyzed.
BDS DCBs and OSBs have long-term stability and high correlation between the two products. For the original data provided by DCB and OSB products, the stability of each signal pair of DCB from high to low is as follows: C2I–C7I (BDS-2), C1X–C5X, C1X–C6I, C1X–C7Z, C2I–C6I, C1X–C8X, C2I–C6I (BDS-2), C1P–C5P, and C1P–C6I. The STD of OSBs fluctuates between 1.14 ns and 3.84 ns. The best and worst stability was found for the C2I OSBs of the BDS-3 and the C6I OSBs of the BDS-2, respectively. The mean difference between the DCBs and combined OSBs for each channel fluctuates between −2.53 ps and 2.69 ps, and the STD fluctuates between 1.06 ps and 79.97 ps, which shows that the two parameters have high consistency. The changes in BDS-2 DCBs of the IGSO satellites were opposite to those of the MEO and GEO satellites in the fluctuating period. The DCBs of the BDS-3 for the IGSO satellites were more stable than those of the MEO satellites. Through monthly stability analysis of the DCBs and OSBs, it can be seen that IGSO satellites C07, C08, C09, C10, C13, and C16 of BDS-2 and satellites C32, C35, and C41 of BDS-3 fluctuated greatly in individual months.
For BDS SPP, TGD and DCB are both beneficial to the performance of BDS positioning. The impact of DCB correction on SPP is similar to that of TGD correction on single-frequency positioning and superior to that of TGD correction on dual-frequency positioning. The DCB correction of dual-frequency SPP is better than that of single-frequency SPP. In single-frequency SPP, compared with the positioning results with no correction, the positioning accuracies with TGD and DCB correction were improved by 41.94% and 44.09% in the horizontal direction and 41.93% and 44.07% in 3D, respectively. The improvements from DCB correction for B1I, B1C, and B2a became less obvious in turn. In dual-frequency SPP, 3D positioning accuracy with TGD and DCB correction was improved by 6.44% and 12.85%. The improvement effect with DCB correction in terms of positioning ordered from highest to lowest is as follows: B1I+B1C, B2a+B3I, B1I+B3I, B2a+B1C, B1I+B2a, and B3I+B1C.
The impact of DCB correction on PPP reaches the centimeter level, and DCB correction effectively improves positioning accuracy; however, correction does delay convergence time to a certain extent. Compared with the positioning results with no correction, horizontal and 3D positioning accuracy was improved on average by 13.53% and 13.84%, respectively. PPP with the combination of B1I+B3I had the largest improvement after DCB correction. The DCB correction effect is more obvious in PPP of B1I+B3I, B2a+B1C, and B3I+B1C signal combinations.
Author Contributions
Conceptualization, G.W. and Y.Z.; methodology, Y.Z. and Q.A.; software and analysis, H.W. and X.S.; writing, Y.Z. and G.W. All authors have read and agreed to the published version of the manuscript.
Funding
This work was sponsored by the National Science Foundation of China (Grant No. 42204036, No. 41971416 and No. 42074074).
Data Availability Statement
The CDDIS website (https://cddis.nasa.gov/archive/gnss (accessed on 7 June 2021)) was used to obtain the MGEX stations data. The TARC website (http://csno-tarc.cn/datacenter/ephemeris (accessed on 7 June 2021)) was used to obtain the different types of BDS broadcast ephemerides. The precise products obtained from the CNES (http://www.ppp-wizard.net/products/REALTIME/ (accessed on 7 June 2021)) include the satellite orbit and clock offset. The DCB and OSB products from the CAS were obtained from the following website: ftp://ftp.gipp.org.cn/product/dcb/mgex/2021/ (accessed on 1 July 2020).
Acknowledgments
The authors gratefully acknowledge the IGS MGEX for providing the GNSS data. We are also grateful for the BDS broadcast ephemerides provided by the Test and Assessment Research Center of the China Satellite Navigation System Administration Office. We also acknowledge the CAS for providing DCB and OSB products.
Conflicts of Interest
The authors declare no conflict of interest.
References
- Hakansson, M.; Jensen, A.B.O.; Horemuz, M.; Hedling, G. Review of code and phase biases in multi-GNSS positioning. GPS Solut. 2017, 21, 849–860. [Google Scholar] [CrossRef]
- Montenbruck, O.; Hauschild, A. Code Biases in Multi-GNSS Point Positioning. In Proceedings of the International Technical Meeting of the Institute-of-Navigation, San Diego, CA, USA, 27–29 January 2013; pp. 616–628. [Google Scholar]
- Zhang, L.; Xu, J.; Yu, H.; Tian, X.; Han, D. Unification of Multi-GNSS Bias Reference and Parameter Optimization of ISB/IFB Random Model. In China Satellite Navigation Conference (CSNC) 2020 Proceedings: Volume III, Proceedings of the CSNC 2020, Chengdu, China, 23–25 May 2020; Springer: Singapore, 2020; p. 1. [Google Scholar]
- Ciraolo, L.; Azpilicueta, F.; Brunini, C.; Meza, A.; Radicella, S.M. Calibration errors on experimental slant total electron content (TEC) determined with GPS. J. Geod. 2007, 81, 111–120. [Google Scholar] [CrossRef]
- Guo, F.; Zhang, X.H.; Wang, J.L. Timing group delay and differential code bias corrections for BeiDou positioning. J. Geod. 2015, 89, 427–445. [Google Scholar] [CrossRef]
- Zhao, Q.; Gao, C.; Pan, S.; Zhang, R. Accuracy analysis on BDS/GPS/Galileo multi-frequency SPP based on DCB correction. Dongnan Daxue Xuebao (Ziran Kexue Ban)/J. Southeast Univ. (Nat. Sci. Ed.) 2018, 48, 944–948. [Google Scholar] [CrossRef]
- Dai, P.P.; Xing, J.P.; Ge, Y.L.; Yang, X.H.; Qin, W.J.; Dong, Y.C.; Zhang, Z. The Effect of BDS-3 Time Group Delay and Differential Code Bias Corrections on Positioning. Appl. Sci. 2021, 11, 104. [Google Scholar] [CrossRef]
- Zeng, T.; Sui, L.; Bao, Y.; Xiao, G.; Dai, Q.; Yuan, T.; Zhang, Q. The Impact of Satellite Differential Code Bias on BDS Positioning and Correction Model Research. J. Geod. Geodyn. 2017, 37, 53–57. [Google Scholar]
- Gu, S.M.; Dang, Y.M.; Wang, H.; Wang, J.; Ren, Z.Z.; Zhang, J.X. The Effect of DCB Correction on Multi-system Combination Precise Point Positioning. In Proceedings of the 10th China Satellite Navigation Conference (CSNC), Beijing, China, 22–25 May 2019; pp. 305–313. [Google Scholar]
- Wang, L.; Han, J.Q.; Huang, G.W.; Zhang, Q.; Fan, L.H.; Tu, R. Characteristics and Precision Analysis of BeiDou2 Satellite Differential Code Bias Products. Navigation 2018, 65, 377–387. [Google Scholar] [CrossRef]
- Ge, Y.L.; Zhou, F.; Sun, B.Q.; Wang, S.L.; Shi, B. The Impact of Satellite Time Group Delay and Inter-Frequency Differential Code Bias Corrections on Multi-GNSS Combined Positioning. Sensors 2017, 17, 602. [Google Scholar] [CrossRef]
- Zhang, Y.Z.; Chen, J.P.; Gong, X.Q.; Chen, Q. The update of BDS-2 TGD and its impact on positioning. Adv. Space Res. 2020, 65, 2645–2661. [Google Scholar] [CrossRef]
- Liu, G.; Guo, F.; Wang, J.; Du, M.Y.; Qu, L.Z. Triple-Frequency GPS Un-Differenced and Uncombined PPP Ambiguity Resolution Using Observable-Specific Satellite Signal Biases. Remote Sens. 2020, 12, 2310. [Google Scholar] [CrossRef]
- Zhang, Z.; Lou, Y.D.; Zheng, F.; Gu, S.F. ON GLONASS pseudo-range inter-frequency bias solution with ionospheric delay modeling and the undifferenced uncombined PPP. J. Geod. 2021, 95, 32. [Google Scholar] [CrossRef]
- Villiger, A.; Schaer, S.; Dach, R.; Prange, L.; Susnik, A.; Jaggi, A. Determination of GNSS pseudo-absolute code biases and their long-term combination. J. Geod. 2019, 93, 1487–1500. [Google Scholar] [CrossRef]
- Nie, W. Multi-GNSS Global Ionosphere Monitoring and the Unified Handling of the Differential Code Bias. Ph.D. Thesis, Shandong University, Weihai, China, 2019. [Google Scholar]
- Gong, X.P.; Lou, Y.D.; Zheng, F.; Gu, S.F.; Shi, C.; Liu, J.N.; Jing, G.F. Evaluation and calibration of BeiDou receiver-related pseudorange biases. GPS Solut. 2018, 22, 98. [Google Scholar] [CrossRef]
- Montenbruck, O.; Steigenberger, P.; Hauschild, A. Multi-GNSS signal-in-space range error assessment—Methodology and results. Adv. Space Res. 2018, 61, 3020–3038. [Google Scholar] [CrossRef]
- Lu, M.; Li, W.; Yao, Z.; Cui, X. Overview of BDS III new signals. Navig.—J. Inst. Navig. 2019, 66, 19–35. [Google Scholar] [CrossRef]
- Li, Z.S.; Yuan, Y.B.; Li, H.; Ou, J.K.; Huo, X.L. Two-step method for the determination of the differential code biases of COMPASS satellites. J. Geod. 2012, 86, 1059–1076. [Google Scholar] [CrossRef]
- Montenbruck, O.; Hauschild, A.; Steigenberger, P. Differential Code Bias Estimation using Multi-GNSS Observations and Global Ionosphere Maps. In Proceedings of the International Technical Meeting of the Institute-of-Navigation, San Diego, CA, USA, 27–29 January 2014; pp. 802–812. [Google Scholar]
- Wang, N.B.; Yuan, Y.B.; Li, Z.S.; Montenbruck, O.; Tan, B.F. Determination of differential code biases with multi-GNSS observations. J. Geod. 2016, 90, 209–228. [Google Scholar] [CrossRef]
- Zi-shen, L.; Ningbo, W.; Yuan, Y. A Unified Definition and Processing Method of Observable-Specific Signal Biases for Multi-mode and Multi-frequency Global Navigation Satellite System. J. Position. Navig. Timing 2022, 7, 10–20. [Google Scholar]
- Wang, N.B.; Li, Z.S.; Duan, B.B.; Hugentobler, U.; Wang, L. GPS and GLONASS observable-specific code bias estimation: Comparison of solutions from the IGS and MGEX networks. J. Geodesy 2020, 94, 74. [Google Scholar] [CrossRef]
- China Satellite Navigation Office. BeiDou Navigation Satellite System Open Service Performance Standard (Version 2.0); China Satellite Navigation Office: Beijing, China, 2018. [Google Scholar]
- Zhang, Y.Z.; Wang, H.; Chen, J.P.; Wang, A.H.; Meng, L.D.; Wang, E.S. Calibration and Impact of BeiDou Satellite-Dependent Timing Group Delay Bias. Remote Sens. 2020, 12, 192. [Google Scholar] [CrossRef]
- Qin, W.J.; Ge, Y.L.; Zhang, Z.; Yang, H.Y.; Su, H.; Yang, X.H. Enhancing BDS-3 precise time transfer with DCB modelling. Measurement 2021, 174, 108641. [Google Scholar] [CrossRef]
- Wang, N.B.; Li, Z.S.; Montenbruck, O.; Tang, C.P. Quality assessment of GPS, Galileo and BeiDou-2/3 satellite broadcast group delays. Adv. Space Res. 2019, 64, 1764–1779. [Google Scholar] [CrossRef]
Disclaimer/Publisher’s Note: The statements, opinions and data contained in all publications are solely those of the individual author(s) and contributor(s) and not of MDPI and/or the editor(s). MDPI and/or the editor(s) disclaim responsibility for any injury to people or property resulting from any ideas, methods, instructions or products referred to in the content. |
© 2023 by the authors. Licensee MDPI, Basel, Switzerland. This article is an open access article distributed under the terms and conditions of the Creative Commons Attribution (CC BY) license (https://creativecommons.org/licenses/by/4.0/).