Abstract
This research examines the correlation between seismic activity and variations in ionospheric electron density (Ne) using the data from the Langmuir probe (LAP) onboard the China Seismo-Electromagnetic Satellite (CSES) during nighttime. Statistical analysis of Ms ≥ 6.8 earthquakes that occurred globally between August 2018 and March 2023 is conducted, as well as Ms ≥ 6.0 earthquakes in China during the same period, using the quartile analysis method for fixed revisiting orbits. The main conclusions are that: (1) the larger the magnitude of the earthquake, the more anomalous the phenomena that appear; (2) the anomalies on the east side of the epicenter are significantly higher than those on the west side, and the anomalies in the Northern Hemisphere are mostly distributed southward from the epicenter, while those in the Southern Hemisphere are mostly distributed northward from the epicenter; (3) anomalies appear with a higher frequency on several specific time intervals, including the day of the earthquake (likely co-seismic effect) and 2, 7, and 11 days before the earthquake (possible precursor candidates); and (4) for the 15 earthquakes of Ms ≥ 6.0 in China over the past five years, anomalous Ne mainly occurred southwest of the epicenter, with the highest frequency observed 5 days before the earthquake, and there were continuous anomalous phenomena between 9 days and 5 days before the earthquake. This study concludes that Ne, measured by CSES, can play a fundamental role in studying earthquake-related ionospheric disturbances.
1. Introduction
Earthquakes are sudden natural disasters that can cause extensive destruction and pose a significant threat to human life and property. Earthquake is one of the most serious natural disasters faced by humanity, causing more casualties than any other natural disaster. Globally, over 5 million earthquakes are estimated every year, including around 100 strong earthquakes of Ms ≥ 6.0, 18 large earthquakes of Ms ≥ 7.0, and one or two mega-earthquakes of Ms ≥ 8.0. These events may significantly affect people’s safety and the economic development of society, making it crucially important to conduct sufficient research on earthquakes and attempt to build proper systems for early warning and forecasting [1].
With the development of space exploration technology, the observation of ionospheric anomalies by satellite has become a research hotspot. A large number of observational studies have shown that there is indeed a correlation between earthquakes and ionospheric anomalies (e.g., [2]), and these ionospheric disturbances possibly related to “earthquake precursors” have obtained significant interest. Utilizing satellite earth observation, researchers can access all-weather, short-term, global coverage, and rich dynamic information that displays enormous potential for application in earthquake mechanism research, monitoring and forecasting, disaster prevention, and emergency relief efforts. It also provides favorable support for short-term forecasting of earthquakes and has emerged as an increasingly important support tool for earthquake monitoring and forecasting and scientific research. The study of seismic ionospheric effects has also become one of the most challenging topics in the fields of earthquake science and ionospheric science [3].
Previous research has demonstrated the ionosphere’s response to seismic activity. Specifically, ionospheric plasma parameter changes were reported as early as 1965, when ionospheric anomalies were observed before the 28 March 1964 Alaska earthquake, based on ionosonde data [4]. Subsequent studies using data from the French DEMETER satellite since its launch in 2004 have further expanded our understanding of this phenomenon, resulting in numerous reports of variations in ionospheric parameters preceding earthquakes. Scholars have studied seismic ionospheric anomalies using various methods. Zhang et al. [5] found that multiple parameters, including ion density, temperature, and electromagnetic field, exhibited synchronous perturbation anomalies before the M7.9 earthquake in Chile on 14 November 2007. Further analysis of the Ms7.1 Yushu earthquake on 14 April 2010 revealed that multiple parameters showed increased anomalous change one day before the earthquake [6]. By analyzing DEMETER data ten days before and one day after the M8.8 earthquake in Chile on 27 February 2010, Liu et al. [3] observed significant perturbations in various plasma parameters near the epicenter. Case studies indicate that strong anomalous perturbations typically occur in the ionosphere before and after moderate to strong earthquakes worldwide, and the larger the magnitude of the earthquake, the more obvious the anomaly [7].
In order to identify common features in earthquake ionospheric phenomena, statistical studies were conducted alongside seismic case studies. Several analyses investigated the correlation between ionospheric anomalies and seismic events, ultimately confirming a statistically significant relationship between them. Kon et al. [8] employed the superposed epoch method to scrutinize earthquakes in Japan from 1998 to 2010 with a focal depth less than 40 km and M ≥ 6.0. Significant positive TEC anomalies were found within a range of 1000 km from the epicenter 1–5 days prior to earthquakes. Liu et al. [9] examined plasma parameter disturbances from 82 earthquakes with Ms ≥ 7.0 occurring during 2005–2010, from 10 days before the earthquake until 2 days after it. They found that shallow earthquakes (depth < 70 km) exhibited more perturbations before their occurrence than deep earthquakes (depth ≥ 70 km).
Using ion density data detected by the DEMETER satellite from 2004 to 2010, Yan et al. [2] scrutinized global earthquakes with M ≥ 4.8 within the same timeframe using the superposed epoch method. They discovered that anomalies mainly occurred within a range of 200 km from the epicenter and 5 days before the earthquake. Additionally, He et al. [10] categorized seismic events based on different depth, magnitude, and location, ultimately discovering anomalies in ionospheric electron density on a spatial scale of around 350 km before earthquakes. De Santis et al. [11] and Marchetti et al. [12] investigated several years of Swarm magnetic and electron density data and correlated the extracted anomalies with shallow (depth ≤ 50 km) M ≥ 5.5 worldwide earthquakes by superposed epoch and space approaches. In addition, in the latter study, the eventual influence of focal mechanism and sea or land location was explored. Both papers identified that the anticipation time of the ionospheric anomalies increases with earthquake magnitude according and extending to in situ space data following the Rikitake [13] law. Similar preliminary results have been obtained for the China Seismo Electromagnetic Satellite (CSES-01), identifying that statistically, the number of anomalies preceding M5.5+ earthquakes is higher than those following the same events [14].
Previous research findings suggest that the ionosphere undergoes significant disturbances prior to earthquakes, as evidenced by both seismic case studies and statistical analyses. The ionospheric anomalies induced by the earthquake preparation process observed by satellite have garnered significant interest in the seismological community, and their monitoring and investigation are considered one of the effective approaches to studying earthquake ionospheric precursors [15].
The DEMETER satellite was the first in the world to be dedicated to detecting and researching ionospheric anomalies related to earthquakes. Following this achievement, China developed its own electromagnetic monitoring satellite, CSES-01, which was successfully launched on 2 February 2018, after ten years of scientific demonstration and five years of research and development. At present, CSES is the only satellite in flight explicitly built and dedicated to the investigation of ionospheric phenomena induced by earthquakes. A second CSES satellite is in its final building stage, and China plans to launch it within a year. This satellite monitors a wide range of parameters, including plasma properties, detection of high-energy particles, and electric and magnetic field measurements. It is the second satellite primarily dedicated to exploring earthquake-related ionospheric disturbance phenomena after DEMETER, thus enriching information in this field [16]. Real-time dynamic ionospheric monitoring and seismic precursor tracking may open new ways of earthquake monitoring and forecasting. Several studies on ionospheric anomalies have already been conducted based on data acquired from the CSES satellite, including electromagnetic fields [17] and plasma in situ [18]. Some multiparametric investigations of the preparation phase of the earthquakes integrated the CSES Ne and magnetic field data inside a variety of observations, showing the great potential of CSES to better understand the anomalous behavior of the ionosphere before large earthquakes, such as the Mw7.5 Indonesia 2018, Mw7.2 Kermadec Islands 2019, and Mw7.6 Papua New Guinea 2019 earthquakes [19,20,21]. However, studies related to seismic ionosphere characteristics using CSES data are still being accumulated and are not yet sufficient. Therefore, it is crucial to explore seismic ionospheric studies by utilizing a large amount of ionospheric observation data to investigate seismic ionospheric anomalous phenomena characteristics and their coupling and then explore the process and mechanism of seismic nucleation and development.
This paper analyzes global earthquakes of Ms ≥ 6.8 and earthquakes of Ms ≥ 6.0 in China using electron density (Ne) data from the Langmuir probe (LAP) onboard the CSES-01 (also known as Zhangheng-1 Electromagnetic Satellite) on a case-by-case basis, built on previous research experience. The earthquake cases are explored thoroughly, classified and summarized to investigate the underlying relationship between seismic events and ionospheric phenomena in terms of the seismic parameters.
2. Data and Processing Methods
2.1. Data Introduction
The China Seismic Electromagnetic Monitoring Experiment Satellite (CSES), also known as the Zhangheng-1 satellite, was launched on 2 February 2018. It is the first space-based platform for seismic observation and geophysical field measurements in China, orbiting at an altitude of 507 km with a fixed local time for ascending node at 2:00 and descending node at 14:00 respectively, and a revisiting period of five days [16]. The unique altitude and local time provide stable and long-term observations to explore the physical characteristics of the ionosphere, as well as the ionospheric phenomena and possibly understanding the mechanisms of earthquake-related signals. The satellite carries eight instruments onboard, including a search coil magnetometer (SCM), electric field detector (EFD), high-precision magnetometer (HPM), GNSS occultation receiver (GOR), plasma analyzer package (PAP), Langmuir probe (LAP), high-energy particle package/detector (HEPP/HEPD), and tri-band beacon (TBB), enabling continuous investigations of ionospheric plasma, electromagnetic fields and waves, and energetic particles [16].
This paper analyzes electron density (Ne) detected by the Langmuir probe (LAP) onboard the CSES, which is a key parameter that characterizes the ionospheric state. The LAP can measure Ne in the range of 5 × 10²–1 × 10⁷ e−/cm−3, with a relative measurement accuracy of 10%. The satellite’s operating modes include survey mode and burst mode. The survey mode is used to detect global electron density and electron temperature, with a time resolution of one observation data every 3 s, while the burst mode is used to detect possible earthquake-related signals above the global main seismic belts, with a time resolution of 1.5 s [22]. Typically, all payloads work continuously in the latitude range of [−65°, 65°] [16]. After in-orbit testing and a series of cross-validation studies [18,23], it can be confirmed that although the absolute value of Ne may differ, its relative variations are well in agreement with other ground and space missions (e.g., Swarm) and consequently can be used in ionospheric research, such as space weather, plasma bubbles, and earthquake ionospheric anomalies.
2.2. Selection of Earthquakes and Satellite Data
This paper focuses on 57 global shallow earthquakes (with a focal depth less than 100 km) with Ms ≥ 6.8 that occurred from August 2018 to March 2023, and 15 earthquakes with Ms ≥ 6.0 in China in the past five years. We retrieved the earthquake cases from website of the China Seismic Earthquake Network Center: http://www.ceic.ac.cn/speedsearch (accessed on 1 May 2023). The distribution of the epicenters is shown in Figure 1. The selection of earthquakes is based on several considerations, as follows. (1) Earthquakes with a focal depth of less than 100 km are selected because deep earthquakes are unlikely to produce ionospheric effects [9]. (2) The magnitude threshold is a compromise, as only larger earthquakes are more prone to show some pre-earthquake effects impacting the ionosphere [7], and on the other hand, they are rarer, so the limit needs to be lower to achieve a significant statistic. (3) Only earthquakes with epicenter latitudes within ±55° are selected, considering the observation latitude range of CSES LAP and the large amount of auroral activity from polar regions in high-latitude areas. (4) The number of selected earthquakes needs to be sufficient to ensure the research results are universal.
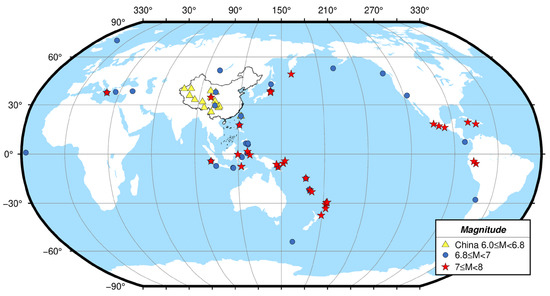
Figure 1.
Distribution of global Ms ≥ 6.8 and Ms ≥ 6.0 EQs in China.
To ensure the best accuracy in extracting possible earthquake-related information, we selected only nighttime (ascending orbit) data for analysis, as solar radiation in the ionosphere during the day may have a significant impact [24]. To eliminate data interference caused by changes in geomagnetic activity, data with |Dst| ≥ 40 nT or Kp ≥ 3 are excluded to remove geomagnetic environment disturbances, especially geomagnetic storms [9]. Additionally, intrinsic data problems are eliminated as much as possible, such as the data at the terminator transition point in Yan’s study [23].
Previous research has shown that ionospheric disturbances have been observed a few days prior to certain earthquake activities, particularly within a 25-day timeframe before the earthquake [10]. Additionally, abnormal disturbances have been recorded on the day of the earthquake and within 5 days after the earthquake [25]. Furthermore, ionospheric disturbances within a 1000 km radius from the epicenter have been identified as particularly significant [8]. Therefore, this study focuses on the period from 25 days before the earthquake to 5 days after the earthquake, searching for ionospheric disturbances within a range of 1000 km from the epicenter.
2.3. Data Processing Methods
As outlined in Section 2.2, data in nighttime orbits within a ±10° (i.e., 1000 km) range around the epicenter from 25 days before to 5 days after the earthquake were chosen. Figure 2 provides an example of orbit selection, displaying the distribution map of orbit position of the Ms7.0 earthquake in the southern waters of Sumatra, Indonesia (4.31°S, 101.15°E). The red dot indicate the epicenter’s location and the blue lines represent the ground projection of the chosen orbits for studying the earthquake.
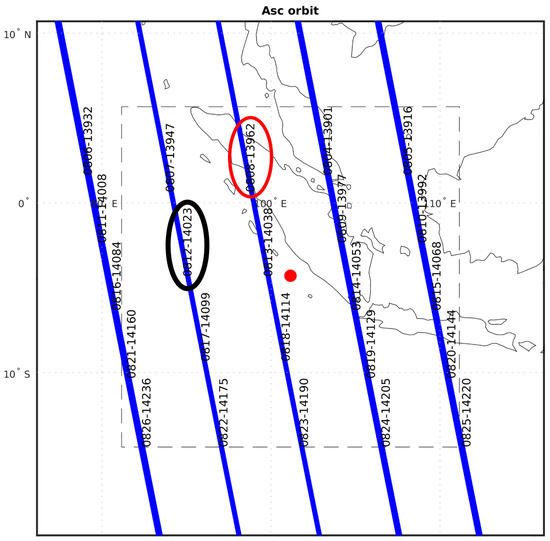
Figure 2.
Distribution of the orbits selected and epicenter of the Ms7.0 earthquake in the southern waters of Sumatra, Indonesia on 19 August 2020. Only nighttime (Ascending = Asc) orbits were selected. Red and black circles underline the position of two anomalies shown in the time series of Ne in the following picture.
In order to extract eventual anomalies, the quartile analysis method was implemented, which involves several steps.
Firstly, observations within a ±10° radius around the epicenter were obtained for the period ranging from 25 days before to 5 days after the earthquake.
Secondly, for each current orbit (C0) obtained in the first step, the corresponding orbits acquired during its revisiting orbits in the past 30 days were collected. Each current orbit (C0) corresponds to a set of 6 revisiting orbits.
The third step involves resampling each group of 6 revisited orbits with a time resolution of 0.3° (survey mode)/0.15° (burst mode) and calculating the median and upper and lower quartile difference (IQR) of the 6 revisited orbits in each sampling interval. The median is represented as Cb, while Cb ± 1.5 IQR is represented as the upper and lower bounds Cu and C1.
In the fourth step, the current observation data orbit (C0) is also resampled by 0.3° (survey mode)/0.15° (burst mode), and then compared with the upper and lower boundaries obtained from the 30-day background calculation for analysis. The variation in current observation data relative to the background one is then computed using the following formula:
where “Dev” is the abbreviation for deviation (difference) and the “%” sign indicates the percentage change. The “increase” and “decrease” in parentheses represent upward and downward trends, respectively. C0 represents the current observation data, Cu represents the upper limit value, and C1 represents the lower limit value. Based on previous research experience with a large number of earthquake cases, this study considers Ne abnormal changes with a magnitude of ≥50% as abnormal. A similar technique based on the interquartile range and revisiting orbits has already been applied to CSES Ne data before La Palma 2021 volcano eruption, obtaining interesting results in agreement with the other geophysical investigated observables [26].
3. Analysis of Typical Earthquake Cases
Based on carefully selected and processed data, we conducted a comprehensive analysis of anomalies before and after 57 worldwide earthquakes with Ms ≥ 6.8. This chapter provides a detailed account of the anomaly extraction results and the criteria used to determine anomalies for two typical earthquake cases, one with significant anomalies and one without.
3.1. An Example of an Earthquake with Clear Anomalies
According to the China Earthquake Network Center, an Ms7.0 earthquake occurred in the south of Sumatra, Indonesia (4.31°S, 101.15°E), with a depth of 10 km, on 19 August 2020. The epicenter, together with the orbit distribution map, is shown in Figure 2, while Figure 3 displays the changes in Ne around the epicenter on the southern side of Sumatra from 25 days before the earthquake to 5 days after the earthquake (from 25 July to 25 August). The panels from top to bottom show the geomagnetic indices (planetary Kp and equatorial disturbance storm index Dst), the Ne time-series variation, and the Ne abnormal disturbance amplitude. Based on our experience of abnormal observations from more than five years of CSES observations, further analysis is required when the Ne abnormal amplitude exceeds 50%, in order to exclude or support the possible seismic source for such abnormalities. Despite this, it is possible to note that there is a slight increase above the threshold of Ne on 2 August 2019, in correspondence to geomagnetic activity, as underlined by high values of kp and drop of Dst, which underline the impact of a moderate geomagnetic storm in the Earth’s environment. On the other hand, Figure 3 shows that on 8 August (11 days before the earthquake), the Ne abnormal amplitude was ≥100%, and it was a continuous abnormal disturbance change. On that day, Dst was <40 nT and Kp < 3, which can exclude the influence of space weather. Therefore, it is judged that the abnormal increase is still likely to be related to this earthquake. Similarly, on 12 August (7 days before the earthquake), Ne slightly increased (about 80%) again and in very quiet geomagnetic conditions, indicating that it may have some correlation with the earthquake.
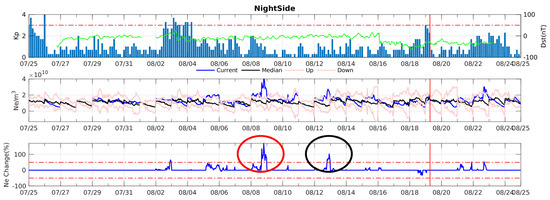
Figure 3.
The electron density disturbances over Sumatra EQ influential area occurred on the 19 August 2020. The space weather index Kp is represented by blue bars, and the Dst index is represented by the cyan curve. The red horizontal dashed line in the first panel represents the values of Kp = 3, while the red horizontal dashed lines in the third panel represent the upper and lower boundaries with 50%. The red vertical lines mark the time of the earthquake occurring.
Based on the positions of each orbit passing around the epicenter, as shown in Figure 2, the red and black circles represent the position of anomalous orbit data. The abnormal phenomenon on 8 August occurred in the closest orbit to the epicenter (orbit number 13962), with an abnormal orientation in the northwest direction of the epicenter, about 2° away from the epicenter (red ellipse in Figure 2); the abnormality on 12 August was located in the northwest direction of the epicenter, about 7° away from the epicenter (black ellipse in Figure 2). The highest longitudinal distance from the epicenter of the second anomaly may explain the lower intensity of the anomaly and further support its link to the seismic event, as it is expected that the anomalies are higher as the earthquake is closer and vanish after a certain distance.
3.2. An Example of an Earthquake without Anomalies
On 16 October 2018, an Ms6.9 earthquake occurred in the southeast of the Loyalty Islands (21.65°S, 169.61°E), with a depth of 10 km. Figure 4 shows the geomagnetic index trends and changes in Ne abnormal amplitude obtained within a range of 1000 km around the epicenter from 25 days before the earthquake to 5 days after the earthquake (from 21 September to 22 October). From Figure 4, it can be seen that the Ne amplitude changes were weak, i.e., always inside the negative and positive thresholds (dashed red lines), indicating no anomaly during the investigated period.
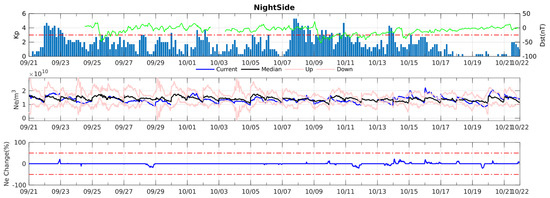
Figure 4.
Electron density disturbances over the Ms6.9 Loyalty Islands EQ on 16 October 2018.
4. Statistical Analysis of Global Earthquakes with Ms ≥ 6.8
Considering the analysis preprocessing and the discrimination criteria in the previous section, a statistical investigation on the selected 57 earthquakes is conducted in this chapter, searching for significance of the possible relationships between seismic events and ionospheric effects.
4.1. Statistics on the Number of Anomalies
The anomalies observed before and after each earthquake were derived from analyzing exactly the same period for each case study. To explore the possible correlation between earthquake magnitude and the number of anomalies, the earthquake cases were categorized into three groups based on the magnitude Ms (refer to Table 1). As shown in Table 1, there were 7 earthquakes with Ms ≥ 7.5, and anomalies were observed in 71.4% of this group, with most cases having only one anomaly. Among the 24 earthquakes with 7 ≤ Ms < 7.5, two of them had more than three anomalies, six had two anomalies, and nine had one anomaly (accounting for 37.5% of this group), while seven earthquakes had no anomalies, accounting for 29.2%. The proportion of earthquakes with at least one anomaly is 70.8% in this group. For the 26 earthquakes with 6.8 ≤ Ms < 7, two of them had more than three anomalies, two had two anomalies, ten had one anomaly (accounting for 38.5% of this group), and no anomalies were observed in 12 earthquakes (46.2% of this group). It was calculated that earthquakes with anomalies accounted for 53.8% of this group. Overall, the data suggest that the larger the magnitude, the higher the likelihood of observing anomalies, supporting at least some of the anomalies being likely induced by the earthquakes.

Table 1.
Number of earthquakes (EQs) with anomalies of different magnitudes.
In the following studies about the location and time of abnormal phenomena, the statistics are based on the number of abnormal phenomena rather than the number of earthquakes.
4.2. Typical Regional Distribution of Anomalies
To investigate the spatial distribution of abnormal phenomena in different directions, we searched for a predominant direction for such phenomena. In analogy with the analysis of the location of earthquake anomalies in Section 3, we gathered statistics of anomalies, dividing them in eight directions: north, northeast, east, southeast, south, southwest, west, and northwest. Figure 5 displays the distribution of abnormal phenomena relative to the epicenter. From Figure 5, it can be observed that the northeast and southeast directions from the epicenter have the highest relative number of anomalies, both accounting for 19%. Abnormal phenomena in the northwest and southwest directions with respect to the epicenter accounted for 17% each, while abnormal phenomena in the east direction accounted for 16%. Abnormal phenomena in the west direction accounted for 7%, while the least abnormal phenomena were found in the north and south directions, accounting for only 4% and 1%, respectively. When looking at this pie chart with left and right sides, respectively, representing the west and east sides of the epicenter, it can be seen that abnormal phenomena on the east side of the epicenter were significantly higher than those on the west side.
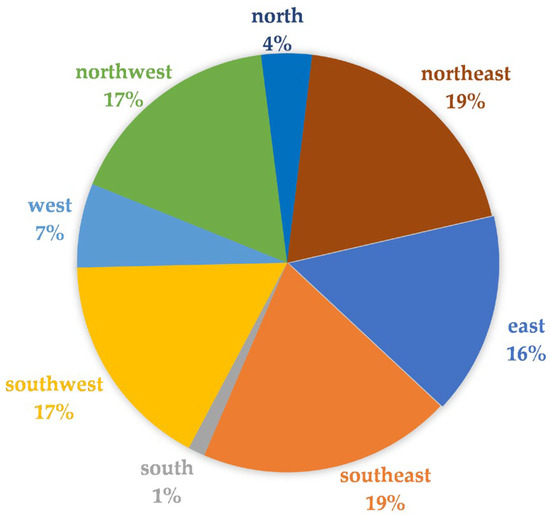
Figure 5.
Percentage of spatial distribution directions of earthquake ionospheric disturbances.
4.3. The Time when the Anomalies Mostly Occur
Anomalies observed on the day of the earthquake were labeled as “0 days,” while those observed before the earthquake are indicated with negative number (e.g., an anomaly one day before the event was labeled as “−1 day”) and those observed after the earthquake present positive numbers (e.g., an anomaly one day after the earthquake was labeled as “1 day”). A summary of results is presented in Figure 6. Among the 57 cases analyzed, anomalies were observed on every day except for −20, −18, −9, −8, and −5 days with respect to the earthquake. However, there were more anomalies observed on −11, −7, and −2 days with respect to the earthquake, as well as on the day of the earthquake. The concentration of anomalies was higher 11 days before the earthquake and near the day of the earthquake, with two smaller peaks. Finally, it seems that from about 2 weeks before the earthquake up to its occurrence, the number of recorded anomalies increased. This suggests that the incoming earthquakes induced some ionospheric disturbances, which in agreement with previous statistical preliminary investigations made on CSES Ne that reported more anomalies before the seismic events than after [27].
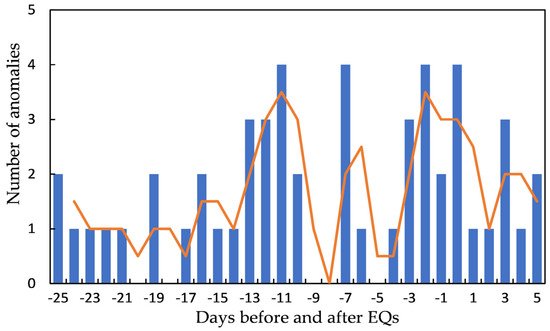
Figure 6.
Statistical analysis of the time of multiple occurrences of anomalies for global earthquake with Ms ≥ 6.8.
4.4. Possible Influence of Land or Marine Earthquake Location on Ionospheric Anomalies
The 57 selected earthquakes were categorized into two groups based on their epicenter location: land or marine earthquakes. Statistical analyses were conducted on both groups, and Table 2 displays the total number of earthquakes, the number of earthquakes with anomalies, and the ratio of earthquakes with anomalies to the total amount of earthquake for each type of location. The table shows that there were 18 land earthquakes and 39 ocean earthquakes, so most earthquakes occurred in the ocean. Despite the fact that the total number of land earthquakes was lower than that of ocean earthquakes, the probability of occurrences of anomalies before land earthquakes was higher than that one in ocean earthquakes. The role of the ocean in ionospheric seismo-induced electromagnetic disturbances is debated, as well as the LAIC modeling. In fact, even though some models would theoretically fail in the sea context, the empirical results (including those of this paper) show that marine earthquakes seem to be at least as productive as land ones in terms of generation of ionospheric electromagnetic anomalies [28]. In addition, Marchetti et al. [12] found that the frequency of magnetic signals before M5.5+ earthquakes seems higher for marine epicenters compared with those above sea level.

Table 2.
Statistical study on land and marine earthquakes.
After classifying earthquakes into land and marine categories, the number of examples for both categories decreased. Therefore, only four directions—northwest, southwest, southeast, and northeast—are used to analyze the direction in which anomalies tend to appear. Figure 7 compares the proportion of anomalies in four directions for land and ocean earthquakes. For land earthquakes, the proportion in the northwest direction was highest and the one in the southwest direction lowest. Conversely, the proportion for marine earthquakes was highest in the northeast direction and lowest in the southeast direction. The abnormal distribution of land earthquakes in the northwest direction was significantly higher than that of marine earthquakes, while it was significantly lower in the southwest direction than that of marine earthquakes.
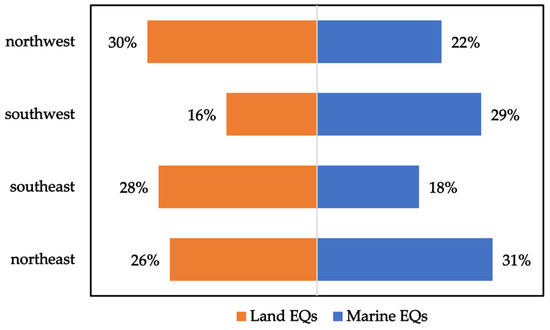
Figure 7.
Bar chart comparing the orientation of land and marine EQ anomalies.
In Figure 8, some variations can be observed, such as an increase in anomalies 13, 11 days before and 3 days after the earthquake for land events and 7 and 2 days before the earthquake for marine events, an extremely low number of anomalies and not statistically significant. Despite this, it is possible to note a trend of more anomalies from 12 days before the earthquake up to 1 day after the earthquake for marine events. This is the same result depicted in Figure 6, but here it is possible to note that it seems to be related to marine earthquakes.
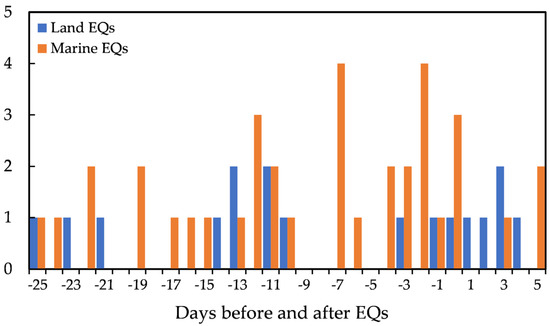
Figure 8.
Comparison of the time of occurrence of most land and marine EQ anomalies.
4.5. Characteristics of Earthquakes in the Northern and Southern Hemispheres
The ionospheric disturbances caused by earthquakes are shifted along the direction of magnetic field lines of force due to electromagnetism, i.e., basically Maxwell equations. The 57 earthquake cases are divided into Southern and Northern Hemisphere groups, and the locations of their anomalies appearing in the Northern and Southern Hemisphere earthquakes are analyzed separately, as well as the comparative analysis of their temporal distribution.
As the number of earthquake cases significantly decreases after the division of the Northern and Southern Hemispheres, the anomalous orientation is divided into only four orientations—northeast, southeast, southwest, and northwest—and the characteristics of the distribution of anomalous orientations in the Northern and Southern Hemispheres are analyzed separately. Figure 9 displays the pie charts of the percentage distribution of earthquake anomaly orientation in the Northern Hemisphere (a) and Southern Hemisphere (b), respectively, while Figure 10 shows the radar charts of the percentage distribution of earthquake anomaly orientation in the Northern and Southern Hemispheres. By classifying northwest and northeast as directions north of the epicenter and southwest and southeast as directions south of the epicenter, it is evident that the Northern Hemisphere anomalies are predominantly distributed in the direction south of the epicenter, while the southern hemisphere anomalies are mostly distributed in the direction north of the epicenter. This may indicate that the anomalies point toward the equator, in agreement with Parrot’s theory that the preparation phase of an earthquake not only increases the level of electron density but also shift (EIA crests) [28]. Although this study is based on nighttime data, and as such without the classic EIA, we still think that this result is related to the same phenomena. In particular, we can consider that previous investigations were based on the DEMETER satellite and this one on the new mission CSES, and the comparison is not only crucial but seems to support the reliability of the results from both missions. Further studies are necessary to strengthen these pieces of evidence and compare them with other satellite missions and ground data.
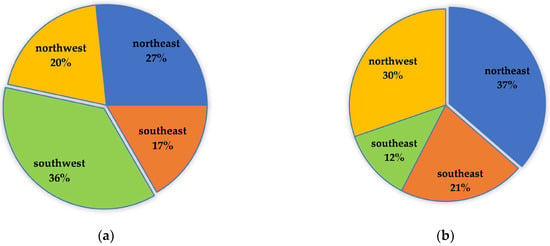
Figure 9.
(a) Percentage distribution of abnormal directions for EQs in the Northern Hemisphere; (b) Percentage distribution of abnormal directions for EQs in the Southern Hemisphere.
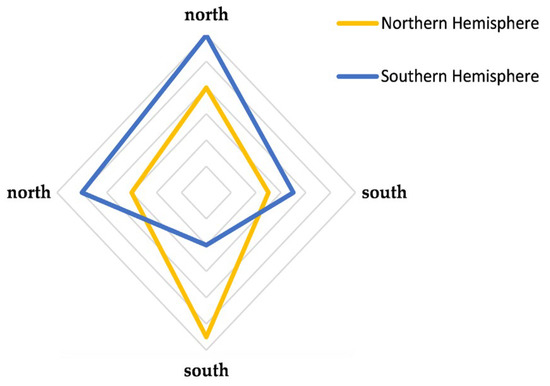
Figure 10.
Radar chart of percentage distribution of abnormal directions for EQs in the Northern and Southern Hemispheres.
Similar to the investigation presented in Figure 8 about land/marine time distribution, here we divided the anomalies in the Northern and Southern Hemispheres, as depicted in Figure 11. Although the number of anomalies is not so high, some observations can be made. In fact, some days present more anomalies in a particular group of earthquakes. For example, the number of anomalies occurring 12 days prior to and on the day of the earthquake was significantly higher in the Northern Hemisphere. In addition, the number of anomalies occurring 11 days prior to, 2 days prior to, and 3 days following the earthquake was found to be significantly lower in the Northern Hemisphere. On the other hand, the number of anomalies 11, 7 and 2 days before the earthquakes in the Southern Hemisphere is significantly higher. Finally, the number of anomalies occurring at 25, 19, and 10 days prior to the earthquake, as well as 3 days prior to and 5 days following the earthquake, were found to be comparable for both Northern and Southern Hemisphere earthquakes. The different time patterns in the two hemispheres are hard to explain, but they may be related to the different orientation of the magnetic field and/or the presence of the South Atlantic magnetic anomaly, which can induce a delay in the LAIC mechanism, and further theoretical studies are necessary to understand better such mechanisms.
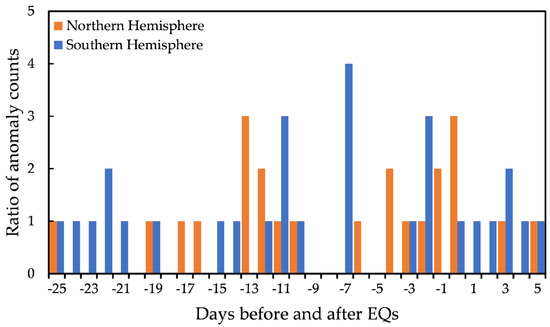
Figure 11.
Comparison of abnormal occurrence time for earthquakes in the Northern and Southern Hemispheres.
4.6. Analysis of Earthquakes of Ms ≥ 6.0 in China
Based on the analysis of earthquakes with Ms ≥ 6.8 worldwide, this paper also conducted statistical analysis on 15 earthquakes with Ms ≥ 6.0 in China during the same time range, using the method described in Section 2.3. In this paper, we only focus on the land earthquakes in China, and the ocean earthquakes and island earthquakes are not considered. For each earthquake event, the abnormal parameters, its occurrence time, amplitude, and direction were then statistically analyzed, in analogy with global investigations. The specific results are shown in Table 3. Among the 15 earthquakes with Ms ≥ 6.0, pre-earthquake anomalies were observed before 10 earthquakes, with a total of 19 abnormal phenomena, including 2 post-earthquake anomalies and 1 anomaly on the day of the earthquake (i.e., likely a co-seismic effect).

Table 3.
Results of the analysis of EQs with Ms ≥ 6.0 in China.
Upon analysis of the anomalous concentration area of 15 earthquake cases, as shown in Figure 12, this is mainly located in the southwest direction of the epicenter (accounting for 50%), while it appears less frequently in the southeast direction of the epicenter (only accounting for 13%). This result further confirms our previous global investigation, considering China is located in the Northern Hemisphere.
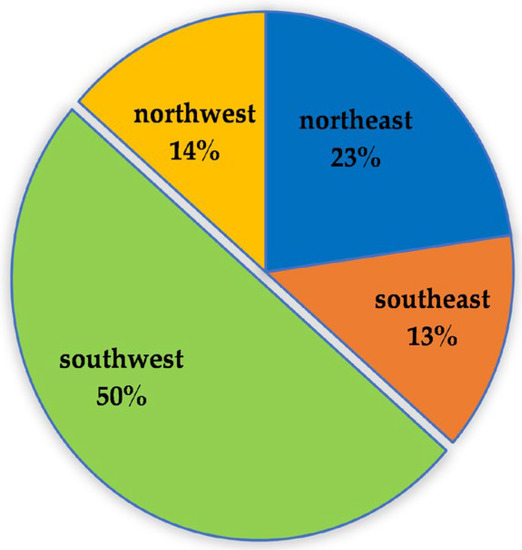
Figure 12.
Percentage distribution of spatial distribution directions of earthquake ionospheric disturbances.
The statistical analysis of the anomalous occurrence time is shown in Figure 13, using the marking method in Section 4.3. Anomalies appeared continuously for 5 days from 9 days to 5 days before the earthquake, with the highest frequency of anomalies occurring 5 days before the earthquake. This result further confirms the DEMETER statistical investigations carried out by Li and Parrot [29], with a very similar anticipation time. It is noteworthy that due to the revisiting time of the satellite, there cannot be high precision in the determination of the timing of anomalous, with an uncertainty of a few days at present. Future constellation of CSES satellites will help to reduce the revisiting time, and consequently, the uncertainty in the time of occurrence of the anomalies.
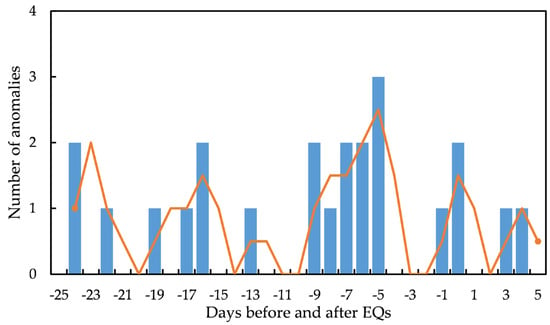
Figure 13.
Statistical analysis of the time of multiple occurrences of anomalies for earthquake with Ms ≥ 6.0 in China.
5. Discussions and Conclusions
In this paper, the Ne data from the LAP onboard CSES were used to analyze earthquakes with Ms ≥ 6.8 worldwide and Ms ≥ 6.0 in China. The analysis of single earthquake cases suggests the existence of earthquake ionospheric anomalies. On the other hand, through statistical analysis of earthquake cases, it was possible to prove statistically previous research, and they were generally consistent.
In terms of occurrence time of anomalies, Zhu et al. [30] used the stacking epoch method, and found that the abnormal changes in ionospheric Ne during nighttime mainly occurred within two time periods: 1–7 days and 13–15 days before the earthquake. He et al. [31] found that the statistical samples of anomalies from 10 days before the earthquake to around 3 days after the earthquake were relatively rich, and the range of abnormal occurrence time for earthquakes with a magnitude of 6+ was between 0 and 6.5 days before the earthquake. Li and Parrot [29] found that the number of disturbances on the day of the earthquake was higher and then steadily decreased in the days leading up to the earthquake. Li et al. [32] found that the abnormal ionospheric disturbances related to earthquakes were most significant one week before the earthquake, and the frequency of occurrence increased as the earthquake approached. These studies are generally consistent with the statistical results in Figure 6 in this paper.
Regarding research on anomalous occurrence direction, He et al. [31] conducted statistical analysis on multiple parameters of ionospheric disturbances, presenting the spatial distribution and frequency of anomalous occurrence in different directions. They discovered that over 50% of anomalies were located in the north and south directions of the epicenter, which could be attributed to the influence of the geomagnetic field, making it easier to detect abnormal changes on the south and north sides of the epicenter. However, this paper analyzed only one parameter—Ne, as depicted in Figure 5—and anomalies were more concentrated on the east side of the epicenter. This could be due to the limited number of parameters analyzed and the small number of earthquake cases. Further research is necessary to explore the characteristics of anomaly direction. He et al. [10] utilized data from the DEMETER satellite to demonstrate that Ne anomalies near the epicenter can be found in both the Northern and Southern Hemispheres. However, the location of anomalies shifts slightly northward in the Northern Hemisphere and slightly southward in the Southern Hemisphere. The results presented in Figure 9 and Figure 10 of this paper are consistent with these findings.
He et al. [10] found that Ne related to both land and ocean earthquakes showed anomalies close to the epicenter, but the anomalies of ocean earthquakes were more significant. Table 2 also shows that although the total number of land earthquakes is smaller than that of marine earthquakes, the probability of anomaly occurrence is higher than that of marine earthquakes. Due to the low total number of events, further data will be necessary to better investigate this, which seems to be different from previous investigations. Another possibility could be related to the sensibility of the observable, for example, for the Swarm mission, it was suggested that the magnetic field might be more sensible to pre-earthquake phenomena than Ne [12].
Despite numerous earthquake cases, scholars have proposed various earthquake–ionosphere coupling models, without a unified understanding of the coupling mechanism [33]. Therefore, to uncover the inherent laws of earthquakes and ionospheric phenomena, it is necessary to conduct a more comprehensive analysis of earthquake–ionospheric anomalies. This includes increasing the number of earthquake case studies and carrying out a series of multi-parameter earthquake case studies to accumulate more research experience. By doing so, we can try to explore the universal characteristics of earthquake–ionosphere coupling mechanisms with different seismic source mechanisms and reveal the underlying laws of earthquakes and ionospheric phenomena. Some investigations even suggest that more mechanisms are possible before the same earthquake, as proposed by Zhang et al. [34] investigating the Mw6.7 Lushan (China) 2013 earthquake.
Although short-term earthquake forecasting remains one of the most debated and challenging goals in earth science, it is indisputable that some moderate earthquakes are accompanied by ionospheric disturbances before and after the event [9,35]. Li et al. [35] analyzed CSES data recorded in China for the 21 May 2021 Maduo Ms7.4 earthquake and the 8 January 2022 Menyuan Ms6.9 earthquake, discovering effective ionospheric disturbances two weeks and one week before these two events, respectively. This confirms that ionospheric information can be utilized for short-term earthquake forecasting.
This paper analyzes Ne anomalies in 57 earthquakes with Ms ≥ 6.8 worldwide, as well as 15 earthquakes with Ms ≥ 6.0 in China. The study primarily yields the following conclusions.
- (1)
- In terms of the number of anomalies, the proportion of anomalies occurring before and after an earthquake tends to increase as the magnitude increases. Additionally, although the total number of land earthquakes is smaller than that of ocean earthquakes, the probability of anomalies seems higher for land earthquakes than for marine earthquakes.
- (2)
- In terms of areas of concentration of anomalies, it is generally observed that the east side of the epicenter exhibits significantly higher anomalies than the west side. The highest concentration of anomalies is found in the northwest direction of land earthquakes and in the northeast direction of marine earthquakes. Anomalies in the Northern Hemisphere are mostly distributed towards the south of the epicenter, while those in the Southern Hemisphere are mostly distributed towards the north of the epicenter.
- (3)
- In terms of the time of anomaly occurrence, it was observed that the frequency of anomalies was higher 7 days before, 11 days before, and in the vicinity of the day of the earthquake. This feature remains consistent across earthquakes classified as land and marine, as well as those in the Northern and Southern Hemispheres.
- (4)
- Regarding earthquakes with Ms ≥ 6.0 in China over the past five years, it was observed that Ne responds significantly to anomalies southwest of the epicenter in agreement with global analysis. Furthermore, the Ne anomaly exhibits the highest frequency of anomalies 5 days before the earthquake and occurs continuously from 9 days before to 5 days before the earthquake.
These research findings suggest that the Ne of CSES can play a fundamental role in studying ionospheric disturbances related to earthquakes. While most detected ionospheric disturbances seem to be related to earthquakes under this set of conditions, there could still be some anomalies that have not been detected or may be due to other unknown sources. In the future, more detailed research will be conducted to explore the response characteristics of ionospheric anomalies in different types of earthquakes in order to identify common features. This will involve searching for ionospheric disturbances in the complete satellite ionospheric data set, eliminating disturbances caused by known ionospheric phenomena such as solar activity, eliminating disturbances that are not in the earthquake zone, and checking whether each selected disturbance corresponds to future earthquakes. To better understand the nature of these short-term earthquake precursors, future research will be based on CSES’s long-term data and other multi-parameter observations from ground and space data.
Author Contributions
Conceptualization, R.Y.; Methodology, C.H.; Software, C.H. and W.P.; Validation, D.L.; Formal analysis, D.M. and Z.Z.; Investigation, Z.Z.; Resources, S.X. and N.Z.; Data curation, H.L. and N.Z.; Writing—original draft, C.H. and R.Y.; Writing—review & editing, R.Y. and D.M. All authors have read and agreed to the published version of the manuscript.
Funding
This work was supported by the Fundamental Research Funds for NINH (grant ZDJ2019-22), the APSCO Earthquake Project Phase II, the Dragon Five cooperation (grant 59236), the International Space Science Institute in Beijing (ISSI-BJ; grant 23-583), the Stable-Support Scientific Project of the CRIRP (grant A132001W07), and the National Natural Science Foundation of China (grant 41974084).
Data Availability Statement
CSES data are freely available upon registration and approval on the CSES web portal: www.leos.ac.cn (accessed on 9 June 2023).
Acknowledgments
The authors acknowledge the CSES mission (http://www.leos.ac.cn (accessed on 1 May 2023) for providing the electron density data, which is funded by the China National Space Administration (CNSA) and China Earthquake Administration (CEA). CSES data can be downloaded from http://www.leos.ac.cn. Thanks for the Kp index download from site https://wdc.kugi.kyotou.ac.jp/wdc/Sec3.html (accessed on 1 May 2023).
Conflicts of Interest
The authors declare no conflict of interest. The funders had no role in the design of the study, collection, analyses, or interpretation of data, writing of the manuscript, or decision to publish the results.
References
- Wu, Z.H.; Zhao, G.M. The earthquake prediction status and related problems: A review. Geol. Bull. China 2013, 32, 1493–1512. [Google Scholar]
- Yan, R.; Parrot, M.; Pinçon, J.-L. Statistical Study on Variations of the Ionospheric Ion Density Observed by DEMETER and Related to Seismic Activities: Ionospheric Density and Seismic Activity. J. Geophys. Res. Space Phys. 2017, 122, 12421–12429. [Google Scholar] [CrossRef]
- Liu, J.; Wan, W.X.; Huang, J.P.; Zhang, X.; Shu-Fan, Z.; Ouyang, X.-Y.; Zhima, Z. Electron density perturbation before Chile M8.8 earthquake. Chin. J. Geophys. 2011, 54, 2717–2725. (In Chinese) [Google Scholar] [CrossRef]
- Davies, K.; Baker, D.M. Ionospheric Effects Observed around the Time of the Alaskan Earthquake of March 28, 1964. J. Geophys. Res. 1965, 70, 2251–2253. [Google Scholar] [CrossRef]
- Zhang, X.M.; Qian, J.D.; Ouyang, X.Y.; Shen, X.; Cai, J.; Zhao, S. Ionospheric electromagnetic disturbances observed on DEMETER satellite before an earthquake of M7.9 in Chile. Prog. Geophys. 2009, 24, 1196–1203. (In Chinese) [Google Scholar] [CrossRef]
- Zhang, X.M.; Liu, J.; Zhao, B.Q.; Xu, T.; Shen, X.H.; Yao, L. Analysis on ionospheric perturbations before Yushuearthquake. Chin. J. Space Sci. 2014, 34, 822–829. [Google Scholar] [CrossRef]
- Le, H.; Liu, J.Y.; Liu, L. A Statistical Analysis of Ionospheric Anomalies before 736 M6.0+ Earthquakes during 2002–2010. J. Geophys. Res. 2011, 116, A02303. [Google Scholar] [CrossRef]
- Kon, S.; Nishihashi, M.; Hattori, K. Ionospheric Anomalies Possibly Associated with M ≥ 6.0 Earthquakes in the Japan Area during 1998–2010: Case Studies and Statistical Study. J. Asian Earth Sci. 2011, 41, 410–420. [Google Scholar] [CrossRef]
- Liu, J.; Huang, J.; Zhang, X. Ionospheric Perturbations in Plasma Parameters before Global Strong Earthquakes. Adv. Space Res. 2014, 53, 776–787. [Google Scholar] [CrossRef]
- He, Y.; Yang, D.; Qian, J.; Parrot, M. Response of the Ionospheric Electron Density to Different Types of Seismic Events. Nat. Hazards Earth Syst. Sci. 2011, 11, 2173–2180. [Google Scholar] [CrossRef]
- De Santis, A.; Marchetti, D.; Pavón-Carrasco, F.J.; Cianchini, G.; Perrone, L.; Abbattista, C.; Alfonsi, L.; Amoruso, L.; Campuzano, S.A.; Carbone, M.; et al. Precursory Worldwide Signatures of Earthquake Occurrences on Swarm Satellite Data. Sci. Rep. 2019, 9, 20287. [Google Scholar] [CrossRef]
- Marchetti, D.; De Santis, A.; Campuzano, S.A.; Zhu, K.; Soldani, M.; D’Arcangelo, S.; Orlando, M.; Wang, T.; Cianchini, G.; Di Mauro, D.; et al. Worldwide Statistical Correlation of Eight Years of Swarm Satellite Data with M5.5+ Earthquakes: New Hints about the Preseismic Phenomena from Space. Remote Sens. 2022, 14, 2649. [Google Scholar] [CrossRef]
- Rikitake, T. Earthquake Precursors in Japan: Precursor Time and Detectability. Tectonophysics 1987, 136, 265–282. [Google Scholar] [CrossRef]
- De Santis, A.; Marchetti, D.; Perrone, L.; Campuzano, S.A.; Cianchini, G. Statistical Correlation Analysis of Strong Earthquakes and Ionospheric Electron Density Anomalies as Observed by CSES-01. Il Nuovo Cim. C 2021, 44, 1–4. [Google Scholar] [CrossRef]
- Hayakawa, M.; Schekotov, A.; Potirakis, S.M.; Eftaxias, K.; Li, Q.; Asano, T. An Integrated Study of ULF Magnetic Field Variations in Association with the 2008 Sichuan Earthquake, on the Basis of Statistical and Critical Analyses. Open J. Earthq. Res. 2015, 4, 85–93. [Google Scholar] [CrossRef]
- Shen, X.H.; Zhang, X.; Yuan, S.; Wang, L.; Cao, J.; Huang, J.; Zhu, X.; Piergiorgio, P.; Dai, J. The State-of-the-Art of the China Seismo-Electromagnetic Satellite Mission. Sci. China Technol. Sci. 2018, 61, 634–642. [Google Scholar] [CrossRef]
- Zhima, Z.; Yan, R.; Lin, J.; Wang, Q.; Yang, Y.; Lv, F.; Huang, J.; Cui, J.; Liu, Q.; Zhao, S.; et al. The Possible Seismo-Ionospheric Perturbations Recorded by the China-Seismo-Electromagnetic Satellite. Remote Sens. 2022, 14, 905. [Google Scholar] [CrossRef]
- Yan, R.; Zhima, Z.; Xiong, C.; Shen, X.; Huang, J.; Guan, Y.; Zhu, X.; Liu, C. Comparison of Electron Density and Temperature From the CSES Satellite With Other Space-Borne and Ground-Based Observations. J. Geophys. Res. Space Phys. 2020, 125, e2019JA027747. [Google Scholar] [CrossRef]
- Marchetti, D.; De Santis, A.; Shen, X.; Campuzano, S.A.; Perrone, L.; Piscini, A.; Di Giovambattista, R.; Jin, S.; Ippolito, A.; Cianchini, G.; et al. Possible Lithosphere-Atmosphere-Ionosphere Coupling Effects Prior to the 2018 Mw = 7.5 Indonesia Earthquake from Seismic, Atmospheric and Ionospheric Data. J. Asian Earth Sci. 2020, 188, 104097. [Google Scholar] [CrossRef]
- De Santis, A.; Perrone, L.; Calcara, M.; Campuzano, S.A.; Cianchini, G.; D’Arcangelo, S.; Di Mauro, D.; Marchetti, D.; Nardi, A.; Orlando, M.; et al. A Comprehensive Multiparametric and Multilayer Approach to Study the Preparation Phase of Large Earthquakes from Ground to Space: The Case Study of the June 15 2019, M7.2 Kermadec Islands (New Zealand) Earthquake. Remote Sens. Environ. 2022, 283, 113325. [Google Scholar] [CrossRef]
- Akhoondzadeh, M.; De Santis, A.; Marchetti, D.; Shen, X. Swarm-TEC Satellite Measurements as a Potential Earthquake Precursor Together with Other Swarm and CSES Data: The Case of Mw7.6 2019 Papua New Guinea Seismic Event. Front. Earth Sci. 2022, 10, 820189. [Google Scholar] [CrossRef]
- Yan, R.; Guan, Y.; Shen, X.; Huang, J.; Zhang, X.; Liu, C.; Liu, D. The Langmuir Probe Onboard CSES: Data Inversion Analysis Method and First Results. Earth Planet. Phys. 2018, 2, 479–488. [Google Scholar] [CrossRef]
- Yan, R.; Xiong, C.; Zhima, Z.; Shen, X.; Liu, D.; Liu, C.; Guan, Y.; Zhu, K.; Zheng, L.; Lv, F. Correlation Between Ne and Te Around 14:00 LT in the Topside Ionosphere Observed by CSES, Swarm and CHAMP Satellites. Front. Earth Sci. 2022, 10, 14. [Google Scholar] [CrossRef]
- Cao, J.B.; Yang, J.Y.; Yuan, S.G.; Shen, X.; Liu, Y.; Yan, C.; Li, W.; Chen, T. In-flight observations of electromagnetic interferences emitted by satellite. Sci. China Ser. E Tech. Sci. 2009, 52, 2112–2118. [Google Scholar] [CrossRef]
- Sarkar, S.; Choudhary, S.; Sonakia, A.; Vishwakarma, A.; Gwal, A.K. Ionospheric Anomalies Associated with the Haiti Earthquake of 12 January 2010 Observed by DEMETER Satellite. Nat. Hazards Earth Syst. Sci. 2012, 12, 671–678. [Google Scholar] [CrossRef]
- Marchetti, D.; Zhu, K.; Zhang, H.; Zhima, Z.; Yan, R.; Shen, X.; Chen, W.; Cheng, Y.; He, X.; Wang, T.; et al. Clues of Lithosphere, Atmosphere and Ionosphere Variations Possibly Related to the Preparation of La Palma 19 September 2021 Volcano Eruption. Remote Sens. 2022, 14, 5001. [Google Scholar] [CrossRef]
- Marchetti, D.; Zhu, K.; Yan, R.; Zhima, Z.; Shen, X.; Chen, W.; Cheng, Y.; Fan, M.; Wang, T.; Wen, J.; et al. Ionospheric Effects of Natural Hazards in Geophysics: From Single Examples to Statistical Studies Applied to M5.5+ Earthquakes. Proceedings 2023, 87, 34. [Google Scholar] [CrossRef]
- Parrot, M.; Tramutoli, V.; Liu, T.J.Y.; Pulinets, S.; Ouzounov, D.; Genzano, N.; Lisi, M.; Hattori, K.; Namgaladze, A. Atmospheric and ionospheric coupling phenomena associated with large earthquakes. Eur. Phys. J. Spec. Top. 2021, 230, 197–225. [Google Scholar] [CrossRef]
- Li, M.; Parrot, M. Statistical analysis of an ionospheric parameter as a base for earthquake prediction. J. Geophys. Res. Space Phys. 2013, 118, 3731–3739. [Google Scholar] [CrossRef]
- Zhu, K.; Zheng, L.; Yan, R.; Shen, X.; Zeren, Z.; Xu, S.; Chu, W.; Liu, D.; Zhou, N.; Guo, F. The Variations of Electron Density and Temperature Related to Seismic Activities Observed by CSES. Nat. Hazards Res. 2021, 1, 88–94. [Google Scholar] [CrossRef]
- He, Y.F. Analysis and summary of results based on the study of seismic ionospheric phenomena. Earthq. Res. China 2020, 36, 244–257. [Google Scholar]
- Li, M.; Wang, F.Q.; Zhang, X.D.; Tan, H.-D.; Kang, C.-L.; Xie, T. Time spatial statistical characteristics of seismic influence on ionosphere. Progress. Geophys. 2014, 29, 0498–0504. (In Chinese) [Google Scholar] [CrossRef]
- Pulinets, S.; Ouzounov, D.; Karelin, A.; Davidenko, D. Lithosphere–Atmosphere–Ionosphere–Magnetosphere Coupling—A Concept for Pre-earthquake Signals Generation. In Pre-Earthquake Processes: A Multidisciplinary Approach to Earthquake Prediction Studies; John Wiley & Sons: Hoboken, NJ, USA, 2018; pp. 77–98. [Google Scholar]
- Zhang, Y.; Wang, T.; Chen, W.; Zhu, K.; Marchetti, D.; Cheng, Y.; Fan, M.; Wang, S.; Wen, J.; Zhang, D.; et al. Are There One or More Geophysical Coupling Mechanisms before Earthquakes? The Case Study of Lushan (China) 2013. Remote Sens. 2023, 15, 1521. [Google Scholar] [CrossRef]
- Li, M.; Wang, H.; Liu, J.; Shen, X. Two Large Earthquakes Registered by the CSES Satellite during Its Earthquake Prediction Practice in China. Atmosphere 2022, 13, 751. [Google Scholar] [CrossRef]
Disclaimer/Publisher’s Note: The statements, opinions and data contained in all publications are solely those of the individual author(s) and contributor(s) and not of MDPI and/or the editor(s). MDPI and/or the editor(s) disclaim responsibility for any injury to people or property resulting from any ideas, methods, instructions or products referred to in the content. |
© 2023 by the authors. Licensee MDPI, Basel, Switzerland. This article is an open access article distributed under the terms and conditions of the Creative Commons Attribution (CC BY) license (https://creativecommons.org/licenses/by/4.0/).