Abstract
Most dams in China have been operating for a long time and are products of the economic and technical limitations at the time of construction. Due to decades of aging engineering and ancillary problems, these reservoirs pose great threats to the safety of local people and the development of the surrounding economy. In this study, the surface deformation information for the Banqiao Reservoir is monitored with the small baseline subset–synthetic aperture radar interferometry (SBAS-InSAR) method using 80 Sentinel-1A images acquired from 3 January 2020 to 20 August 2022. Additionally, ground measurements from the BeiDou ground-based deformation monitoring stations were collected to validate the InSAR results. Based on the InSAR results, the spatiotemporal deformation features of the dam were analyzed in detail. The results show that the deformation in most areas, including the dam in the study area, is relatively stable, and the regional deformation velocity of the Banqiao Reservoir dam and other hydraulic engineering facilities varies between −1 mm/y and −4 mm/y. The Ru River area has a relatively obvious subsidence trend, and the maximum subsidence velocity reaches 30 mm/y. The InSAR monitoring results are consistent with the change trend in the BeiDou ground-based deformation measurement results. The monitoring results for the reservoir dam area provide a reference for local sustainable development and geological disaster prevention.
1. Introduction
Water reservoirs are important for ensuring safe flood control, consistent water supply, and food safety and for achieving sustainability, productivity, development, and growth [1]. With ongoing social development, the number of dams within China’s water conservancy projects has continued to accelerate. By the end of 2019, 98,112 dams of various types were built for a total storage capacity of 898.3 billion m3; among them, 4722 are part of large- and medium-sized reservoirs with a total storage capacity of 827.7 billion m3. At present, 96 dams equal to or exceeding 200 m in height have been built or are under construction throughout the world. Among these dams, 34 are in China, and of the 20 dams that exceed 250 m in height, 7 are in China [2]. The number of water conservancy projects in China is large and widely distributed, and most dams operate for a long time. However, the lifetime of a dam is limited by the economic and technical conditions at the time of building, as well as decades of aging engineering and other problems. After a dam and related buildings are completed, they will inevitably be deformed by various internal and external processes. Therefore, the consistent and safe monitoring and early warning systems used for old and new dams have become important issues for the safe, continued operation and implementation of water conservancy projects in China. Additionally, these measures ensure sustainable social and economic development [3].
At present, the safety monitoring of water conservancy facilities, such as dams, is usually carried out using surface measurements, such as leveling surveys and GPS surveys [4]. The advantage of using this type of method is that high-accuracy deformation data can be obtained at the equipment control point, but the disadvantage is that the monitoring points are all discrete data with low point density, and the overall deformation in the study area cannot be monitored. In recent years, synthetic aperture radar interferometry (InSAR) technology has been widely used in the field of surface deformation monitoring due to its high resolution, wide coverage, and centimeter-level deformation monitoring accuracy. It also provides decision support for safety monitoring and natural disaster information prediction [5,6,7,8]. However, the differential synthetic aperture radar interferometry (DInSAR) technique is vulnerable to spatial and temporal decoherence and atmospheric delays in practical applications, which reduces its measurement accuracy, and consequently, it has definite limitations. To overcome the limitations of DInSAR technology, a variety of time-series InSAR (TS-InSAR) technology analysis approaches have been produced, such as permanent scattering interferometry (PSI) [9] and the small baseline subset (SBAS) [10] technique. These methods select points with high coherence and consistency in SAR time-series images as control points and analyze the phase change in the high coherence points based on the respective phase models so that the atmospheric delayed phase can be effectively eliminated to acquire a higher quality of surface deformation variation.
Some scholars have used the time-series InSAR method to monitor the deformation in reservoir areas, dams, and other hydraulic engineering and have provided many successful case studies. Michoud et al. (2016) [11] used SBAS technology to monitor deformation in the Potrerillos Dam, and the results showed two slope deformation areas. Yang (2017) [12] obtained the surface deformation results for the Xiaowan Dam and Three Gorges Dam using the TS-InSAR technique, demonstrating the practicability of using the TS-InSAR technique for dam deformation monitoring. Aminjafari (2017) [13] used SBAS technology to monitor the deformation of the Masjed Soleyman Dam, and a comparison showed that the InSAR results were consistent with the geodetic results. Xiao et al. (2019) [14] used the improved TS-InSAR technology to monitor deformation of the Guangnan Reservoir Dam and verified the effectiveness of the InSAR time series for monitoring hydraulic structures, such as dams in the reservoir area. Xiong et al. (2019) [15] used multitemporal (MT) InSAR technology to monitor the Changlingpo Reservoir dam and compared it with artificial observation results to verify that the InSAR technology has high reliability for monitoring reservoir dam body deformation. Liu et al. (2021) [16] used distributed scatterer InSAR (DS-InSAR) to monitor the Xiaolangdi project, and the monitoring results showed that the maximum deformation velocity of the Xiaolangdi Dam was −10.09 mm/year, which was cross-verified with the SBAS results, and the monitoring results showed a high level of consistency. Vazquez-Ontiveros et al. (2023) [17] used PS-InSAR technology to monitor the crest structure of the Sanalona Dam and showed that InSAR could achieve accuracy similar to GPS. Xiao et al. (2022) [18] used TS-InSAR technology to investigate the failure of the Sardoba Dam in Uzbekistan and found that there was a 60 mm settlement difference before the dam failure. The results show that InSAR technology can detect the precursor of dam failure by identifying surface deformation, and the deformation signal can aid in warning of risk and avoiding dam damage.
The slope of the Banqiao Reservoir collapsed due to torrential rain in 1975, and dam restoration work was completed in 1991 [19]. Currently, relevant measurement instruments have been deployed at the Banqiao Reservoir dam; however, InSAR technology has not yet been used for wide-scale deformation monitoring in this region. Therefore, the objective of this paper is to explore the stabilities in the Banqiao Reservoir regions using the SBAS-InSAR method. Eighty ascending Sentinel-1A SAR images acquired from 2020 to 2022 were collected for deformation monitoring, and BeiDou ground-based deformation measurement data were used to validate the results. Optical images, reservoir water level information, and other data were combined to explore the spatial distribution characteristics of deformation, as well as the correlation between deformation trends and reservoir water storage. The monitoring results can be used as a scientific basis for the management and maintenance of reservoir dams, local construction planning, and geohazard prediction.
2. Method
In this paper, the surface deformation in the study area was acquired using the SBAS-InSAR technique. The SBAS-InSAR technique inverts the deformation information by setting a threshold for spatiotemporal baselines using numerous composed subsets of short spatiotemporal baselines. The baselines for SAR images within each set are small, the baselines for SAR images between each set are large, and the best quality image in each small set is chosen as the master image, and the others are slave images. The final deformation results are obtained after removing the flat phase and topographic phase, and after phase unwrapping, using singular value decomposition and least squares to estimate the deformation parameters, and then estimating the atmospheric phase based on the residuals. The technique is equivalent to multiple repeated orbital observations from the same scatterer at the surface, constituting redundant observations to improve the separation accuracy between the deformation phase and other phase components [20,21]. The problems driven by a low temporal sampling rate over a single small set are mitigated while weakening the effect of spatial decoherence [22].
SBAS technology follows the principle of interferometric pair combination. We assume that N + 1 SAR images were acquired over the same area and sorted by time series, T0, T1, T2, …, TN. One SAR image is chosen as the master image, and the others are co-registered into the master image. Afterward, according to the small set of threshold settings and the interferometric combination rules, M interferograms are generated, where M satisfies the following equation:
where the acquisition times for the master and slave images of any interferometric pair are set to TA and TB, respectively. The phase value at the high coherence point on the jth interferogram obtained after interfering and removing the flat influence of the interferometric pair can be expressed as follows:
where is the wavelength of the radar and dA and dB are the cumulative deformations in the direction of the radar line of sight (LOS) at time TA and time TB relative to the reference time T0, respectively. , , and represent phase errors caused by topography, atmospheric delay, and noise, respectively. To acquire deformation data, the above phase errors need to be removed, and only the deformation phases are retained. The topographic phase can be estimated by introducing digital elevation model (DEM) data and constructing a linear relationship between it and the baseline. The atmospheric delay can be removed from the deformation phase and the noise phase using the time–frequency characteristics of the atmosphere in the spatiotemporal domain, and finally, the noise phase is removed with filtering. After removing these errors, Equation (2) can be simplified as follows:
Assuming that and correspond to the acquisition time series of the slave and master images in the image pair generating the interferogram, respectively, the phases of all differential interferograms can form the following equation:
The linear model (4) is expressed in matrix format as follows:
In the formula, A is a matrix of order M × N, with M rows representing interferograms and N columns representing images in the time series.
When the number of small baseline sets is 1, then , and the parameters can be solved using the least squares method:
When , i.e., when there is more than one short baseline set, matrix A shows a rank loss when the equation has infinitely many solutions, and coefficient matrix A is singularly decomposed using singular value decomposition (SVD) to find the solutions for the parameters in the least norm sense:
where U and V are the orthogonal matrices of M × M and N × M, respectively, and S is the diagonal matrix of M × M.
Translating the phase calculation into a phase change velocity calculation, the equation can be presented as follows:
The average deformation velocity over N time epochs can be obtained using calculation, and the rates can be integrated to provide time-series deformation data for the surface in the study area.
The work processing flow presented in this paper is shown in Figure 1, which is divided into three main steps. First, this study obtained time-series SAR data for the study area and completed image tailoring and registration, as well as other preprocessing. Second, SBAS technology was used to invert the surface deformation time series. The basic steps included (a) setting the spatiotemporal baseline threshold to generate interferometric pairs; (b) applying interferometric processing to generate interferogram and unwrapping results; (c) screening the interferometric results; (d) refining and flattening the orbit; (e) estimating the deformation velocity and residual topography; (f) calculating the displacement within the time series and estimating and eliminating the atmospheric phase; and (g) geocoding. After processing, the average deformation velocity results and cumulative deformation results were obtained. Finally, this work studied the temporal deformation characteristics of different areas in the dam and analyzed the factors affecting the deformation combined with optical images and water level information.
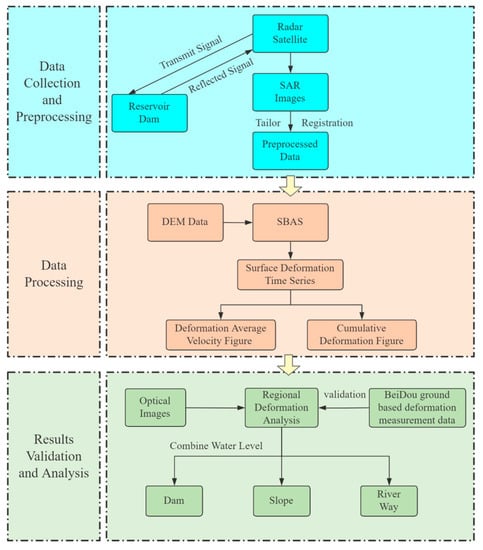
Figure 1.
Flowchart showing SBAS-InSAR for reservoir dam monitoring.
3. Study Area and Datasets
3.1. Study Area
The study area in this paper is the Banqiao Reservoir in Henan Province, located at the headwaters of the Ru River, which is a tributary of the Huai River. It is a large-scale water conservancy project with comprehensive benefits, such as support for urban water supplies, irrigation, aquaculture, hydroelectric power generation, and tourism. The slope of the Banqiao Reservoir collapsed due to torrential rain in 1975, and dam restoration work was completed in 1991. The Banqiao Reservoir is in the transition area between the subtropical zone and the warm temperate zone. The reservoir belongs to the mountainous climate of Huaibei. The mean annual rainfall is 1000 mm, 65% of which is centered around June to September, which is the rainy flood season. The frequency of rainfall is higher in the summer, and the amount of precipitation is greater. It is one of the major areas of heavy rainfall in the headwaters of the Huai River [23]. The maximum storage capacity of the reservoir is 244 million cubic meters, and the highest water level is 110.88 m. The dam has a clay core wall with a maximum dam height of 24.5 m, a crest elevation of 113.34 m, and a total length of 1700 m. The spillway is on the right side of the dam, with a width of 80 m and a weir crest elevation of 110.34 m, and the maximum discharge volume is 59 cubic meters per second (Figure 2).
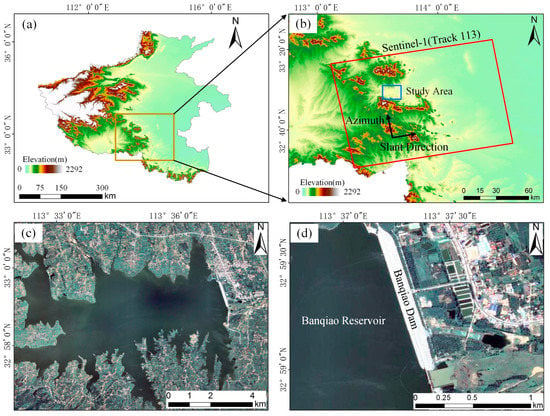
Figure 2.
Optical images, maps, and geolocation of the study area. (a) Geographical location of the study area, (b) elevation map of the study area, (c) Banqiao Reservoir, and (d) reservoir dam.
3.2. Datasets
The dataset used in this work consists of 80 ascending orbit Sentinel-1A remote sensing images that cover the study area, and the image acquisition time is from 3 January 2020 to 20 August 2022. The data type is slant-range single look complex (SLC) data in interference wide (IW) swath mode. Satellite data were obtained using C-band SAR with an electromagnetic wavelength of 5.6 cm, an azimuthal resolution of 20 m, and a distance resolution of 5 m.
The time baseline and spatial baseline thresholds were set to control the number of generated interferometric pairs, and after adjustment, a time baseline of 50 days was ultimately selected. The spatial baseline was set to 50% of the maximum baseline distance, which generated a total of 272 interferometric pairs for surface deformation parameter estimation. The time distribution of the data and the connection of the interferogram are shown in Figure 3. The data acquisition dates are shown in Table A1 in the Appendix A.
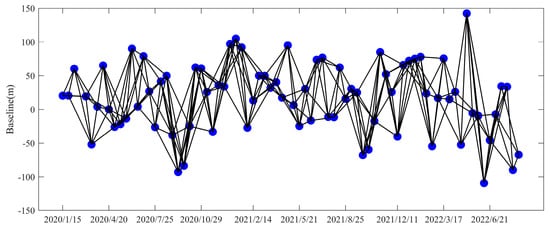
Figure 3.
Spatiotemporal baseline for the SBAS-InSAR inversion.
4. Results and Analysis
4.1. Experimental Results and Validation
4.1.1. InSAR Results
Figure 4 shows the overall deformation monitoring results for the Banqiao Reservoir obtained in this study. For better visualization, the corresponding optical image was set as the base image. The study period from 2020 to 2022 showed an overall stabilized state. The majority of the area was monitored for only slight deformation, with deformation velocities varying from −5 to 5 mm/y. However, for some areas, there was also a comparatively rapid velocity of deformation, and there was a certain degree of deformation. The areas with high deformation velocity were mainly concentrated in the Ru River area (Area A) and some cultivated land around the village (Area B), with a maximum deformation velocity of −30 mm/y.
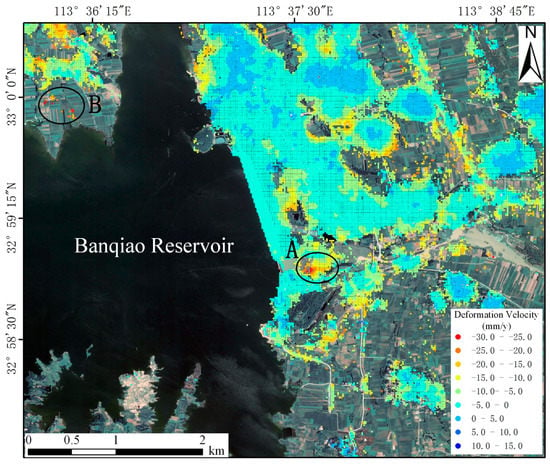
Figure 4.
The average deformation velocity of the Banqiao Reservoir and surrounding areas. Area A is the Ru River area, and area B is cultivated land.
To better explore and analyze the time-series deformation characteristics of the area, this work considered the cumulative surface deformation results for a total of 14 periods over 3 years in the study area, as shown in Figure 5. Throughout the observation period, the surface deformation of the hydraulic facilities and the surrounding area of the Banqiao Reservoir were generally stable, with a small range of fluctuations in time-series deformation variables. However, there was significant localized subsidence in the study area, mainly on the southern banks of the Ru River and on the cultivated or bare ground around residential areas in Banqiao town, with a maximum of 8 cm. In addition, the deformation of artificially constructed areas, such as houses and roads, was small and relatively stable.
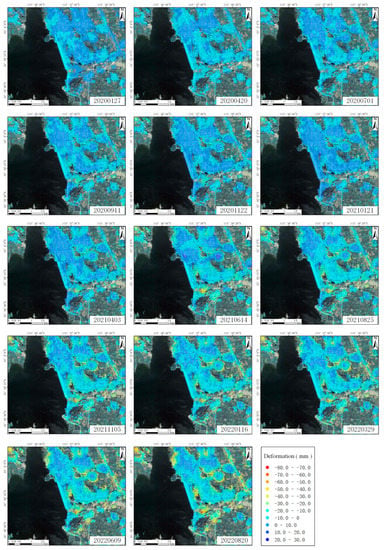
Figure 5.
Cumulative deformation of the Banqiao Reservoir area from 2020 to 2022.
4.1.2. Validation
To verify the accuracy of the InSAR monitoring results, the data from four BeiDou ground-based deformation measurement stations (BQ) at different positions in the Banqiao Dam were obtained to monitor the dam deformation. The distribution of the BeiDou ground-based deformation measurement stations is shown in Figure 6a. The deformation measurement data that overlapped with the Sentinel-1 data acquisition dates from July to August 2022 were selected for verification. The first phase was on 3 July 2022, recording the cumulative surface deformation at the monitoring points over a total of five phases. The data are shown in Table 1. Among them, the BQ02 monitoring point data were missing for 3 July 2022; thus, the data from 15 July 2022 were used to indicate the first phase.
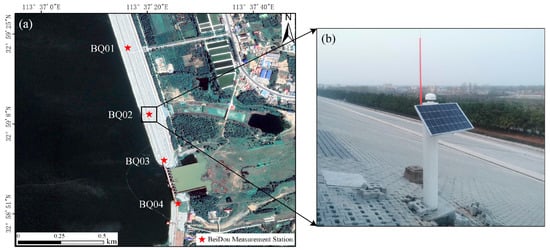
Figure 6.
Distribution locations and the real scene at the BeiDou ground-based deformation measurement stations. (a) Location of the BeiDou measurement stations. (b) Image showing the BeiDou measurement station equipment.

Table 1.
BeiDou ground-based deformation measurement monitoring data.
The InSAR monitoring points were selected and compared with the BeiDou ground-based deformation measurement data by applying the nearest-neighbor method. A comparison between the InSAR monitoring results and the ground deformation measurement data (Figure 7) showed that in the overlapping time range, there was good consistency between the trends and totals observed using both InSAR and the BeiDou ground-based monitoring stations. The root mean square error (RMSE) was used to measure the deviation between the InSAR monitoring values and the BeiDou ground-based deformation measurement values. The average RMSE of the four points BQ01, BQ02, BQ03, and BQ04 was 1.1 mm, which demonstrated that the InSAR monitoring results were reliable and useful for monitoring dam deformation.
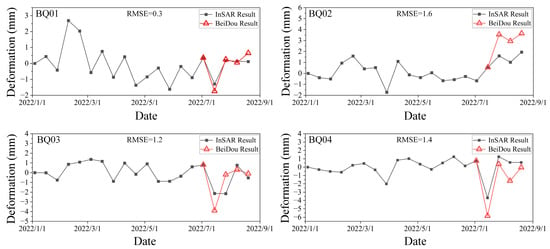
Figure 7.
Comparison of BeiDou ground-based deformation measurements and InSAR monitoring results.
The InSAR monitoring results were consistent with the change trend in the BeiDou ground-based deformation measurement data, but there was still a certain discrepancy between the two. This deviation may be caused by two aspects: (1). The latitude and longitude positions of the selected InSAR monitoring points and the BeiDou ground-based deformation measurement points do not completely align, and the different spatial positions lead to different deformation amounts and trends. (2). SBAS processing contains errors, such as atmospheric delay and phase noise, which cause deviations between the results and the true value.
4.2. Deformation Analysis
To analyze the surface change characteristics of the dam specifically, this paper analyzed different areas of the dam in blocks. The reservoir dam was divided into three regions: dam body, slope, and river channel. The subsidence in each region was judged according to the time series change in subsidence characteristic points, and the causes of subsidence were analyzed with optical images.
4.2.1. Dam Body Deformation Analysis
Figure 8a shows the results for the subsidence velocity of the dam. In this study, two subsidence characteristic points, P1 and P2, were selected on the north bank of the dam area to study the subsidence in this area. The time series cumulative deformation fluctuation figure for both points (Figure 8b) shows that the deformation fluctuation in the dam is quite slight, the cumulative deformation is in the range of 4 to −8 mm, and the dam is comparatively stable. A short period of slow subsidence was produced in both August 2020 and August 2021. Beyond this period, slow uplift occurred, fluctuating within a certain range and showing cyclical variations. The reasons for the fluctuations were analyzed because of the high summer precipitation in the study area, resulting in a consequent increase in the amount of water stored in the reservoir, and the deformation may have some association with factors, such as changes in the amount of water in the reservoir. The rising water level in the reservoir increases the water pressure in the water table below the dam, causing the water table to rise. The rock and soil beneath a dam are subject to pressure from the water table, known as pore water pressure. As the water level rises, it changes the water pressure in the rock and soil underneath, causing the surface to lift slightly [24]. Therefore, this work considered the total water level data from this reservoir for further analysis.
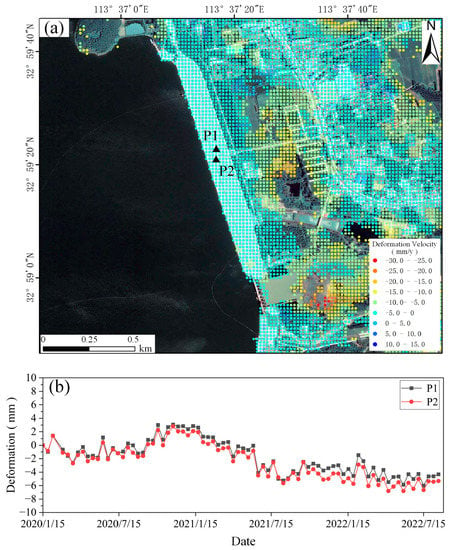
Figure 8.
Dam body monitoring results. (a) The deformation velocity of the dam body. (b) The time-series deformation of the dam body.
The dam subsidence characteristic points were combined with the Banqiao Reservoir water level information from January 2020 to December 2021 to obtain the time-series deformation figure shown in Figure 9. The figure shows that between January 2020 and July 2020, there was a slight linear decrease in the reservoir level, during which time the dam deformation was comparatively stable with no significant fluctuations. In July 2020, a significant increase in the reservoir level occurred, followed by a surface rise at the dam, with a deformation variation of approximately 8 mm. Between October 2020 and March 2021, the water level in the reservoir remained nearly unchanged, while at the same time, the deformation of the dam also stayed quite stable with almost no fluctuations. In April 2021, a short, slow increase in the reservoir level occurred; from May 2021 onward, the level started to decrease until it dropped to the bottom of the same year in July 2021. Over the same period, a slight uplift in the ground surface at the dam occurred, followed by a decline, producing a change of approximately 6 mm. Between July and September 2021, the reservoir level began to increase. An uplift in the surface of the dam occurred during the same period. Since October 2021, the water level has remained more or less constant, and the surface deformation of the dam has fluctuated slightly.
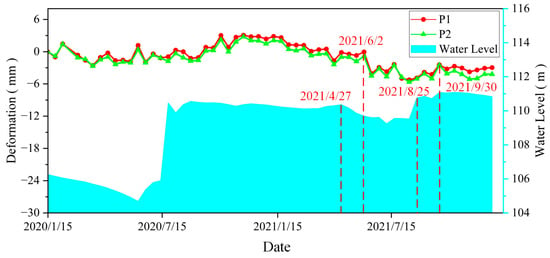
Figure 9.
Time series showing the deformation in the dam study points combined with water level information.
Based on Figure 9 and the previous description, it is possible to conclude that the deformation tendency at the study point on the dam body shows a clear correlation with the water level variation in the reservoir. When the reservoir level decreases, the surface of the dam declines; when the reservoir level increases, the surface of the dam rises. From a temporal point of view, the deformation reaction in the dam is slightly later than the variation in the reservoir level. The variation in dam deformation occurs approximately 35 days after the variation in water level. The reason for the time delay between the water level changes in the reservoir and the surface deformation can be analyzed as follows. When the water level in the reservoir changes, it affects the groundwater level at the dam site, which in turn affects the saturation in the rock and soil layers. However, the saturation process in the rock and soil layers takes time because it is influenced by the soil permeability and drainage path. This time delay can lead to a lag in the surface deformation response. Therefore, when the water level in the reservoir rises, the rock and soil layers gradually become saturated over time, and the associated surface deformation signal usually exhibits a certain lag effect. The same lag effect also exists when the water level drops.
To analyze the deformation of the dam, a longitudinal profile was taken of the dam region, labeled in Figure 10a using a single red line, and the two ends of the line were labeled A1 and A2. Information on the deformation data for the dam on this profile line was collected, and the deformation velocity law at the surface was analyzed. Figure 10b shows the deformation velocities covering this line, from which it is observed that the deformation velocities at the surface of the dam body were minor, with the data points all having deformation velocities in the range of −1 mm/y to −4 mm/y.
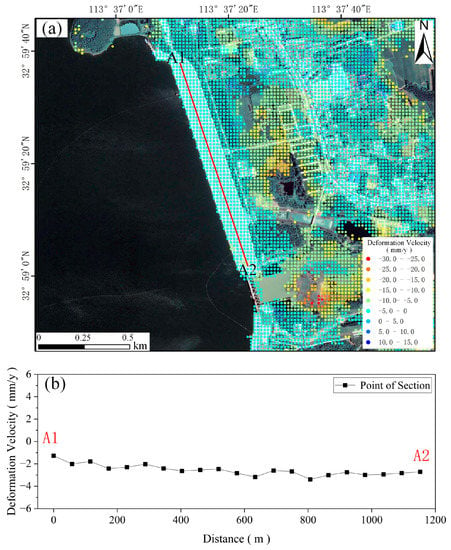
Figure 10.
Dam body longitudinal profile monitoring results. (a) Profile line of the dam body. (b) Deformation profile.
To explore the deformation characteristics of the dam in depth, as shown in Figure 11a, three regions in the southern, middle, and northern areas of the dam were selected from the dam body coherence points, and the cumulative deformation at each point was extracted for analysis. Figure 11b shows that slight subsidence occurred in the area south of the dam body. Some points in the middle and northern areas of the dam body subsided, and some points were uplifted. In addition, the number of subsidence and uplift points in the middle and northern areas were slightly different. Among them, the number of subsidence and uplift points in the middle was nearly the same, and the number of subsidence points in the north was greater than the number of uplift points, but the overall deformation was minor. The cumulative deformation of the dam ranged from −6 mm to 3 mm.
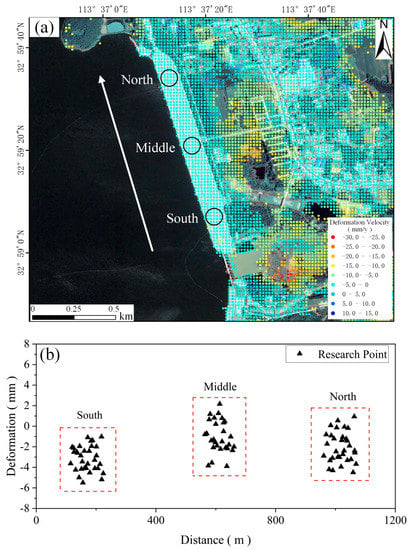
Figure 11.
Dam deformation distribution monitoring results. (a) Selection of the dam deformation characteristic area. (b) Dam deformation distribution (from January 2020 to August 2022).
The deformation velocity analysis of the dam body section and the deformation distribution in different regions of the dam body shows that there are certain differences in the deformation velocity and amount of deformation in various dam areas, although the overall variation is small, which indicates that the dam body deformation has good consistency.
The slope of the Banqiao Reservoir collapsed due to torrential rain in 1975. During the redevelopment process, the dam bodies on the north and south banks were earth dams, while the overflow dam was concrete. To explore whether the different structural materials at different positions of the dam body caused discrepancies in the degree of deformation in various dam areas, this study selected survey points at the earth dam on the south bank, the concrete overflow dam, and the earth dam on the north bank and marked them with five-point red stars (Figure 12a). The deformation time series for each area was extracted for analysis.
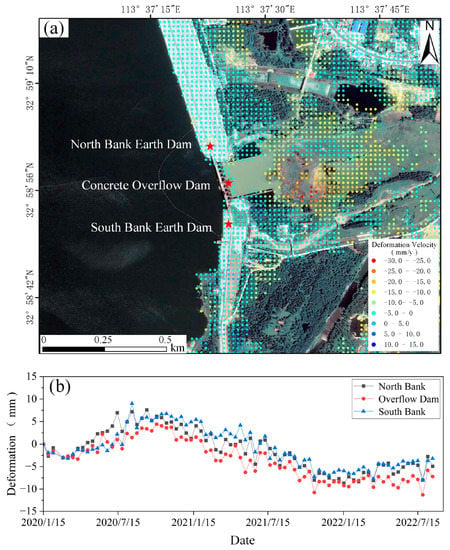
Figure 12.
Monitoring results in different areas of the dam body. (a) Selection of points in different areas of the dam body. (b) Selection of points in different areas of the dam body.
Two study points were chosen in each region, and the mean value of their deformation time series was calculated to represent the temporal variability in the area, as shown in Figure 12b. The figure shows that the deformation trends in different locations were roughly the same, but the deformation amount in the spill dam area was slightly smaller than that in the dam on the north and south banks within the study time range. The possible causes of this slight difference are associated with the varied materials comprising the dam.
4.2.2. Slope Deformation Analysis
As illustrated in Figure 13a, to reflect the surface deformation law at the south bank slope area of the dam, two deformation feature points, P3 and P4, were chosen in the region for this study. From the cumulative deformation results for the time series of subsidence feature points in Figure 13b, it is evident that from January 2020 to January 2021, subsidence and uplift occurred successively in this area, and the amount of deformation was nearly the same. From February 2021 to September 2021, linear subsidence occurred in this area, and the subsidence amount was approximately 20 mm. After a brief uplift in October 2021, the deformation of this area stabilized. After May 2022, the area showed a subsidence trend of approximately 10 mm. On the basis of the available local information, the region was constructed as a fill, and the soil beneath the slopes of the reservoir was comparatively moist and loose. The cause of the greater surface deformation of this area is probably associated with outside influences, such as rainwater scouring in precipitation and hydraulic erosion caused by the reservoir.
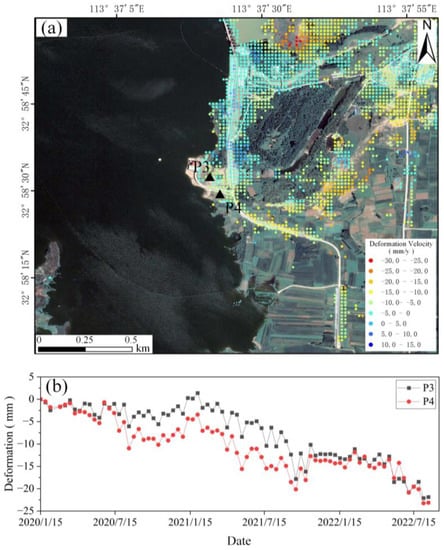
Figure 13.
South bank slope monitoring results. (a) Slope deformation velocity. (b) Time series of slope deformation.
4.2.3. River Channel Deformation Analysis
Figure 14a shows the subsidence velocity, where the deformation velocity of the Ru River channel area was relatively large within the whole Banqiao Reservoir region. In this study, two subsidence characteristic points, P5 and P6, were selected in the region with greater deformation velocity on both sides of the Ru River, indicating the deformation of the region. The time-series deformation (Figure 14b) shows that from January 2020 to August 2022, the area had an average subsidence velocity and a deformation of approximately 70 mm over two years.
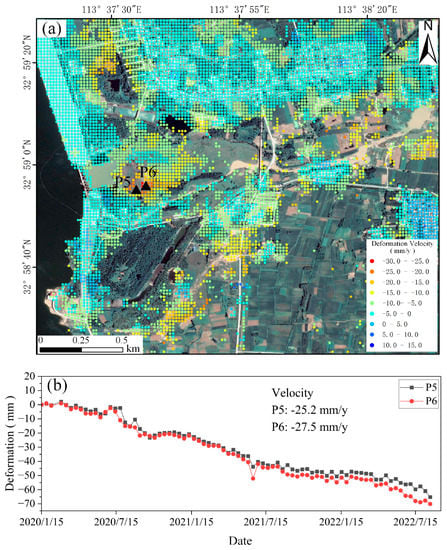
Figure 14.
Ru River monitoring results. (a) Ru River deformation velocity. (b) Deformation time series of the Ru River.
To analyze the reasons for the subsidence in this area, optical images at different time points were selected, as shown in Figure 15. The figure shows that the subsidence area was located within a piece of land in the river near the overflow dam, which was covered with vegetation in 2016. Between 2017 and 2018, part of the surface was flooded with river water, and the area evolved from grassland to bare land. In 2020, the submerged area reappeared and was still bare. The reappearance of the submerged portions indicates that the river level fell, and the cause of the subsidence in this area may be related to the river level, the water level falling, and the surface subsidence. In addition, due to the high soil moisture in this area, it is relatively soft and vulnerable to scour by river water, which may also lead to ground surface subsidence.
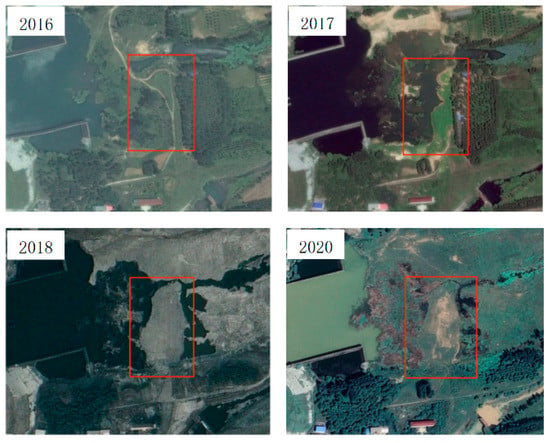
Figure 15.
Optical image map showing the Ru River deformation feature points at different times.
5. Discussion
After the breach of the Banqiao Dam in 1975, the stability of the rebuilt dam has received special attention. In this paper, the SBAS-InSAR technique was used to monitor the surface deformation of the Banqiao Dam for the first time in the region for hydraulic engineering stability monitoring, which filled a gap in the long-term, large-scale continuous monitoring data. In addition, to further improve the reliability of the monitoring results, the BeiDou data were used for comparative verification, demonstrating the reliability of time-series InSAR monitoring.
Multiple deformation factors were analyzed for the surface deformation fluctuations at important locations combined with time-series water level data, data from different parts of the dam, and optical image data, to analyze the complex deformation factors of the Banqiao Dam and its surroundings, providing important support for regional deformation risk management.
However, the InSAR technique also has limitations. When using InSAR technology for hydraulic engineering stability monitoring, atmospheric noise errors can impact the data. Currently, there are various atmospheric phase removal methods, but the atmospheric phase is variable and complex, and there is no method that can accurately remove the atmospheric phase. Therefore, systematic research is needed for atmospheric phase removal methods in hydraulic engineering stability monitoring.
Currently, there are an increasing number of types of SAR images, which provide rich data for hydraulic engineering stability monitoring; however, they also bring challenges to the spatiotemporal fusion of multisource data. Different SAR images have different spatiotemporal resolutions, radar incident angles, and wavelengths. How to effectively integrate multisource SAR information to achieve effective hydraulic engineering stability monitoring is an important future direction for hydraulic engineering safety monitoring using InSAR technology. In addition, combining InSAR technology with other monitoring methods to form a comprehensive monitoring system is also an important direction for future research.
6. Conclusions
In this study, we used SBAS technology to monitor the surface deformation of reservoir dams from 2020 to 2022, compared the monitoring results with BeiDou ground-based deformation measurements, and discussed and analyzed the deformation characteristics and causes in different regions in combination with relevant data. The conclusions are described as follows:
- (1)
- The deformation of most areas, including the dam in the study area, is relatively stable, and the regional deformation velocity of the Banqiao Reservoir dam and other hydraulic engineering facilities varies between −1 mm/y and −4 mm/y. The small difference in deformation in various areas of the dam body is consistent spatially, which suggests that the dam body is structurally stable. Variations in reservoir storage are one of the factors influencing the fluctuations in dam surface deformation. There is an apparent correlation between the factors that affect changes in dam deformation and reservoir water storage changes.
- (2)
- Subsidence was observed in some areas, and the maximum subsidence velocity in those areas reached 30 mm/y. The subsidence areas are mostly situated within some cultivated land around the village, the Ru River, and other areas. The causes of surface subsidence are likely associated with factors, such as rainfall, local geological conditions, and human production and construction.
- (3)
- There is good agreement between the InSAR monitoring results and the BeiDou ground-based deformation measurement data. The average root mean square error at the four common points is 1.1 mm, which demonstrates that the InSAR monitoring results are relatively reliable.
In this study, the surface deformation monitoring results near the Banqiao Reservoir dam provide a reference for damage analysis and advanced warnings for the region. Additionally, these results provide a scientific and reasonable basis for the formulation of subsidence control and planning measures, thus ensuring good supervision and improved governance and restoration. This work offers important guidance for local township construction and the prevention of geologic disasters.
Author Contributions
Conceptualization, W.J., Z.P. and J.L.; methodology, W.J., Z.P. and Z.Z.; validation, P.Z., X.C. and C.Z.; formal analysis, Q.J. and W.J.; writing—original draft preparation, Q.J., Z.Z., Z.P. and W.J.; writing—review and editing, W.J., P.F. and Z.Z.; visualization, J.L.; supervision, J.L. All authors have read and agreed to the published version of the manuscript.
Funding
This research was funded by the Major Science and Technology Project of the Ministry of Water Resources (SKR-2022048), China Institute of Water Resources and Hydropower Research Fundamental Research Operation Fund Special Project (90022306), Beidou Water Conservancy Comprehensive Application Demonstration Project (GFZX030303020127) and National Natural Science Foundation of China (42201467).
Data Availability Statement
No new data were created or analyzed in this study. Data sharing is not applicable to this article.
Acknowledgments
The authors would like to thank the European Space Agency (ESA) for providing free Sentinel-1A data.
Conflicts of Interest
The authors declare that they have no conflict of interest.
Appendix A

Table A1.
Sentinel-1A image data acquisition date table.
Table A1.
Sentinel-1A image data acquisition date table.
| Number | Image Acquisition Time | Number | Image Acquisition Time | Number | Image Acquisition Time |
|---|---|---|---|---|---|
| 1 | 2020-01-03 | 31 | 2021-01-09 | 61 | 2022-01-04 |
| 2 | 2020-01-15 | 32 | 2021-01-21 | 62 | 2022-01-16 |
| 3 | 2020-01-27 | 33 | 2021-02-02 | 63 | 2022-01-28 |
| 4 | 2020-02-08 | 34 | 2021-02-14 | 64 | 2022-02-09 |
| 5 | 2020-03-03 | 35 | 2021-02-26 | 65 | 2022-02-21 |
| 6 | 2020-03-15 | 36 | 2021-03-10 | 66 | 2022-03-05 |
| 7 | 2020-03-27 | 37 | 2021-03-22 | 67 | 2022-03-17 |
| 8 | 2020-04-08 | 38 | 2021-04-03 | 68 | 2022-03-29 |
| 9 | 2020-04-20 | 39 | 2021-04-15 | 69 | 2022-04-10 |
| 10 | 2020-05-02 | 40 | 2021-04-27 | 70 | 2022-04-22 |
| 11 | 2020-05-14 | 41 | 2021-05-09 | 71 | 2022-05-04 |
| 12 | 2020-05-26 | 42 | 2021-05-21 | 72 | 2022-05-16 |
| 13 | 2020-06-07 | 43 | 2021-06-02 | 73 | 2022-05-28 |
| 14 | 2020-06-19 | 44 | 2021-06-14 | 74 | 2022-06-09 |
| 15 | 2020-07-01 | 45 | 2021-06-26 | 75 | 2022-06-21 |
| 16 | 2020-07-13 | 46 | 2021-07-08 | 76 | 2022-07-03 |
| 17 | 2020-07-25 | 47 | 2021-07-20 | 77 | 2022-07-15 |
| 18 | 2020-08-06 | 48 | 2021-08-01 | 78 | 2022-07-27 |
| 19 | 2020-08-18 | 49 | 2021-08-13 | 79 | 2022-08-08 |
| 20 | 2020-08-30 | 50 | 2021-08-25 | 80 | 2022-08-20 |
| 21 | 2020-09-11 | 51 | 2021-09-06 | ||
| 22 | 2020-09-23 | 52 | 2021-09-18 | ||
| 23 | 2020-10-05 | 53 | 2021-09-30 | ||
| 24 | 2020-10-17 | 54 | 2021-10-12 | ||
| 25 | 2020-10-29 | 55 | 2021-10-24 | ||
| 26 | 2020-11-10 | 56 | 2021-11-05 | ||
| 27 | 2020-11-22 | 57 | 2021-11-17 | ||
| 28 | 2020-12-04 | 58 | 2021-11-29 | ||
| 29 | 2020-12-16 | 59 | 2021-12-11 | ||
| 30 | 2020-12-28 | 60 | 2021-12-23 |
References
- Milillo, P.; Perissin, D.; Salzer, J.T.; Lundgren, P.; Lacava, G.; Milillo, G.; Serio, C. Monitoring dam structural health from space: Insights from novel InSAR techniques and multi-parametric modeling applied to the Pertusillo dam Basilicata, Italy. Int. J. Appl. Earth Obs. Geoinf. 2016, 52, 221–229. [Google Scholar] [CrossRef]
- Huang, Q.; Liu, D.; Wei, X.; Yang, Y. Analysis of the most reason for the number of dams in China. J. Hydroelectr. Eng. 2021, 40, 35–45. [Google Scholar]
- Yun, Y.; Lü, X.; Fu, X.; Xue, F. Application of spaceborne interferometric synthetic aperture radar to geohazard monitoring. J. Radar 2020, 9, 73–85. [Google Scholar]
- Voege, M.; Frauenfelder, R.; Larsen, Y. Displacement monitoring at Svartevatn dam with interferometric SAR. In Proceedings of the 2012 IEEE International Geoscience and Remote Sensing Symposium, Munich, Germany, 22–27 July 2012; pp. 3895–3898. [Google Scholar]
- Ma, P.; Lin, H.; Wang, W.; Yu, H.; Chen, F.; Jiang, L.; Wang, J. Toward Fine Surveillance: A Review of Multitemporal Interferometric Synthetic Aperture Radar for Infrastructure Health Monitoring. IEEE Geosci. Remote Sens. Mag. 2021, 10, 207–230. [Google Scholar] [CrossRef]
- Scaioni, M.; Marsella, M.; Crosetto, M.; Tornatore, V.; Wang, J. Geodetic and remote-sensing sensors for dam deformation monitoring. Sensors 2018, 18, 3682. [Google Scholar] [CrossRef]
- Zhang, Z.; Lin, H.; Wang, M.; Liu, X.; Chen, Q.; Wang, C.; Zhang, H. A Review of Satellite Synthetic Aperture Radar Interferometry Applications in Permafrost Regions: Current Status, Challenges, and Trends. IEEE Geosci. Remote Sens. Mag. 2022, 10, 93–114. [Google Scholar] [CrossRef]
- de Sousa, J.J.; Lazecky, M.; Hlavacova, I.; Bakon, M.; Patricio, G.; Perissin, D. Satellite SAR interferometry for monitoring dam deformations in Portugal. In Proceedings of the Second International Dam World Conference, Lisbon, Portugal, 21–24 April 2015; pp. 21–24. [Google Scholar]
- Ferretti, A.; Prati, C.; Rocca, F. Permanent scatterers in SAR interferometry. IEEE Trans. Geosci. Remote Sens. 2001, 39, 8–20. [Google Scholar] [CrossRef]
- Berardino, P.; Fornaro, G.; Lanari, R.; Sansosti, E. A new algorithm for surface deformation monitoring based on small baseline differential SAR interferograms. IEEE Trans. Geosci. Remote Sens. 2002, 40, 2375–2383. [Google Scholar] [CrossRef]
- Michoud, C.; Baumann, V.; Lauknes, T.R.; Penna, I.; Derron, M.-H.; Jaboyedoff, M. Large slope deformations detection and monitoring along shores of the Potrerillos dam reservoir, Argentina, based on a small-baseline InSAR approach. Landslides 2016, 13, 451–465. [Google Scholar] [CrossRef]
- Yang, X. Application of InSAR Technology in Dam Deformation Monitoring and Deformation Mode Research. Master’s Thesis, Chang’an University, Xi’an, China, 2017. [Google Scholar]
- Aminjafari, S. Monitoring of Masjed-Soleiman embankment dam’s deformation using a combination of Interferometric Synthetic Aperture Radar (InSAR) and finite element modeling. Geod. Cartogr. 2017, 43, 14–21. [Google Scholar] [CrossRef]
- Xiao, R.; He, X. Deformation Monitoring of Reservoirs and Dams Using Time-Series InSAR. J. Wuhan Univ. (Inf. Sci. Ed.) 2019, 44, 1334–1341. [Google Scholar]
- Xiong, X.; Wang, M.; Gong, C. MT-InSAR technology to monitor surface deformation of reservoir earth-rock dam. Surv. Mapp. Geogr. Inf. 2019, 44, 78–81. [Google Scholar] [CrossRef]
- Liu, Y.; Fan, H.; Wang, L.; Zhuang, H. Monitoring of surface deformation in a low coherence area using distributed scatterers InSAR: Case study in the Xiaolangdi Basin of the Yellow River, China. Bull. Eng. Geol. Environ. 2021, 80, 25–39. [Google Scholar] [CrossRef]
- Vázquez-Ontiveros, J.R.; Ruiz-Armenteros, A.M.; de Lacy, M.C.; Gaxiola-Camacho, J.R.; Anaya-Díaz, M.; Vázquez-Becerra, G.E. Risk Evaluation of the Sanalona Earthfill Dam Located in Mexico Using Satellite Geodesy Monitoring and Numerical Modeling. Remote Sens. 2023, 15, 819. [Google Scholar] [CrossRef]
- Xiao, R.; Jiang, M.; Li, Z.; He, X. New insights into the 2020 Sardoba dam failure in Uzbekistan from Earth observation. Int. J. Appl. Earth Obs. Geoinf. 2022, 107, 102705. [Google Scholar] [CrossRef]
- Guo, J. Layout of Banqiao Reservoir Reconstruction Project. Water Conserv. Hydropower Technol. 1991, 26–30. [Google Scholar]
- Li, S.; Xu, W.; Li, Z. Review of the SBAS InSAR Time-series algorithms, applications, and challenges. Geod. Geodyn. 2021, 13, 114–126. [Google Scholar] [CrossRef]
- Xu, J.; Ma, T.; Lu, Y.; Bai, W.; Zhao, S. Land subsidence monitoring in the northern Henan Plain based on SBAS-InSAR technology. J. Jilin Univ. (Earth Sci. Ed.) 2019, 49, 1182–1191. [Google Scholar] [CrossRef]
- Zhang, Y.; Liu, Y.; Jin, M.; Jing, Y.; Liu, Y.; Liu, Y.; Sun, W.; Wei, J.; Chen, Y. Monitoring land subsidence in Wuhan city (China) using the SBAS-InSAR method with radarsat-2 imagery data. Sensors 2019, 19, 743. [Google Scholar] [CrossRef]
- Zhang, L.; Zhao, Y.; Shi, X. Discussion on development and utilization of water resources in Banqiao Reservoir. Henan Water Conserv. South-North Water Transf. Proj. 2012, 12, 16–17. [Google Scholar]
- Jin, J.; Tamang, B.; Lee, S.; Im, E.; Jung, H.; Kim, Y. A study on behavioral characteristics of core-based dam subjected to variable water level fluctuation rates. Int. J. Civ. Eng. 2021, 20, 433–444. [Google Scholar] [CrossRef]
Disclaimer/Publisher’s Note: The statements, opinions and data contained in all publications are solely those of the individual author(s) and contributor(s) and not of MDPI and/or the editor(s). MDPI and/or the editor(s) disclaim responsibility for any injury to people or property resulting from any ideas, methods, instructions or products referred to in the content. |
© 2023 by the authors. Licensee MDPI, Basel, Switzerland. This article is an open access article distributed under the terms and conditions of the Creative Commons Attribution (CC BY) license (https://creativecommons.org/licenses/by/4.0/).