Communication

Monitoring Seismo-TEC Perturbations Utilizing the Beidou Geostationary Satellites

1
College of Environment and Civil Engineering, Chengdu University of Technology, Chengdu 610059, China
2
Institute of Earthquake Forecasting, China Earthquake Administration, Beijing 100036, China
3
School of Geophysics and Geomatics, China University of Geosciences, Wuhan 430074, China
*
Author to whom correspondence should be addressed.
Remote Sens. 2023, 15(10), 2608; https://doi.org/10.3390/rs15102608
Submission received: 6 April 2023 / Revised: 4 May 2023 / Accepted: 15 May 2023 / Published: 17 May 2023

Abstract

:
Electromagnetic signals transmitted from the Beidou geostationary satellites can be utilized to monitor changes in ionospheric total electron contents (TECs) at motionless ionospheric pierce points (IPPs) over the Earth’s surface 24 h a day. The TEC perturbations at close IPPs detected via distinct horizontal azimuths and elevation angles can be examined by utilizing different measuring geometries formed by the selected geostationary satellites and ground-based Global Navigation Satellite System (GNSS) stations. The M6.9 Menyuan earthquake occurred in northwest China on 7 January 2022. We collected TEC perturbations associated with the Menyuan earthquake at those motionless IPPs to examine the capability of the TEC measurements utilizing distinct horizontal azimuths and elevation angles. The experimental results show that the TEC perturbations associated with the earthquake traveled away from the area around the epicenter with velocities of ~800 m/s and ~1000 m/s in the ionosphere. The traveling TEC perturbations were consistently observed in different geometries. Such novel results show that the pronounced TEC perturbations can be obtained once the satellite hanging high over the Earth’s surface in front of the traveling TEC perturbations is selected. This study shows that geostationary satellites provide an excellent opportunity to conduct experiments on the advantage of the TEC observation technology.

1. Introduction

The Global Navigation Satellite System (GNSS) comprises satellites in space and ground-based receivers on the Earth’s surface. The ground-based GNSS receivers receive electromagnetic signals transmitted from GNSS satellites to determine precision positions on the Earth’s surface. In addition, the carrier phase delays of the transmitted electromagnetic signals can be utilized to estimate Total Electron Contents (TECs) in the ionosphere [1,2]. Based on the assumption of a thin ionospheric layer, changes in the GNSS TECs quantified by TECU (unit of TEC, 1 TECU = 1016 el/m2) are generally considered to be located at ionospheric pierce points (IPPs) with an altitude of 350 km above the Earth’s surface [3]. Meanwhile, orbiting satellites surround the Earth—and, accordingly, the locations of IPPs—move over time. The ground-based GNSS receivers have been employed to monitor changes in GNSS TECs during nature hazards as well as magnetic storms [4,5,6,7], regardless of whether the GNSS TECs retrieved from orbiting satellites are functions of locations and time. Discontinuity is the instinct for GNSS TECs due to the fact that the elevation angles of orbiting satellites are usually smaller than the cut-off value (in general, 20°). Propagations of TEC perturbations could be captured once IPPs are patrolling in the region close to the perturbations. Based on massive GNSS data, some scientists proposed that co-seismic ionospheric TEC perturbations can be triggered by intense ground vibrations [8,9,10,11,12,13], tsunamis [14,15], and other natural hazards [16,17]. Those TEC perturbations are mainly observed from the data collected during the 2004 Sumatra–Andaman earthquake [18,19,20] and the 2011 Tohoku–Oki earthquake [3,21,22]. The propagation velocities of the TEC perturbations are important clues to expose potential sources and/or the traveling heights [23]. The TEC perturbations propagate with a velocity of ~200 m/s in the ionosphere that is generated by tsunamis [22,23,24,25]. On the other hand, the TEC perturbations propagate with a velocity of ~3000 m/s in the ionosphere that can be observed a few minutes after the arrival of Rayleigh waves [26]. The perturbations triggered by Rayleigh waves and/or tsunamis are detectable in areas with a far distance (>2000 km) [14,22,27,28]. Alternatively, perturbations propagate at the acoustic speed in the atmosphere (i.e., from 300 m/s in the lower atmosphere up to 800 m/s at the height of 350 km [27]). Note that the perturbations caused by the acoustic and Rayleigh waves can mix near the epicenter right after the earthquake occurrence [17]. Those results focus on the measurements of the TEC perturbations utilizing orbiting satellites via IPPs on patrol. However, the discrepancy in the TEC perturbations measured by distinct horizontal azimuths and elevation angles is rarely studied. In this study, we designed a technical experiment to investigate the discrepancy in the advantage of the TEC observation technology utilizing the BeiDou Navigation Satellite System (BDS).

2. Data and Methods

The BDS operated by China is one of the GNSS systems in the world [29]. The BDS GNSS system comprises five geostationary satellites hanging at a height of 35,000 km over the equator of Asia [29,30,31,32] (Figure 1). The TECs can also be computed by utilizing the electromagnetic signals at frequencies of 1561 MHz and 1207 MHz transmitted from the BDS geostationary satellites [32] through the transitional method [1,2]. Note that the positions of geostationary satellites relative to ground-based GNSS receivers appear almost motionless, and the IPPs for the BDS geostationary satellites are motionless over particular positions on the Earth’s surface. These IPPs can be considered as fixed seismometers in the ionosphere. The BDS TECs at the motionless IPPs, computed utilizing electromagnetic signals transmitted from the geostationary satellite, are a function of one variable (i.e., time). Therefore, the ground-based GNSS receivers together with the geostationary satellites can form numerous distinct geometries for measuring TEC perturbations. These geometries can provide an excellent condition for examining the above-mentioned TEC measurements.
The M6.9 Menyuan earthquake occurred in Qinghai (37.77°N, 101.26°E) on 7 January 2022. We retrieved the continuous BDS TECs at the IPPs in the four directions shown in Figure 1. Then, we constructed traveling time versus distance plots based on TEC data retrieved from the selected IPPs to estimate velocity and investigate potential sources. The influence of the elevation angles on TEC measurements can be examined by comparing the TEC perturbations at IPPs from the different satellites in front of the traveling route. In contrast, the influences of horizontal azimuths on TEC measurements are investigated by the TEC perturbations at IPPs aligning in a particular direction from different satellites.

3. Interpretation

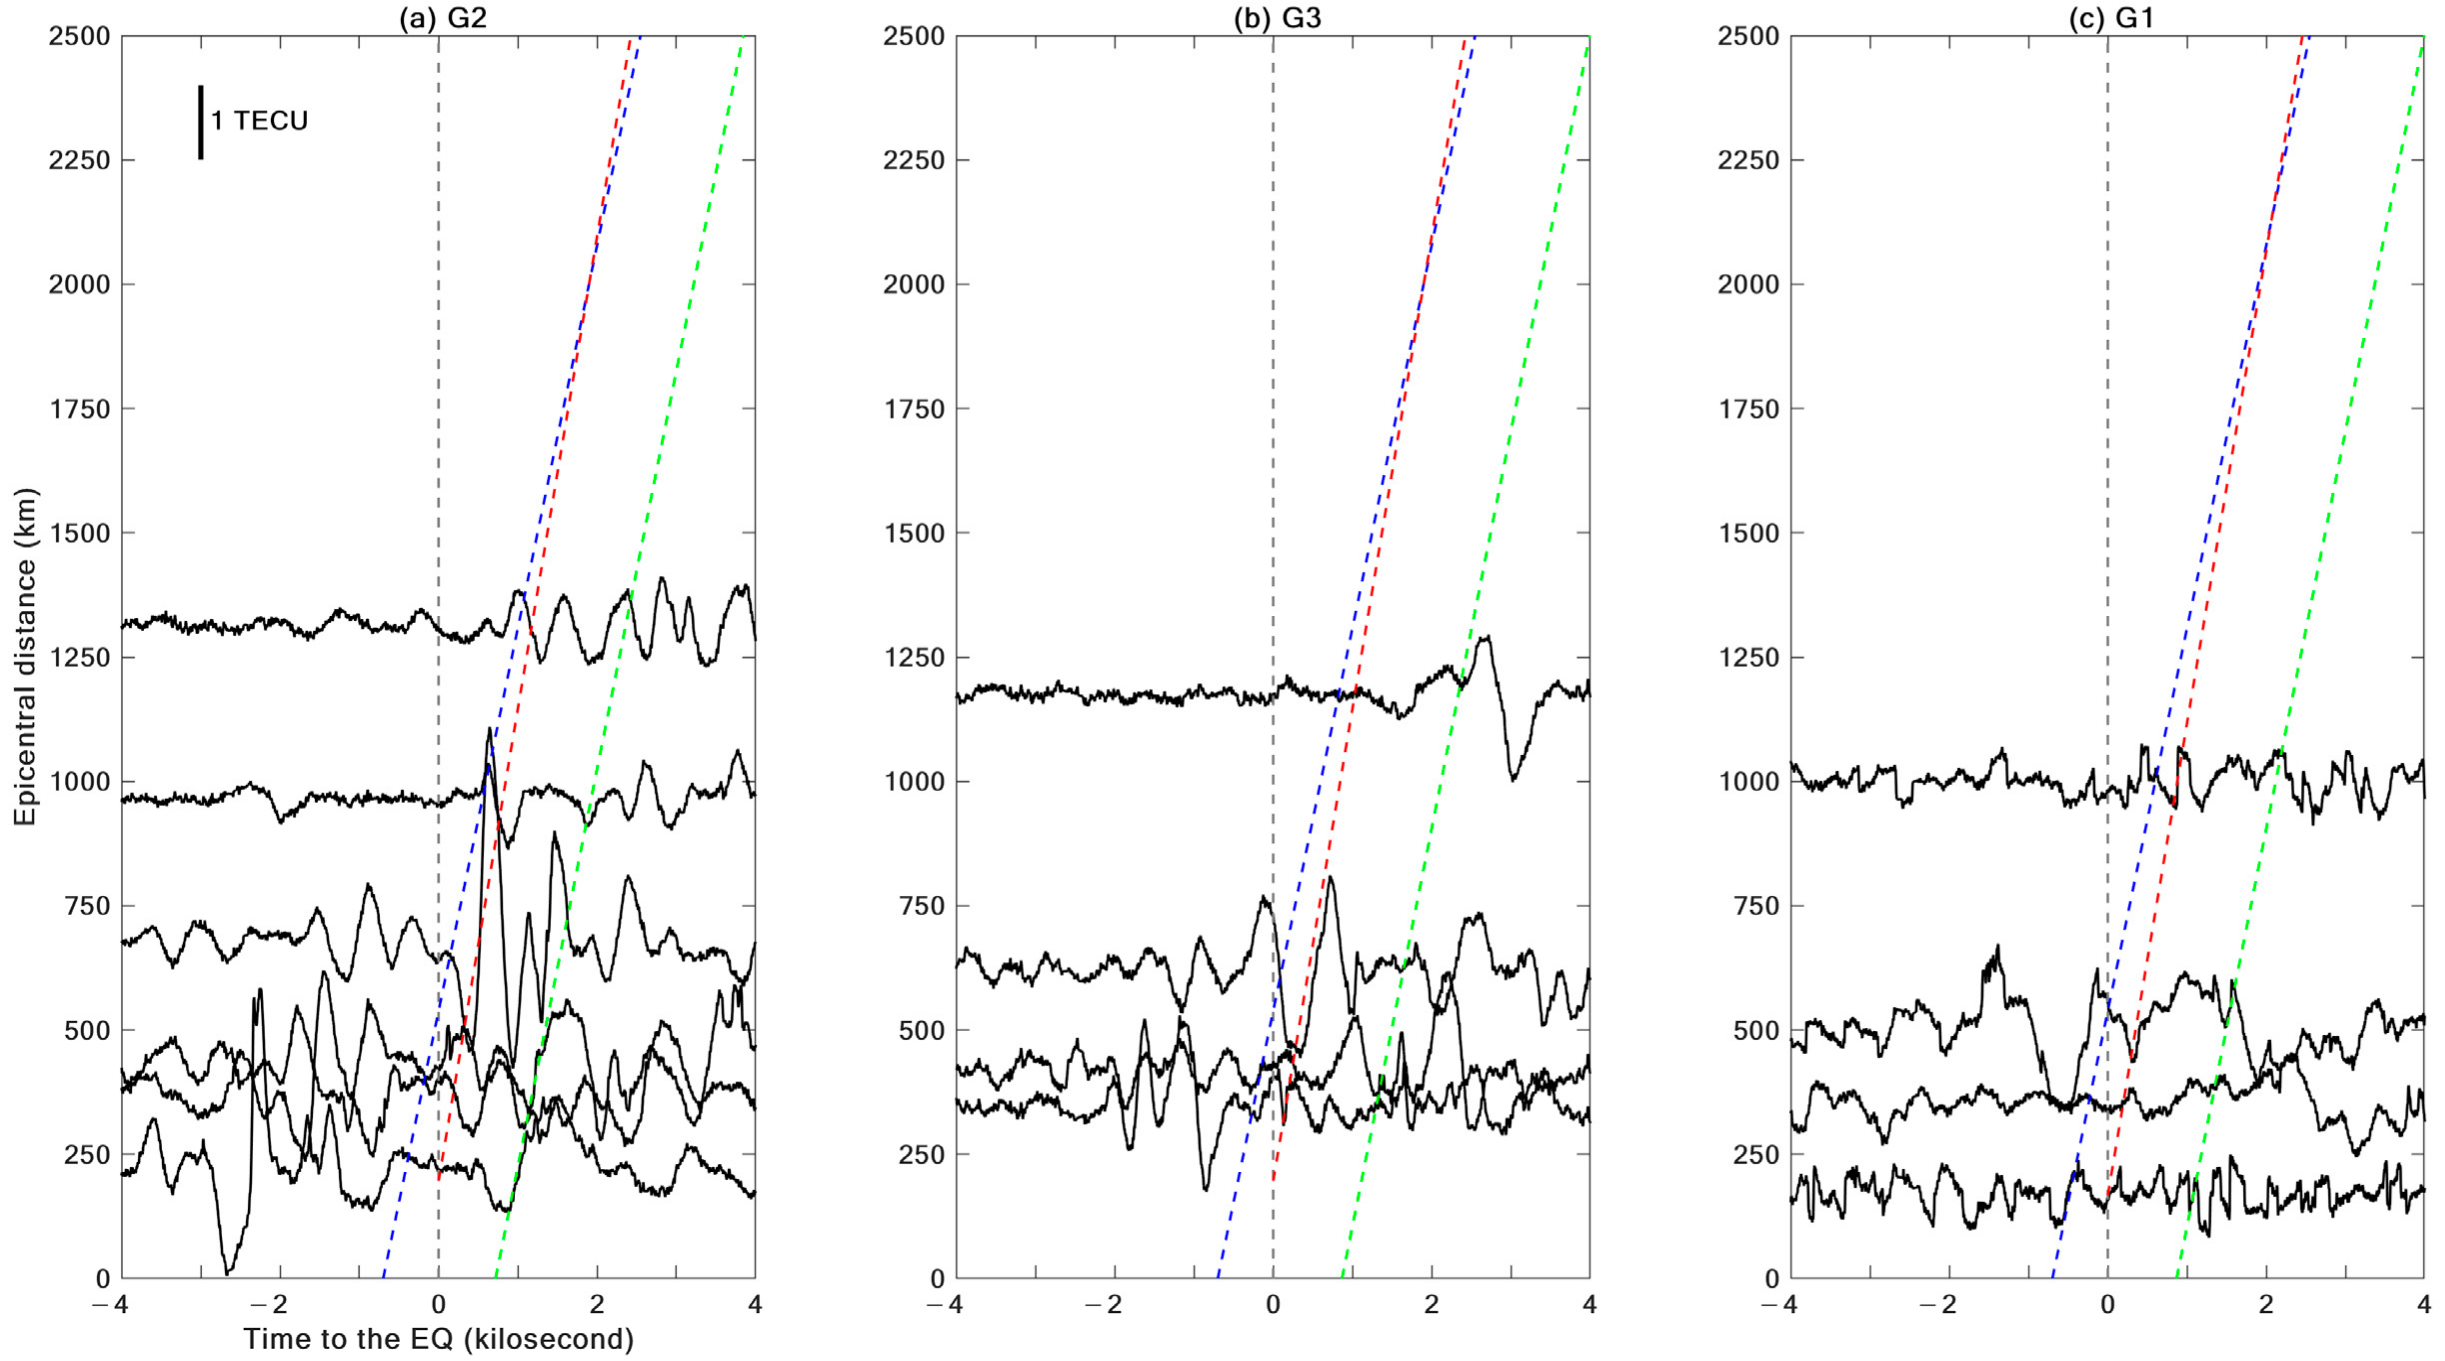
Figure 1 shows the locations of the epicenter of the Menyuan earthquake and the BDS geostationary satellites (i.e., G1, G2, and G3) in this study. The selected IPPs are mainly located within land areas in China due to the distribution of the ground-based GNSS stations. We removed long-period variations from the TECs by subtracting the running average of a 600-s moving window. The residuals of the TECs during the earthquake retrieved from the IPPs aligning in the direction toward the BDS geostationary satellites are shown in Figure 2. Figure 2a shows the residual TECs from G2 at the IPPs 4000 s before and after the earthquake. The residual TECs with obvious amplitudes can be found at the IPPs within the epicentral distance of 1000 km near 2000 s before the earthquake. Amplitudes of the residual TECs become small 1000 s before and after the earthquake. Regarding those at the IPPs with epicentral distances > 1000 km, no significant variations can be observed. In contrast, the enhancements at the IPPs with epicentral distances of 670 km and 1310 km appear 90 s and 1010 s after the earthquake, respectively. According to the traveling time versus distance plot, the propagation velocity of IPPs was estimated to be 696 m/s. We traced the sources of the traveling enhancements utilizing the extension of the blue dashed line and found that the enhancements formed 457 s before the earthquake. Regarding the co-seismic TEC perturbations, the enhancements of a small peak with an amplitude of 0.04 TECU appear 390 km away from the epicenter. The co-seismic perturbations propagate toward exterior areas with a velocity of 990 m/s and become unclear at the IPPs with the epicentral distances > 750 km. On the other hand, the post-seismic TEC perturbations are pronounced in the residuals of TECs at the IPP with an epicentral distance of ~220 km 840 s after the earthquake occurrence. The post-seismic TEC perturbations travel toward exterior areas with a velocity of 800 m/s and become unclear when the epicentral distance exceeds 1000 km.
We further examined the residuals of the TECs at the IPPs aligning in the direction from the epicenter to G2 utilizing the electromagnetic signals transmitted from the G3 and G1 satellites shown in Figure 2b,c, respectively. The TEC perturbations with a similar velocity travel away from the epicenter during the earthquake, which can be consistently observed in Figure 2b,c regardless of the rare discrepancy in peaking time. These suggest that the seismo-TEC perturbations are a fact and exist during the earthquake. Two of them originate from areas close to the epicenter and horizontally travel in the ionosphere with acoustic velocities of ~800 m/s. The post-seismic TEC perturbations lag 750 s behind the earthquake occurrence, suggesting that the post-seismic perturbations vertically propagate into the ionosphere with the velocity of acoustic propagation [13,27]. After arrival, the TEC perturbations horizontally travel in the ionosphere with an acoustic velocity of 800 m/s. On the other hand, the velocity of 990 m/s appears at a certain distance away from the epicenter, possibly caused by shock waves due to the intensity of ground vibrations of Rayleigh waves.
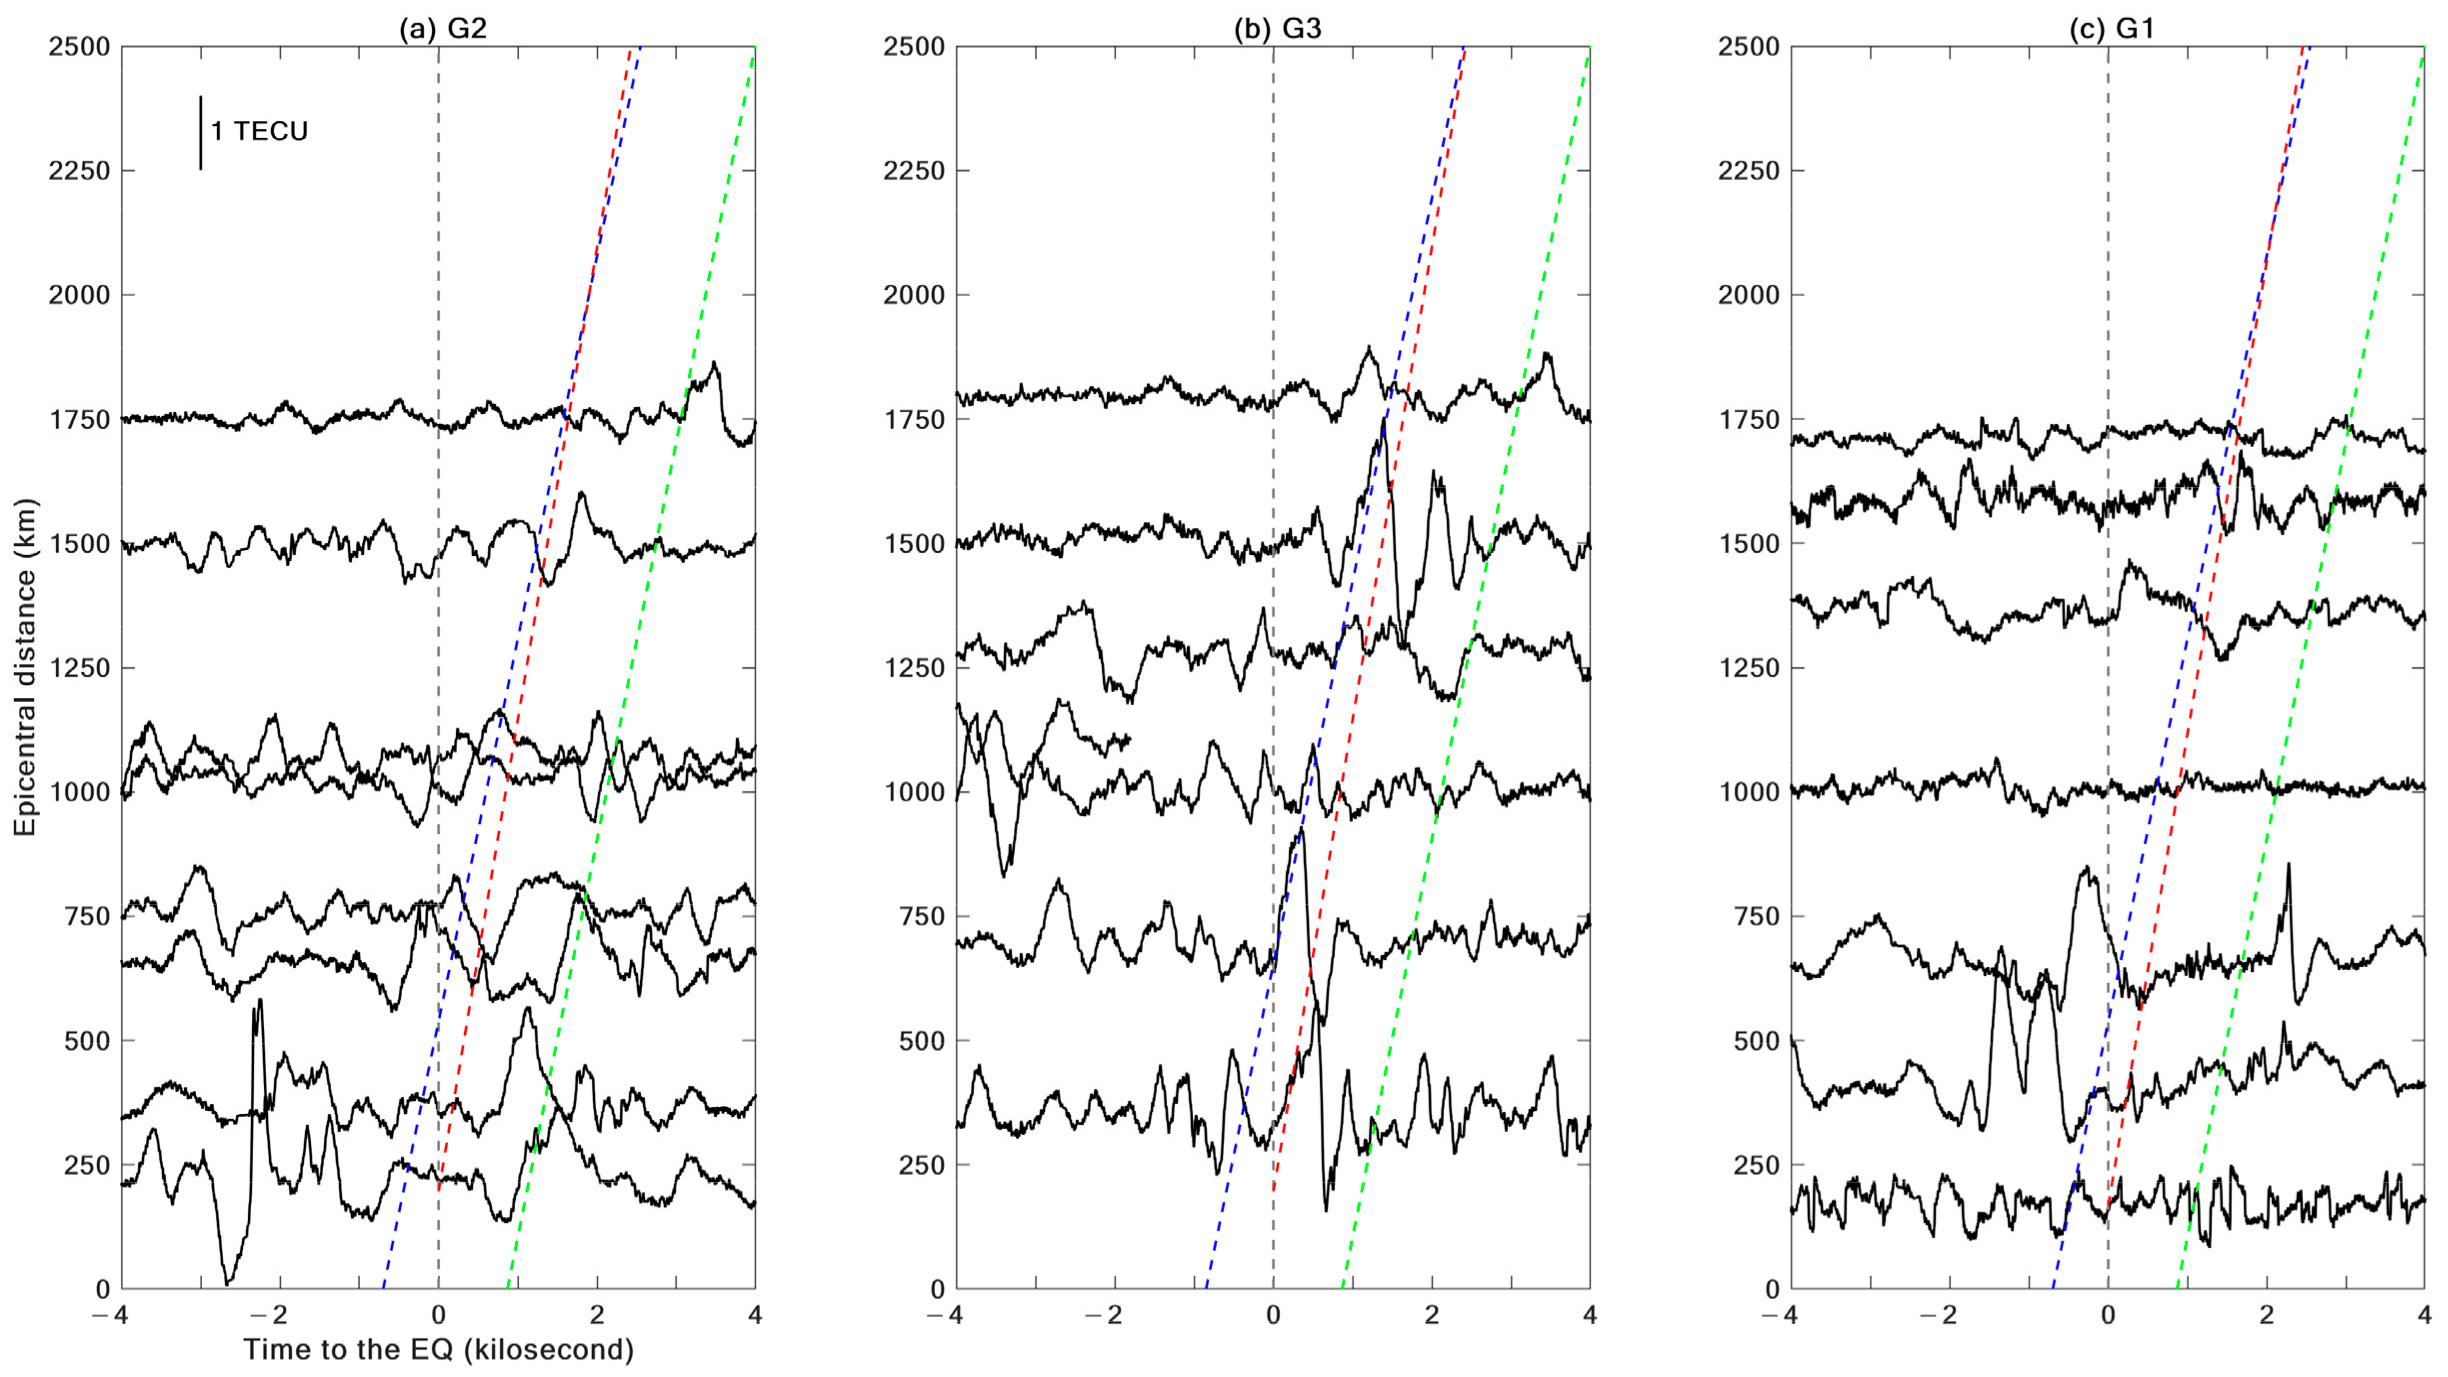
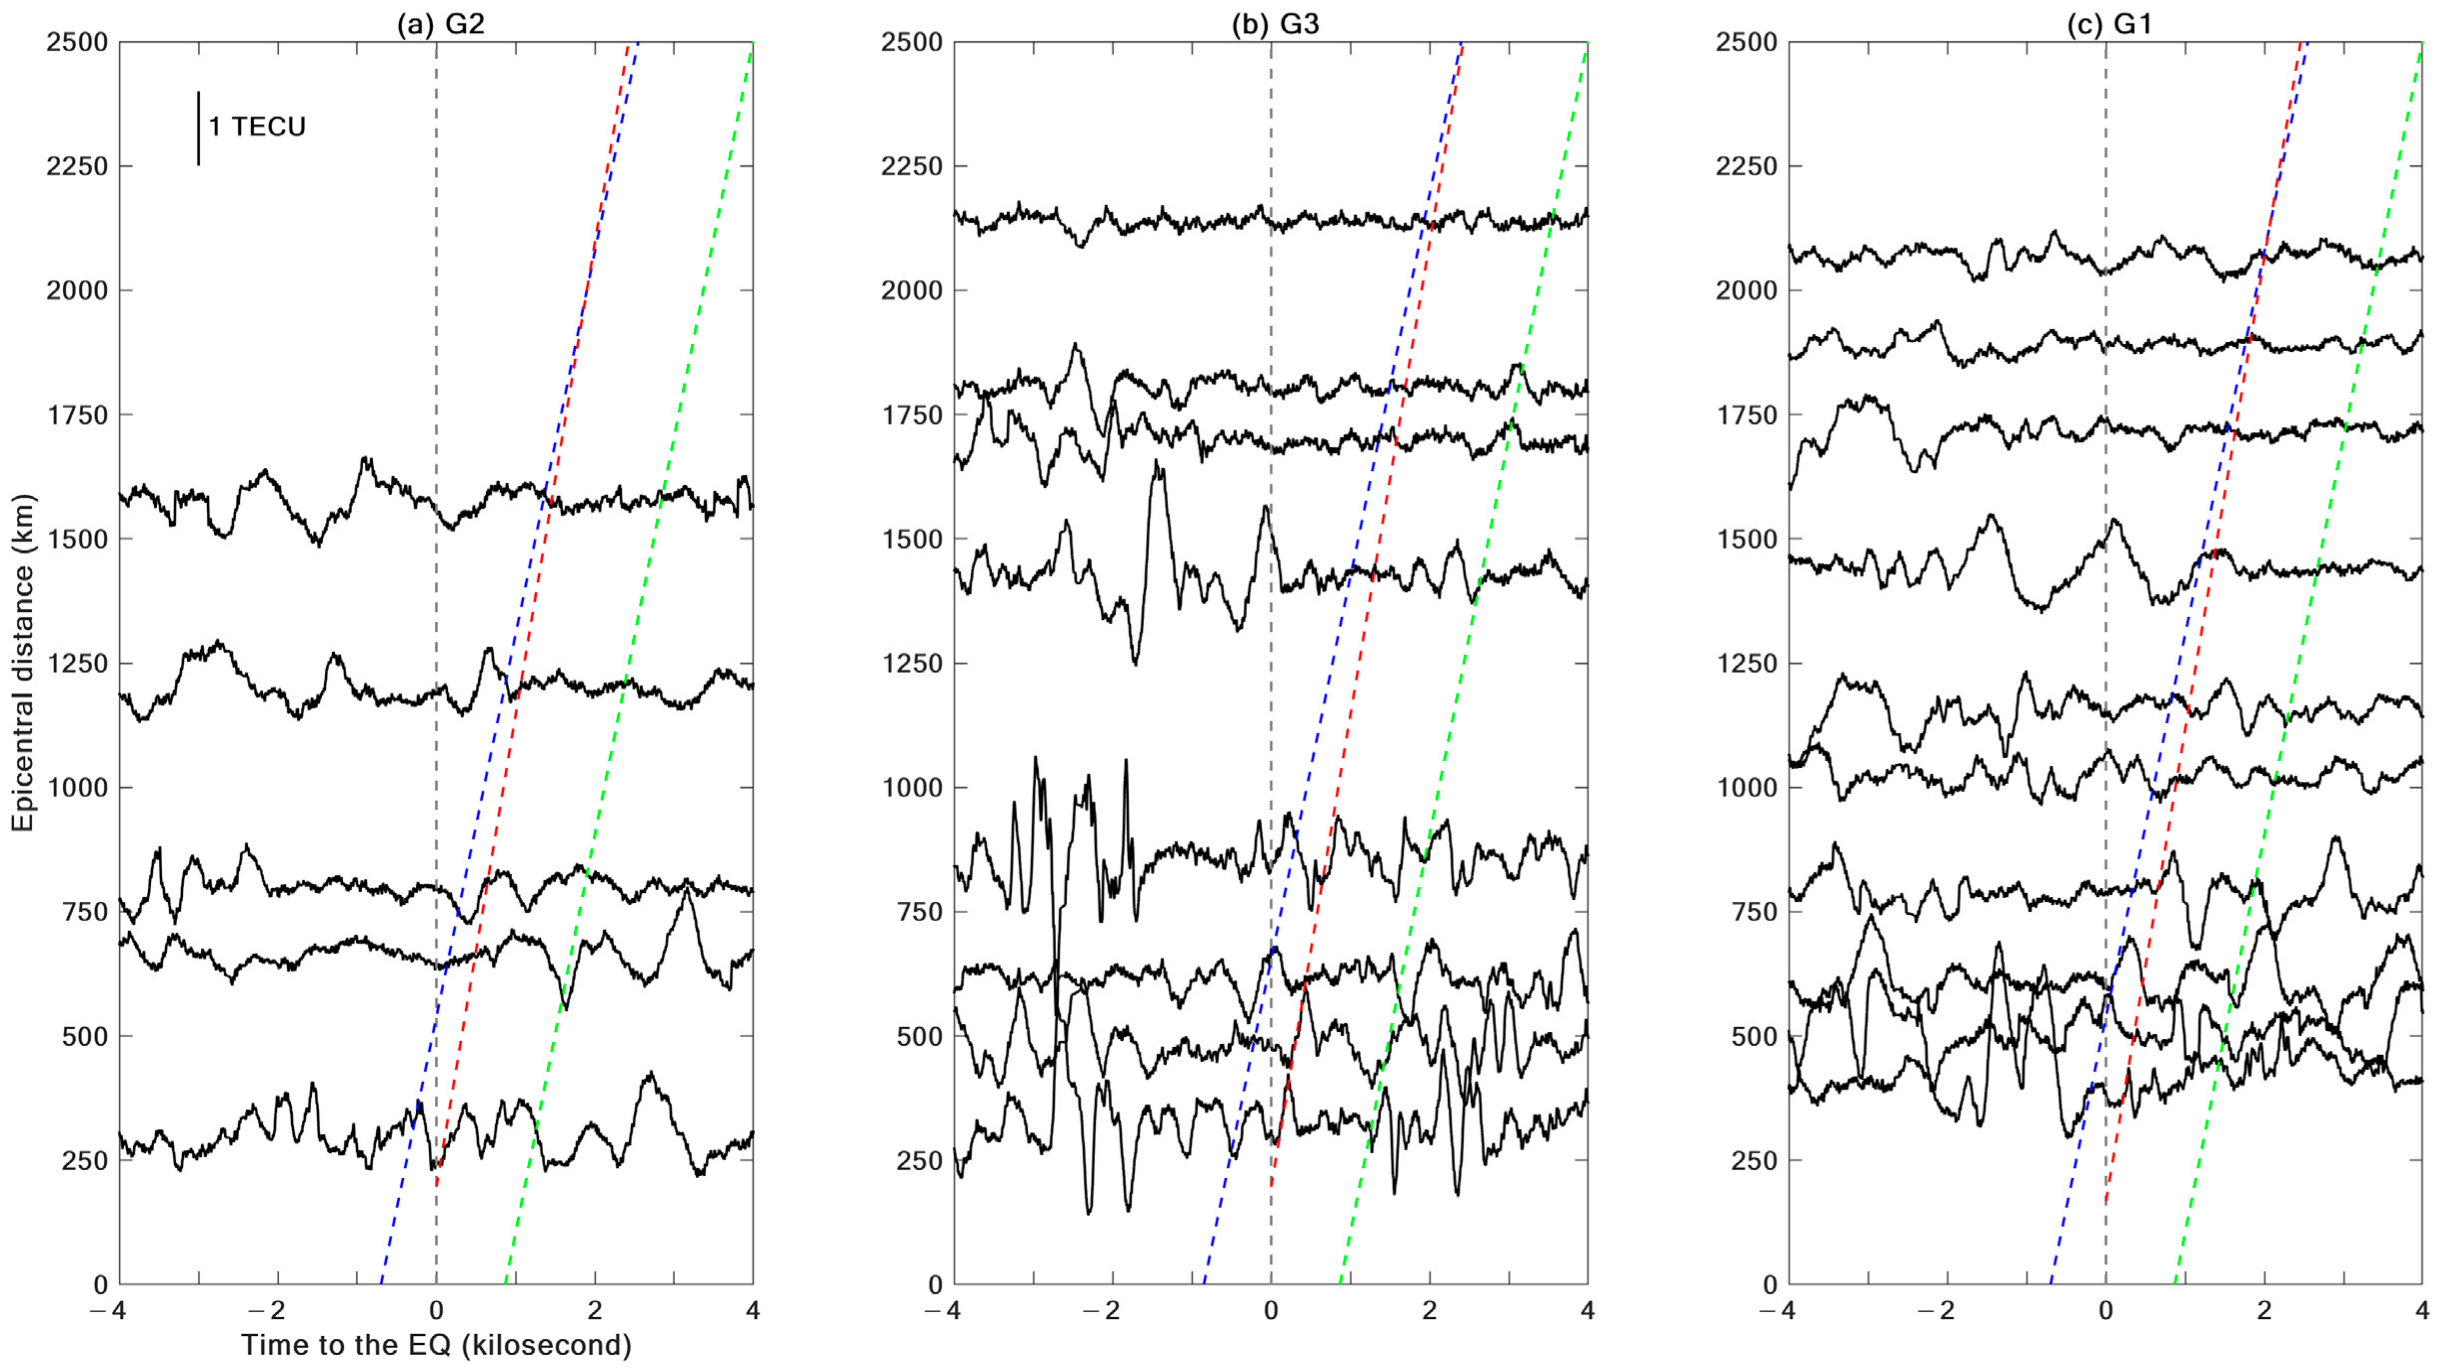
The residual TEC perturbations at the IPPs aligning in the direction from the epicenter to G1 (Figure 3) and G3 (Figure 4) were further utilized to investigate the pronounced directions of the perturbations during the earthquake. The TEC perturbations travel toward G1 and G3 with similar velocities (800 m/s and 990 m/s) during the earthquake (Figure 3 and Figure 4). The TEC perturbations travel toward G1 that is mainly limited within the epicentral distance of 1500 km before the earthquake (Figure 3). The co-seismic perturbations exhibit an “N” shape with pronounced amplitudes of 0.8 TECU (Figure 3b). The amplitudes of the co-seismic perturbations become too small to be detected in the areas with an epicentral distance > 1200 km. After the arrival of the co-seismic perturbations, variations of the TEC residuals became complex. Post-seismic TEC perturbations can be distinguished from the TEC residuals with an epicentral distance larger than 1200 km (Figure 3c). In terms of the IPPs aligning in the direction toward G3 (Figure 4), the amplitude of the seismo-TEC perturbations is obvious. The perturbations originated before the earthquake can be detected 2000 km away from the epicenter, particularly for G3 (Figure 4a). The perturbations can be generated by large-scale ground vibrations [33,34,35] due to seismo-resonant waves residing over the epicenters [36] before forthcoming earthquakes. The co-seismic TEC perturbations could be distinguished in areas with an epicentral distance < 1500 km [12]. On the other hand, the ionospheric hole has been observed during the Touhoku earthquakes [37,38]. The post-seismic TEC perturbations are difficult to be observed with epicentral distances < 1000 km. The difficulty would be caused by the existence of the ionospheric hole during earthquakes reported in the previous study [37]. Alternatively, the post-seismic TEC perturbations would be generated by acoustic-gravity waves triggered by Rayleigh waves [10,20,39,40]. The post-seismic TEC perturbations roughly match the arrival time estimated using the TEC residuals at the different directions in the exterior areas with an epicentral distance > 1000 km. Those results suggest that the TEC perturbations easily travel in the eastern and southern directions. Overall, the traveling of the seismo-TEC perturbations before and after the earthquake can be captured at selected IPPs utilizing distinct satellites with different horizontal azimuths and elevation angles. We further examined different horizontal azimuths and elevation angles to obtain pronounced variations through comparisons among the sharp, amplitude, and traveling distance of the seismo-TEC perturbations.

4. Discussion

The TEC perturbations triggered by the Menyuan earthquake mainly appear within the epicentral distance of 1500 km, which is consistent with the results from previous studies [12]. Figure 4b shows the TEC perturbations with the largest amplitude of ~2 TECU. The G3 satellite captures the largest amplitude with a high elevation angle and a 0° azimuth angle (i.e., in front of the traveling direction of the perturbations). We further compared the sharp and amplitudes of the TEC perturbations for G3 with those for G1 and G2 in each figure (i.e., Figure 2, Figure 3 and Figure 4) to understand the elevation angles on the TEC measurements. The relatively-large amplitudes are often observed by satellites with high elevation angles, indicating that the BDS geostationary satellites with an altitude of 35,000 km are able to yield high elevation angles for the ground-based receivers to obtain pronounced perturbations, particularly for G3. To investigate the influence of the azimuth angle on the TEC measurements, the TEC residuals in the southeastern direction are additionally shown in Figure 5. The traveling TEC perturbations with comparable velocities away from the epicenter area are consistently found in Figure 5. We compared the amplitude of the perturbations for G3 at the IPPs in different directions shown in Figure 2b, Figure 3b, Figure 4b and Figure 5b. The perturbations with relatively-small amplitudes roughly appear in areas with a small epicentral distance for the measuring with a relatively-large azimuth angle (Figure 3b and Figure 5b). The largest amplitude is observed in Figure 4b. This suggests that significant results may be obtained once the measurement is performed in front of the traveling waves.
The sharp and propagation velocity of the co-seismic and post-seismic perturbations observed in this study are roughly in agreement with those reported in the previous studies [39,41]. The unclear post-seismic perturbations become pronounced ones in areas with a relatively large epicentral distance due to the disturbances from coda waves of the co-seismic TEC perturbations. Similar phenomena (i.e., wave interference) have been reported in previous studies [17]. The interaction among the TEC perturbations from distinct sources not only occurs over the epicenter [41] but also in areas away from the epicenter, demonstrating that the BDS geostationary satellites are powerful tools in studying the TEC perturbations. On the other hand, perturbations with a velocity of 770–950 m/s originating from areas close to the epicenter can be observed during the Menyuan earthquake. The velocity observed in this study is comparable to those of 600–1100 m/s that can be referred to the AGWs traveling most of the time in the ionosphere [10,20,39,40].

5. Conclusions

The employment of the BDS geostationary satellites for the monitoring of TECs in the ionosphere provides an excellent approach and opportunity for the examination of the TEC measurements utilizing distinct horizontal azimuths and elevation angles. The seismo-TEC perturbations travel away from areas close to the epicenter with a wide-angle sector. The seismo-perturbations mainly travel in the atmosphere with a velocity of 800 m/s before and after the earthquake. On the other hand, seismo-TEC perturbations with a velocity of 900 m/s lag 12 min behind the earthquake occurrence. Such a time delay (i.e., 12 mins) suggests that acoustic waves are excited by ground vibrations and take ~12 mins vertically propagating to the ionosphere, driving the changes in TECs. The experiment also demonstrates the value of geostationary satellites with high elevation angles in the progression of TEC observation. In addition, the best way to capture TEC perturbations is by standing in front of their traveling route.

Author Contributions

Conceptualization, F.W. and X.Z.; methodology, F.W. and X.Z.; software, L.D.; validation, F.W. and X.Z.; formal analysis, F.W., X.Z. and J.L.; investigation, J.L. and K.L.; data curation, K.L.; writing—original draft preparation, F.W., X.Z. and C.-H.C.; writing—review and editing, F.W., X.Z. and Z.M.; funding acquisition, C.-H.C. All authors have read and agreed to the published version of the manuscript.

Funding

This research was funded by the Joint Funds of the National Natural Science Foundation of China (Grant no. U2039205), and Natural Science Foundation of Sichuan Province (Grant no. 2023NSFSC0785).

Data Availability Statement

The data are available at the link https://doi.org/10.6084/m9.figshare.19431440.v1, accessed on 28 March 2022.

Acknowledgments

The authors thank everyone who supported the establishment of GNSS observation systems and maintained the data. The authors thank for the Data Sharing Infrastructure of the National Earthquake Data Center in China (http://data.earthquake.cn, accessed on 2 February 2022) sharing the data.

Conflicts of Interest

The authors declare no conflict of interest.

References

  1. Davies, K. Ionospheric Radio; Space Environment Laboratory: Boulder, CO, USA, 1990. [CrossRef]
  2. Mannucci, A.; Iijima, B.; Lindqwister, U.; Pi, X.; Sparks, L.; Wilson, B. GPS and Ionosphere: Review of Radio Science 1996–1999; Oxford University Press: New York, NY, USA, 1999; pp. 625–665. [Google Scholar]
  3. Liu, J.Y.; Chen, C.H.; Lin, C.H.; Tsai, H.F.; Chen, C.H.; Kamogawa, M. Ionospheric disturbances triggered by the 11 March 2011 M9.0 Tohoku earthquake. J. Geophys. Res.-Space Phys. 2011, 116, A06319. [Google Scholar] [CrossRef]
  4. Ren, X.; Yang, P.; Mei, D.; Liu, H.; Xu, G.; Dong, Y. Global Ionospheric TEC Forecasting for Geomagnetic Storm Time Using a Deep Learning-Based Multi-Model Ensemble Method. Space Weather 2023, 21, e2022SW003231. [Google Scholar] [CrossRef]
  5. Idosa, C.; Shogile, K. Variations of ionospheric TEC due to coronal mass ejections and geomagnetic storm over New Zealand. New Astron. 2023, 99, 101961. [Google Scholar] [CrossRef]
  6. Bojilova, R.; Mukhtarov, P. Comparative Analysis of Global and Regional Ionospheric Responses during Two Geomagnetic Storms on 3 and 4 February 2022. Remote Sens. 2023, 15, 1739. [Google Scholar] [CrossRef]
  7. Zhai, C.; Chen, Y.; Cheng, X.; Yin, X. Spatiotemporal Evolution and Drivers of the Four Ionospheric Storms over the American Sector during the August 2018 Geomagnetic Storm. Atmosphere 2023, 14, 335. [Google Scholar] [CrossRef]
  8. Calais, E.; Minster, J.B. GPS detection of ionospheric perturbations following the January 17, 1994, Northridge earthquake. Geophys. Res. Lett. 1995, 22, 1045–1048. [Google Scholar] [CrossRef]
  9. Ducic, V.; Artru, J.; Lognonné, P. Ionospheric remote sensing of the Denali earthquake Rayleigh surface waves. Geophys. Res. Lett. 2003, 30, 1951. [Google Scholar] [CrossRef]
  10. Heki, K.; Ping, J.S. Directivity and apparent velocity of the coseismic ionospheric disturbances observed with a dense GPS array. Earth Planet. Sci. Lett. 2005, 236, 845–855. [Google Scholar] [CrossRef]
  11. Cahyadi, M.N.; Heki, K. Coseismic ionospheric disturbance of the large strike-slip earthquakes in North Sumatra in 2012: M-w dependence of the disturbance amplitudes. Geophys. J. Int. 2015, 200, 116–129. [Google Scholar] [CrossRef]
  12. Zhao, B.; Hao, Y. Ionospheric and geomagnetic disturbances caused by the 2008 Wenchuan earthquake: A revisit. J. Geophys. Res.-Space Phys. 2015, 120, 5758–5777. [Google Scholar] [CrossRef]
  13. Sun, Y.Y.; Lin, J.Y.; Lin, C.Y.; Tasi, H.F.; Chang, L.C.; Chen, C.Y.; Chen, C.H. Ionospheric F-2 region perturbed by the 25 April 2015 Nepal earthquake. J. Geophys. Res.-Space Phys. 2016, 121, 5778–5784. [Google Scholar] [CrossRef]
  14. Occhipinti, G.; Rolland, L.; Lognonne, P.; Watada, S. From Sumatra 2004 to Tohoku-Oki 2011: The systematic GPS detection of the ionospheric signature induced by tsunamigenic earthquakes. J. Geophys. Res.-Space Phys. 2013, 118, 3626–3636. [Google Scholar] [CrossRef]
  15. Artru, J.; Ducic, V.; Kanamori, H.; Lognonné, P.; Murakami, M. Ionospheric detection of gravity waves induced by tsunamis. Geophys. J. Int. 2005, 160, 840–848. [Google Scholar] [CrossRef]
  16. Sun, Y.Y. GNSS brings us back on the ground from ionosphere. Geosci. Lett. 2019, 6, 14. [Google Scholar] [CrossRef]
  17. Astafyeva, E. Ionospheric detection of natural hazards. Rev. Geophys. 2019, 57, 1265–1288. [Google Scholar] [CrossRef]
  18. DasGupta, A.; Das, A.; Hui, D.; Bandyopadhyay, K.K.; Sivaraman, M.R. Ionospheric perturbations observed by the GPS following the December 26, 2004 Sumatra-Andaman earthquake. Earth Planets Space 2006, 58 (Suppl. S2), 167–172. [Google Scholar] [CrossRef]
  19. Liu, J.Y.; Tsai, Y.B.; Ma, K.F.; Chen, Y.I.; Tsai, H.F.; Lin, C.H.; Kamogawa, M.; Lee, C.P. Ionospheric GPS total electron content (TEC) disturbances triggered by the 26 December 2004 Indian Ocean tsunami. J. Geophys. Res.-Space Phys. 2006, 111, A05303. [Google Scholar] [CrossRef]
  20. Otsuka, Y.; Kotake, N.; Tsugawa, T.; Shiokawa, K.; Ogawa, T.; Effendy; Saito, S.; Kawamura, M.; Maruyama, T.; Hemmakorn, N.; et al. GPS detection of total electron content variations over Indonesia and Thailand following the 26 December 2004 earthquake. Earth Planets Space 2006, 58, 159–165. [Google Scholar] [CrossRef]
  21. Chen, C.H.; Saito, A.; Lin, C.H.; Liu, J.Y.; Tsai, H.F.; Tsugawa, T.; Otsuka, Y.; Nishioka, M.; Matsumura, M. Long-distance propagation of ionospheric disturbance generated by the 2011 off the Pacific coast of Tohoku Earthquake. Earth Planets Space 2011, 63, 881–884. [Google Scholar] [CrossRef]
  22. Rolland, L.M.; Lognonne, P.; Astafyeva, E.; Kherani, E.A.; Kobayashi, N.; Mann, M.; Munekane, H. The resonant response of the ionosphere imaged after the 2011 off the Pacific coast of Tohoku earthquake. Earth Planets Space 2011, 63, 853–857. [Google Scholar] [CrossRef]
  23. Liu, J.Y.; Sun, Y.Y. Seismo-traveling ionospheric disturbances of ionograms observed during the 2011 M-w 9.0 Tohoku earthquake. Earth Planets Space 2011, 63, 897–902. [Google Scholar] [CrossRef]
  24. Tsai, H.F.; Liu, J.Y.; Lin, C.H.; Chen, C.H. Tracking the epicenter and the tsunami origin with GPS ionosphere observation. Earth Planets Space 2011, 63, 859–862. [Google Scholar] [CrossRef]
  25. Kamogawa, M.; Orihara, Y.; Tsurudome, C.; Tomida, Y.; Kanaya, T.; Ikeda, D.; Gusman, A.R.; Kakinami, Y.; Liu, J.-Y.; Toyoda, A. A possible space-based tsunami early warning system using observations of the tsunami ionospheric hole. Sci. Rep. 2016, 6, 37989. [Google Scholar] [CrossRef] [PubMed]
  26. Tsugawa, T.; Saito, A.; Otsuka, Y.; Nishioka, M.; Maruyama, T.; Kato, H.; Nagatsuma, T.; Murata, K.T. Ionospheric disturbances detected by GPS total electron content observation after the 2011 off the Pacific coast of Tohoku earthquake. Earth Planet Space 2011, 63, 875–879. [Google Scholar] [CrossRef]
  27. Liu, J.Y.; Chen, C.H.; Sun, Y.Y.; Chen, C.H.; Tsai, H.F.; Yen, H.Y.; Chum, J.; Lastovicka, J.; Yang, Q.S.; Chen, W.S.; et al. The vertical propagation of disturbances triggered by seismic waves of the 11 March 2011 M9.0 Tohoku Earthquake over Taiwan. Geophys. Res. Lett. 2016, 43, 1759–1765. [Google Scholar] [CrossRef]
  28. Hao, Y.Q.; Xiao, Z.Z.; Zhang, D.H. Responses of the ionosphere to the great Sumatra earthquake and volcanic eruption of Pinatubo. Chin. Phys. Lett. 2006, 23, 1955–1957. [Google Scholar] [CrossRef]
  29. Su, X.N.; Meng, G.J.; Sun, H.; Wu, W.W. Positioning performance of BDS observation of the crustal movement observation network of China and its potential application on crustal deformation. Sensors 2018, 18, 3353. [Google Scholar] [CrossRef] [PubMed]
  30. Chen, C.-H.; Sun, Y.-Y.; Zhang, X.; Wang, F.; Lin, K.; Gao, Y.; Tang, C.-C.; Lyu, J.; Huang, R.; Huang, Q. Far-field coupling and interactions in multiple geospheres after the Tonga volcano eruptions. Surv. Geophys. 2023, 44, 587–601. [Google Scholar] [CrossRef]
  31. Chen, C.-H.; Zhang, X.; Sun, Y.-Y.; Wang, F.; Liu, T.-C.; Lin, C.-Y.; Gao, Y.; Lyu, J.; Jin, X.; Zhao, X. Individual Wave Propagations 374 in Ionosphere and Troposphere Triggered by the Hunga Tonga-Hunga Ha’apai Underwater Volcano Eruption on 15 January 2022. Remote Sens. 2022, 14, 2179. [Google Scholar] [CrossRef]
  32. Chen, C.H.; Sun, Y.Y.; Lin, K.; Zhou, C.; Xu, R.; Qing, H.Y.; Gao, Y.; Chen, T.; Wang, F.; Yu, H.; et al. A new instrumental array in Sichuan, China, to monitor vibrations and perturbations of the lithosphere, atmosphere and ionosphere. Surv. Geophys. 2021, 42, 1425–1442. [Google Scholar] [CrossRef]
  33. Chen, C.H.; Lin, L.-C.; Yeh, T.-K.; Wen, S.; Yu, H.; Yu, C.; Gao, Y.; Han, P.; Sun, Y.-Y.; Liu, J.-Y.; et al. Determination of epicenters before earthquakes utilizing far seismic and GNSS data, Insights from ground vibrations. Remote Sens. 2020, 12, 3252. [Google Scholar] [CrossRef]
  34. Chen, C.H.; Sun, Y.-Y.; Wen, S.; Han, P.; Lin, L.-C.; Yu, H.; Zhang, X.; Gao, Y.; Tang, C.-C.; Lin, C.-H.; et al. Spatiotemporal changes of seismicity rate during earthquakes. Nat. Hazards Earth Syst. Sci. 2020, 20, 3333–3341. [Google Scholar] [CrossRef]
  35. Bedford, J.R.; Moreno, M.; Deng, Z.; Oncken, O.; Schurr, B.; John, T.; Báez, J.C.; Bevis, M. Months-long thousand-kilometre-scale wobbling before great subduction earthquakes. Nature 2020, 580, 628–635. [Google Scholar] [CrossRef] [PubMed]
  36. Chen, C.H.; Sun, Y.-Y.; Xu, R.; Lin, K.; Wang, F.; Zhang, D.; Zhou, Y.; Gao, Y.; Zhang, X.; Yu, H.; et al. Resident waves in the ionosphere before the M6.1 Dali and M7.3 Qinghai earthquakes of 21–22 May 2021. Earth Space Sci. 2022, 9, e2021EA002159. [Google Scholar] [CrossRef]
  37. Kakinami, Y.; Kamogawa, M.; Watanabe, S.; Odaka, M.; Mogi, T.; Liu, J.Y.; Sun, Y.Y.; Yamada, T. Ionospheric ripples excited by superimposed wave fronts associated with Rayleigh waves in the thermosphere. J. Geophys. Res.-Space Phys. 2013, 118, 905–911. [Google Scholar] [CrossRef]
  38. Kakinami, Y.; Kamogawa, M.; Tanioka, Y.; Watanabe, S.; Gusman, A.R.; Liu, J.Y.; Watanabe, Y.; Mogi, T. Tsunamigenic ionospheric hole. Geophys. Res. Lett. 2012, 39, L00G27. [Google Scholar] [CrossRef]
  39. Afraimovich, E.L.; Perevalova, N.P.; Plotnikov, A.V.; Uralov, A.M. The shock-acoustic waves generated by earthquakes. Ann. Geophys. 2001, 19, 395–409. [Google Scholar] [CrossRef]
  40. Liu, J.Y.; Tsai, H.F.; Lin, C.H.; Kamogawa, M.; Chen, Y.I.; Lin, C.H.; Huang, B.S.; Yu, S.B.; Yeh, Y.H. Coseismic ionospheric disturbances triggered by the Chi-Chi earthquake. J. Geophys. Res. 2010, 115, A08303. [Google Scholar] [CrossRef]
  41. Astafyeva, E.; Heki, K. Dependence of waveform of near-field coseismic ionospheric disturbances on focal mechanisms. Earth Planets Space 2009, 61, 939–943. [Google Scholar] [CrossRef]
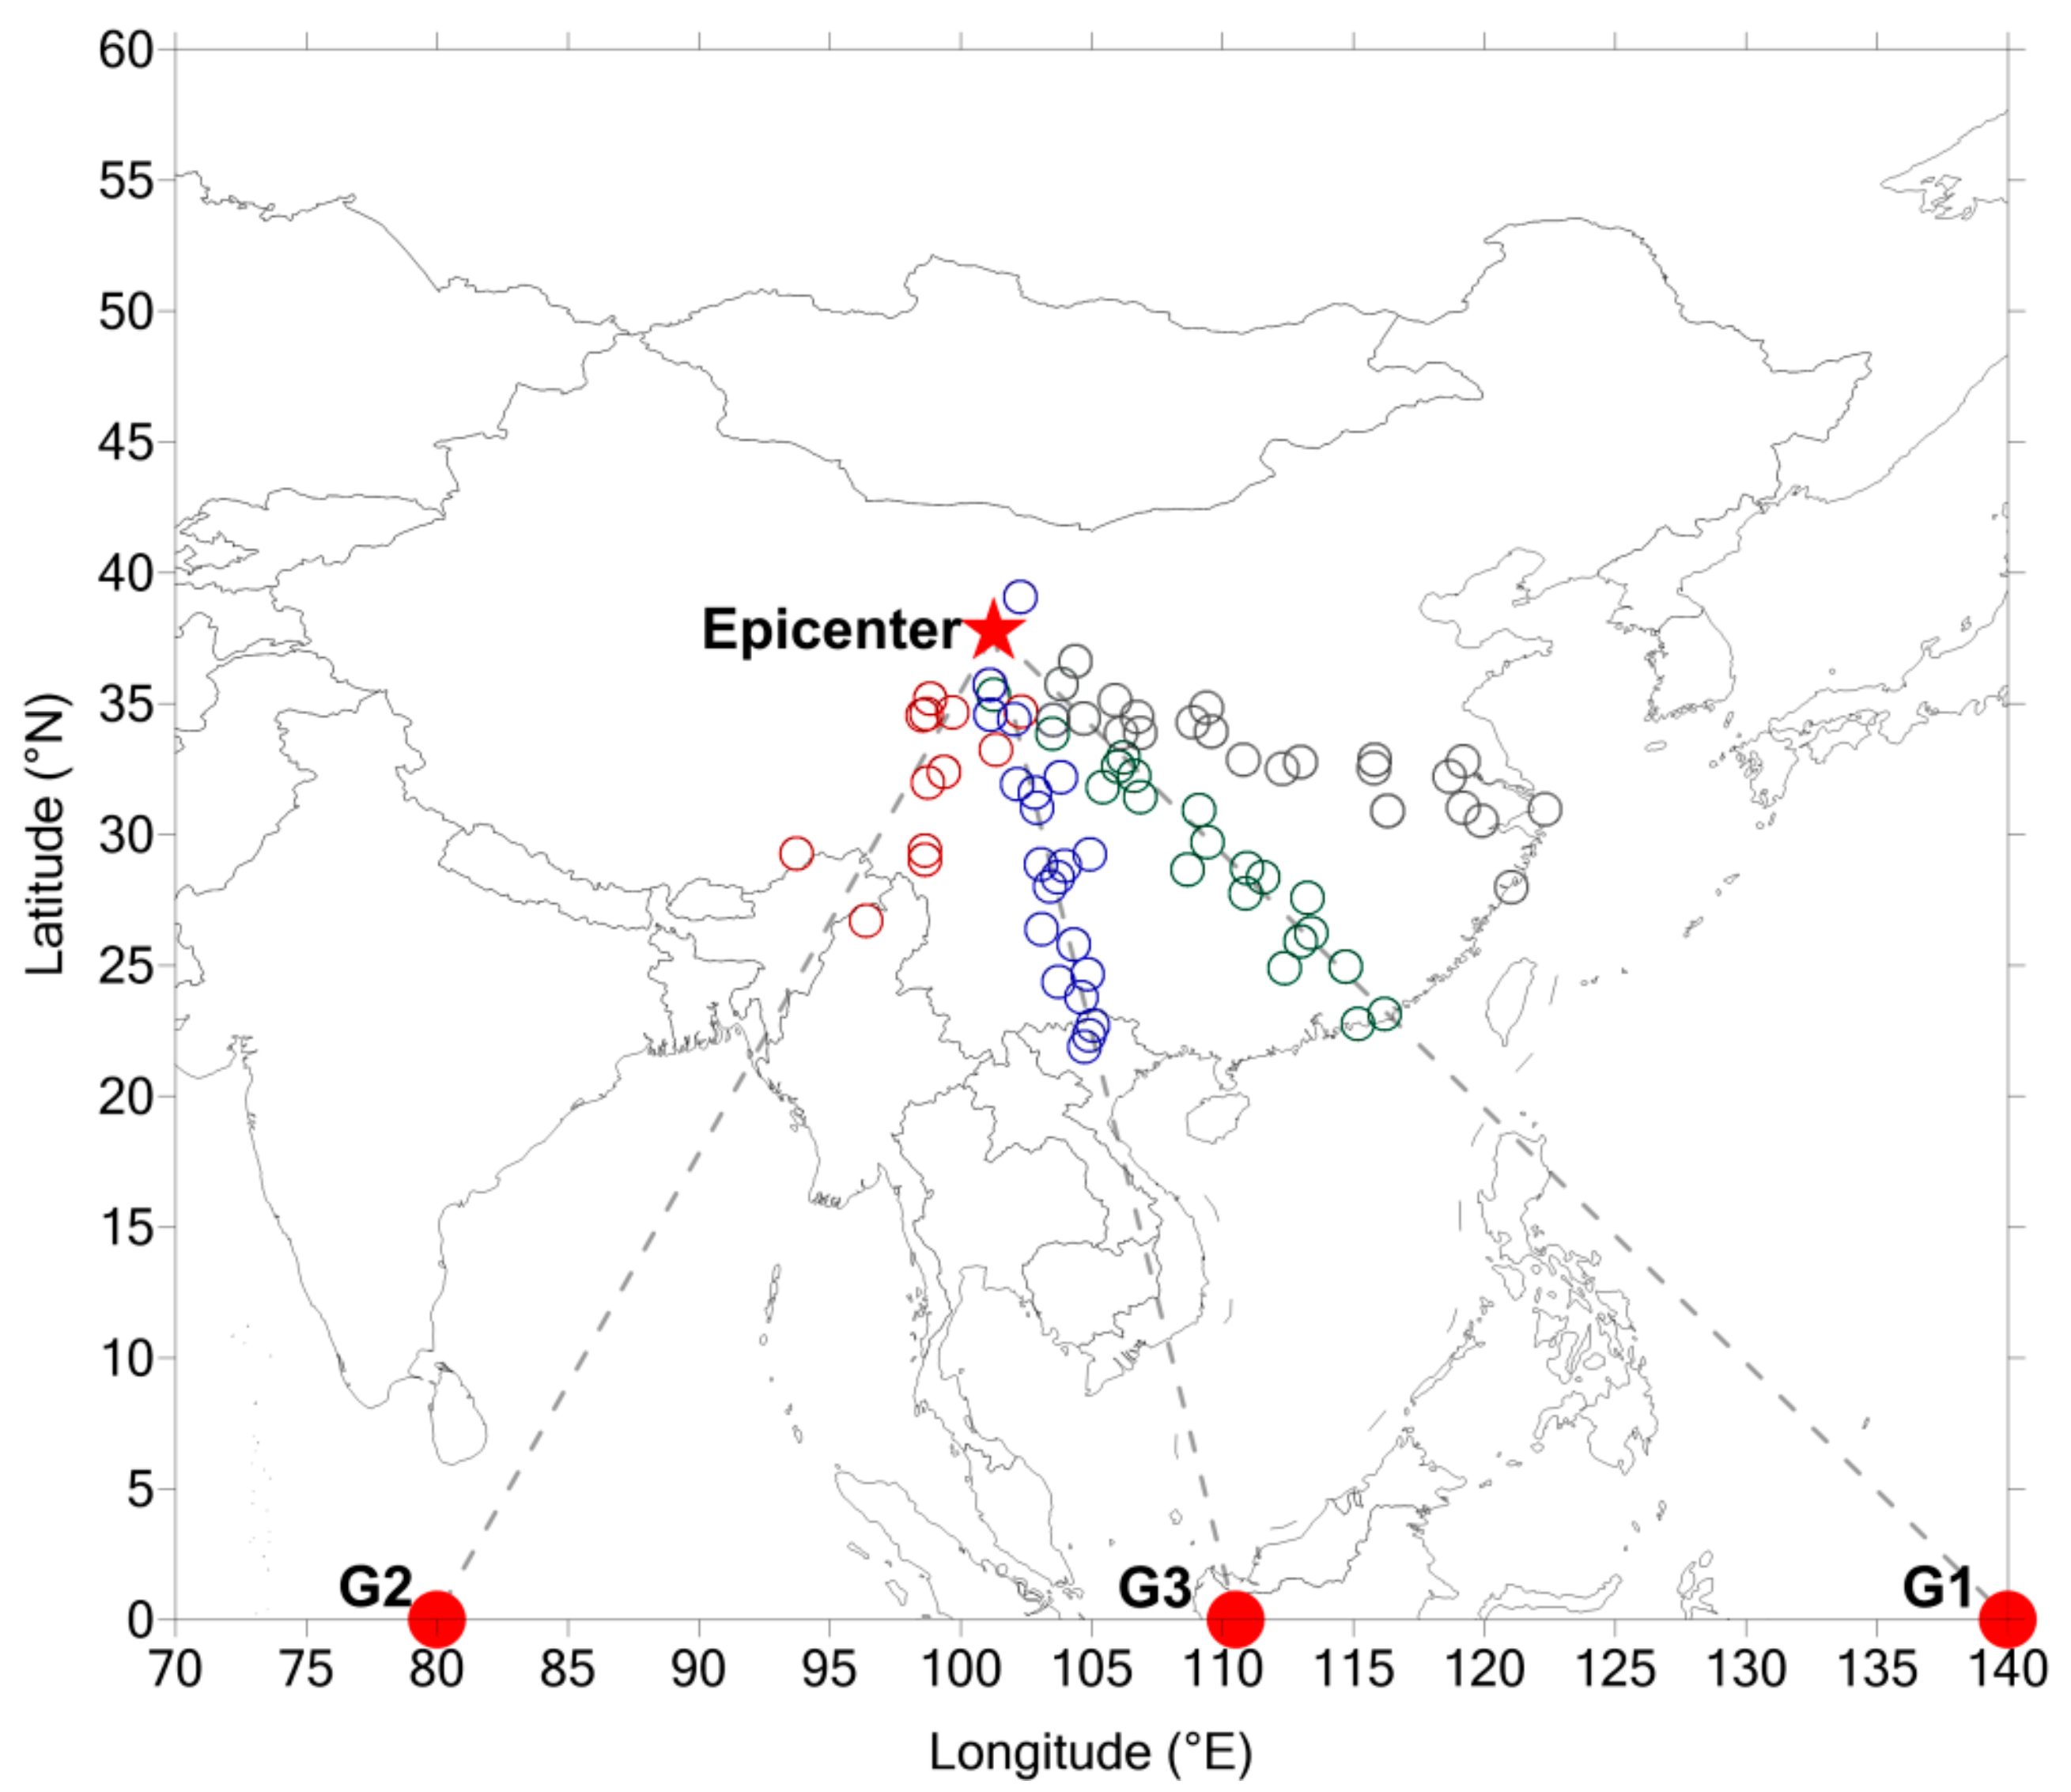
Figure 1. Locations of the selected IPPs, the epicenter of the Menyuan earthquake, and the BDS geostationary satellites. The red star shows the location of the epicenter. The solid circles indicate the locations of the BDS G1 (140°E), G2 (80°E), and G3 (110.5°E) satellites. The open circles mark the selected IPPs. The red, blue, and green open circles lie in the directions (grey dashed lines) aligning toward the geostationary (G2, G3, and G1) satellites, respectively. Note that the grey open circles are distributed along the direction that is orthogonal to the G2-epicenter direction for the purpose of investigating the influence of measuring azimuth angles on the TEC perturbations.
Remotesensing 15 02608 g001
Figure 2. Residual TEC perturbations at IPPs aligning in the direction from the epicenter to G2 utilizing distinct geostationary satellites 4000 s before and after the earthquake. (ac) shows the residual TEC perturbations obtained from the electromagnetic signals transmitted from the G2, G3, and G1 geostationary satellites. The black lines show variations of the residual TEC during the earthquake. The blue, red and green dashed lines show the velocity of 770 m/s, 950 m/s, and 800 m/s, respectively. The vertical dashed line indicates the occurrence of the Menyuan earthquake.
Remotesensing 15 02608 g002
Figure 3. The residual TEC perturbations at IPPs aligning in the direction from the epicenter to G1 utilizing distinct geostationary satellites 4000 s before and after the earthquake. (ac) show the residual TEC perturbations obtained from the electromagnetic signals transmitted from the G2, G3, and G1 geostationary satellites, respectively. The black lines show the variations of the TEC during the earthquake. The blue, red and green dashed lines show the velocity of 770 m/s, 950 m/s, and 800 m/s, respectively. The vertical dashed line indicates the occurrence time of the Menyuan earthquake.
Remotesensing 15 02608 g003
Figure 4. The residual TEC perturbations at IPPs aligning in the direction from the epicenter to G3 utilizing distinct geostationary satellites 4000 s before and after the earthquake. (ac) show the residual TEC perturbations obtained from the electromagnetic signals transmitted from the G2, G3, and G1 geostationary satellites, respectively. The black lines show variations of the TEC during the earthquake. The blue, red, and green dashed lines show the velocity of 770 m/s, 950 m/s and 800 m/s, respectively. The vertical dashed line indicates the occurrence time of the Menyuan earthquake.
Remotesensing 15 02608 g004
Figure 5. The residual TEC perturbations at IPPs aligning in the southeastern direction utilizing distinct geostationary satellites 4000 s before and after the earthquake. (ac) show the residual TEC perturbations obtained from the electromagnetic signals transmitted from the G2, G3, and G1 geostationary satellites, respectively. The black lines show variations of the TEC during the earthquake. The blue, red, and green dashed lines show the velocity of 770 m/s, 950 m/s, and 800 m/s, respectively. The vertical dashed line indicates the occurrence time of the Menyuan earthquake.
Remotesensing 15 02608 g005
Disclaimer/Publisher’s Note: The statements, opinions and data contained in all publications are solely those of the individual author(s) and contributor(s) and not of MDPI and/or the editor(s). MDPI and/or the editor(s) disclaim responsibility for any injury to people or property resulting from any ideas, methods, instructions or products referred to in the content.