1. Introduction
Mangroves and their ecosystems provide many benefits, or ecosystem services. These include a wide variety of ecosystem services to coastal communities, such as producing timber, supplying food as important fisheries habitat, and growing plants used as traditional medicine [
1,
2,
3]. Coastal communities are often buffered from storm damages by mangroves, which can dissipate wave energy, absorb sediment, and buffer storm surges [
4,
5]. Mangroves are vital for carbon storage and sequestration, as they are among the most productive ecosystems in the world, containing, on average, 1023 Mg of carbon per hectare [
6,
7,
8]. Globally, it is estimated that 30–50% of the world’s mangroves have been lost within the last 50 years [
8].
Mangrove declines and deforestation are caused by human activities such as increased coastal urban development, agriculture, mariculture, and tourism [
7,
9]. Mangrove decline is further affected by climatic changes (e.g., sea level rise [
10]) and tropical cyclones, with storms causing the greatest mortality [
11]. Intact mangroves are increasingly threatened by tropical cyclones (“hurricanes” in the North Atlantic and North Pacific; “typhoons” in the Northwest Pacific) due to climate change, which could cause widespread mortality [
8] and eliminate vital ecosystem services.
Mangroves are low- and mid-latitude ecosystems; thus, hurricanes and tropical storms are common disturbances [
12,
13] and have been prevalent in these communities for centuries [
14]. The structure (shallow root system) and position (coastal, low lying) of mangroves makes them highly vulnerable to high-energy storms [
12,
13]. During high-intensity storm events, mangrove trees can be uprooted, severely defoliated, and suffer damage to their bark and limbs [
15,
16,
17]. Hurricanes can even cause sudden mass tree mortality from these direct impacts, as well as delayed mortality [
18] from indirect impacts such as flooding and siltation [
17]. Extra sediment from storm surges and standing water from heavy rainfall can suffocate mangroves through inhibition of gas exchange [
16,
17].
Climate change, and a warmer, wetter atmosphere in particular, is increasing the frequency of high-intensity storms [
19]. With these stronger storms comes greater risk of direct destruction of mangroves (e.g., physical damage) as well indirect damage (e.g., increased rainfall leading to flooding mortality), which may be the most devastating impacts of future storms [
20]. Future hurricane events may pose more of a threat to the remaining mangrove ecosystems than gradual climate changes [
15].
Studies of mangroves over space and time, including their productivity, have used remote sensing techniques for over half a century [
21]. Recently, remote sensing has been used to assess the impact of hurricane events on mangrove populations (e.g., [
22,
23,
24,
25]), primarily utilizing LiDAR [
26], Landsat [
22,
24,
27], and MODIS data [
3,
23,
25]. MODIS-derived analysis has become the first choice for mapping on a country level, as it provides a long data record (2000–present) for understanding changes over time and has high temporal frequency [
25]. Although MODIS is useful at a regional scale, these data (250–500 m pixels) do not match the scale of information needed by local communities or decision makers for assessment of damage. Landsat products (30 m pixels) provide a finer spatial resolution but may lack the continuity of coverage over time or relevant overpass frequency for punctuating events like hurricanes. New sensors with higher spatial resolution and temporal cover have the potential to address the need for damage detection and mapping relevant at local scales, such as the European Space Agency’s recently launched Sentinel-2 MultiSpectral Instrument (2015–present, 10 m resolution). Sentinel-2 has rapidly been adopted for spatiotemporal analysis of mangroves and hurricane damage [
28,
29,
30]. New high-resolution imagery (i.e., Planet) aids in the interpretation and rapid evaluation of remote mangrove complexes that have limited field-based access [
31].
The 2017 North Atlantic hurricane season exemplified increased storm intensities, tying the record for the most storms reaching hurricane strength [
19]. We focused on Hurricane Irma, a Category 5 storm that made landfall on the northern coast of Cuba, where there were large coastal mangrove complexes [
32]. Irma was the first Category 5 to make landfall in 93 years within the Cuban archipelago. At landfall, Irma was ~550 km in diameter and was over the area from 8 September 2017 to early 10 September 2017 [
33]. The region experienced coastal flooding, storm surges, and high winds [
33]. As the storm tracked along the coast and keys, winds were sustained at 157 km/h (85 kt), with gusts up to 226 km/h (122 kt) [
33]. Additional damage was caused by heavy rainfall across the archipelago [
33]. The eye of Irma passed directly over the Buena Vista Reserve (UNESCO Biosphere Reserve, Ramsar Wetland of International Importance), which includes Caguanes National Park (CNP). Due to limited resources, CNP managers were unable to fully assess the extent and severity of damage to the Park’s ecosystems and requested our assistance (personal comm. N.H. López, March 2018).
The ecological damage of Hurricane Irma was extensive, as witnessed first-hand by this team, but has not previously been adequately documented in the literature in terms of the spatial extent, severity, and temporal patterns. Here, we quantify the short-term (years) damages of a high-intensity storm to a mangrove ecosystem while testing new methods to provide rapid evaluation and locally relevant scale information. We apply our new method, Hurricane Disturbance Vegetation Anomaly (HDVA), which utilizes historical phenology represented by the Enhanced Vegetation Index (EVI) to normalize the magnitude of hurricane disturbances on land cover, or the so-called anomaly (HDVA ≥ 1 when there is no damage and is less than one when damages occur). Land covers such as forests or mangroves have some interannual variations (EVI ±5–10%); however, large variations may suggest more extreme impacts to the ecosystems, including mortality. We compared analyses with Sentinel-2 and MODIS-derived damage detection (e.g., [
25]). We addressed the following questions: (1) What is the potential for detection of mangrove damage and damage severity with Sentinel-2 data? (2) How do the analysis process and information vary when MODIS and Sentinel-2 data are compared? (3) What is the extent and duration of ecological disturbance of Cuban mangroves from Hurricane Irma, particularly in Caguanes National Park?
2. Materials and Methods
We developed and tested a pixel-based change detection method that compared post-storm vegetation cover with the mean in the historical data record prior to the storm. We also analyzed several years of post-hurricane phenology to assess recovery. Vegetation cover was assessed using the Enhanced Vegetation Index (EVI) during the dry-season, as this period is relatively (1) cloud-free, (2) stable in phenology, and (3) consistent year to year. We assessed a new metric, the Hurricane Damage Vegetation Anomaly, as the change in EVI post-storm relative to the historical observations. MODIS provides a long period of historical observations for assessing forest disturbance [
25], whereas Sentinel-2 had only a 2-year period of record prior to Hurricane Irma. All mangroves, as well as other land covers and land uses, were previously identified for Cuba [
32], which we used within our study area (
Figure 1).
2.1. Study Area and Context
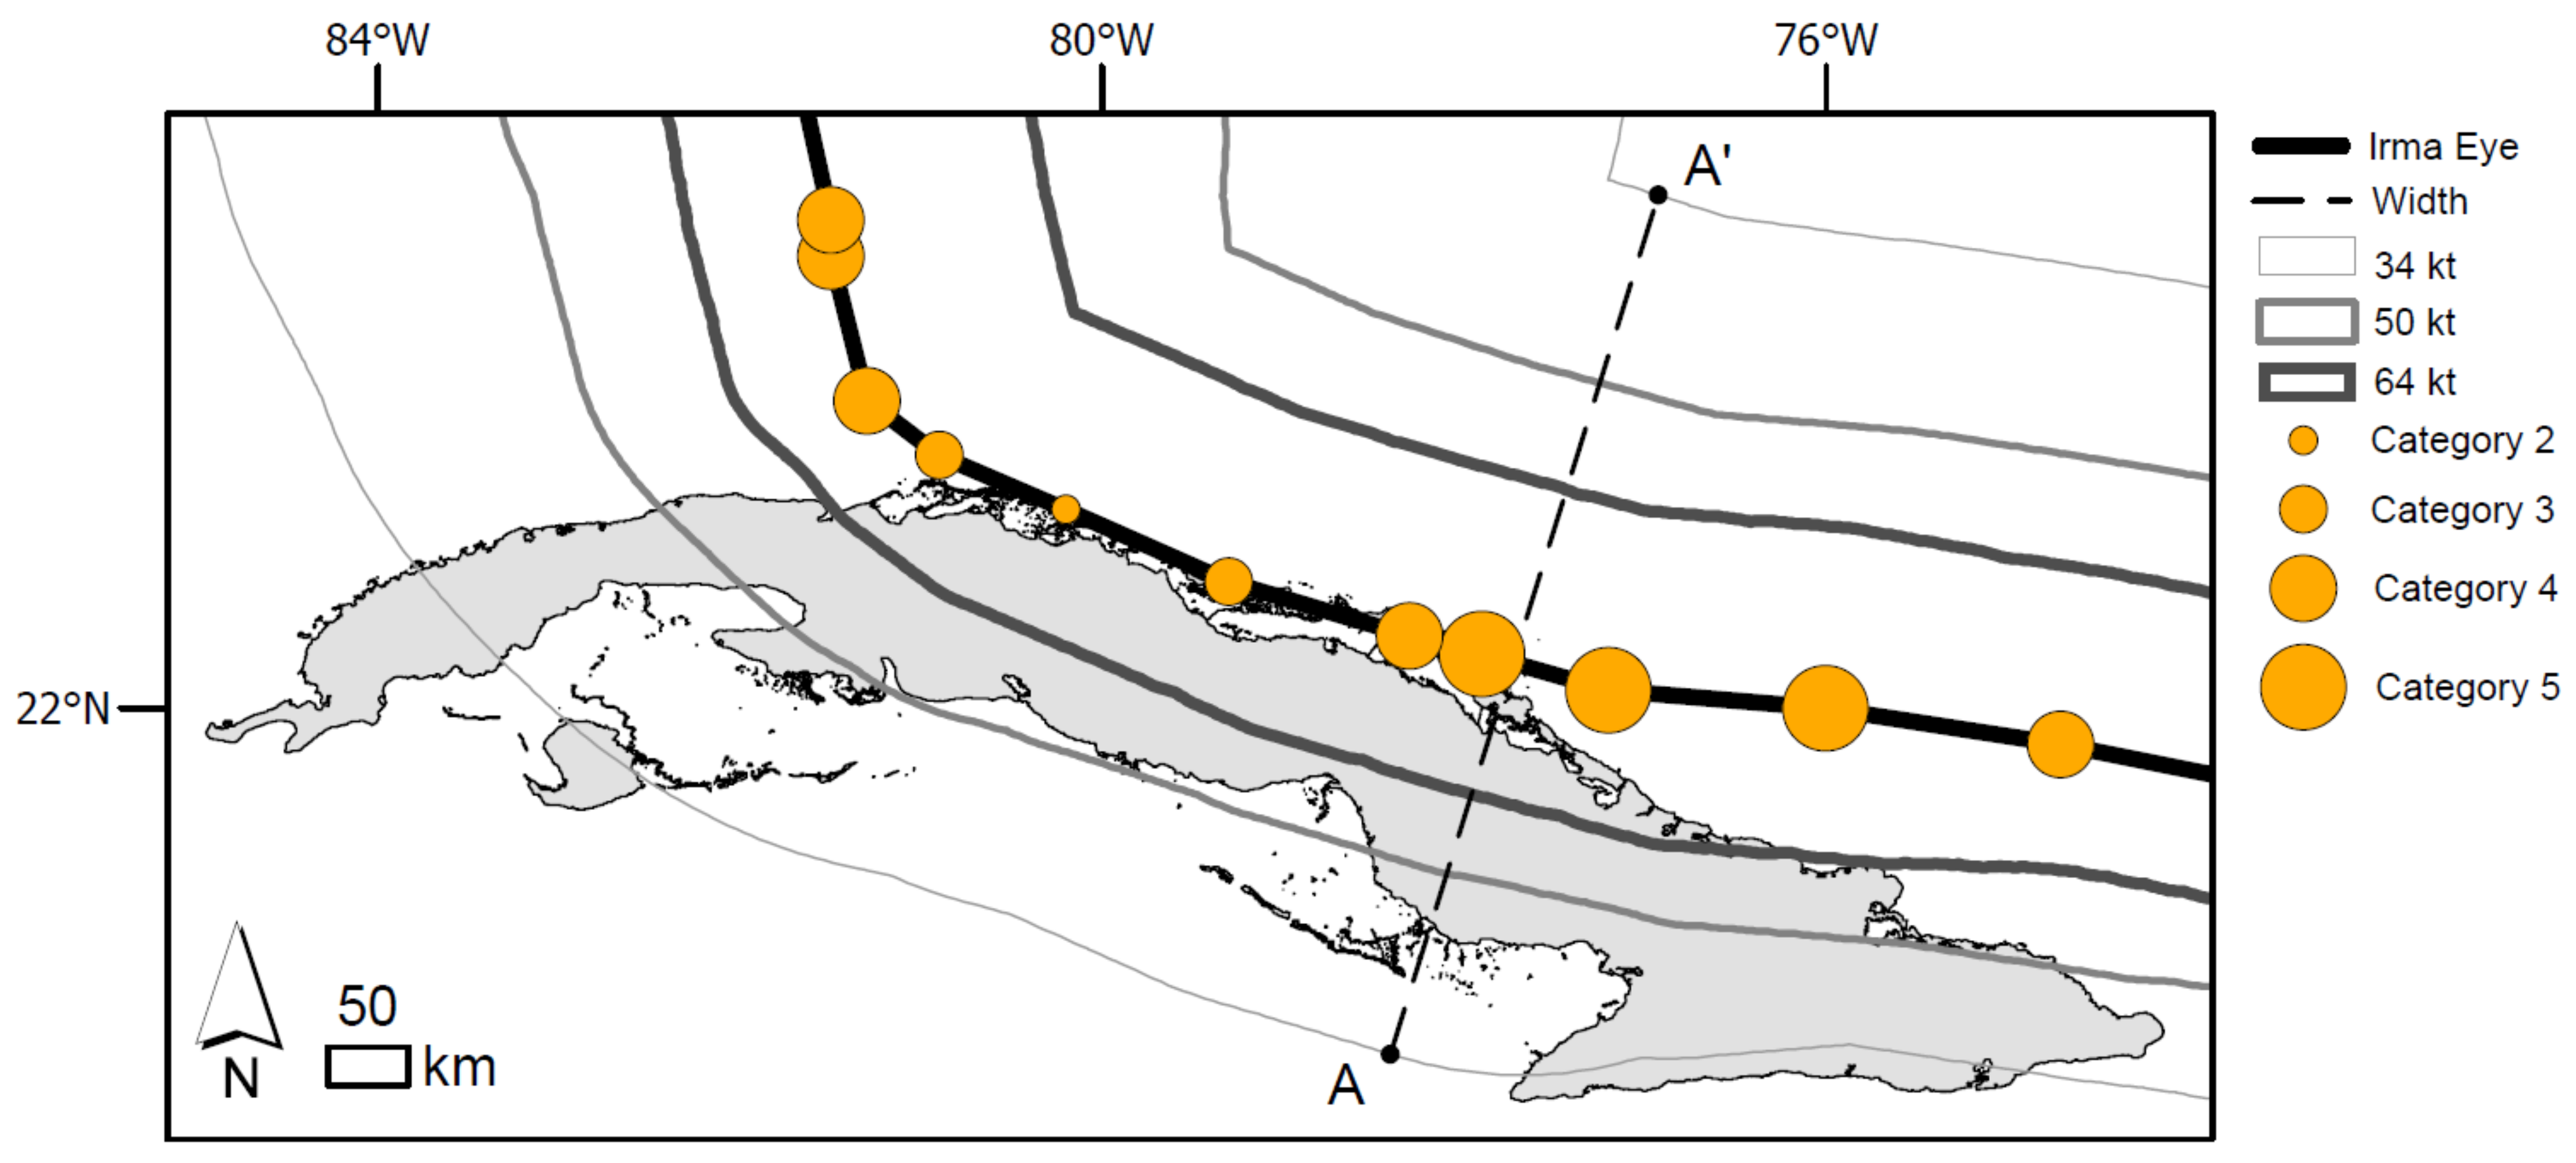
Hurricane Irma hit the northern coast of Cuba as a Category 5 Storm on 9 September 2017 (
Figure 2; [
33]). The eye of the hurricane swept along the Cuban keys, and as it did, it weakened to a Category 4 storm after a few hours, then down to a Category 2 before it headed north on 10 September [
33]. As it paralleled the coast for ~400 km, the eye of the storm was ~30 km from the mainland, and the storm was nearly 550 km wide, measured perpendicular to the storm track at its greatest intensity (
Figure 2, A to A’), spanning many ecologically important areas (
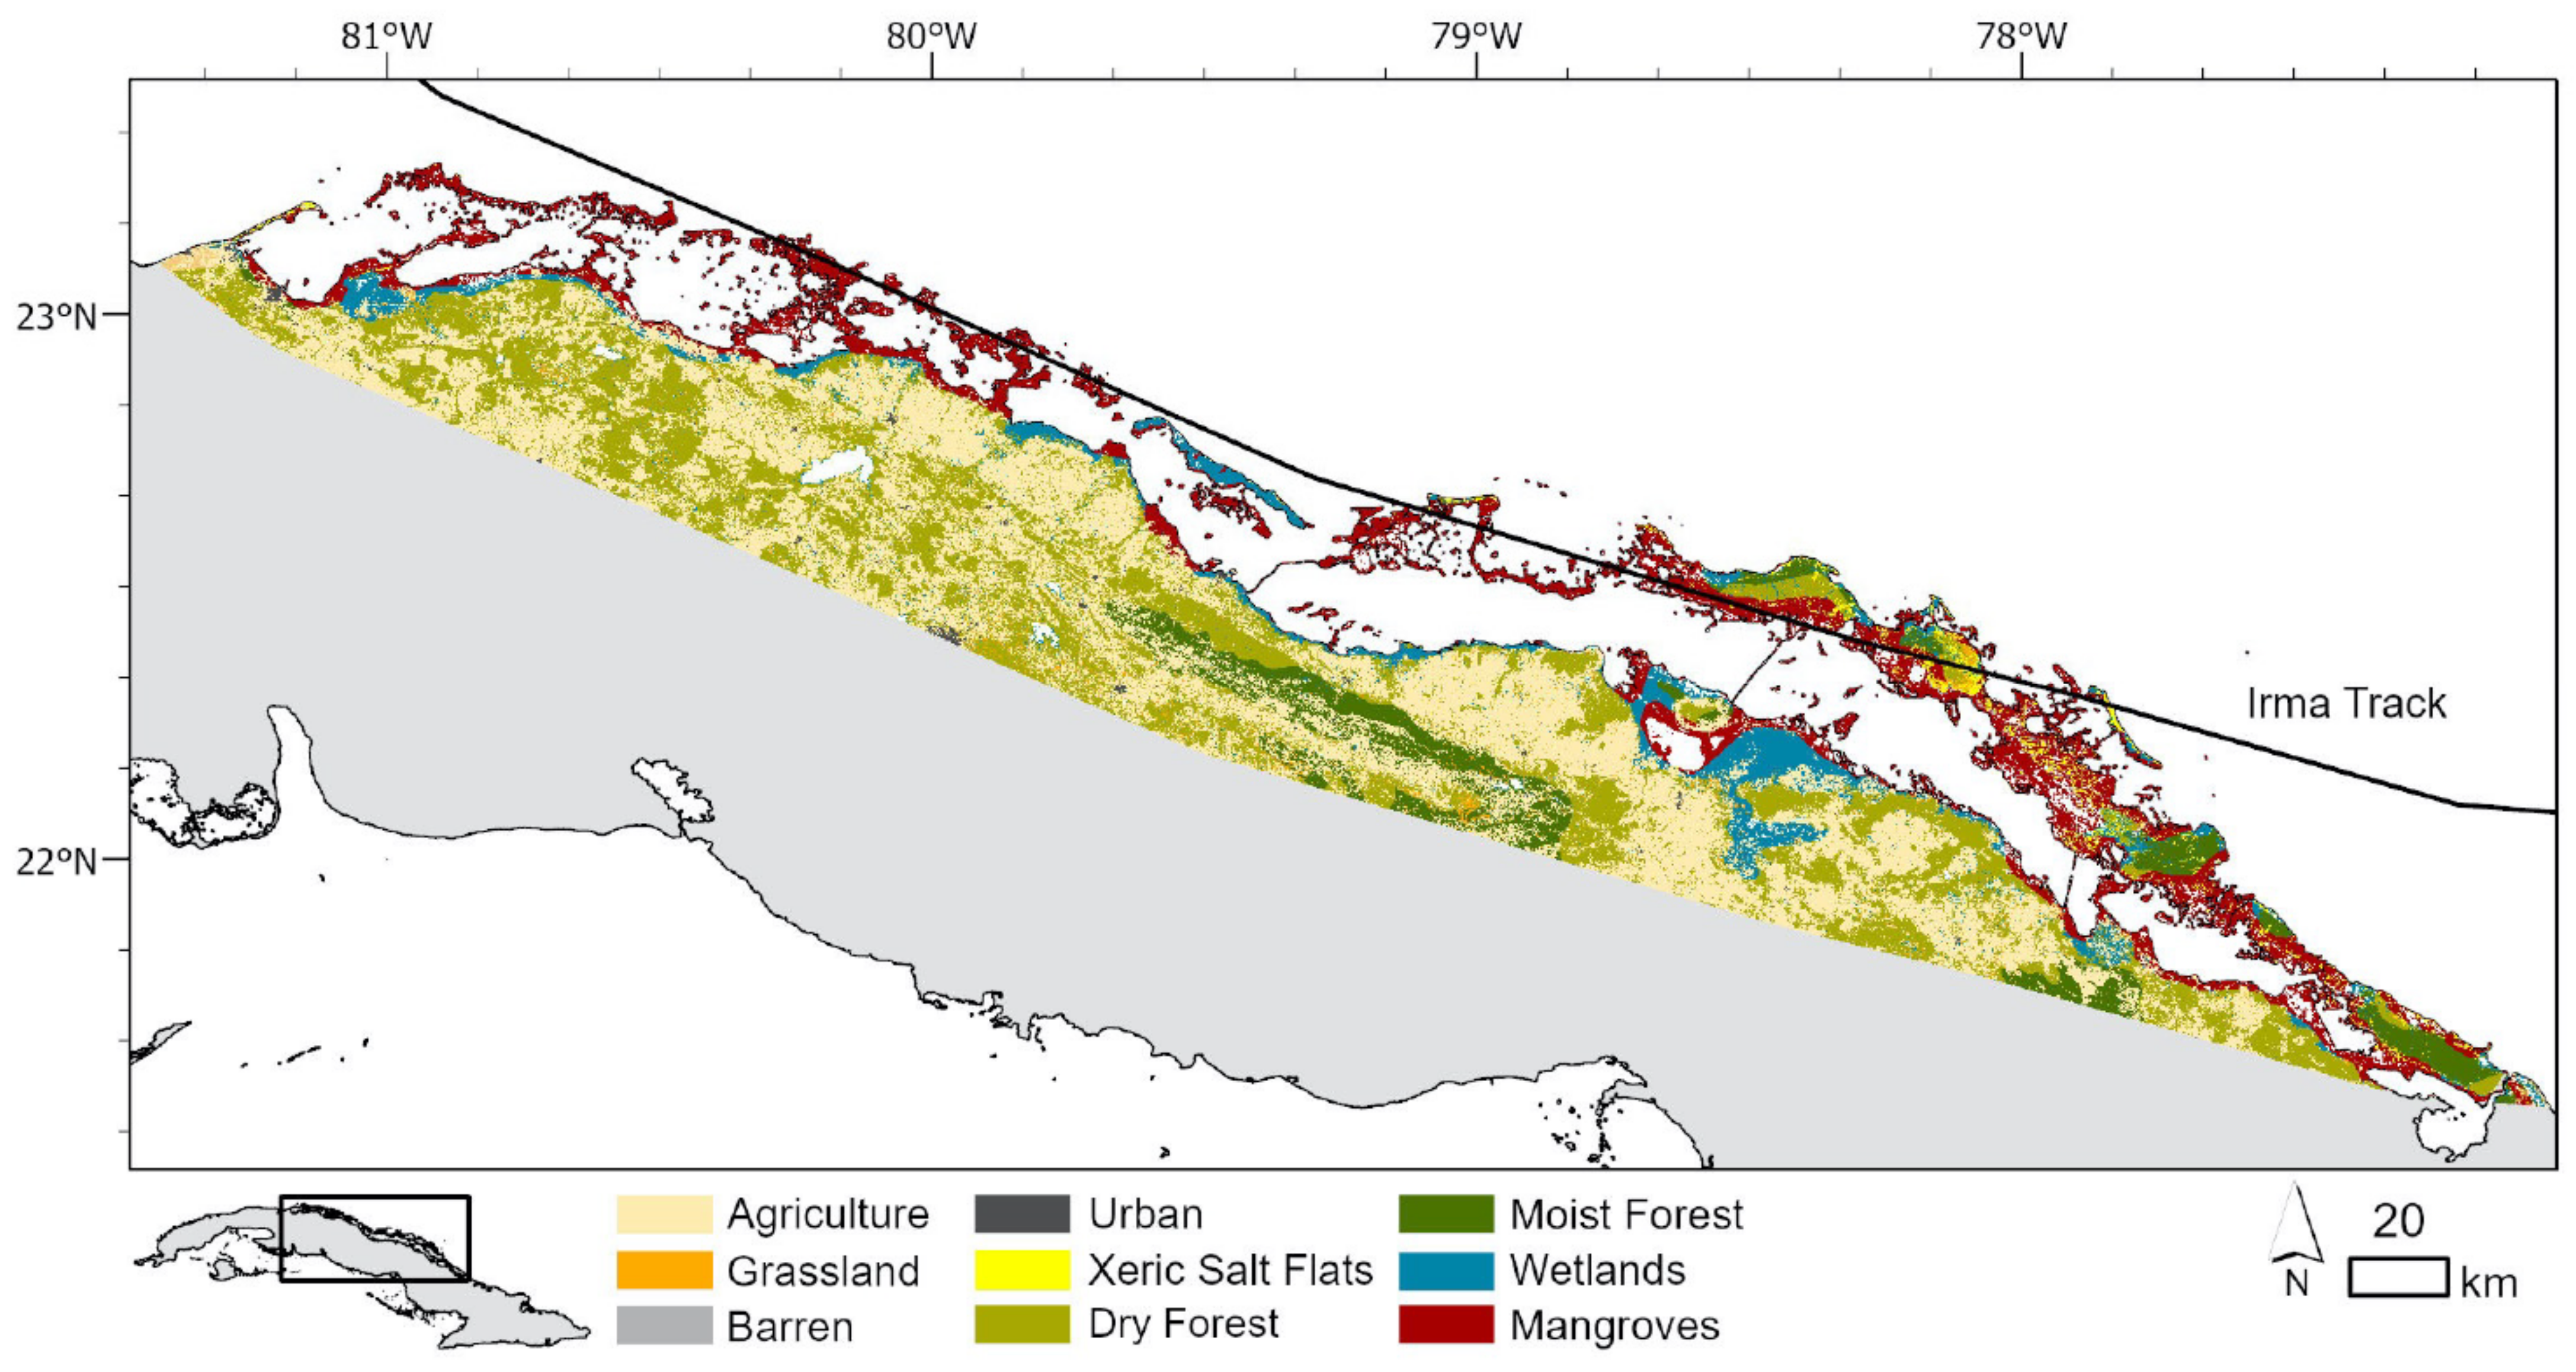
Figure 3). Severe damage to vegetation on the Cuban keys and coastline, specifically the mangrove populations, was clear upon visual inspection of high-resolution images (Planet) before and after the hurricane. Most of the damage was within 50 km of the eye of the storm; thus, we defined the study area with a 60 km buffer from the eye of the storm. The total study area (land area, excluding ocean) was 1,700,390 ha (ArcGIS calculation of study area polygon), although MODIS and Sentinel-2 estimates varied due to their spatial resolution (MODIS: 1,757,981 ha; Sentinel-2: 1,710,779 ha). The study area is comprised of many land uses and land covers: agriculture, dry forests, mangroves and wetlands, moist forest, and a minor presence of xeric salt flats, barren, and urban areas [
32]. Mangrove and wetlands comprised over 260,000 ha (MODIS: 288,931 ha; Sentinel-2: 264,258 ha).
Previous storm paths that were <200 km from the study area include Ike (2008, Category 1 at closest proximity to the study area), Ernesto (2006, Tropical Storm), Rita (2005, Tropical Storm), Dennis (2005; storm track more than ~200 km to the NW but a Category 4 storm), Michelle (2001; entered NW corner of study area at Category 4, de-intensifying to Category 1), and Georges (1998; Category 1 with a similar path as Irma). Note that Georges was prior to the period of record for the MODIS data used here but might have affected vegetation in the early 2000s. The authors recall Hurricane Kate passing through the region in 1985 (Category 2); however, although the eye of the storm passed through the south end of CNP, the ecological damage was not extensive. One author’s grandfather spoke of the devastation of the mangroves from the 1933 storm, which is noted as Category 3 in our study region, passing 60 km north of CNP (Major Hurricane 1933234N13335 in the IBTrACS database [
34]).
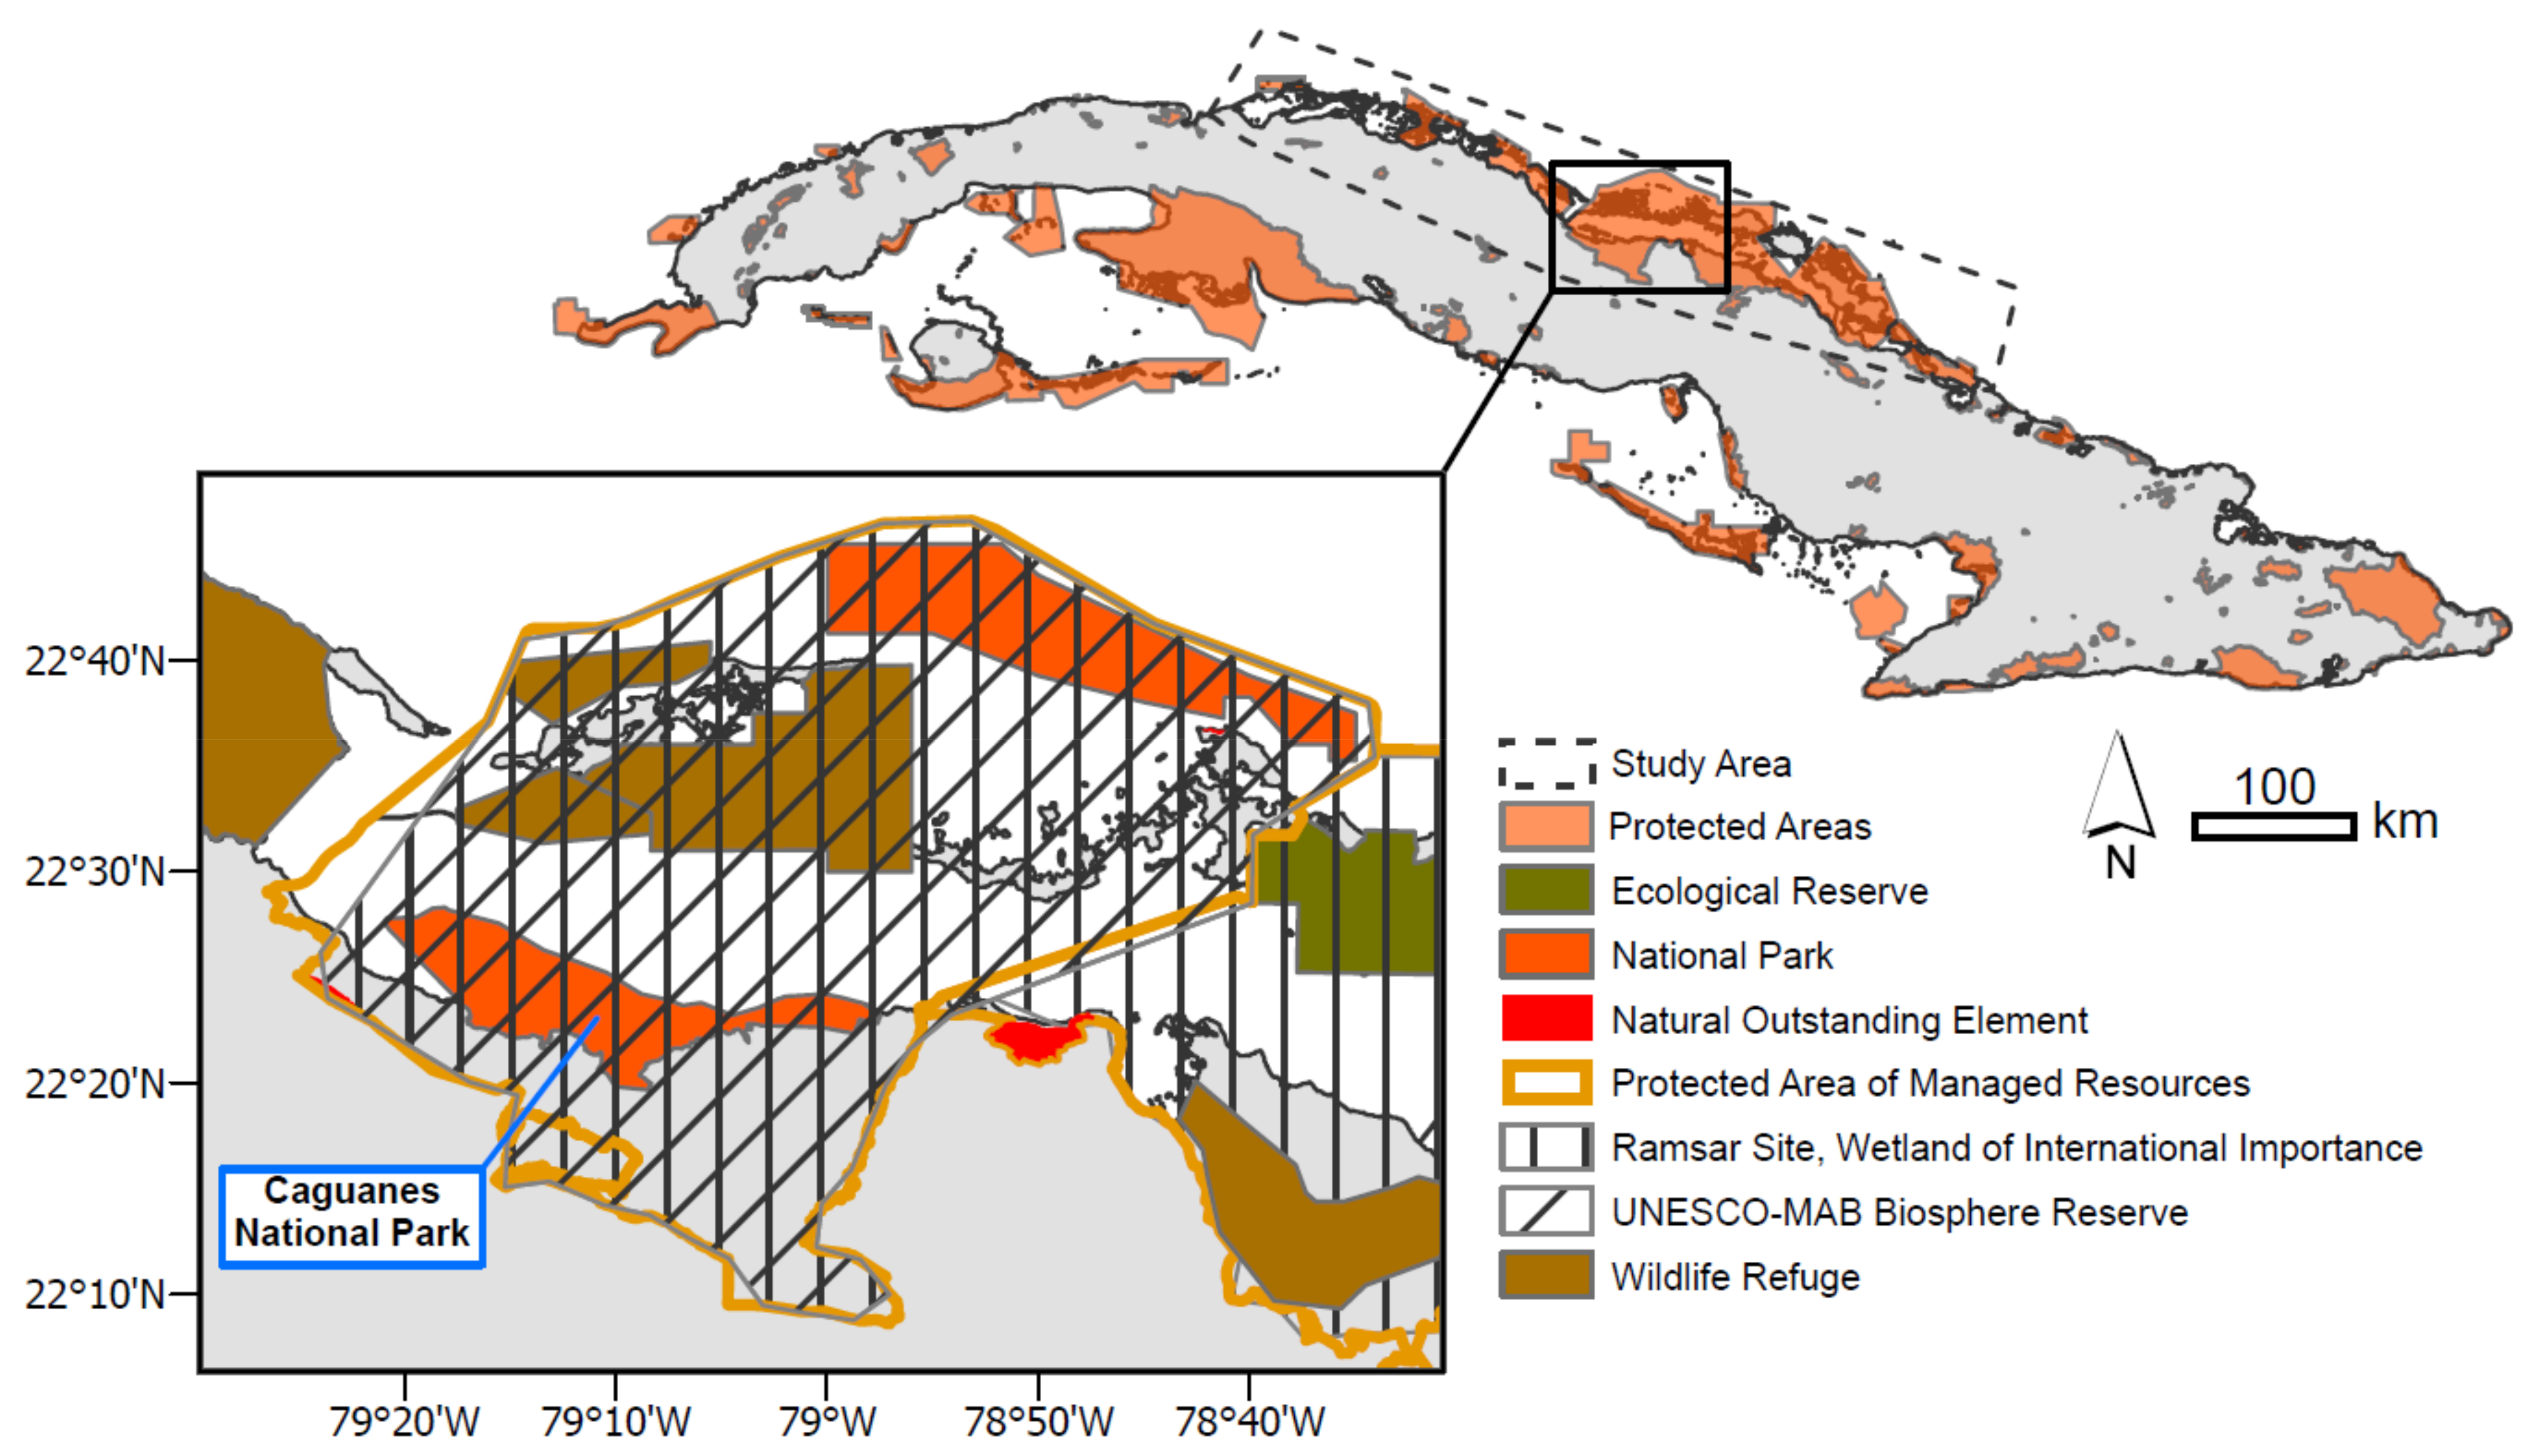
Caguanes National Park (CNP) experienced intensive ecological damage from Hurricane Irma. Our team visited CNP in March 2018. We used this as a case study area to train ourselves on visual image interpretation for the broader study area due to our familiarity with the disturbances from Hurricane Irma as well as requests from the CNP staff to assist in assessing the damages. Due to limited resources and infrastructure, a complete census of the ecological damage could not be conducted in CNP. We developed remote sensing methods to assess hurricane damage at 10 m resolution, a scale relevant to CNP managers and stakeholders. CNP is an area of high importance to Cuba. In addition to being classified as a National Park, it is also a Protected Area of Managed Resources, a Ramsar site (Wetland of International Importance), and a UNESCO-MAB Biosphere Reserve (a site that aims to merge social systems based on research, tourism, education, and settlement with the protection and conservation of species and ecosystems [
35]).
Figure 3 shows the multiple protected areas encompassing CNP and the study area along the northern coast where the hurricane hit.
Figure 3.
Protected areas in Cuba and Caguanes National Park (CNP) [inset] [
36], with the broader study area (60 km buffer from eye of Hurricane Irma) shown within dashed line.
Figure 3.
Protected areas in Cuba and Caguanes National Park (CNP) [inset] [
36], with the broader study area (60 km buffer from eye of Hurricane Irma) shown within dashed line.
These protected areas exist to safeguard the natural elements of this region (
Figure 3). A feature of the study site is a large area of relatively undisturbed mangroves, at least, prior to Hurricane Irma. Mangroves are brackish ecosystems with four species (roughly, from coastline proceeding inland): (1)
Rhizohora mangle I (L.) (red mangrove), closest to the ocean, with roots perpetually inundated with salt water; (2)
Avicennia germinans (L.) (black mangrove); (3)
Laguncularia racemose (L.) C.F. Gaertn (white mangrove), found at higher elevations; and (4)
Conocarpus erectus (L.) (buttonwood) [
32]. While the focus of this study was mangroves, we also considered Cuban moist and dry forests. Small farms in the region include grasslands for pasture grazing and small-scale croplands, although historically the region had extensive, large-scale sugarcane production involving large water diversions and canals. The upland areas in the study area are largely karstic topography. These upland characteristics can have a strong effect on coastal freshwater hydrology, such as the delivery of agricultural pollutants, factory biproducts, and freshwater flow paths. The semi-deciduous dry forests predominate on limestone geology with little soil substrate, losing their leaves during the dry season.
The nested design of study sites and data sets included analysis of high-resolution images for CNP (See
Section 2.2) and temporal, moderate-resolution images (MODIS and Sentinel; see
Section 2.3; study area shown in
Figure 3). The data scenes and tiles used in this study are described in
Table 1.
2.2. High-Resolution Images
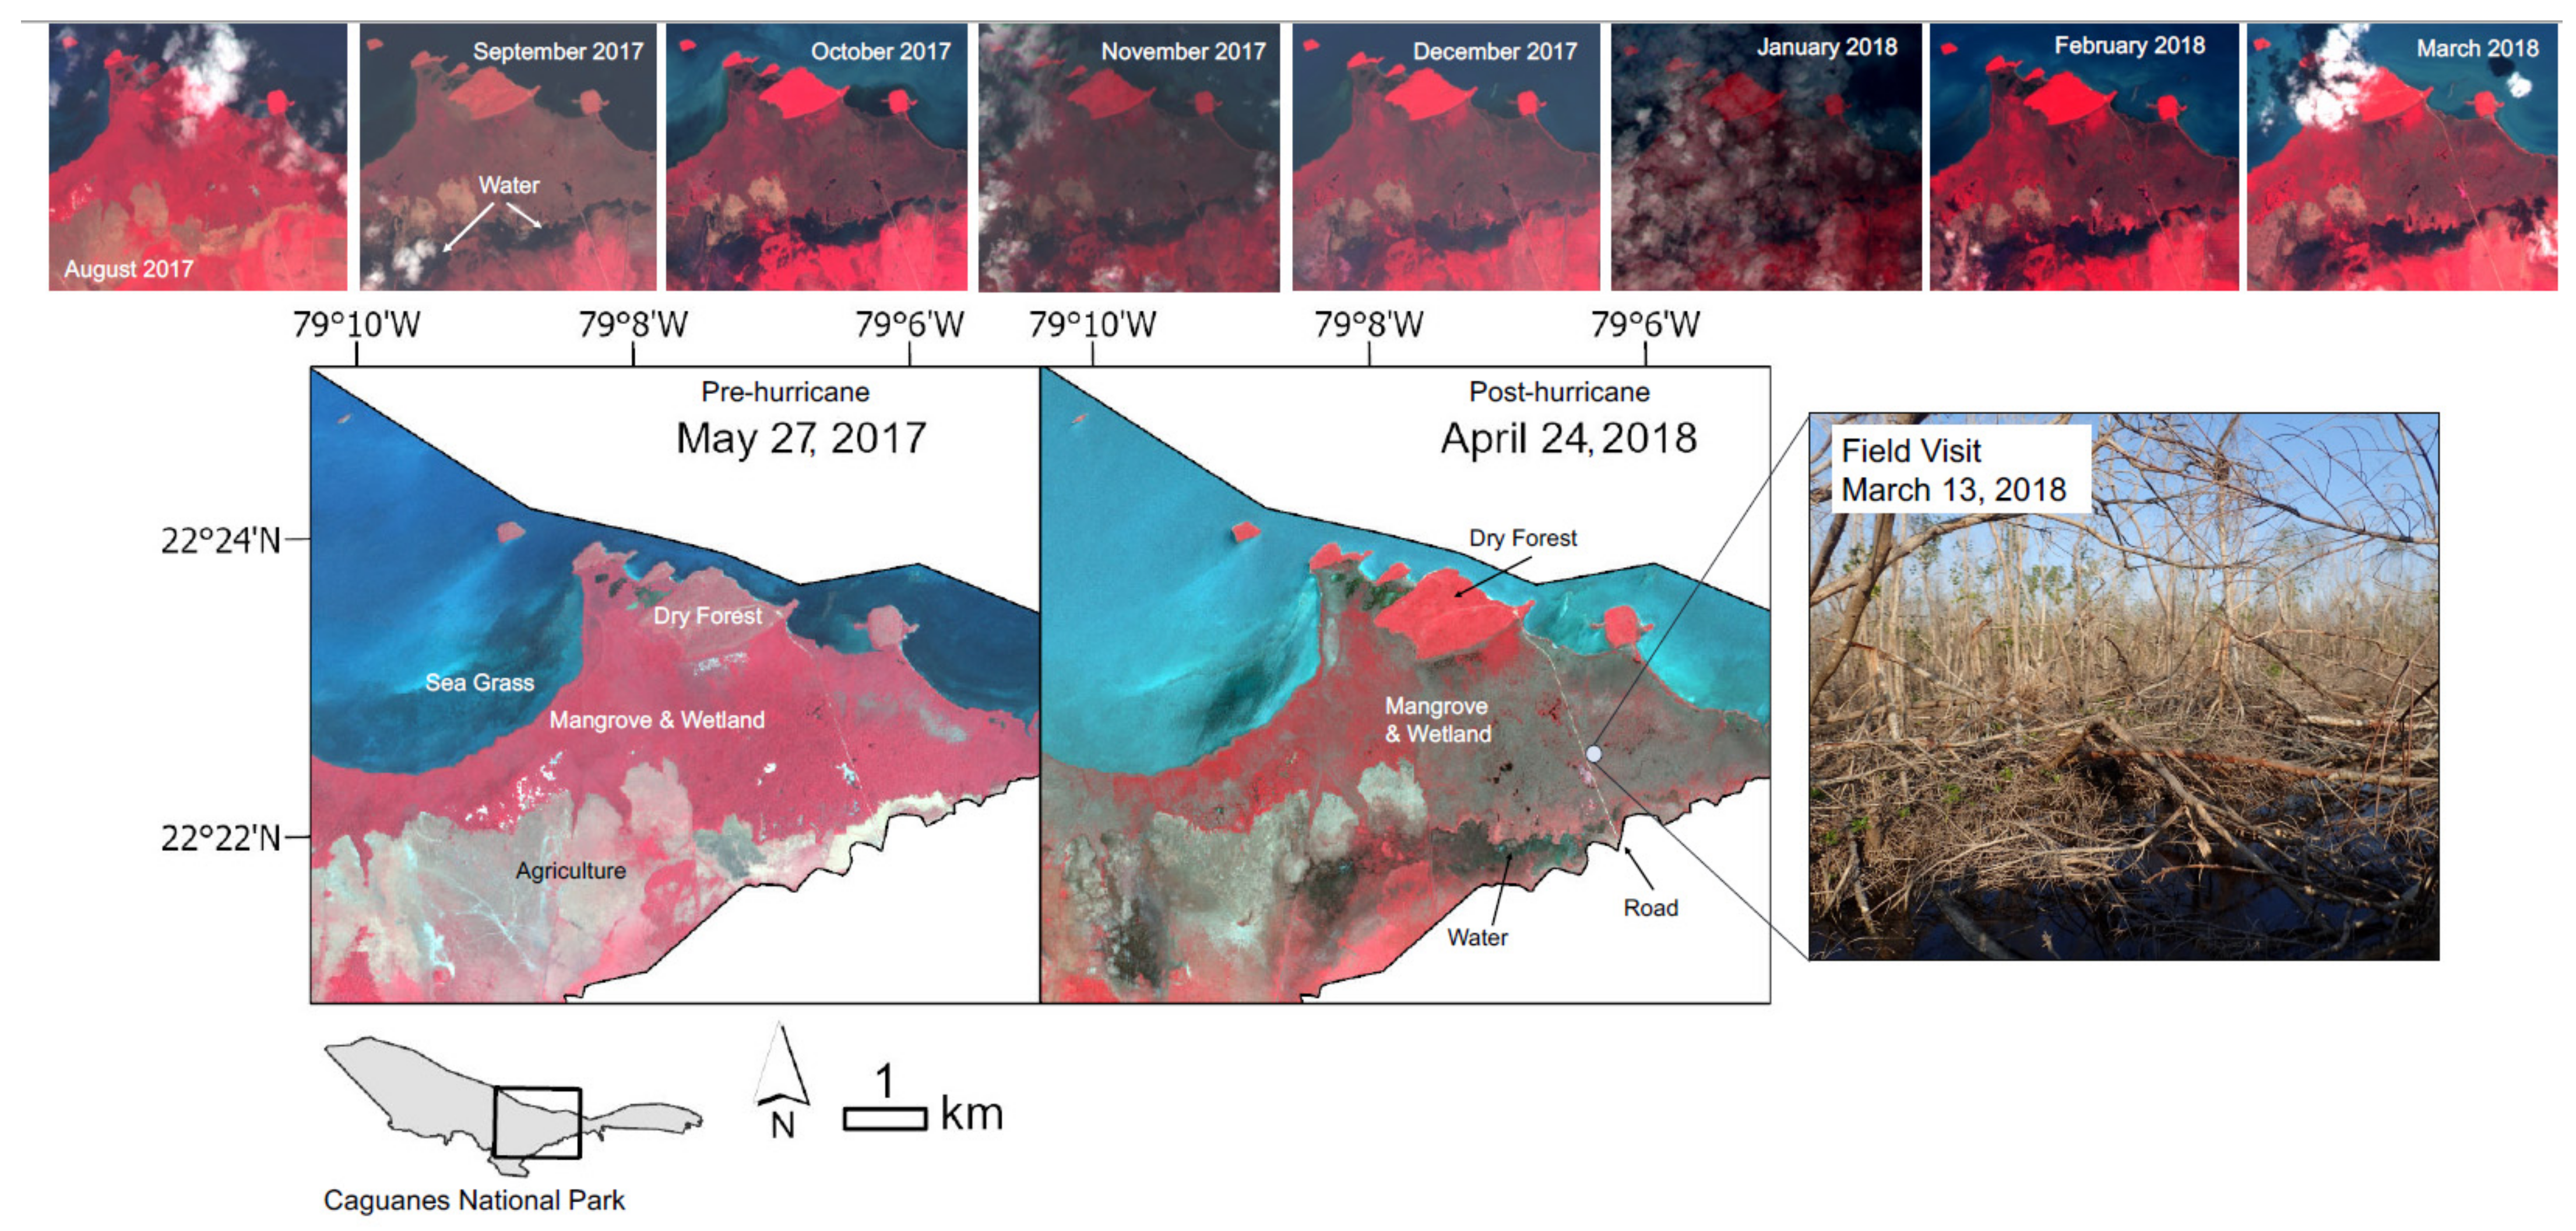
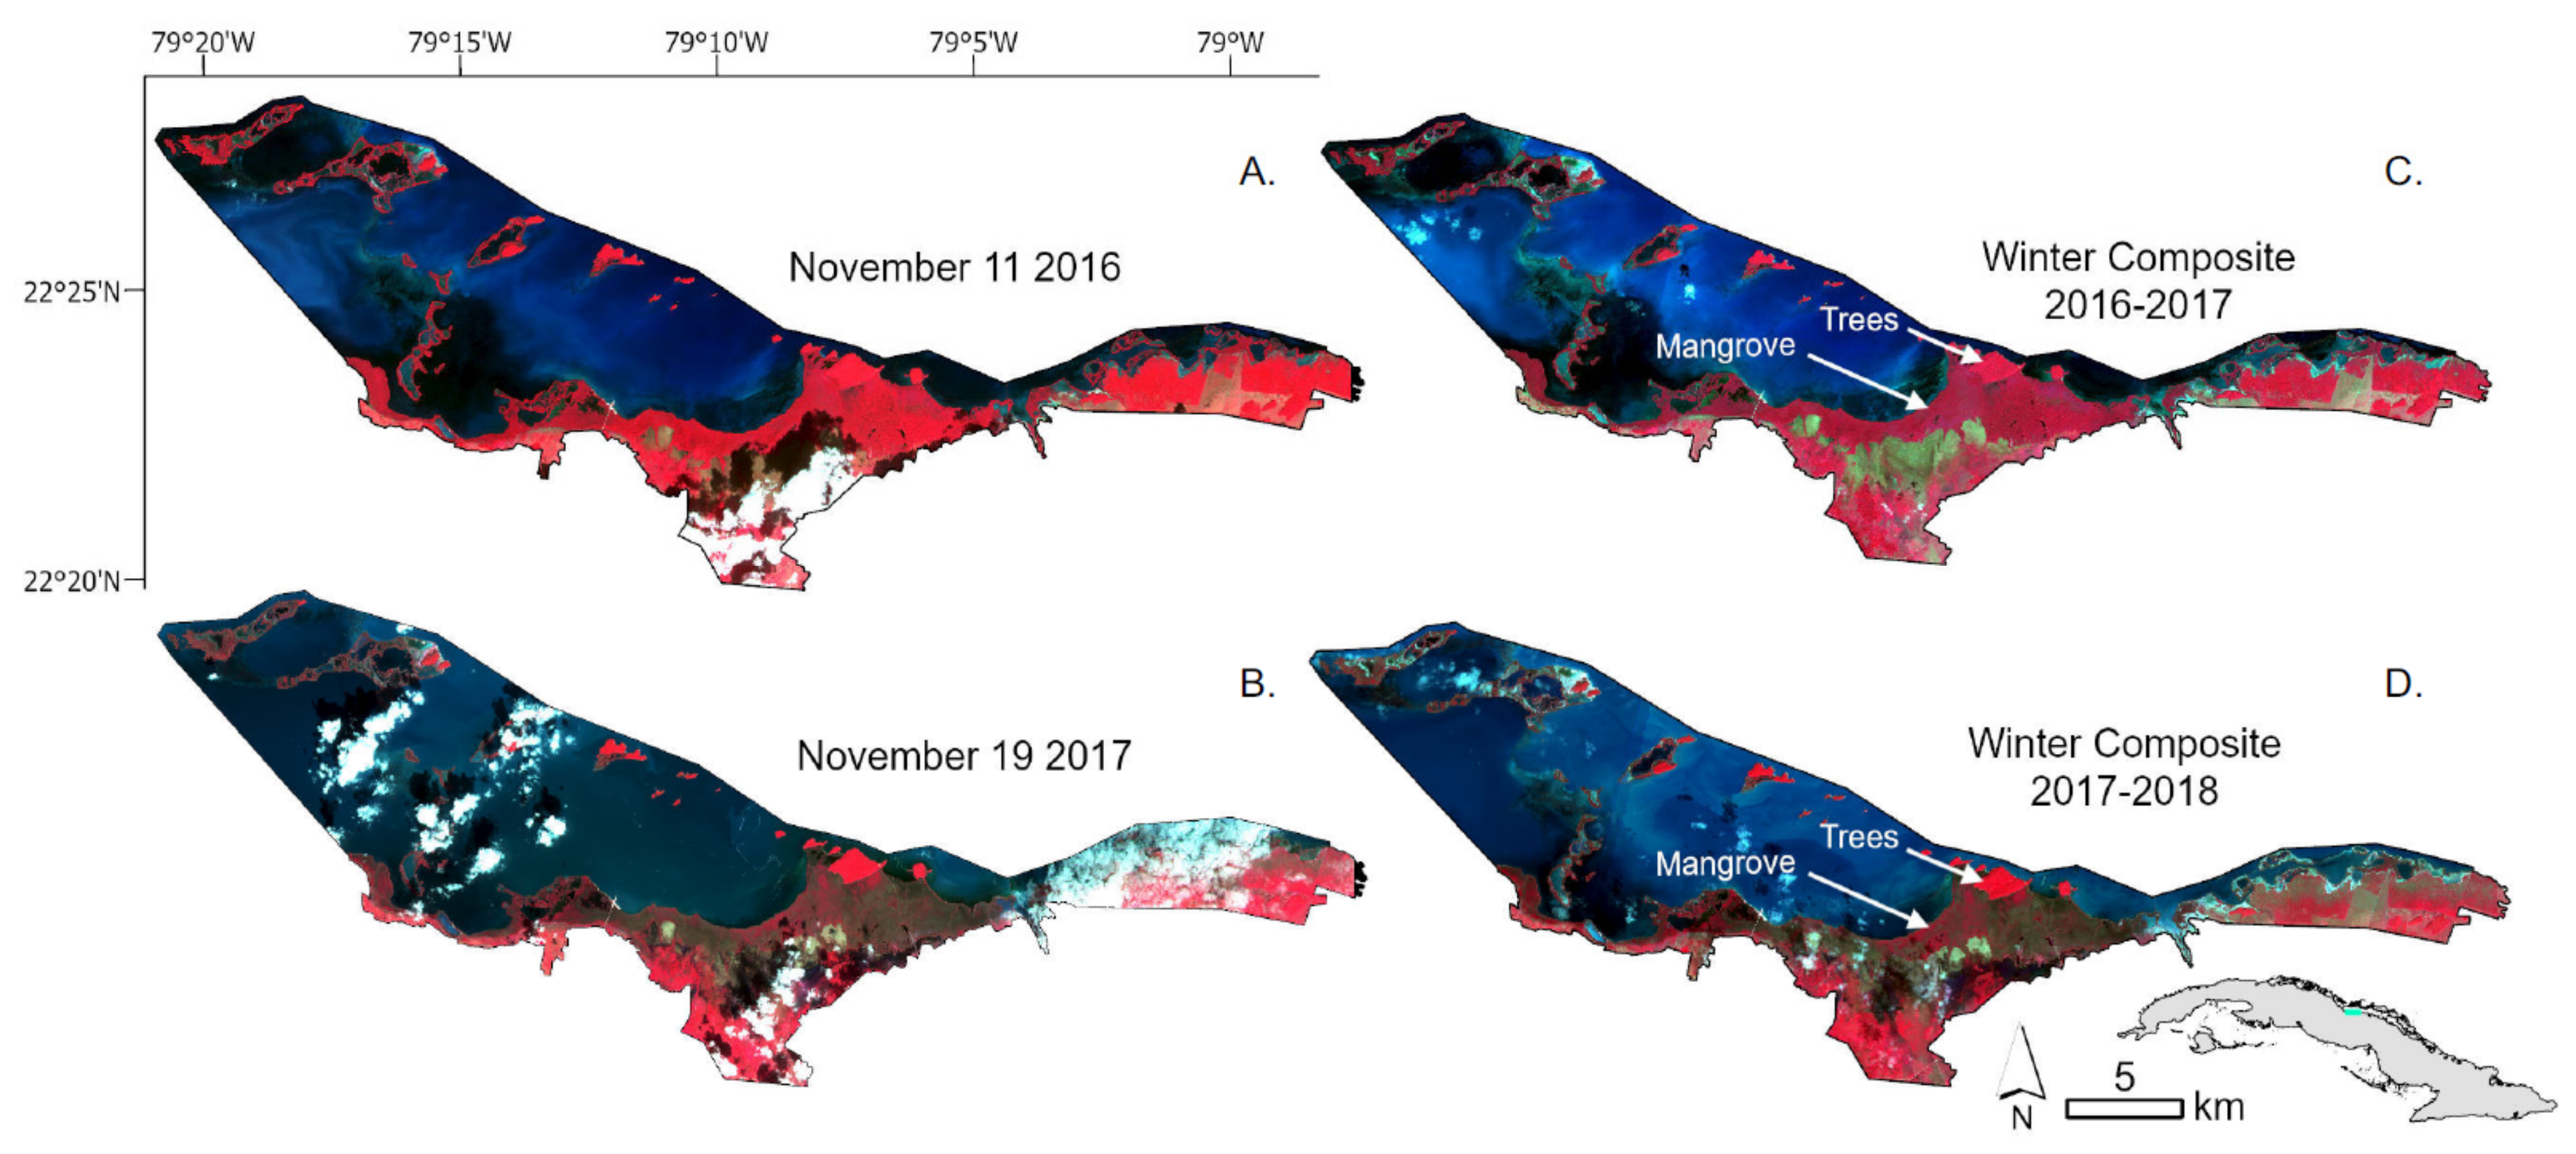
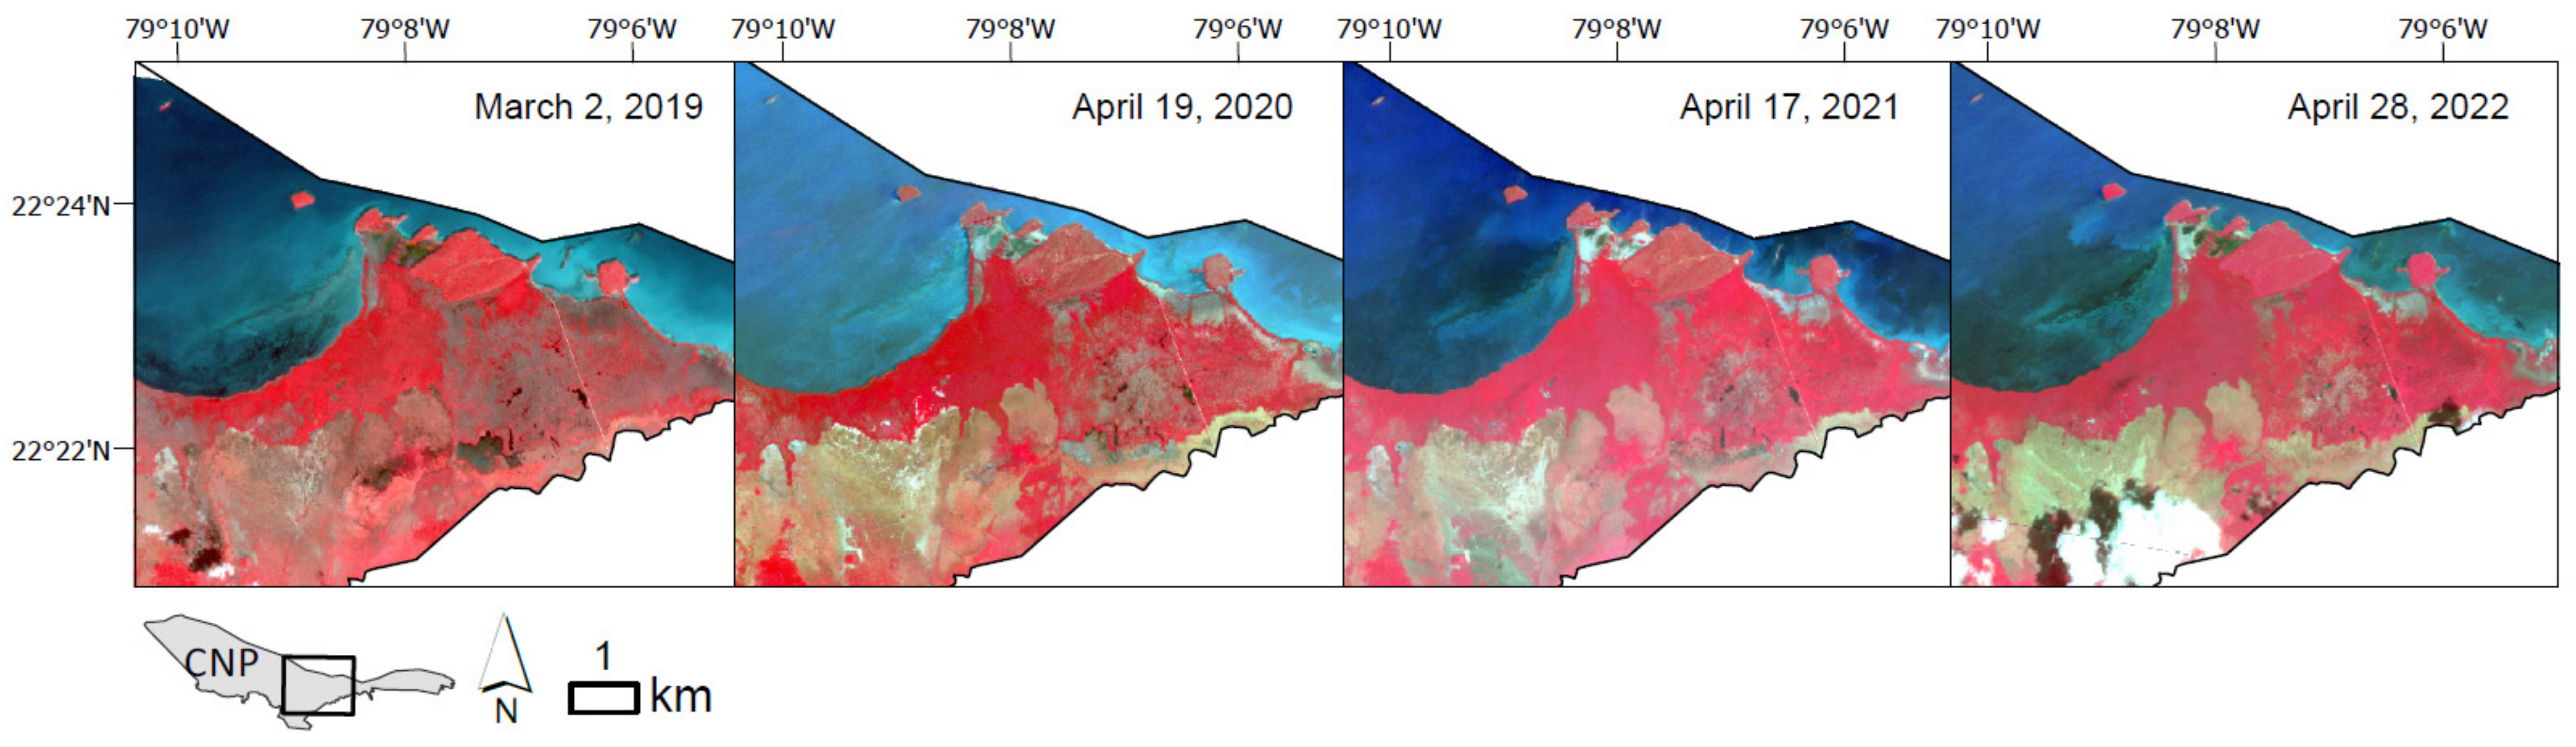
We obtained Planet microsatellite images (Planetscope and Rapid Eye; <5 m pixels) for April and May 2017, as this timeframe allowed for cloud-free views of CNP prior to Hurricane Irma. After Hurricane Irma, cloud-free microsatellite images were found for March through May 2018 for CNP, as well as subsequently in 2019, 2020, 2021, and 2022. Planet provided these images through their Education and Research Program for limited, non-commercial access to the Planetscope Imagery and Rapid Eye Archive. These images were used to interpret potential changes in land cover to inform analysis and interpretation of MODIS and Sentinel-2 (
Table 1). Additionally, monthly pixel-based reflectance composites of Sentinel-2 were used to visually assess the duration of freshwater inundation in CNP, changes in green vegetation, and recovery trajectories over the first 8 months post-hurricane. Monthly pixel-based composites were needed to ensure a cloud-free, or nearly cloud-free, look at CNP.
2.3. Data Processing of Spatiotemporal Data
Studies in tropical areas are hampered by cloud cover or cloud contamination at the time of satellite overpass (e.g., midday), and our study area is no exception. We focused on the dry season (1 November to 21 March) to minimize clouds and atmospheric moisture as well as reduce missing data due to persistent cloud cover of the rainy season. This period has relatively stable phenology and strong contrast in vegetation indices between land covers (e.g., forest, grassland).
To create pixel-based image composites, we built a workflow in the Google Earth Engine Code Editor API (GEE) [
37] based on our previous pixel-based compositing methods for input to land use classification [
32]. The GEE allows access to an extensive public data catalogue and to cloud-based computing power [
37]. Conceptually, the same approach was used for MODIS and Sentinel-2 image processing, where our algorithm selects the best quality observations by pixel during the dry season for a given year to create a seasonal mean EVI. All good observations were retained and then were transformed as described below. The resulting imagery was the input for MODIS and Sentinel-2 analyses described below.
We utilize the Enhanced Vegetation Index (EVI,
Table 2) to represent vegetation. The EVI includes the blue band to remove residual atmospheric contamination, such as from smoke or thin clouds [
38], and has been shown to have a greater dynamic range and sensitivity than other vegetation indices [
38,
39]. We utilized the Enhanced Vegetation Index (EVI) from the MODIS Terra Vegetation Indices 16-Day Global data set (250 m, MOD13Q1 v. 006, [
38]) (
Table 2). The MODIS composite algorithm selects the best available pixel from all acquisitions (2–3 day repeat overpass) during the 16-day period, filtering for low clouds, low view angle, and greatest EVI value. After selecting dry season observations from MOD13Q1 EVI, each pixel’s annual dry season mean EVI was calculated for each year of the historical period (2000–2017) and for the post-hurricane period (2017–2018). These EVI metrics were input to the damage detection algorithms discussed below.
The Sentinel-2 (10 m, Copernicus Sentinel-2 MSI: MultiSpectral Instrument, Level-1C processed by the European Space Agency) data archive begins in 2015, a substantially shorter historical reference period (2015–2017) with regard to Hurricane Irma. We utilized the Sentinel-2 Quality Assurance information to mask cloud and cirrus cloud contamination (QA 60). If no cloud-free pixels existed, the best observation was selected based on quality assurance. After selecting good observations, Sentinel-2 EVI was derived following García-Llamas et al. [
40] for the annual dry season means (2017, 2018) and the historical dry season mean (2015–2017).
Table 2.
Enhanced Vegetation Index (EVI) formulas by sensor, where
is atmospherically corrected or partially atmospherically corrected surface reflectance [
41]; EVI metrics (disturbance, reference) calculated after quality assurance filtering.
Table 2.
Enhanced Vegetation Index (EVI) formulas by sensor, where
is atmospherically corrected or partially atmospherically corrected surface reflectance [
41]; EVI metrics (disturbance, reference) calculated after quality assurance filtering.
| | MODIS | Sentinel-2 |
|---|
| EVI | | |
| EVI Disturbance | Dry Season Mean, 2017–2018 | Dry Season Mean, 2017–2018 |
| EVI Reference Period | Dry Season Mean, 2000–2017 | Dry Season Mean, 2015–2017 |
EVI can naturally vary over time due to disturbances such as storms. To determine whether the EVI observations after Hurricane Irma were significantly different than the reference period, a matched pairs t-test was run on a sample of 500 random points to determine whether there was a significant difference between the mean EVI value of a pixel for the reference period and the EVI value of the same pixel for the disturbance year. The test was run on both MODIS and Sentinel-2 outputs and run for the mangrove and wetlands as well as the dry forest land cover types. Points that only had a value in either the reference period or disturbance year and not in both (a few seen mainly around the northern islands, coastal pixels) were removed. The rasters of the mean EVI of the reference period and disturbance period were generated in Google Earth Engine using the methods described above. The points were generated in ArcGIS Pro, and all t-tests were run using JMP 17. Additionally, we utilized a z-score metric to evaluate whether the MODIS EVI disturbance period was significantly different from the MODIS EVI interannual variance during the reference period.
2.4. Hurricane Disturbance Vegetation Anomoly (HDVA)
We created the Hurricane Disturbance Vegetation Anomaly (HDVA) to assess the damage to vegetation cover (HDVA; Equation (1),
Table 2). Conceptually, the HDVA is a comparison of EVI after the storm (EVI disturbance mean; 1 November 2017 through 21 May 2018 for Hurricane Irma) relative to “normal” (EVI reference period mean; mean based on available historic data). The historical dry season mean was used as the reference period (
Table 2), and the disturbance mean was the dry season following Hurricane Irma (2017–2018). MODIS and Sentinel-2 have very different reference period lengths, so the utility of a reference period could be compared. For MODIS, the reference period included 2000 through 2017; Sentinel-2 was limited to two dry seasons (2015 through 2017) prior to Hurricane Irma. An advantage to using a reference period not immediately adjacent to the hurricane (e.g., days or weeks after landfall) is that it allows for analysis of potential persistent disturbances (e.g., slow mortality), rather than sudden changes that might rebound quickly (e.g., defoliation), persistent standing water (lowering EVI), or green flush with new leaves. Further, mangrove mortality can be delayed due to slow suffocation from flooding and might be better captured months after the storm [
16,
18].
HDVA represents the relative vegetation abundance assessed by EVI as a fraction compared with the historical reference period. The HDVA formulation is calculated by pixel, as given in Equation (1):
where
is the mean EVI value by pixel over the disturbance or preference period (
Table 2).
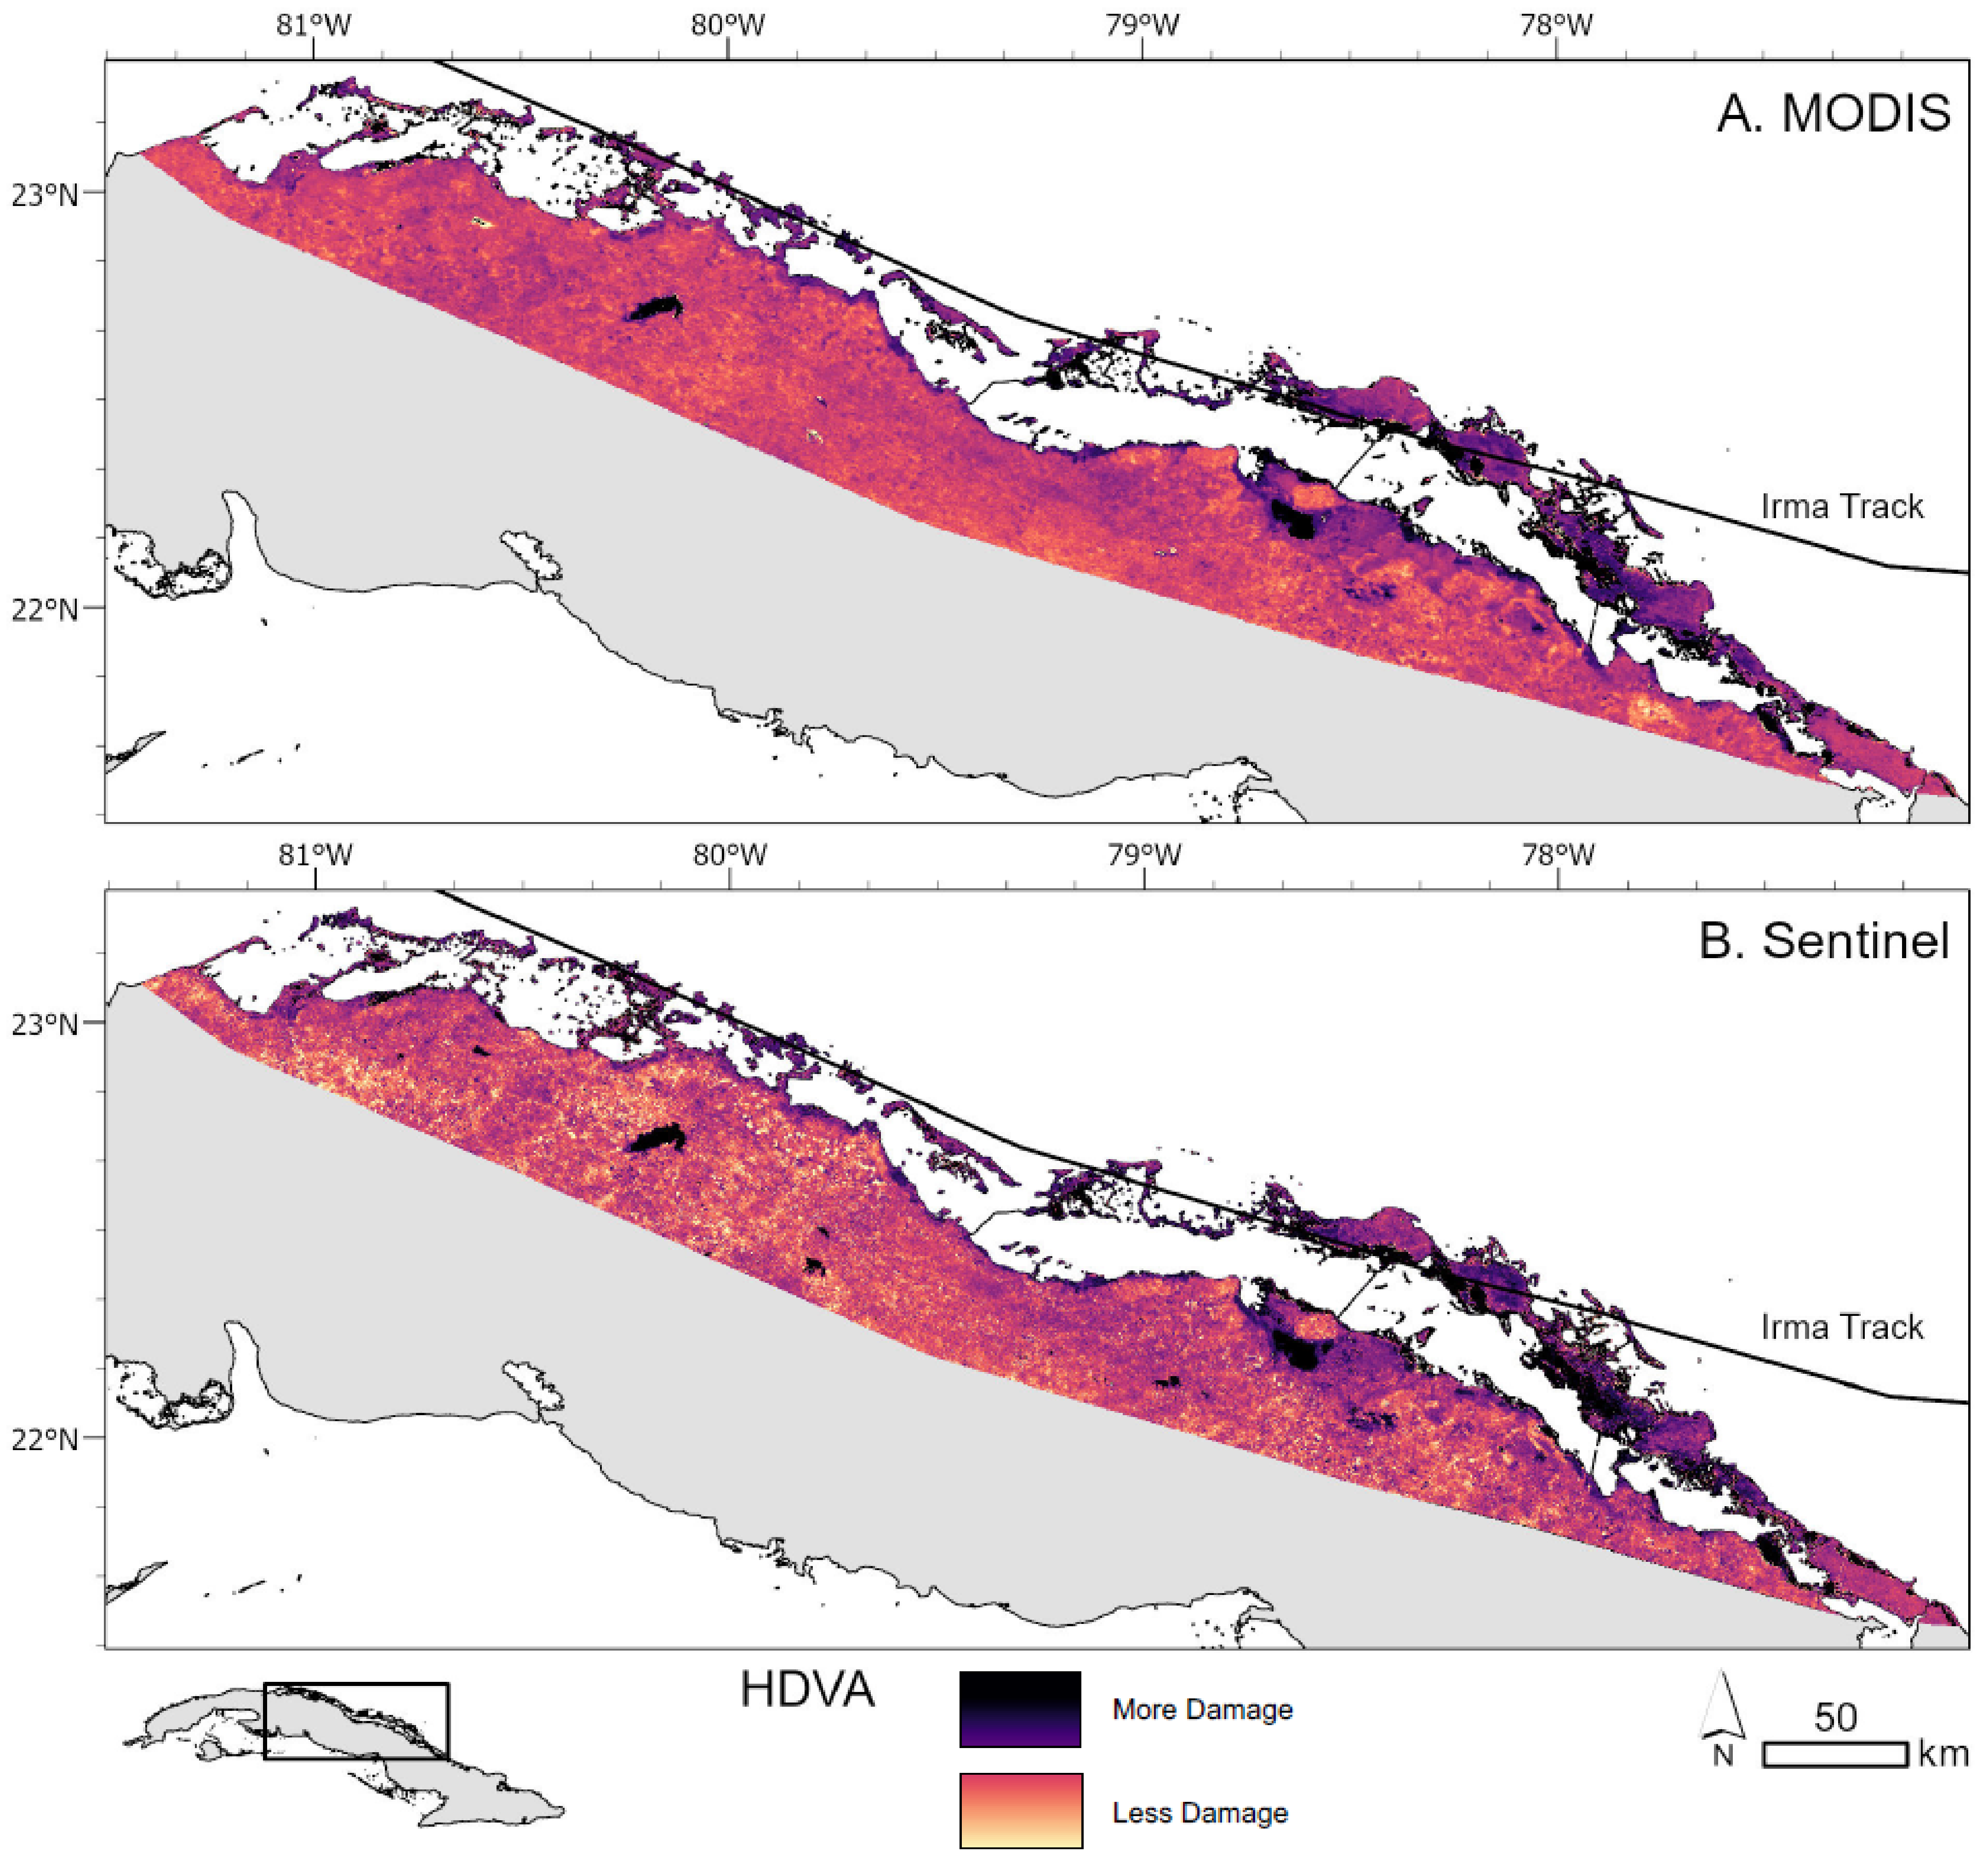
These HDVA data were restricted from 0 to 1 for MODIS and 0.001 to 1 for Sentinel-2 (due to outliers around zero in water features) for damage severity analyses; HDVA values of one indicated no loss and values greater than one signified a gain in comparison to the reference period. An HDVA value near zero corresponded to nearly a 100% decline in EVI (
Table 2). We displayed HDVA values as percentages for easy interpretation and communication, where a value of 100% means no discernable damages. As HDVA approaches zero, the greater the disturbances to vegetation cover or more serve damage from the storm; at zero, HDVA indicates all photosynthetically active vegetation cover is absent compared with the reference period.
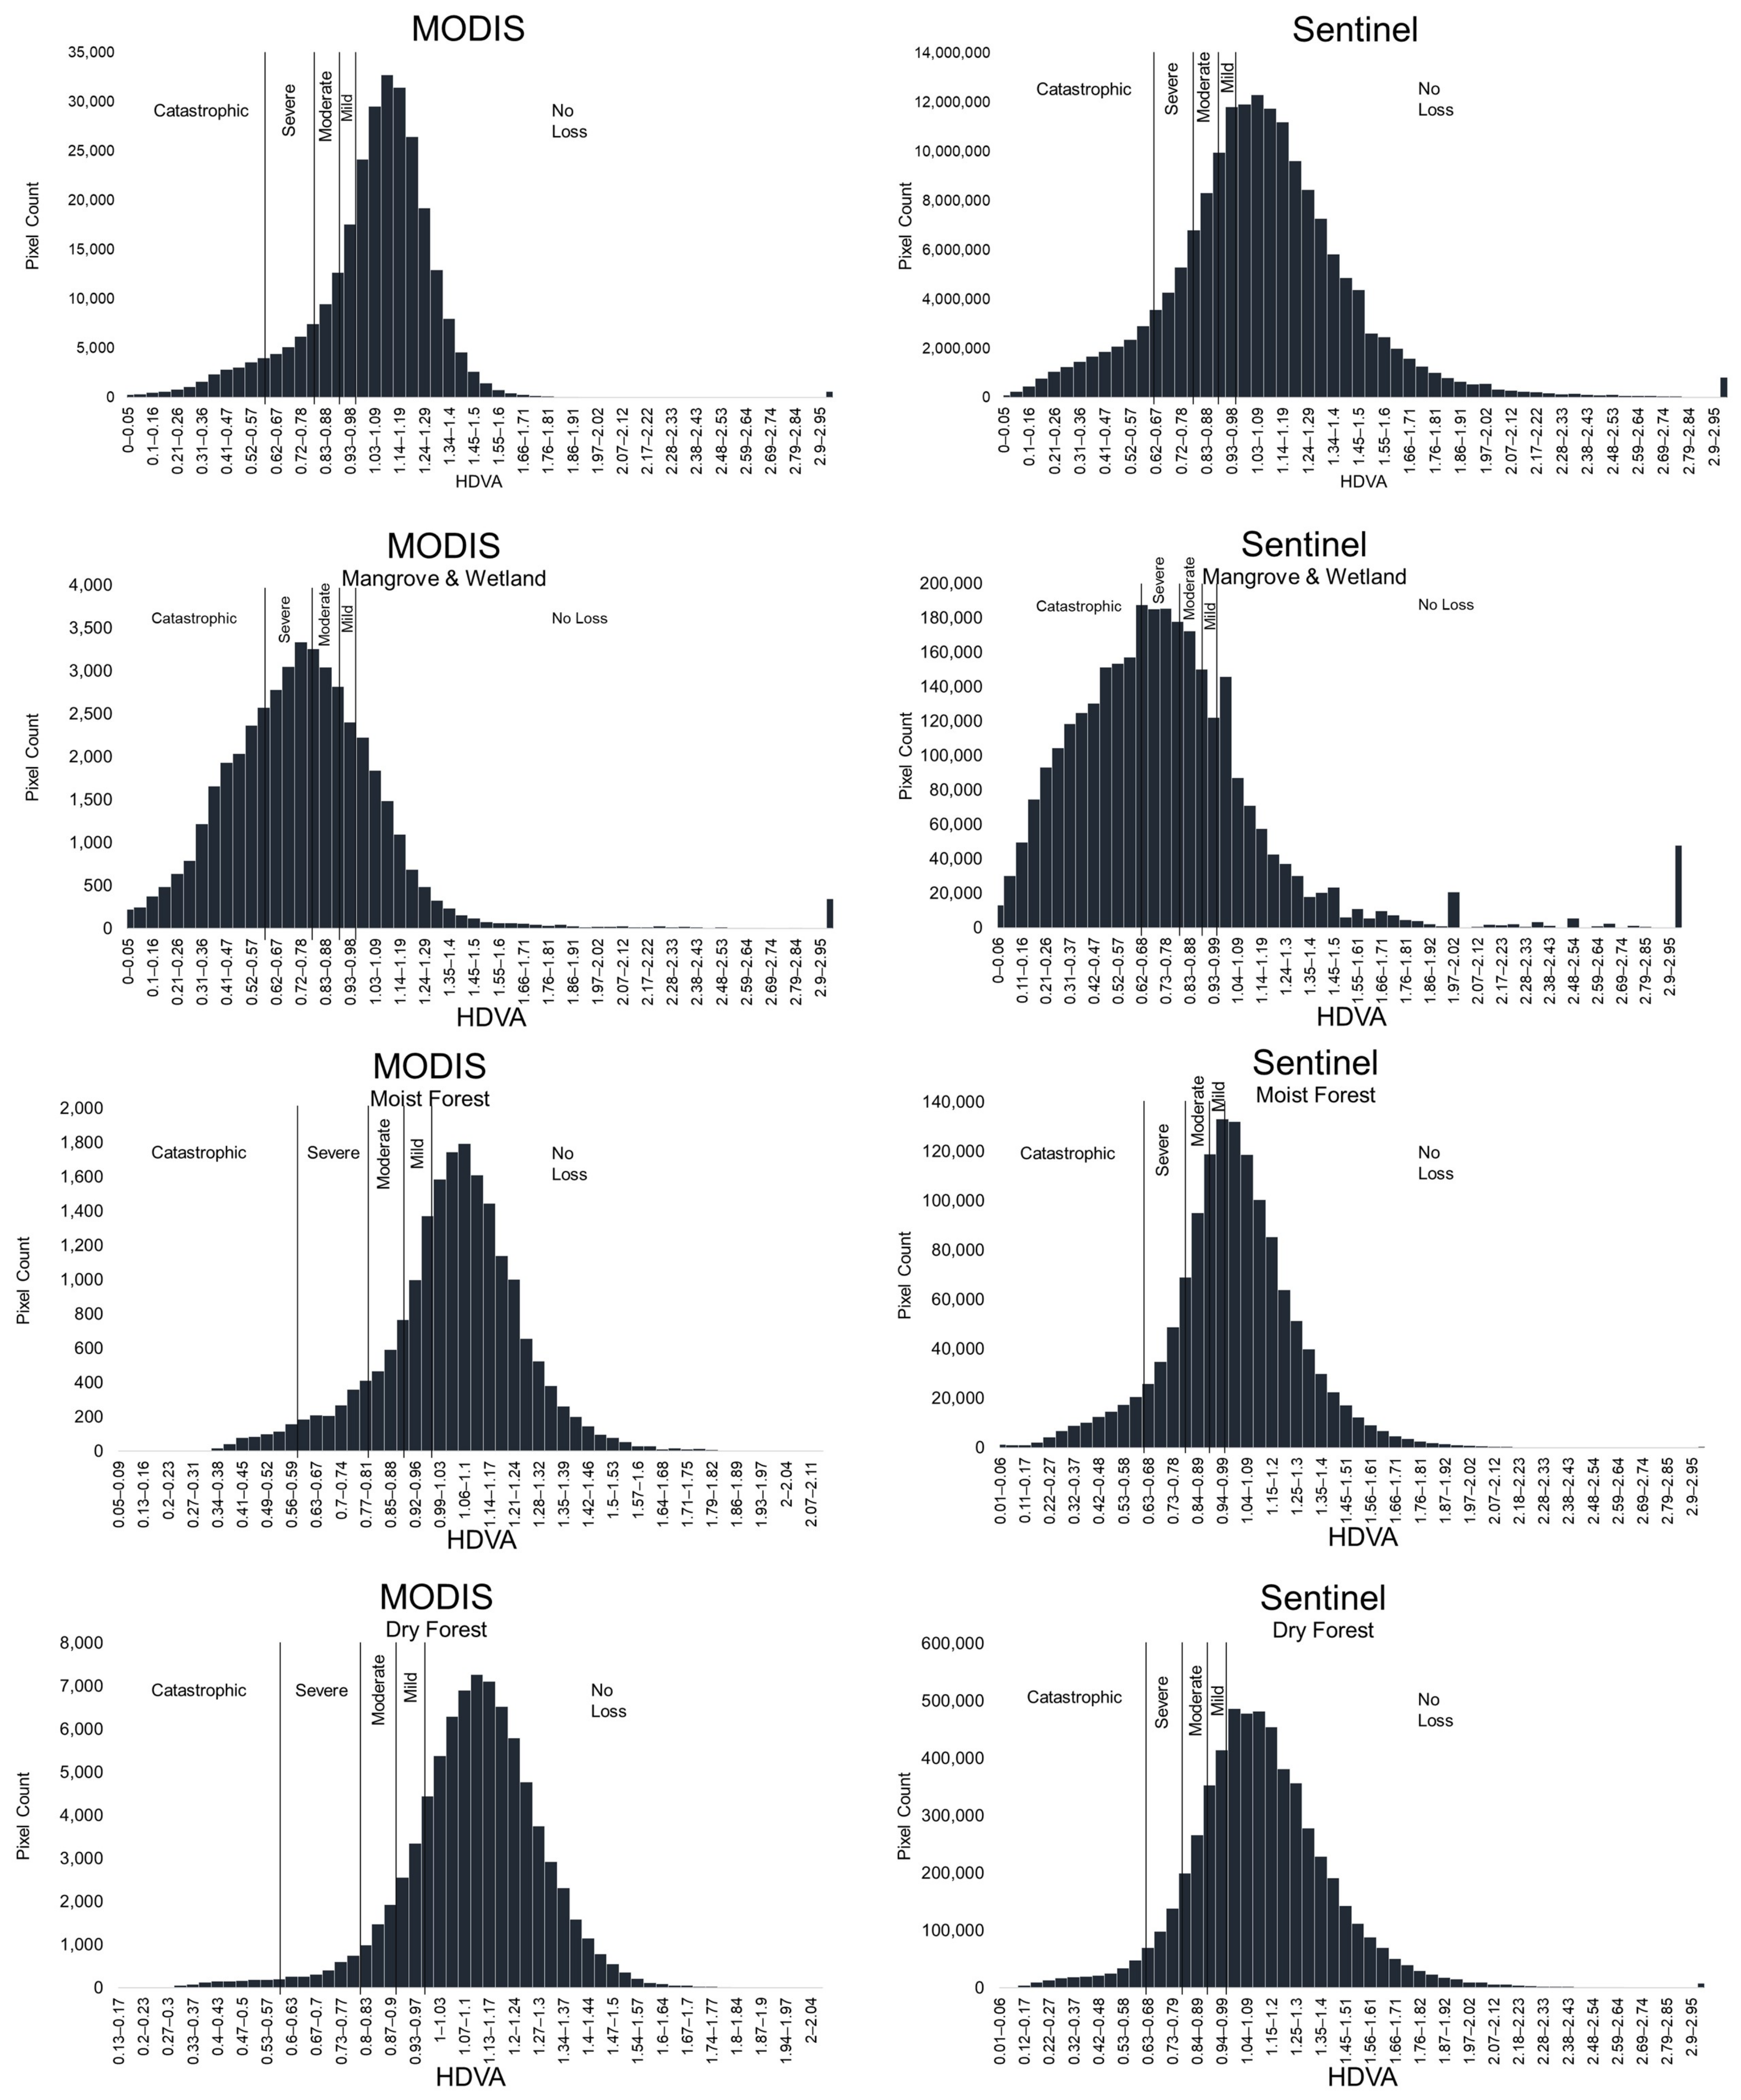
2.5. Determining Severity
To communicate the relative severity of disturbances, we transformed HDVA data by quartiles. After restricting the data to less <1, HDVA data was exported for statistical categorization by quartiles, where each quartile represents 25% of the data set. Statistical analysis was run in JMP Pro (14.2.0) to determine quartiles defining five severity categories: (1) Catastrophic (0–25%), (2) Severe (25–50%), (3) Moderate (50–75%), (4) Mild (75–100%), (5) No Loss (>100%). Once the statistical classes (severity levels) were defined, the classes were mapped back to pixels in GEE, creating a severity map. The results were mapped to show the final assessment of severity along the northern coast). We tested the concurrence of MODIS and Sentinel-2 using a confusion matrix and Kappa statistic. We created 10,000 random points and removed points with no Sentinel-2 data (as the MODIS footprint was larger), for a total of 9144 points. We used Sentinel-2 as the “ground truth” data and MODIS as the test data.
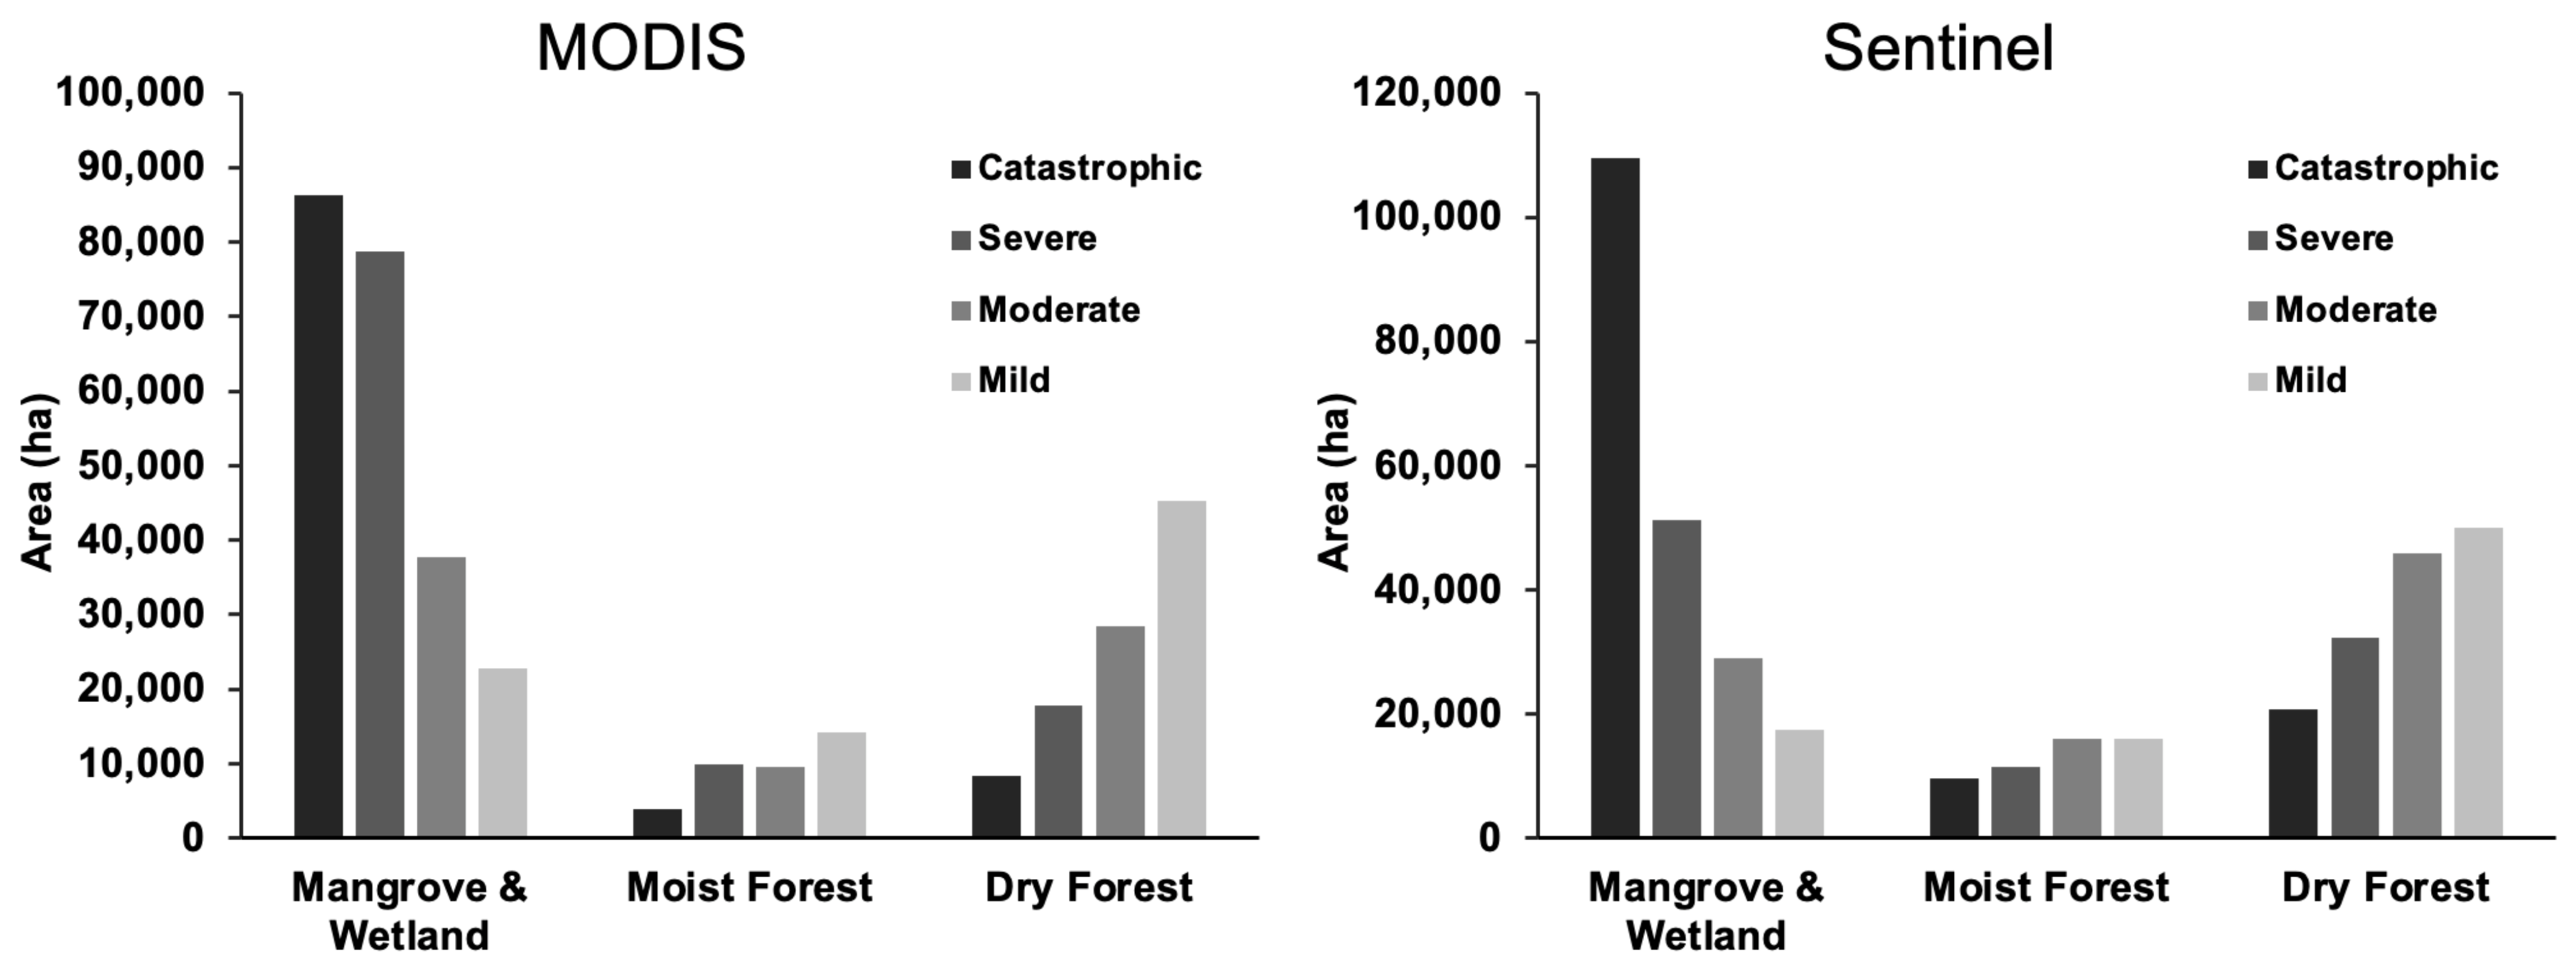
2.6. Damages by Land Cover
To determine how different land use types were affected by the hurricane, the severity maps from HDVA were analyzed with a contemporary land cover map generated from Landsat data, representing 2015 [
32] (
Figure 1). Natural land cover classes of interest were mangrove, wetlands, moist forest, and Cuban dry forest. The area of damage, and the severity of that damage, were tabulated by land cover and severity level. The land cover map had some errors where wetlands were labeled but where we could identify mangroves in Planet data; we combined wetland and mangrove land cover types to be a single class. Pixel counts were converted to area based on their native size in an equal area projection.
2.7. Reference Time Series and Images
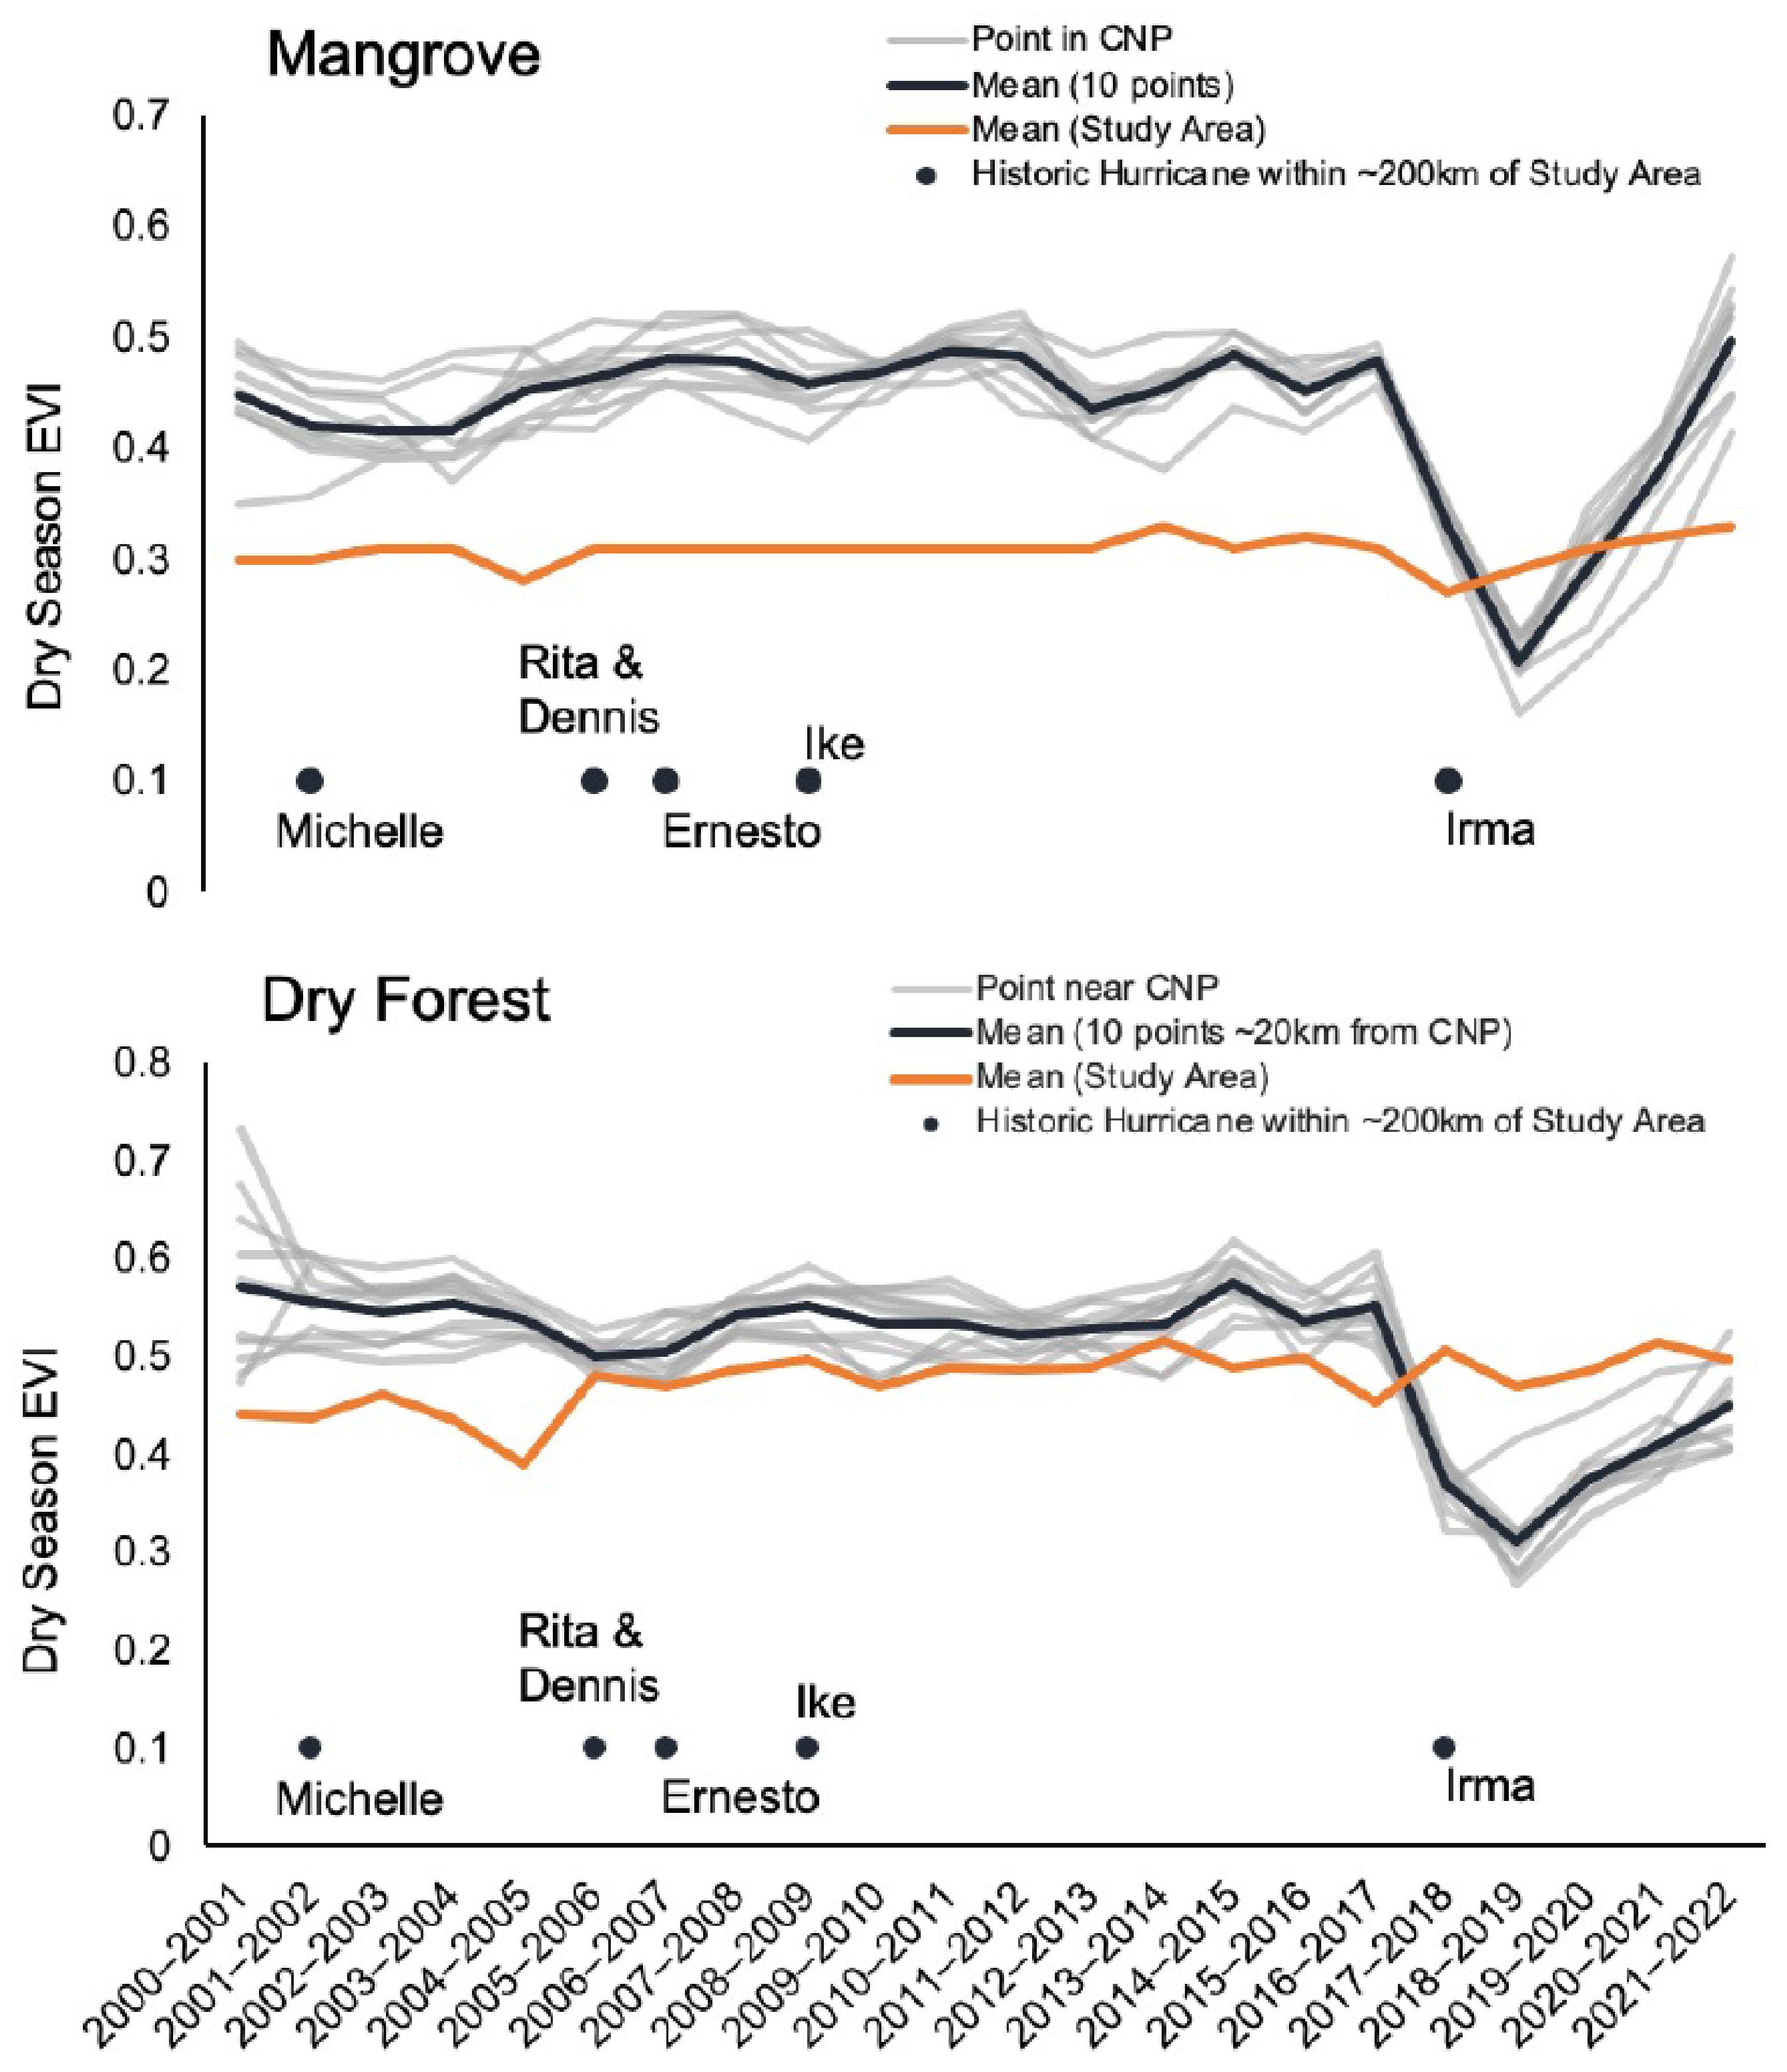
To gather a sense of how variable the MODIS-derived reference period was, we looked at EVI values from 2000–2022 for the entire study area as well as at 10 points in and near CNP in both mangrove and dry forest classes. Representative points were randomly selected within areas that were well-distinguished and defined in terms of land cover types based on the user’s visual interpretation of Planet and Sentinel-2 data and the authors’ familiarity of the area. These points were selected to avoid mixed pixel effects. We also utilized cloud-free Planet scenes to train our interpretation of post-hurricane recovery time series.
4. Discussion
We found there to be a great amount of catastrophic and severe ecological damage, specifically to mangrove and wetland land covers, along the northern coast of the Cuban archipelago following Hurricane Irma. This confirms the field-based observations of our team in and around CNP.
4.1. Ecological Impacts
Based on our 2018 field visit and regular reports from authors based at CNP, stands of mangroves with an HDVA categorized at catastrophic had widespread mortality, whereas those areas categorized on the lower end of catastrophic and severe were extremely damaged. Defoliation and organic decomposition in the catastrophic zones were so intense that the transparency of coastal waters plummeted to zero for more than a year due to tannins.
Concentrated zones of catastrophic mangrove damage coincide with stands of black mangrove, which occupy the low-lying saline mud flats and tidal lagoons, as the species is very salt tolerant. Red mangroves were also catastrophically affected in CNP, although to a lesser extent than black mangroves. The black mangrove species is vulnerable to prolonged submersion of its pneumatophores, which are the site of oxygen exchange for the root system in low-oxygen sediments. Extending vertically ~20 cm above the sediment, the black mangroves have pneumatophores that exchange oxygen when above water at low tide but are also vulnerable to suffocation if submerged for long periods of time. In this study, we see prolonged pooling of water in the tidal lagoons (
Figure 4,
Figure 5 and
Figure 9)—the same areas that are dominated by black mangrove and experienced catastrophic damage from Hurricane Irma. Complete defoliation of mangroves was combined with the pooling of water.
Pooling of water after a hurricane is known to deplete oxygen in soil and water, which can exacerbate damage, particularly through submersion of black mangroves’ pneumatophores. Catastrophic damage related to prolonged (months) water inundation could be related to anaerobic changes in soils, including reduced soil oxygen, lower redox potential (affecting denitrification and reduction of iron, manganese, and sulfate), and increased concentration of phytotoxins [
42]. Typically, inundation after a hurricane increases salinity in soils and waters, but we find the opposite in this case. Lagomasino et al. [
43] found similar pooling and black mangrove damage from Hurricane Irma in the mangroves of Florida, USA, which they speculate is due to prolonged salt exposure and physiological stresses from prolonged inundation. Unlike in Florida, the pooling of water in this study was not due to human-made structures restricting water flow but rather the large volume of water delivered by the storm (tidal surge, rainfall) plus the long inundation of freshwater that flowed slowly from the initial rainfall through the upland karst bedrock. Authors based in CNP measured coastal lagoon salinity as approaching 0 PSU for more than a year following Hurricane Irma due to freshwater inundation.
4.2. Changes in Land Cover Phenology
Recent remote sensing literature has highlighted the green leaf vegetation phenology of mangrove and coastal ecosystems, including seasonal and long-term trends (e.g., [
44]). Using EVI and NDVI time series to represent green leaf phenology, it is known that phenology is correlated to annual precipitation and solar radiation for red mangrove and white mangrove and min/max temperatures and monthly precipitation for seasonal trends in black mangrove [
44]. Other changes in remotely sensed phenology have been documented due to land cover change (e.g., deforestation), rainfall, storm events, and fragmentation [
25,
44,
45,
46]. Disturbance to mangroves from fragmentation in Malaysia led to some increases in MODIS Gross Primary Productivity [
46], whereas cyclones in Tanzania produced mixed results—some increases and some decreases in MODIS EVI [
45] in the order of ±0.05 to ±0.22 EVI units. While there was a significant decrease in EVI within mangroves and wetlands, a significant increase in EVI was detected across the entire study area as well as within the dry forest land cover type (see
Section 3.2, Data Processing). Increases (HDVA > 1) can be explained by ecological responses such as increased light availability and new plant growth with high cellulose content relative to non-photosynthetic vegetation. Additionally, there were several years of below-normal rainfall or drought prior to Hurricane Irma that could have affected a post-hurricane green-up.
Ground-truth campaigns in other locations have shown a high degree of correlation between remotely sensed indices of vegetation and observed live vegetation cover [
47,
48]. In this study area, it was not possible to conduct ground-based surveys of vegetation cover due to accessibility and resource limitations, making the remote sensed mapping results highly useful to park managers who could not reach all areas. To address this data-limited situation, we considered the “typical” MODIS EVI observations in the reference period from 20 locations in and near CNP from 2000–2017. Mangroves showed low variability in dry season EVI during the reference period (±5% from the mean), with the greatest decrease being 13% change in EVI compared with the mean in the 2001–2002 dry season, which could be related to Hurricane Michelle (Category 2 on 5 November 2001, with eye passing ~115 km NW from CNP). Looking at dry forests for the reference period, the historical variability was around 5% change from the mean EVI, with greater variability in the dry seasons of 2003–2004 (−13%) and 2004–2005 (−14%), which we hypothesize could be related to changes in hydrological and pollutant conditions, as discussed in
Section 4.6.
The negative impacts on phenology (HDVA < 1) were much larger than for storm disturbances or fragmented ecosystems as documented elsewhere [
22,
24,
44,
45,
46]. Our catastrophic damage class corresponds to 37 to 100% change in mean dry season EVI (Sentinel-2 and MODIS). Even the severe losses class has very high change in EVI (18 to 38% decline), which is well beyond observed changes in other impacted mangroves [
45,
46]. These are substantial changes in comparison to other land covers; for example, a tropical forest has ~10–20% annual variability in EVI, and a large soybean field may vary by roughly 75% in EVI from the peak growing season to the fallow season [
39]. These findings illustrate the magnitude of impact on the ecosystem and persistence, with EVI changes in heavily affected areas lasting months to years.
Following the storm, mangroves showed remarkable declines in EVI in the initial months following Hurricane Irma (2017–2018) but also in the following dry seasons (
Figure 10). EVI decline nearly doubled in the second dry season after the storm (2018–2019), before starting to show recovery in the third dry season (2019–2020) (
Figure 10). Radabaugh et al. [
16] stressed the importance of detecting delayed mortality to get a better idea of total losses by looking at damages out to 9 months post-hurricane. In this study, we focused on data from 3–9 months after Hurricane Irma; the MODIS EVI time series (
Figure 10) suggests the true severity of the ecological losses may have been 14–17 months post-storm (
Figure 9). The EVI values (
Figure 10) from 2020–2022 show a near a complete recovery within the mangrove and wetland land cover type. Based on field observations in CNP, we know these results are not indicative of the health of the entire mangrove population within the park. While the trends of these 10 points look promising, the catastrophically damaged mangroves may take over a decade to recover based on the local knowledge of this author team.
4.3. Sentinel-2 vs. MODIS
While single-scene before and after imagery can be incredibly useful qualitatively and quantitatively for hurricane analysis, programs such as Google Earth Engine allow for far greater accessibility to imagery and therefore greater accuracy of change detection. Instead of a snapshot in time, we compiled seasonal averages of pixel values over many years. The analysis in this paper shows the quantitative advantage of this increased accessibility; it is also very valuable visually. Many single-scene images were analyzed at the beginning of this project to get a sense of the extent of the damage using aerial imagery. Even when specifically looking at the dry season, cloud-free images are almost impossible to find in this part of the world.
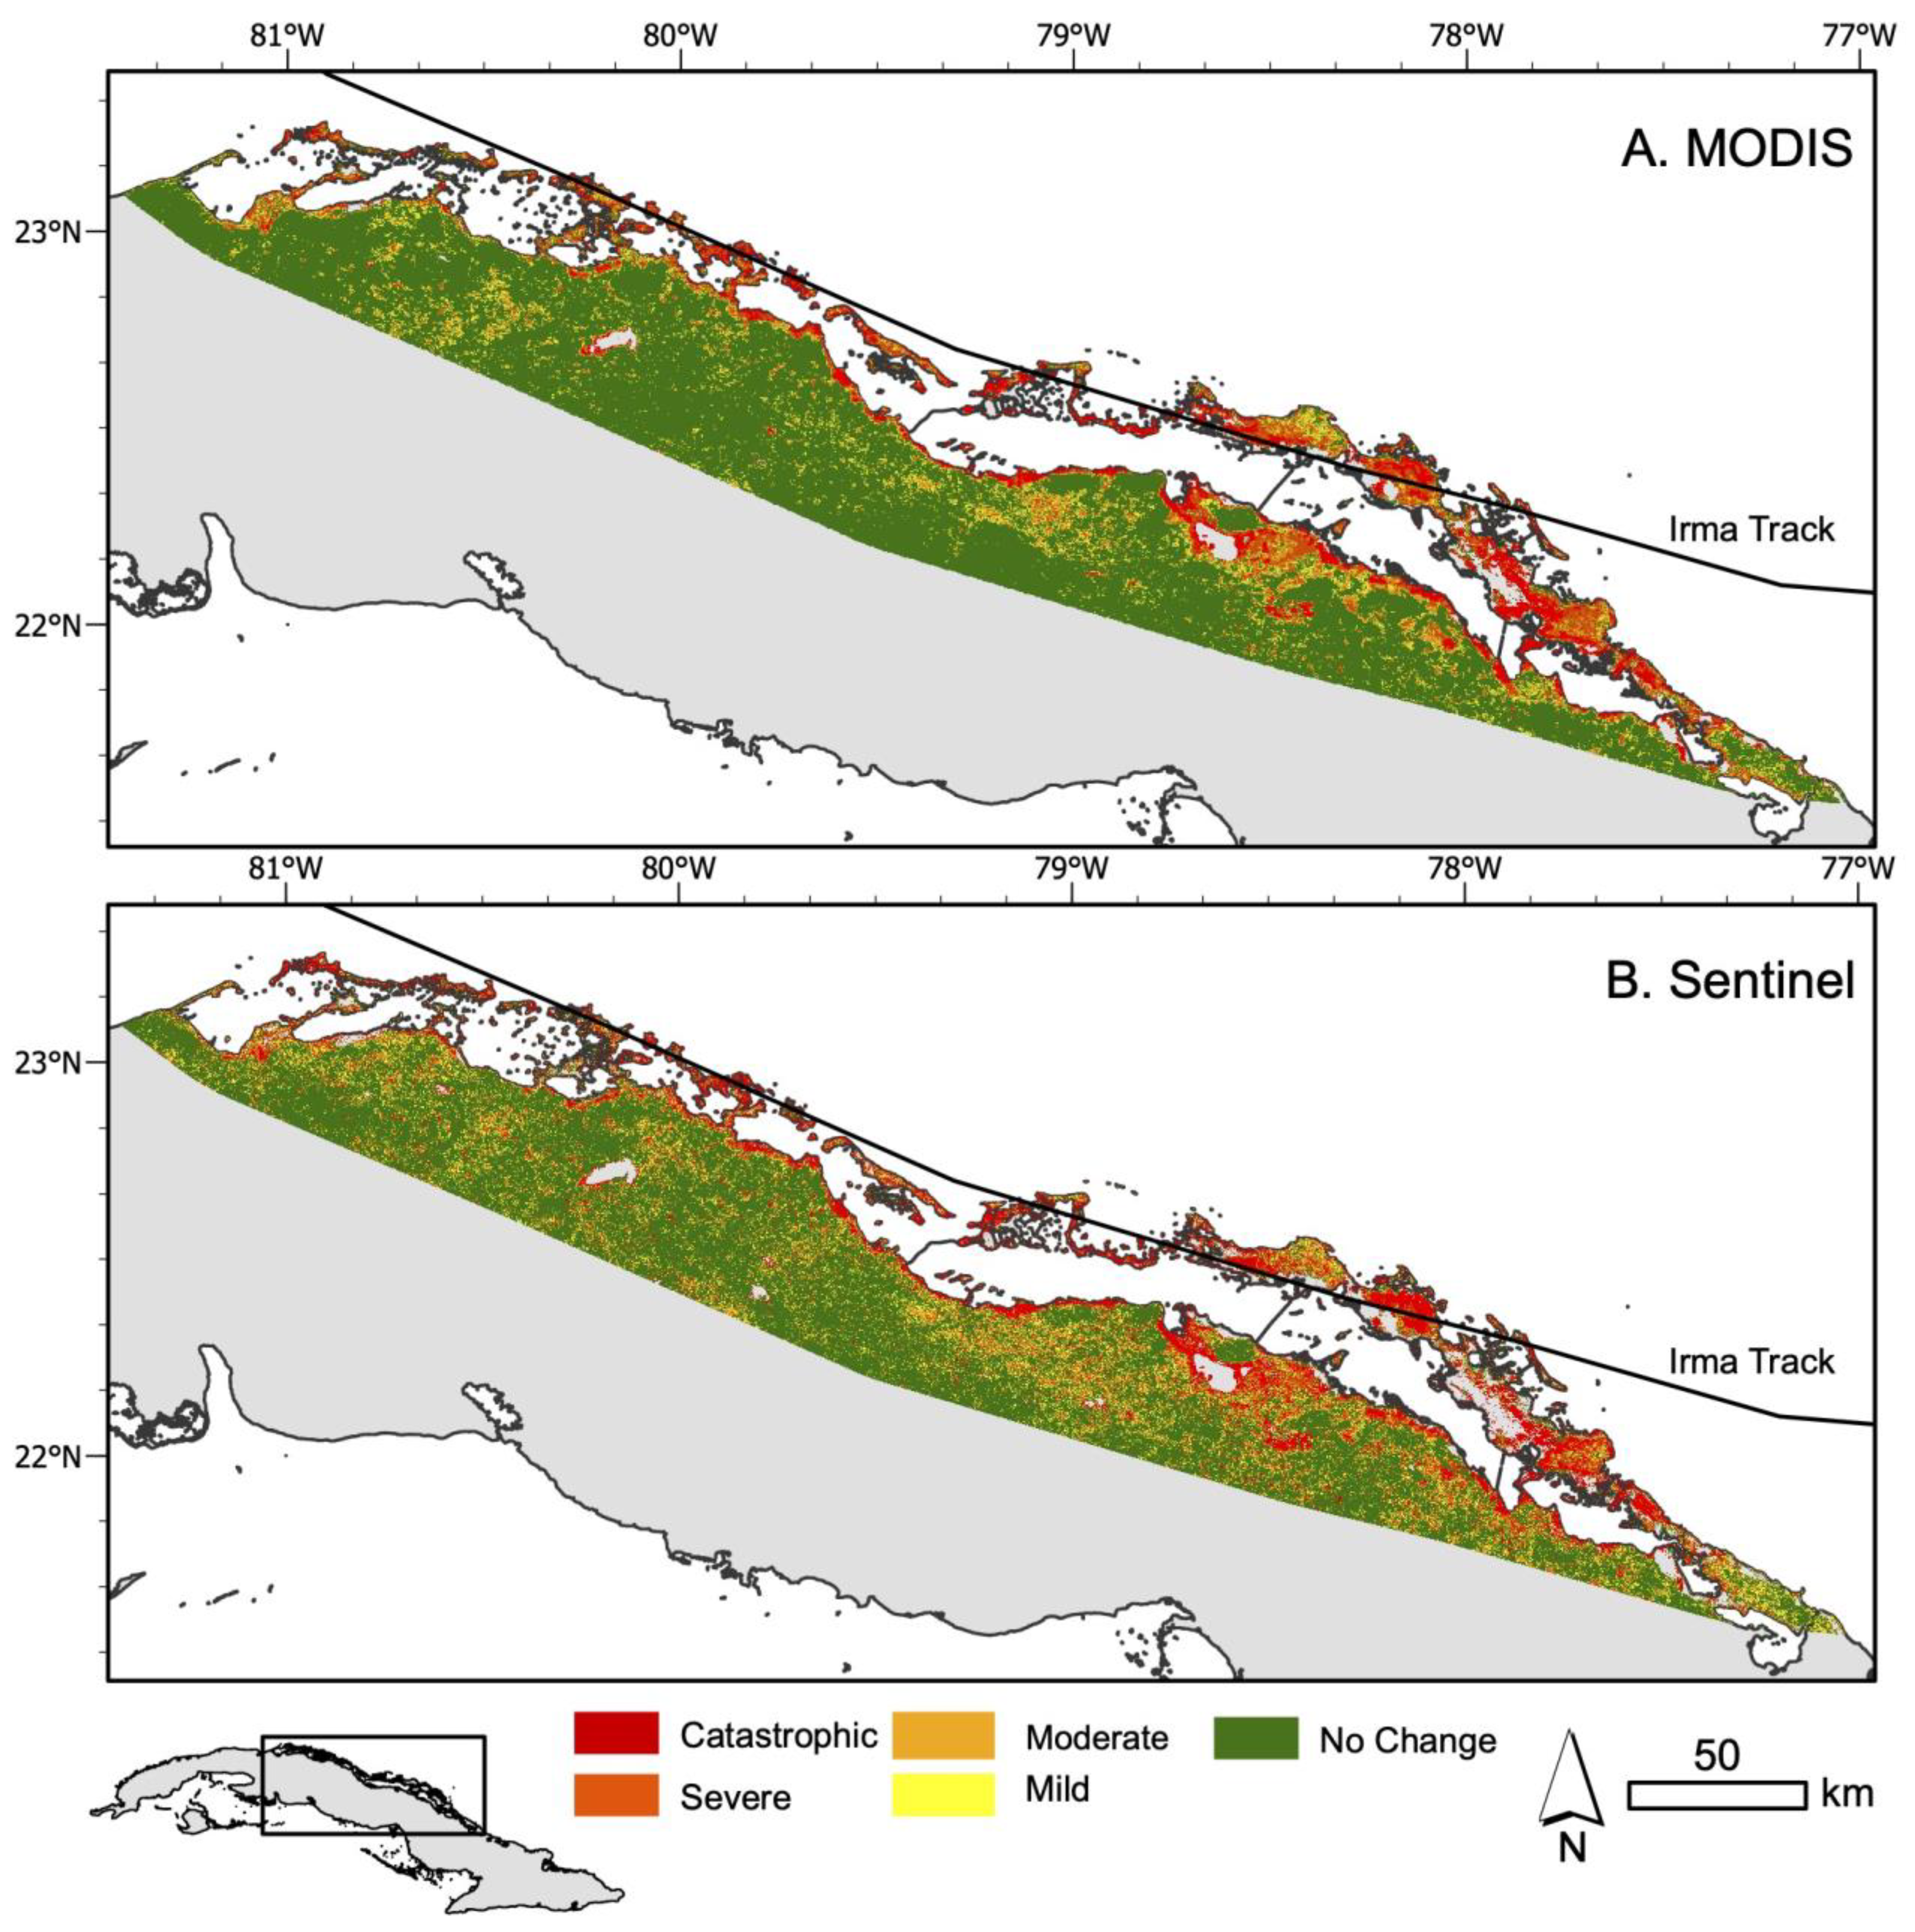
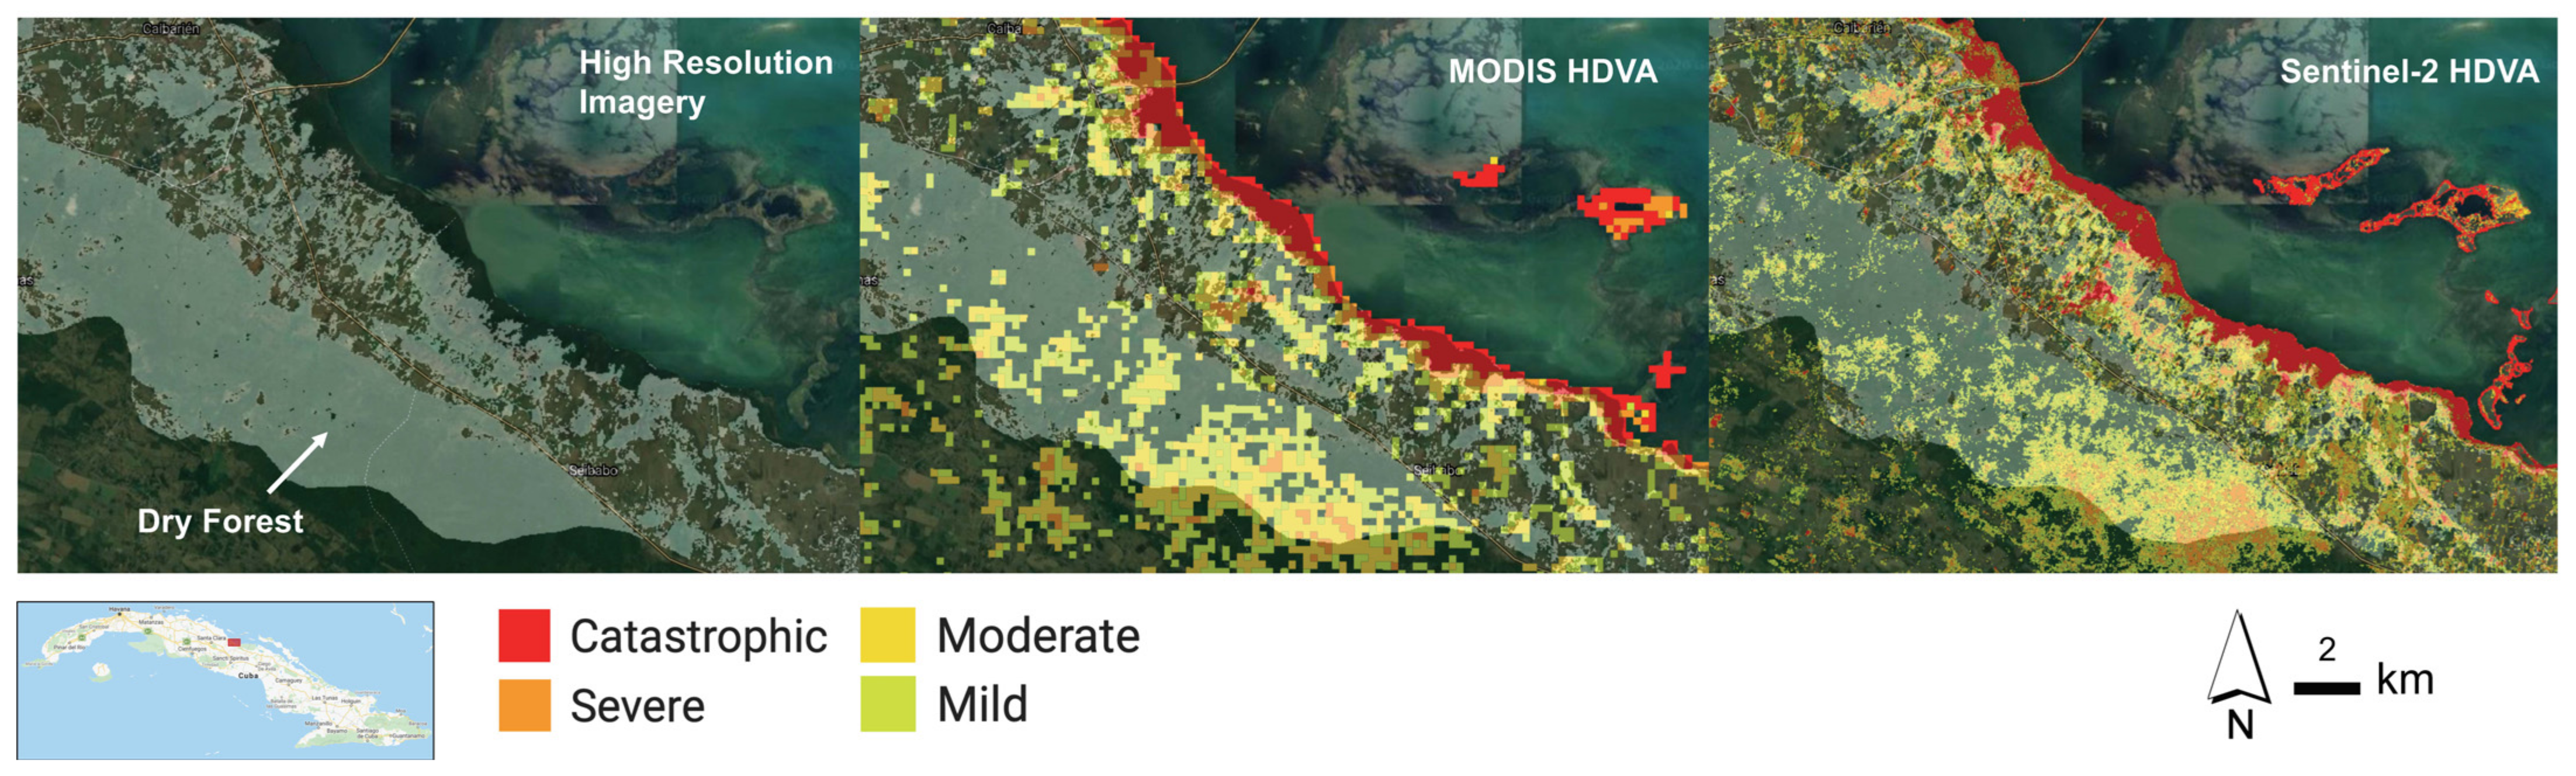
MODIS has been a choice sensor for land cover change analysis on landscape or larger scales because of its temporal coverage, rapid repeat intervals, and moderate resolution. Our severity maps generated with MODIS and Sentinel-2 data show agreement in the severity of ecological damages, highlighting the most catastrophic damage as concentrated near the coast (
Figure 8). MODIS data proved to be faster and simpler to process in GEE compared with Sentinel-2. MODIS is substantially faster to process (2.9 MB for the study area) compared with a ~150 times greater dataset for Sentinel-2 (445 MB).
After calculating the extent and severity of damage caused to three land cover types in this study, we found there to be an alarming amount of catastrophic and severe damage, specifically to mangrove and wetland populations. The confusion matrix in
Table 4 highlights the fact that Sentinel-2 may provide a more refined estimate of damage at both high and low ends of the scale, which were comparatively under- and overestimated by MODIS.
Despite these discrepancies, both sensors showed comparable trends in damage—demonstrating that even with a short reference period, maps derived from Sentinel-2 provide a robust conclusion. It should be noted that the Sentinel-2 reference period was confirmed to have no extreme storm events within the two-year period. Before using a relatively short reference period, it is imperative to know that no significant events have occurred. Further, Sentinel-2’s ability to detect smaller-scale damage is relevant to landowners or managers, such as in CNP.
In terms of estimates of damage, our MODIS analysis calculated more damage in the mangrove and wetland land covers compared with Sentinel-2 analysis. We believe a primary factor is an overestimation of the damaged area in the MODIS analysis due to mixed pixels (
Figure 12) on the coasts and in the keys. Many MODIS pixels overlapped areas that are water upon visual inspection of higher-resolution imagery, including Sentinel-2 and Google Earth satellite view. This mixed pixel effect can also explain why we found a higher percentage of mangrove and wetlands to be catastrophically damaged with Sentinel-2. We found more area was categorized as moderate and mild damage in dry forest with Sentinel-2 than with MODIS. Here too, Sentinel-2’s 10 m resolution picked up subtler and smaller changes that were lost as mixed pixel effects in MODIS (
Figure 12). One disadvantage is that some Sentinel-2 detections in grasslands may pick up changes in crop rotations in small holder farms that are scattered on the landscape. This could give a false increase or decrease in EVI. Sentinel-2 provides a more accurate number when looking at damage to specific vegetation types.
It is worth noting that areas calculated in this study vary by sensor, where MODIS tends to overestimate land area compared to Sentinel-2 because of the spatial resolutions affecting detections along the coastline. In terms of HDVA and damage classes, Sentinel-2 tends to detect more extreme damages (lower HDVA, greater severity class), which may be due to mixed pixel effects in MODIS.
4.4. HDVA Approach
Recent work by de Beurs et al. [
25] mapped damages from a series of Caribbean hurricanes. They use a metric akin to a z-score to consider how an observation at or near the time of the hurricane varies from the pixel’s long-term mean and standard deviation in its MODIS time series. Their approach systematically assesses hurricane damages in many places over several decades. This approach may yield different results than the HDVA because of the incorporation of the standard deviation and may be more challenging to interpret and communicate to stakeholders as a unitless metric. Both approaches utilized a historically observed time series to benchmark changes; however, de Beurs et al. [
25] looked at anniversary dates (e.g., 1 January each year) and vegetation changes at/near the time of the hurricane. Our study used long-term observed seasonal (dry season) vegetation observations and extended the damage analysis out past the hurricane for the full time period available in the data record. We focused on a single hurricane and its sustained damages.
Focusing on Hurricane Irma in Cuba, our study and de Beurs et al. [
25] detail the widespread extent of storm damage, extending several hundred kilometers along the coastal and inland zones. The differences in spatial patterns between these two studies need more investigation. In our MODIS analysis, there are some artificial detections along the coastline, although this does not appear in de Buers et al. [
25], despite using the same dataset. de Buers does detect more inland (non-coastal) changes, while almost completely missing the damages to CNP.
The methods outlined in this paper can be used to show stark changes in EVI following an intense storm event, but they could also be applied to assess the extent of defoliation from milder storms. As we continue to see increased precipitation, sea level rise, and the spread of invasive species, this method could additionally be used to analyze slower degradation of mangrove populations as well as recovery rates.
Further refinement may be needed to determine the suitability of the quality labels (e.g., HDVA category breaks), as we found applying a quartile approach worked well for our data but might need refinement for other applications. For example, if we applied quartiles by land cover type instead of the entire study region, then we would have marginally damaged dry forests classed as “catastrophic”, the same as mangroves with severe mortality. In the future, there may be a more robust break in categories that would suit many different ecosystems. Additional work to calibrate HDVA beyond vicarious validation with high-resolution imagery could enhance potential future applications of this metric but requires areas to be studied in detail before and after disturbances.
4.5. Caguanes National Park
Sentinel-2 provided a clear representation of the extent and severity of damage within CNP; this information is useful to park managers and local community members. Both MODIS and Sentinel-2 picked up widespread catastrophic damage to mangroves and wetlands within CNP. Using MODIS data, 98% of mangroves and wetlands were damaged, with 75% of that damage being catastrophic and 19% severe. Using Sentinel-2, 95% of mangroves and wetlands were found to be damaged, with 77% of that damage categorized as catastrophic and 11% severe. This 3% discrepancy is likely the result of MODIS overestimating the area along the coast due to mixed pixel effects (
Figure 12).
Considering dry forest that was disturbed in CNP, MODIS picked up 76% damage, with 25% of the damage being catastrophic, 32% severe, 11% moderate, and 9% mild. Sentinel-2 picked up 80% damage to dry forest, with 40% of the damage being catastrophic, 20% severe, 13% moderate, and 8% mild. Both sensors highlighted more of the damage being concentrated in the catastrophic and severe categories, which is likely due to CNP’s proximity to the eye of the storm. Even the dry forest, which we found to be less vulnerable when looking at the whole coast, was damaged more extensively at this coastal location. At this scale, data and maps derived from Sentinel-2 would provide local stakeholders a better idea of the location and severity of damage to vegetation. Planet data imagery of CNP from the following two years after the storm shows a healthier group of mangroves on the western side of the park, while the eastern side (where the storm primarily hit) is shown to be still heavily impacted but recovering (
Figure 9).
Within CNP, we see fresh water inundation lasting several weeks and the slow demise of the mangroves based on field visits by our team. Our analysis demonstrates more persistent damages, which played out over weeks, months, and years following the hurricane, particularly for mangroves. It is possible that in other ecosystems, this approach would miss damages where refoliation is rapid (e.g., maples of North America). Future advances and availability of high-resolution imagery (~1 m) or incorporation of vegetation structure data will enhance our ability to remotely sense hurricane damages when ground-truth campaigns are not possible.
4.6. Land Cover and Land Use Legacies
Given our team’s experiences living and working in the study area for decades, we think it is important to note some impacts of land cover and land use legacies that affect the historical period and perhaps the ecological impacts of Hurricane Irma.
In the time series of CNP EVI (
Figure 10), we note a few interesting periods of small variations compared with the long-term mean, such as the dry season of 2001–2002, which likely was affected by Hurricane Michelle (5 November 2001, tracked across NW corner of study region).
We observed some historical variations in green leaf phenology within CNP (
Figure 10). Upland (south) from CNP, the land use was agricultural historically, including industrial production of sugar cane and processing of sugar and torula yeast in several factories within 7 km. These factories did not have water treatment systems but used ferti-irrigation, as the manufacturing process used large volumes of water. The factories were phased out between 2000 and 2004, but contamination of water persisted over time, although it was concentrated in the early years of our study period. Additionally, modifications to the Pedraplen, a causeway connecting the island of Cuba with Cayo Santa María to the NW of CNP, were made due to its impediment of water exchange with the ocean, which caused increases in average salinity in the CNP mangroves, rising above 43 PSU. Hurricanes Ike and Paloma hit the region in 2008, and although they were not strong enough to do ecological damage to land cover, they did clear some of the prior industrial contamination from the coastal environments. After 2008, there was more natural rehabilitation of the ecosystems, although freshwater was scarce, due to the obstruction of drainage channels formerly used in sugar production in combination with dry or drought periods. Some coastal lagoons had unprecedented conditions, drying up completely, with salinity exceeding 67 PSU. Hurricane Irma brought the most massive deforestation of red and black mangroves in local memory, going back to 1933.
5. Conclusions
The methods outlined in this paper can be used to show stark changes in EVI following an intense storm event and can also be applied to assess the extent of defoliation from milder storms. As we continue to see increased precipitation, sea level rise, and the spread of invasive species, this method could additionally be used to analyze slower degradation of mangrove populations as well as recovery rates. The coordination of multitemporal and multisensor studies, with the communication of results in qualitative categories (e.g., catastrophic), is helpful for land managers and field scientists, particularly where computing infrastructure, field access, and expedition expenses limit field-based study. Future work should explore the use of the HDVA as well as category break values for damage classes.
Mangroves are essential to communities for coastal protection from tropical storm events due to their ability to act as barriers from wind, reduce storm surges by decreasing wave energy, and stabilizing the shore against erosion [
49]. While there is consensus that healthy mangroves protect communities and reduce the number of lives lost to high-intensity storm events, there is concern about their ability to carry out these functions in a changing climate [
49,
50]. Today, Cuba’s mangroves are still largely intact; however, even if they are not subject to direct human degradation, they are still vulnerable to the indirect impacts of climate change. With mangroves weakening from overexploitation, introduction of invasive species, and now the increase in intensity of hurricanes, we may witness a decrease in the ability of mangroves to stay intact and protect communities. Protection of mangroves is now more important than ever. Understanding the wide array of human- and climate-induced impacts on mangroves is an important contribution of remote sensing to future mangrove conservation.


 ,
, 


