You are currently viewing a new version of our website. To view the old version click .
Remote Sensing
  • Article
  • Open Access

25 April 2022

A Self-Attentive Hybrid Coding Network for 3D Change Detection in High-Resolution Optical Stereo Images

,
,
,
and
Smart City College, Chongqing Jiaotong University, Chongqing 400074, China
*
Author to whom correspondence should be addressed.
This article belongs to the Special Issue Remote Sensing for Engineering and Sustainable Development Goals

Abstract

Real-time monitoring of urban building development provides a basis for urban planning and management. Remote sensing change detection is a key technology for achieving this goal. Intelligent change detection based on deep learning of remote sensing images is a current focus of research. However, most methods only use unimodal remote sensing data and ignore vertical features, leading to incomplete characterization, poor detection of small targets, and false detections and omissions. To solve these problems, we propose a multi-path self-attentive hybrid coding network model (MAHNet) that fuses high-resolution remote sensing images and digital surface models (DSMs) for 3D change detection of urban buildings. We use stereo images from the Gaofen-7 (GF-7) stereo mapping satellite as the data source. In the encoding stage, we propose a multi-path hybrid encoder, which is a structure that can efficiently perform multi-dimensional feature mining of multimodal data. In the deep feature fusion link, a dual self-attentive fusion structure is designed that can improve the deep feature fusion and characterization of multimodal data. In the decoding stage, a dense skip-connection decoder is designed that can fuse multi-scale features flexibly and reduce spatial information losses in small-change regions in the down-sampling process, while enhancing feature utilization and propagation efficiency. Experimental results show that MAHNet achieves accurate pixel-level change detection in complex urban scenes with an overall accuracy of 97.44% and F1-score of 92.59%, thereby outperforming other methods of change detection.

1. Introduction

Remote sensing change detection is the process of analyzing and determining changes on the Earth’s surface using multi-temporal remote sensing data [1]. Due to the complexity of object observation, which is affected by the solar altitude angle, external noise, sensor noise, different sensor types, and weather conditions, the detection of change based on multi-temporal remote sensing images is complicated [2]. Buildings are an important part of cities, and, as China’s infrastructure construction and urbanization continue to accelerate, the change detection in urban buildings is important for urban land resource management, urban expansion, and governmental decision-making [3,4,5].
In recent years, along with the gradual maturity of remote sensing imaging technology, and data transmission and storage technology, the amount of remote sensing data has grown explosively. A large number of remote sensing satellites have been launched around the world, gradually constituting a global-scale earth observation system. This allows large amounts of high-spatial-, high-spectral-, and high-temporal-resolution remote sensing data to be applied quickly and conveniently [6]. High-spatial-resolution optical remote sensing images are popular because they can clearly characterize spatial information and geometric features. In remote sensing applications, high-resolution remote sensing images that contain a large amount of detailed information are crucial for remote sensing image interpretation. The trade-off between spectral resolution and spatial resolution limits the performance of modern spectral imagers and the use of compressive sensing (CS) technology for super-resolution remote sensing image reconstruction. These compensate for image undersampling artifacts through derivative compressive sensing and can reduce distortion and noise in the digital remote sensing image reconstruction process [7,8]. In addition, CS technology can ensure the output of high-resolution remote sensing images, while achieving the miniaturization of focal plane linear array sensing of remote sensing imaging structures, thus greatly reducing the cost of remote sensing scene information acquisition and reconstruction and providing high-quality data support and a technical guarantee for the development of high-resolution remote sensing image change detection technology [9,10]. However, shadows, spatial heterogeneity, and complex imaging conditions are common in remote sensing scenes. This can cause problems such as reduced inter-class separability and high intra-class variability, which greatly affect remote sensing image analysis and processing [11,12,13]. Traditional remote sensing image processing methods are often inadequate for complex, large-scale data processing tasks in this era of remote sensing big data. Therefore, there is an urgent need for image processing and analysis methods for remote sensing change detection that can operate efficiently, rapidly, and automatically in real time [14].
With the rapid development of computer science and artificial intelligence technology, new intelligent change detection methods have been developed involving deep learning of remote sensing data [15]. However, these data-driven deep learning change detection algorithms are mostly focused on the study of 2D unimodal optical remote sensing images. Although these may contain rich information on ground radiation, they do not reflect changes in surface coverage comprehensively. Real scene changes occur not only in the horizontal direction but also in the vertical direction, especially for features such as buildings. Using a single observation dimension and insufficient information will usually lead to incomplete change detection, poor measurement of small targets, and false detections, which, to a certain extent, limit the application value of remote sensing change detection. Using 3D remote sensing data can significantly improve the reliability of change detection because these can provide more refined 3D spatial information on the ground surface. With the development of 3D remote sensing technology, the threshold of availability of 3D remote sensing data, such as stereo images, point cloud data, and DSMs obtained via satellite-based, airborne, and close-field photogrammetry techniques, is gradually reduced, increasing the application potential of 3D intelligent change detection [16]. Therefore, there is an urgent need to study multimodal deep learning change detection methods that can fuse 2D and 3D remote sensing data. Fusion of multimodal remote sensing data can produce richer feature representations for change detection learning tasks, resulting in better change detection results [17]. Multimodal deep learning enables computers to understand and process heterogeneous data from multiple sources, and it has been widely used in natural language processing, speech recognition, image processing, and other fields [18]. Therefore, the field of change detection should be developed to gain the advantages and full potential of remote sensing big data. There is a need to explore 3D intelligent change detection methods that integrate multimodal remote sensing datasets by using deep learning algorithms based on data-driven models.
In this paper, we propose a multi-path self-attentive hybrid coding network model called MAHNet, which fuses high-definition remote sensing images with the DSM. We conducted experiments on 3D change detection of buildings in urban scenes. The main advantages of the method are as follows:
  • We propose a multi-path hybrid coding network structure. Different types of encoders are designed for multimodal feature mining tasks to enhance the feature representation capability of the different representation forms of high-resolution remote sensing images and the DSM.
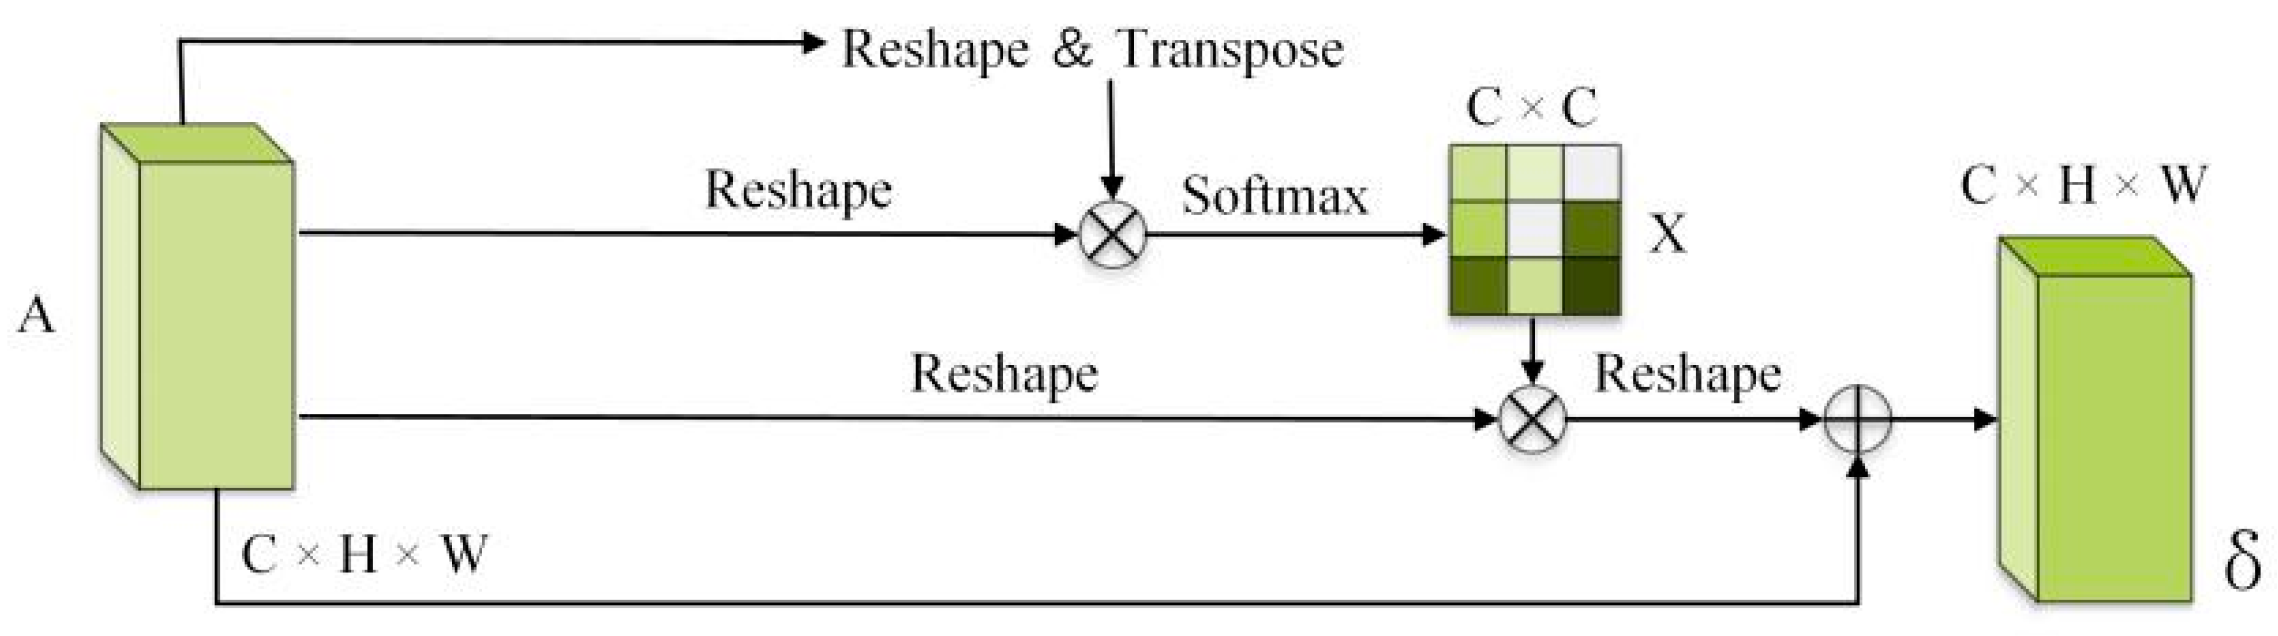
  • We design a multimodal feature fusion model based on dual self-attention. The model can adaptively represent the high-level semantic relations of multimodal 3D fusion features in both the channel and space dimensions and enhance the fusion effect and characterization of heterogeneous features.
  • We design a dense skip-connection decoding structure. Compared with ordinary decoders, it is more flexible in conducting multi-scale feature learning with multimodal heterogeneous data. It can enhance feature utilization and propagation efficiency and improve small-scale change detection capability.
  • Our experimental results on a self-made GF-7 dataset show that MAHNet has superior change detection performance compared to other comparison methods.
The rest of this paper is organized as follows: Section 2 provides an overview of change detection methods. Section 3 introduces our proposed methodology. Section 4 presents our change detection experiments using the GF-7 dataset. Section 5 provides a training process and discusses network inference efficiency. The final section concludes the paper and makes suggestions for future work.

3. Methodology

In this section, we introduce the method proposed in this paper in four parts: (1) the basic network framework, (2) the multi-path hybrid encoder, (3) the dual self-attention fusion module, and (4) the dense skip-connection decoder.

3.1. Basic Network Structure

MAHNet takes dual-temporal high-resolution remote sensing images and the DSM as input data. It consists of three main parts: a multi-path hybrid encoder, a dual self-attentive feature fusion module, and a dense skip-connection decoder. The structure is shown in Figure 1. The coding structure of MAHNet is that of a multi-path hybrid encoder composed of a ResNet and an FCNN. ResNet-34 is used as the primary encoder for high-resolution remote sensing image feature mining tasks, and an FCNN is used as the secondary encoder for DSM height information extraction. This hybrid coding method can effectively accomplish the data mining of complex 2D space–spectrum joint features of high-resolution remote sensing images and simple height features of the DSM. The primary and secondary encoders can acquire multi-scale features from low-level to high-level features through continuous feature mining and down-sampling, while the feature extraction results at both ends are fused and output simultaneously to form multimodal 3D fusion features. In the deep feature fusion stage, deep adaptive weighted fusion of the change feature vectors is performed by a dual self-attention-based multimodal feature fusion model to form a stable multimodal change information representation state. Then, the attention feature maps generated by the two modules are input into a standard convolutional layer (1024 filters), a ReLU activation function, a BatchNorm layer, and a Dropout layer, respectively, after summing the mapped outputs to generate the final dual-channel attention-weighted fusion feature results. Finally, the low-level to high-level 3D fusion features are fed into the dense skip-connection structure at the corresponding scale, and the image’s spatial resolution is restored using an up-sampling process. The dense skip-connection structure can accomplish multi-scale feature fusion of high-level semantic information and low-level spatial location information to achieve precise localization of spatial detail information, thus improving change detection in small-change regions and target edges. Finally, a Softmax layer is used to generate a change probability map.
Figure 1. Structure of the multi-path self-attentive hybrid coding network (MAHNet).

3.2. Multi-Path Hybrid Encoder (MPHE)

We propose a multi-path hybrid coding structure consisting of two independent encoders—a primary encoder and a secondary encoder—and an intermediate fusion structure. Since the high-resolution remote sensing images have multiple bands and record multiple complex information types, such as geometric structure, texture features, and the spatial domain distribution of features, the spatial resolution is high and the data structure is relatively complex. The residual network has a powerful feature mining ability that can extract complex features for dual-time-phase high-resolution remote sensing images and effectively alleviate the gradient disappearance problem of complex features in the propagation process [56]. The DSM records feature height information in the form of a single waveform, which has a relatively singular data structure and representation form and relatively low feature complexity. Therefore, a simple FCNN is used as a sub-encoder for the simple feature learning task of the DSM to avoid the overfitting problem, while also saving computational resources and improving learning efficiency [57]. Finally, the RGB features extracted from the high-resolution remote sensing images and the height features extracted from the DSM are mapped to the same feature space, from top to bottom, to achieve cross-modal information fusion processing and constitute the multimodal 3D fusion feature f3D. According to Equation (1), we can calculate the feature fusion result for the remote sensing image and the DSM.
f 3 D = I m a g e i , j D S M i , j
where ⊕ denotes the feature combination of the high-resolution remote sensing image feature map and the DSM feature map using the concatenate function to form multimodal 3D fusion features and i and j denote the length and width of the feature map, respectively. We design the multi-path hybrid coding structure to meet the multi-level and multi-scale feature learning requirements of different datasets and, at the same time, input the multimodal 3D fusion features into the same dimensional dense skip-connection decoding structure for adaptive learning and training to strengthen its expression performance. Then, the feature extraction results of both paths are continuously down-sampled to achieve the purpose of feature compression, eliminate redundant information, and reduce computational effort, while the over-sensitivity of the convolutional layer to location information can be alleviated. After multiple down-sampling, the features will become more and more abstract, the contained feature information will be more advanced, and the feature expression capability will be more powerful.

3.3. Dual Self-Attention Fusion Module (DAFM)

Since the MPHE achieves multimodal feature fusion in a way that connects the feature matrices of both high-resolution remote sensing images and the DSM, this fusion method is simple but makes almost no direct connection between the parameters. Although the later convolutional feature extraction unit can adaptively model the relationship between the parameters, this undoubtedly enhances the model training difficulty. Therefore, a dual self-attentive depth feature fusion method based on location attention and channel attention was designed. By establishing the spatial dependency and the channel correlation of the multimodal 3D fusion features in the high-resolution remote sensing images and the DSM, the high-level abstraction fusion and characterization effect is improved and the ability to discriminate local features in the global context is enhanced. The structure of this system is shown in Figure 2, where C, H, and W refer to the number of channels, length, and width of the feature map, respectively.
Figure 2. Dual self-attention fusion structure diagram.
The DAFM can model the semantic relationship between the initial feature fusion results of the high-resolution remote sensing images and the DSM in two dimensions: locations and channels. It adaptively combines local features with the global view to achieve integrated learning of multimodal 3D fused features according to their correlation in these two dimensions [58]. First, the spatial dependency between any two object locations in the feature map is established. We emphasize the relevance of local features in the global view. The features at all locations are aggregated and updated using a location attention model, for which feature weights are determined according to the similarity of the features at two corresponding locations. Second, a channel attention module is used to capture the channel dependencies between any two channels in the feature map. The feature map of each channel mapping is updated using the weighted sum of all feature channel maps. Finally, the feature map outputs by these two attention modules are fused.
The high-level semantic information of remote sensing scenes is beneficially closely related to the extraction of contextual features. The location attention module can precisely locate the spatial correlation of local features under the global view, which is crucial to understanding and interpreting remote sensing scenes. Figure 3 represents the position attention structure. The position self-attention module mainly contains the following three parts: location weight calculation, location weight update, and remapping of location weights. Position attention is formulated as follows:
ω j = A j + α i = 1 N D i · exp B i C j i = 1 N exp B i C j
where i and j denote the row and column numbers, respectively, of the image feature elements; A denotes the initial feature fusion result obtained after convolution of the high-resolution remote sensing image and the DSM; B, C, and D are the three feature maps obtained after convolution; N = H × W denotes the total number of image elements in a channel feature map; and α is the position weight coefficient, which has an initial value of 0, which varies with the training process. The B-deformed and transposed feature maps are matrices multiplied with the C-deformed feature maps to obtain the N × N-dimensional location attention maps. To reduce the computational difficulty, the weight values of this location attention map are mapped between (0,1) using the Softmax function to obtain the normalized location attention map S. The result is multiplied by the deformed weight matrix of the feature map D while multiplying by the weight coefficient α for the location attention weight update task to capture the global contextual features in the feature map D. Finally, the final location attention feature map ω is obtained by weighted mapping with the original feature map.
Figure 3. Position attention structure diagram.
More feature maps are usually obtained after the convolution operation is applied to the remote sensing images, each of which represents a specific class of channels. The magnitude of a value somewhere in the channel represents the response of the strength of that feature. By explicitly constructing the interdependencies between channels of multi-source remote sensing data, the responsiveness of different channel features can be adaptively readjusted to emphasize feature mapping relationships between channels with high correlations [53]. As shown in Figure 4, the channel self-attention module contains the following main parts: channel weight calculation, updating, and remapping. The channel self-attention module can be denoted as follows:
δ j = A j + β i = 1 c A i exp A i A j i = 1 c exp A i A j
where β is the channel weight coefficient, which has an initial value of 0, which changes with the training process. Firstly, the deformation result of feature fusion map A is matrix-multiplied with the reshape + transpose result. Then, the C × C-dimensional channel attention map X is obtained using the Softmax function, which establishes the high-level semantic relationship between any two channels. Then, we multiply the X and A deformation results with the channel weight coefficient β to obtain the channel attention result map, which captures the high-level semantic features between different channels. Finally, the final channel attention feature map δ is obtained by weighted mapping with the initial feature map A.
Figure 4. Channel attention structure diagram.

3.4. Dense Skip-Connection Decoder (DSCD)

Since the multi-path hybrid encoder usually loses spatial information in the process of obtaining high-level semantic information, the final feature map will become considerably abstract and spatial detail information, such as small-change regions and edges, is easily lost. This is not conducive to achieving fine-grained remote sensing change detection. The decoder, however, can effectively restore the spatial domain detail features of the image through spatial up-sampling, producing a more accurate localization for each pixel. At the same time, the use of the skip-connection structure achieves multi-scale fusion of high-level abstract features and low-level spatial features. However, combining only the feature maps of the same feature mapping channels of the encoder and decoder with constraints often does not achieve the desired multiscale fusion effect. Inspired by the structures of DenseNet [59] and UNet++ [60], the decoding structure was designed as a dense skip-connection decoding structure. It can achieve the task of multi-scale feature fusion more flexibly when the semantic information of the encoder feature mapping is closer to that of the feature mapping in the decoder. This improves the utilization of features, enhances the efficiency of feature propagation, encourages the reuse of features, and, thus, makes optimizer optimization easier to implement [61]. The feature mapping output for each node of the dense connection can be described as:
x i , j = H x i 1 , j , j = 0 H x i , k k = 0 j 1 , U x i + 1 , j 1 , j > 0
where i denotes the down-sampling layer, j denotes the convolutional block of the dense skip-connection decoding layer, H(.) is the convolution operation, U(.) denotes the up-sampling layer, and [.] represents the concatenation layer. For example, x 1 , 3 = H M erge 1 , x 1 , 0 , x 1 , 1 , x 1 , 2 , U x 2 , 2 , that is, the input of each convolutional layer of the dense skip-connection decoder, is the result of fusing the output from each previous convolutional layer with the corresponding up-sampled output.

4. Experiments

In this section, we verify the validity and reliability of MAHNet through a series of experiments. The following sections describe (1) the data sources and study area, (2) the experimental environment, parameter settings, and loss function selection, (3) details of the change detection evaluation index, (4) methods used for comparison, and (5) a series of qualitative and quantitative comparative experiments conducted to verify the validity and reliability of MAHNet.

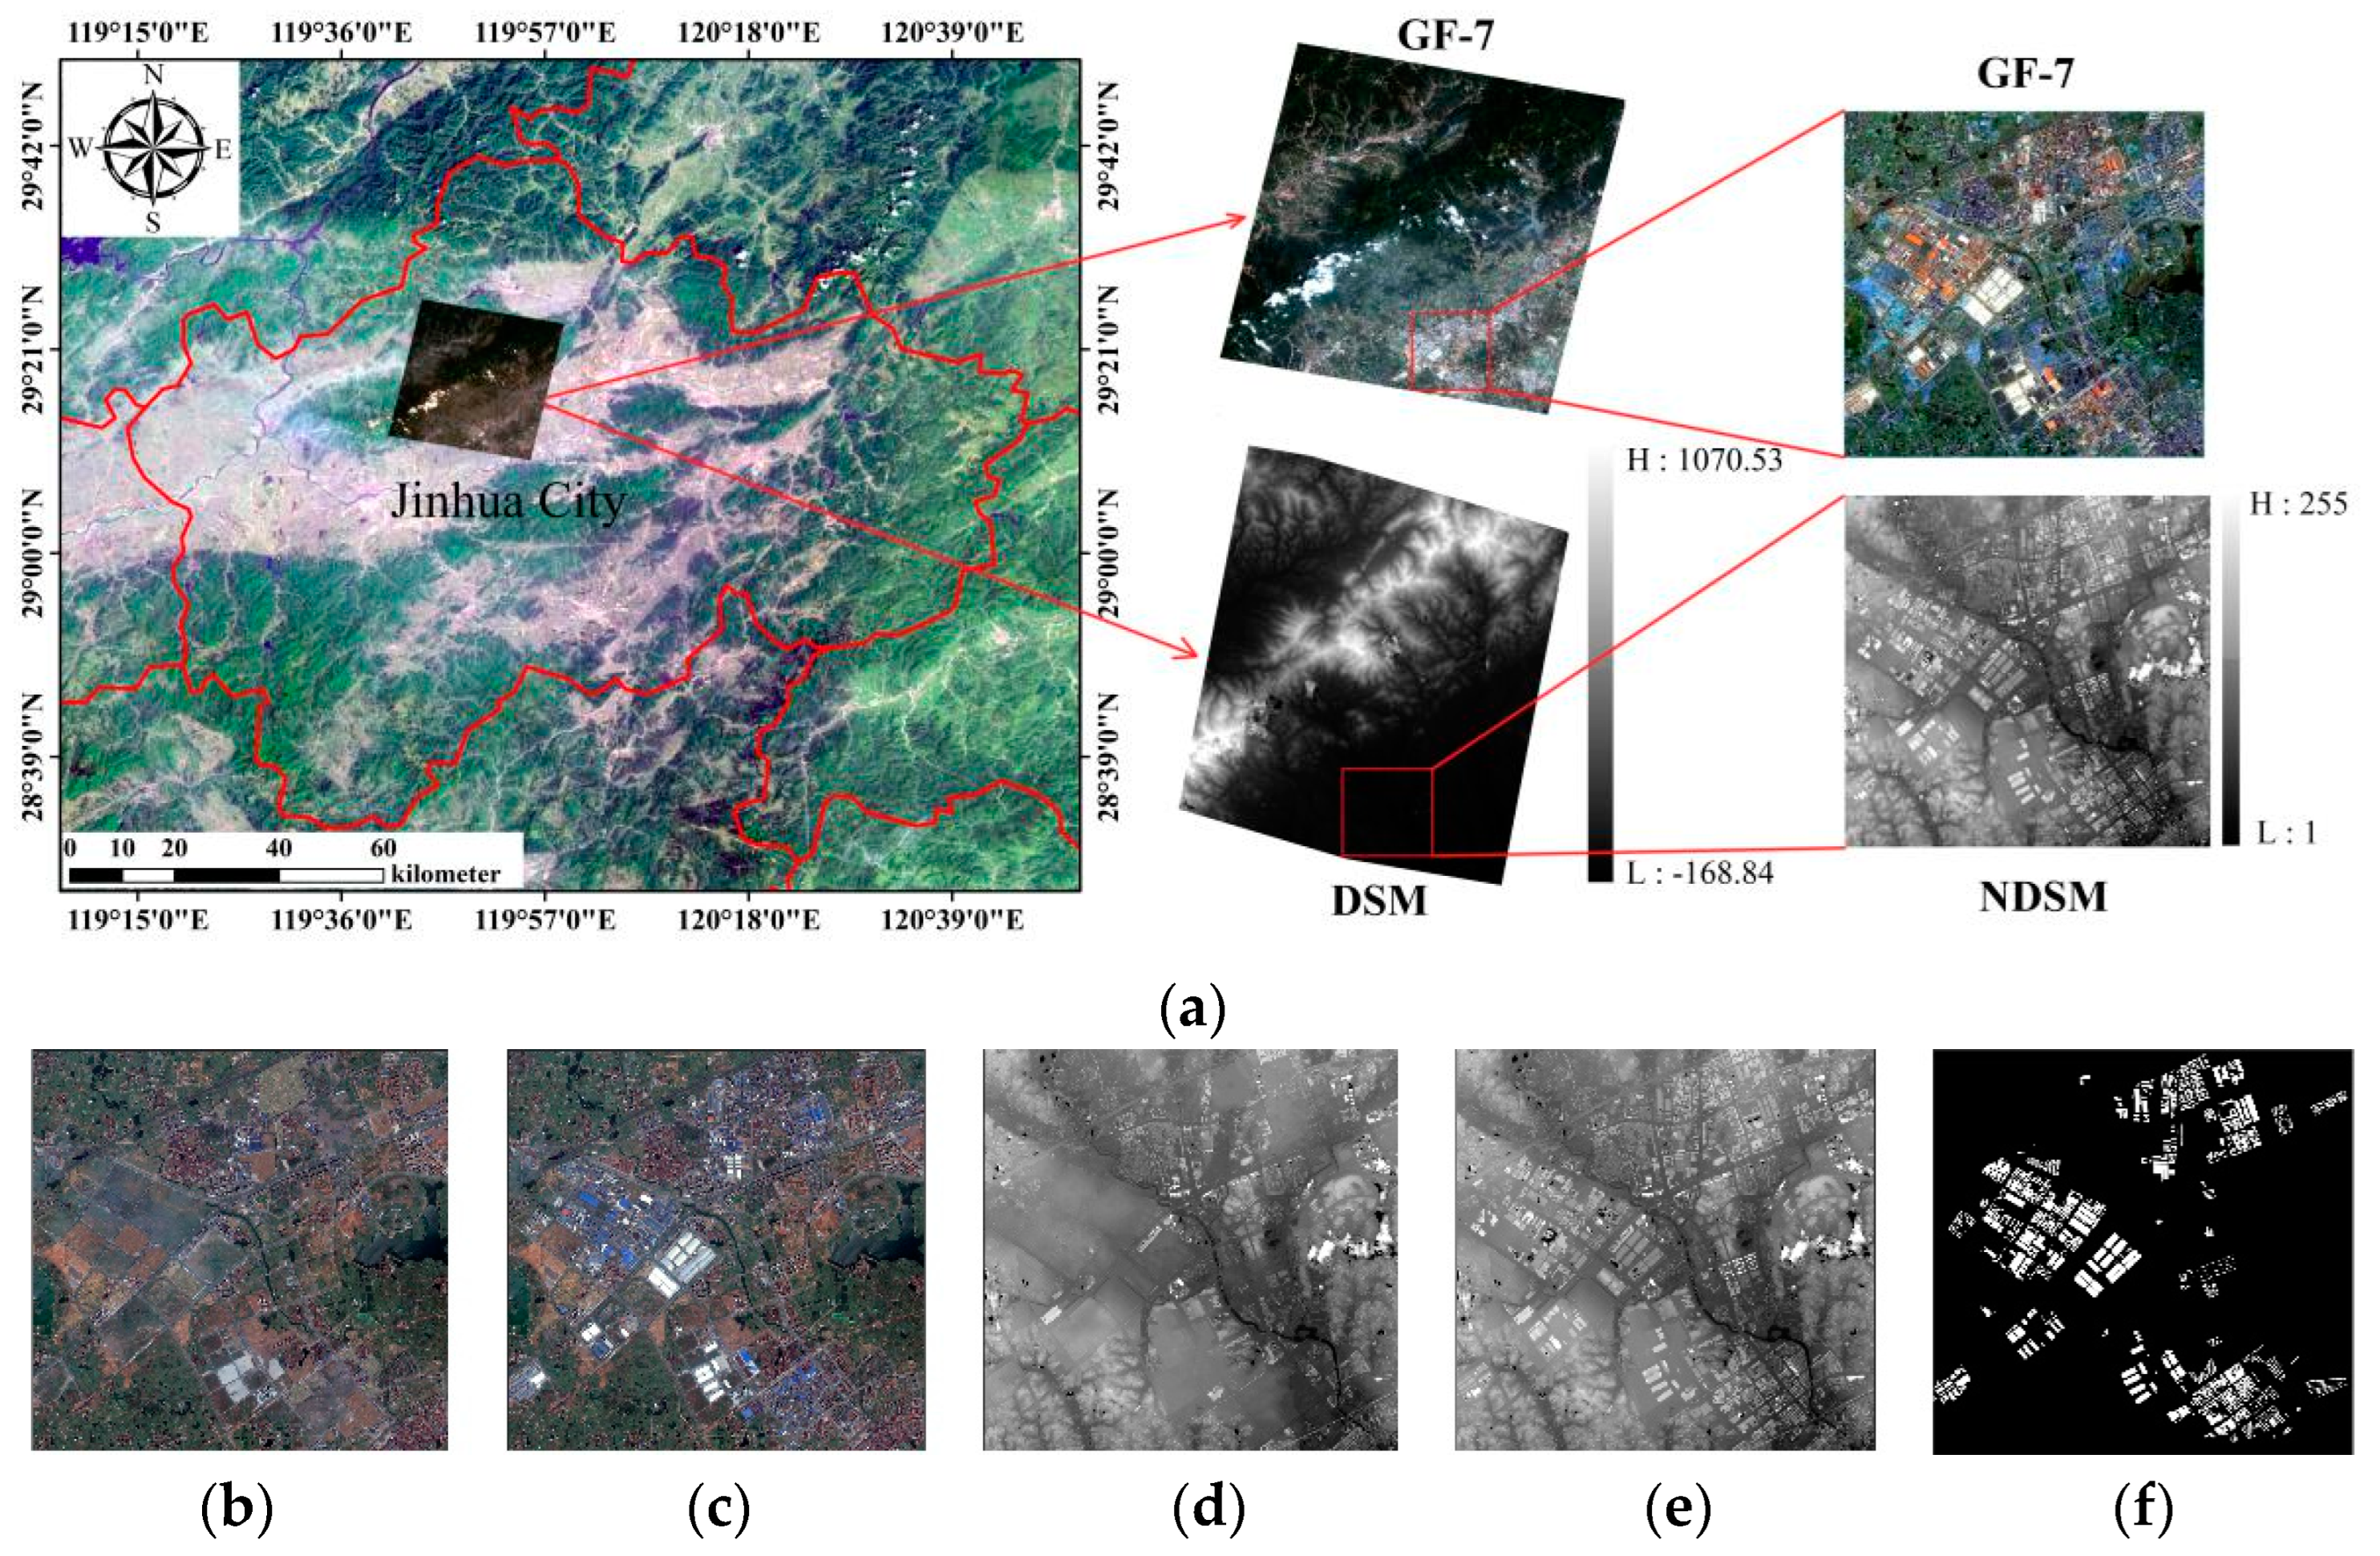
4.1. Data Sources and Study Area

The experimental data were obtained from China’s first sub-meter high-resolution optical stereo mapping satellite, GF-7. It carries two high-resolution optical line array cameras for continuous observation and acquisition of high-overlap, high-definition optical stereo images. The dual-line array cameras include forward-looking (+26° inclination) and backward-looking (−5° inclination) cameras. The backward-looking camera can acquire panchromatic (0.65 m spatial resolution) and multispectral (containing near-infrared, red, green, and blue bands with a 2.6 m spatial resolution) images. We used the Gram–Schmidt image fusion algorithm to fuse pre-processed 0.65 m hind-view panchromatic images with 2.6 m multispectral images to generate 0.65 m high-resolution images and a high-precision DSM with a spatial resolution of 1 m. This was carried out by matching the high-overlap stereo images of the front-view and hind-view cameras based on the RPC model.
The study area was in Jinhua City, Zhejiang Province, China, and had a total area of 47.76 km2, as shown in Figure 5a. Since the satellite data archive is relatively small at present, we only obtained single-time phase data of the study area for May 2020. So, this image was used as the post-temporal phase data source. Based on this, the pre-temporal phase data were obtained by changing the region simulation. The dual-temporal phase data are shown in Figure 5b–f.
Figure 5. Study area location and bi-temporal data sources. (a) Study area map, (b) T1 time image, (c) T2 time image, (d) T1 time DSM, (e) T2 time DSM, and (f) ground truth map.

4.2. Experimental Parameter Settings

The experimental operating environment was an Intel(R) Xeon(R) E5-2683 CPU with 64 GB of RAM and an NVIDIA GeForce RTX 2080Ti graphics card with 11 GB of video memory running the Tensorflow deep learning framework. Due to the limitations of computer memory, we cropped the study area data into small 256 × 256-pixel images in the form of a sliding window. There were 5040 images in the training set and 992 images in the validation set. Another non-repeating area of about 4 km2 was selected as the test set. In the training process, we used the learning-rate-adaptive optimization algorithm (Adam) as the optimizer. The initial learning rate was set to 1 × 10⁻⁴. The exponential decay factors beta1 and beta2 (for the first- and second-order moment estimates, respectively) were set to the default values of 0.9 and 0.999, respectively. The eps was set to the default value of 1 × 10⁻⁷. The number of high-resolution remote sensing images and DSMs in one batch was 4, and the number of training iterations was set to 50 batches. A cross-entropy loss function was selected that has the formula shown below.
L o s s = 1 N i = 1 N y i log p y i + 1 y i log 1 p y i
where N represents the total number of pixels, i is the ith pixel, p ( y i ) is the true change label, y i = 1 is the predicted change pixel (indicating change), and y i = 0 indicates no change.

4.3. Evaluation Metrics

Five evaluation metrics are used to evaluate the effect of change detection: precision, overall accuracy (OA), recall, F1-score, and kappa coefficient. Precision indicates the ratio of the number of correctly predicted change pixels to the total number of predicted change pixels. OA indicates the ratio of the number of correctly predicted pixels to the total number of pixels. Recall indicates the ratio of the number of correctly predicted change pixels to the total number of actual change pixels. F1-score is the summed average of precision and recall. The kappa coefficient is used to check whether the predicted and actual results of the change detection model are consistent. The calculation formulas of the five metrics are as follows:
P r e c i s i o n = T P T P + F P
O A = T P + T N T P + F P + T N + F N
R e c a l l = T P T P + F N
F 1 = 2 P r e c i s i o n R e c a l l P r e c i s i o n + R e c a l l
K a p p a = p o p e 1 p e
where TP indicates true positives (number of images predicted to have changed that actually changed), FP denotes false positives (number of images predicted to have changed that were actually unchanged), FN denotes false negatives (number of images predicted to be unchanged that actually changed), and TN denotes true negatives (number of images predicted to be unchanged that were actually unchanged). P o denotes the prediction accuracy, and P e denotes the chance consistency. In addition, due to the randomness in the process of model training and fitting, the inference results still have small deviations, even when the models are trained under the same learning strategy. To ensure the reliability of the experimental results, we trained each method five times and calculated the mean and variance of the composite evaluation index F1-score to reduce the effect of random errors.

4.4. Comparison of Experimental Results

We conducted a cross-sectional comparison experiment between the proposed MAHNet change detection algorithm and some traditional change detection methods, deep learning change detection algorithms, and popular semantic segmentation algorithms that only use high-resolution remote sensing images as input data for 2D change detection.
(1)
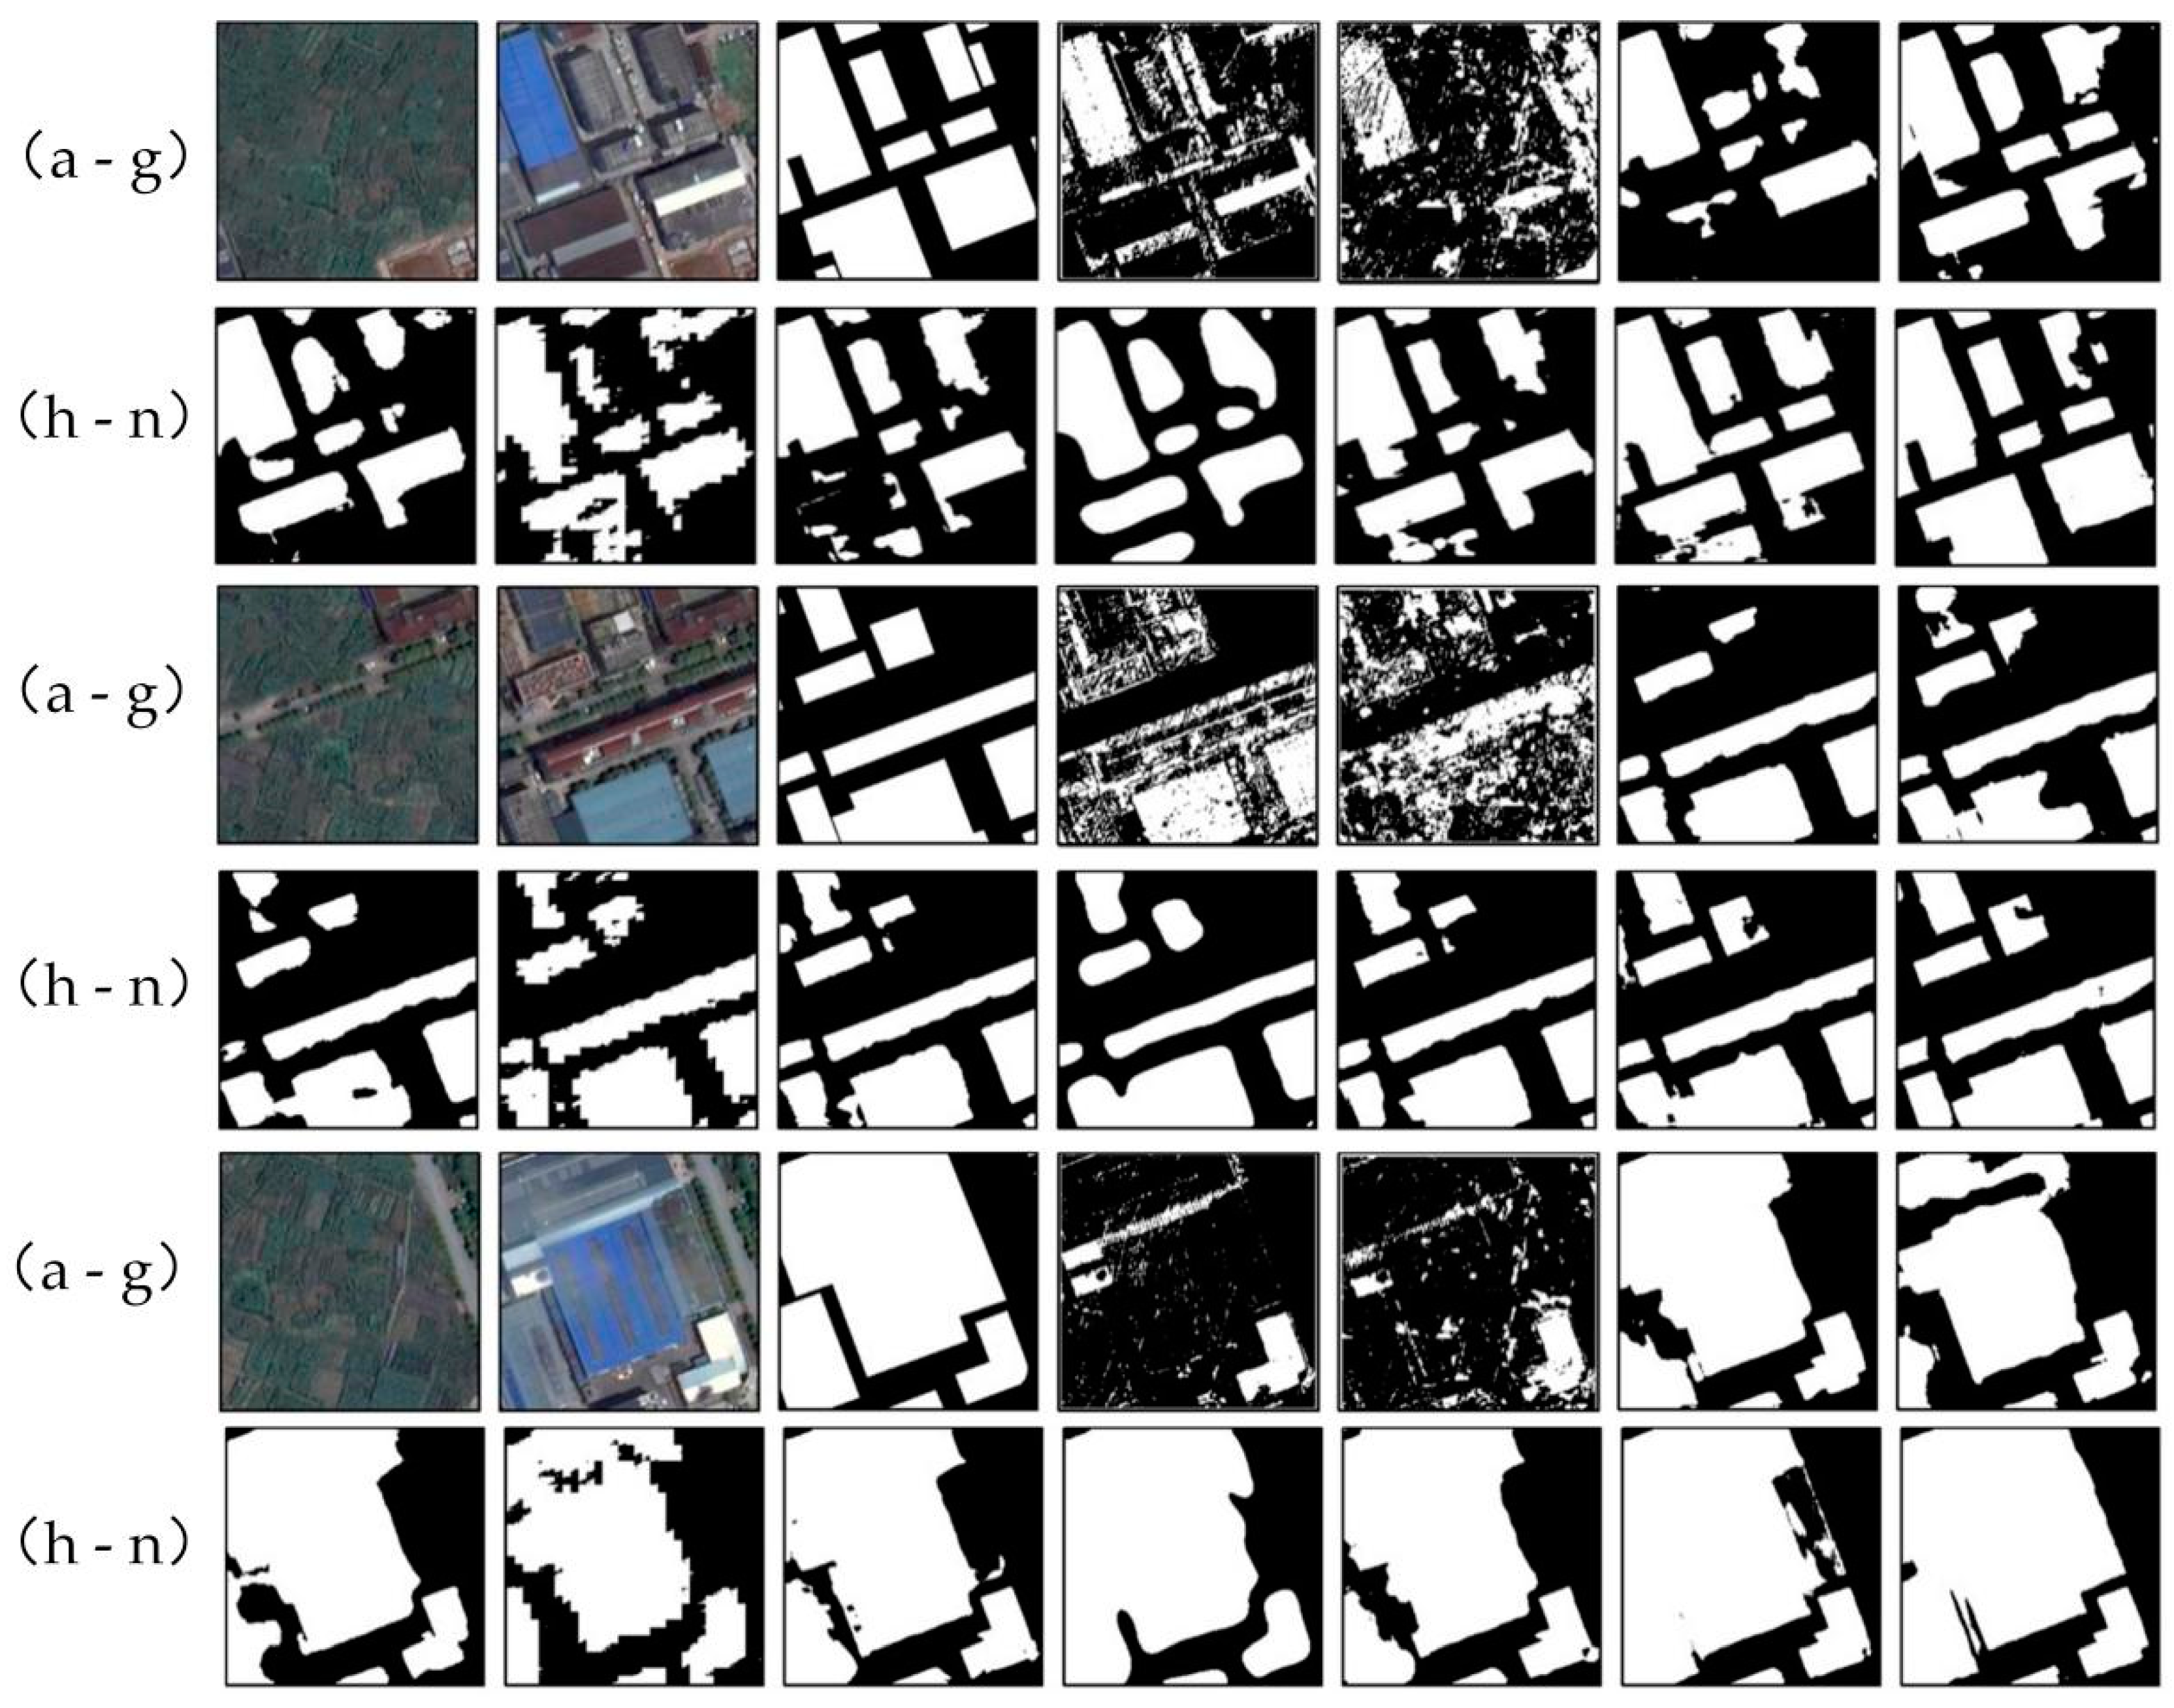
Traditional change detection methods: These included change vector analysis (CVA) [23] and iterative weighted multivariate change detection (IRMAD) [62]. CVA determines the area of change by analyzing the change vector of dual-time-phase remote sensing images. The magnitude of the change vector can determine the degree of change, and its direction can discriminate the type of feature change. IRMAD is a typical correlation analysis (MAD) extension of the change detection algorithm.
(2)
Deep learning change detection algorithms: These were the fully convolutional early fusion network (FC-EF) [40], the fully convolutional Siamese network (FC-Siam-Conv) [40], and the fully convolutional Siamese difference network (FC-Siam-Diff) [40]. These are FCNN change detection algorithms that use different fusion strategies.
(3)
Semantic segmentation algorithms: We used the following coding- and decoding-structure-based classical image segmentation algorithms: the fully convolutional network (FCN) [63], the semantic segmentation network (SegNet) [64], the U-shaped neural network (UNet) [65], and a nested U-Net architecture (Unet++), as well as the high-resolution network (HRNet) [66], which is an advanced algorithm for human pose estimation. Unlike most image segmentation algorithms that serially connect convolutional layers and finally recover the image spatial resolution by up-sampling, this network connects convolutional layers in parallel to form a multiple sub-network from high to low resolution and iteratively fuses the high-resolution features generated from the high to low sub-networks. This ensures that the features have high-spatial-resolution details and a guaranteed expression effect.

4.5. Comparison of Experimental Results

As shown in Table 1, the results of the quantitative experiments in the GF-7 dataset show that MAHNet provides the best change detection. The five evaluation indexes for MAHNet were OA = 97.44% (mean = 97.41%; var = 0.08%), precision = 92.71%, recall = 92.47%, F1-score = 92.59% (mean = 92.47%; var = 0.12%), and kappa coefficient = 91.01%, which were the highest of all methods and indicate more balanced performance. This fully indicates that the fusion of high-resolution remote sensing images and the DSM enriches the expression of change features. It achieves multi-dimensional feature mining of the RGB features of high-resolution remote sensing images and the height features of DSMs to form complementary information that achieves mutual supplementation between different modal features, thus making the model more robust and noise resistant.
Table 1. Quantitative evaluation results of different methods on the GF-7 dataset.
As shown in Figure 6, the traditional change detection methods CVA and IRMAD, which are based on statistical models, are significantly less adaptable and have a more general change detection effect in monitoring objects such as urban buildings. Compared with these, the change detection accuracy rates of the classical semantic segmentation algorithms FCN, UNet, SegNet, and UNet++ were significantly better. Among them, the depth-supervised semantic segmentation algorithm based on UNet++ performed the best, with an accuracy rate of 88.08%. This largely stems from its dense skip-connection structure, which improves its multi-level and multi-scale feature extraction capability. However, these methods are generally characterized by low recall values and incomplete change detection polygons. In addition, change detection algorithms such as FC-EF, FC-Siam-Conv, and FC-Siam-Diff have the problem of high misdetection rates and a poor balance between recall and precision. The HRNet algorithm shows good performance in 2D change detection from remote sensing images with high spatial resolution, and the results of each evaluation index are more balanced. Among them, the comprehensive evaluation index, F1-score, reached 85.03% and the recall was significantly improved. Hence, it is the segmentation method with the best comprehensive effect among all the 2D change detection methods and showed strong adaptability to the GF-7 dataset.
Figure 6. Results of different methods in detecting small scenarios. (a) T1 time images, (b) T2 time images, (c) ground truth maps, (d) CVA, (e) IRMAD, (f) FC-EF, (g) FC-Siam-Conv, (h) FC-Siam-Diff, (i) FCN, (j) UNet, (k) SegNet, (l) UNet++, (m) HRNet, and (n) MAHNet.

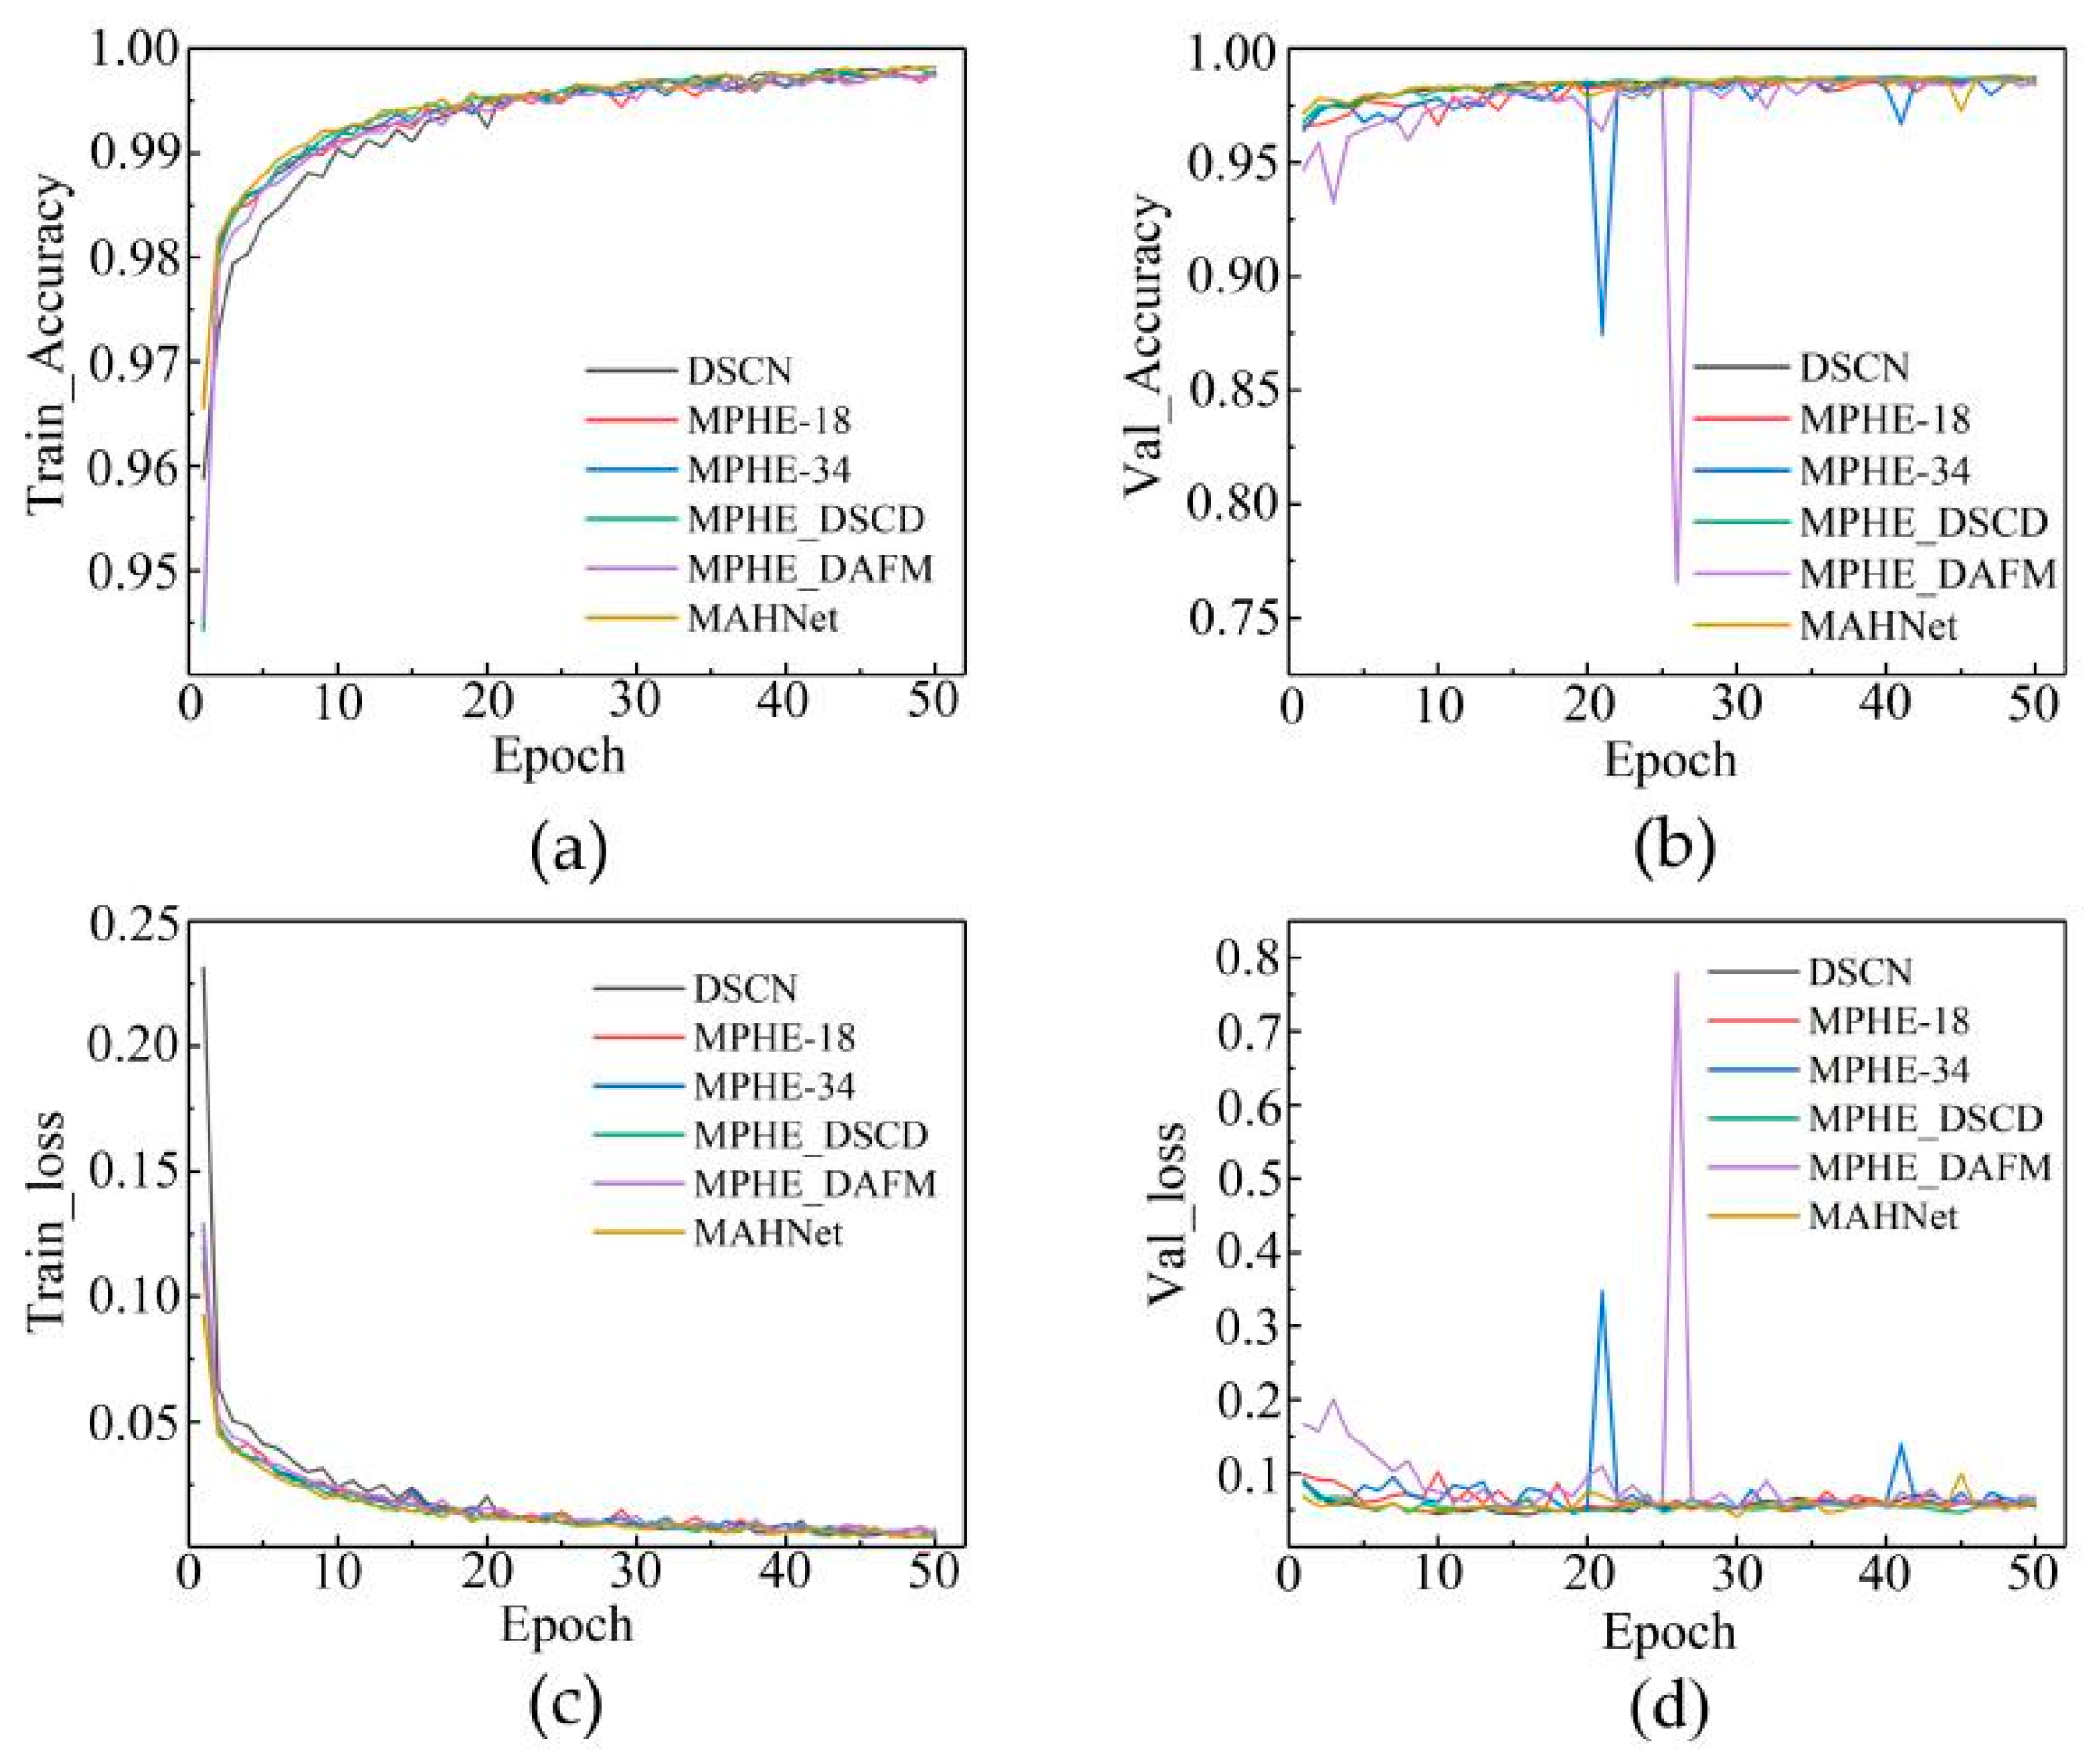
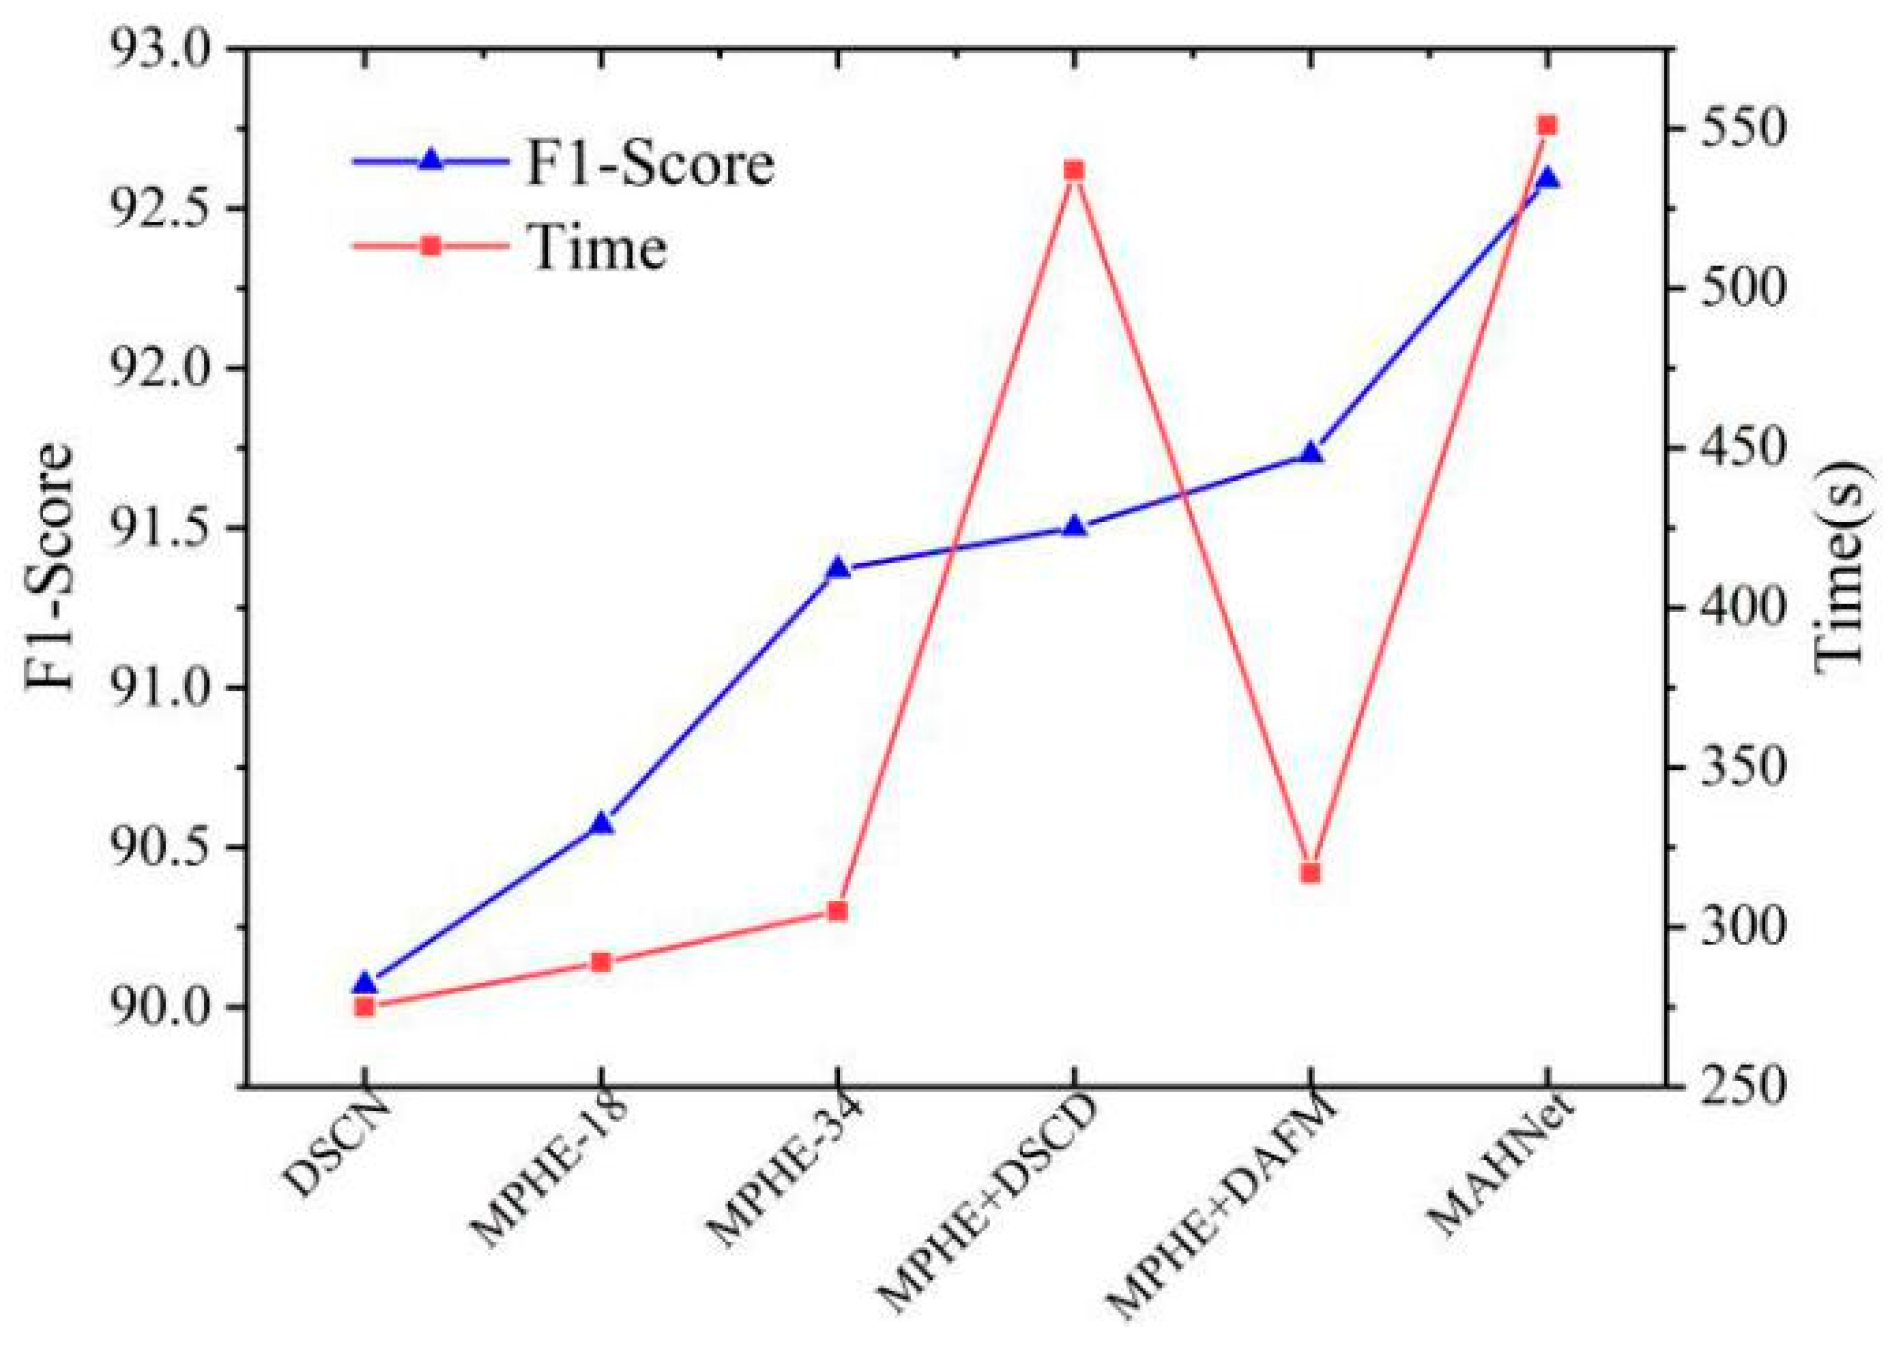
4.6. Multi-Path Hybrid Coding Comparison Experiment

We propose a multi-path hybrid coding network structure that integrates primary and secondary encoders and an intermediate fusion layer for two different modalities of GF-7 optical images and DSM data. Designing targeted independent encoders according to different data properties and modes can complete the complex feature learning of multimodal data more efficiently than Siamese neural networks, which share a single model. To find the best encoders for different data, a neural network model is designed to learn the complex features of multimodal data. To find the best feature extraction unit for different data, we combine different feature extraction methods and analyze the hybrid encoder combination that is most suitable for GF-7 and DSM feature extraction through comparative experiments.
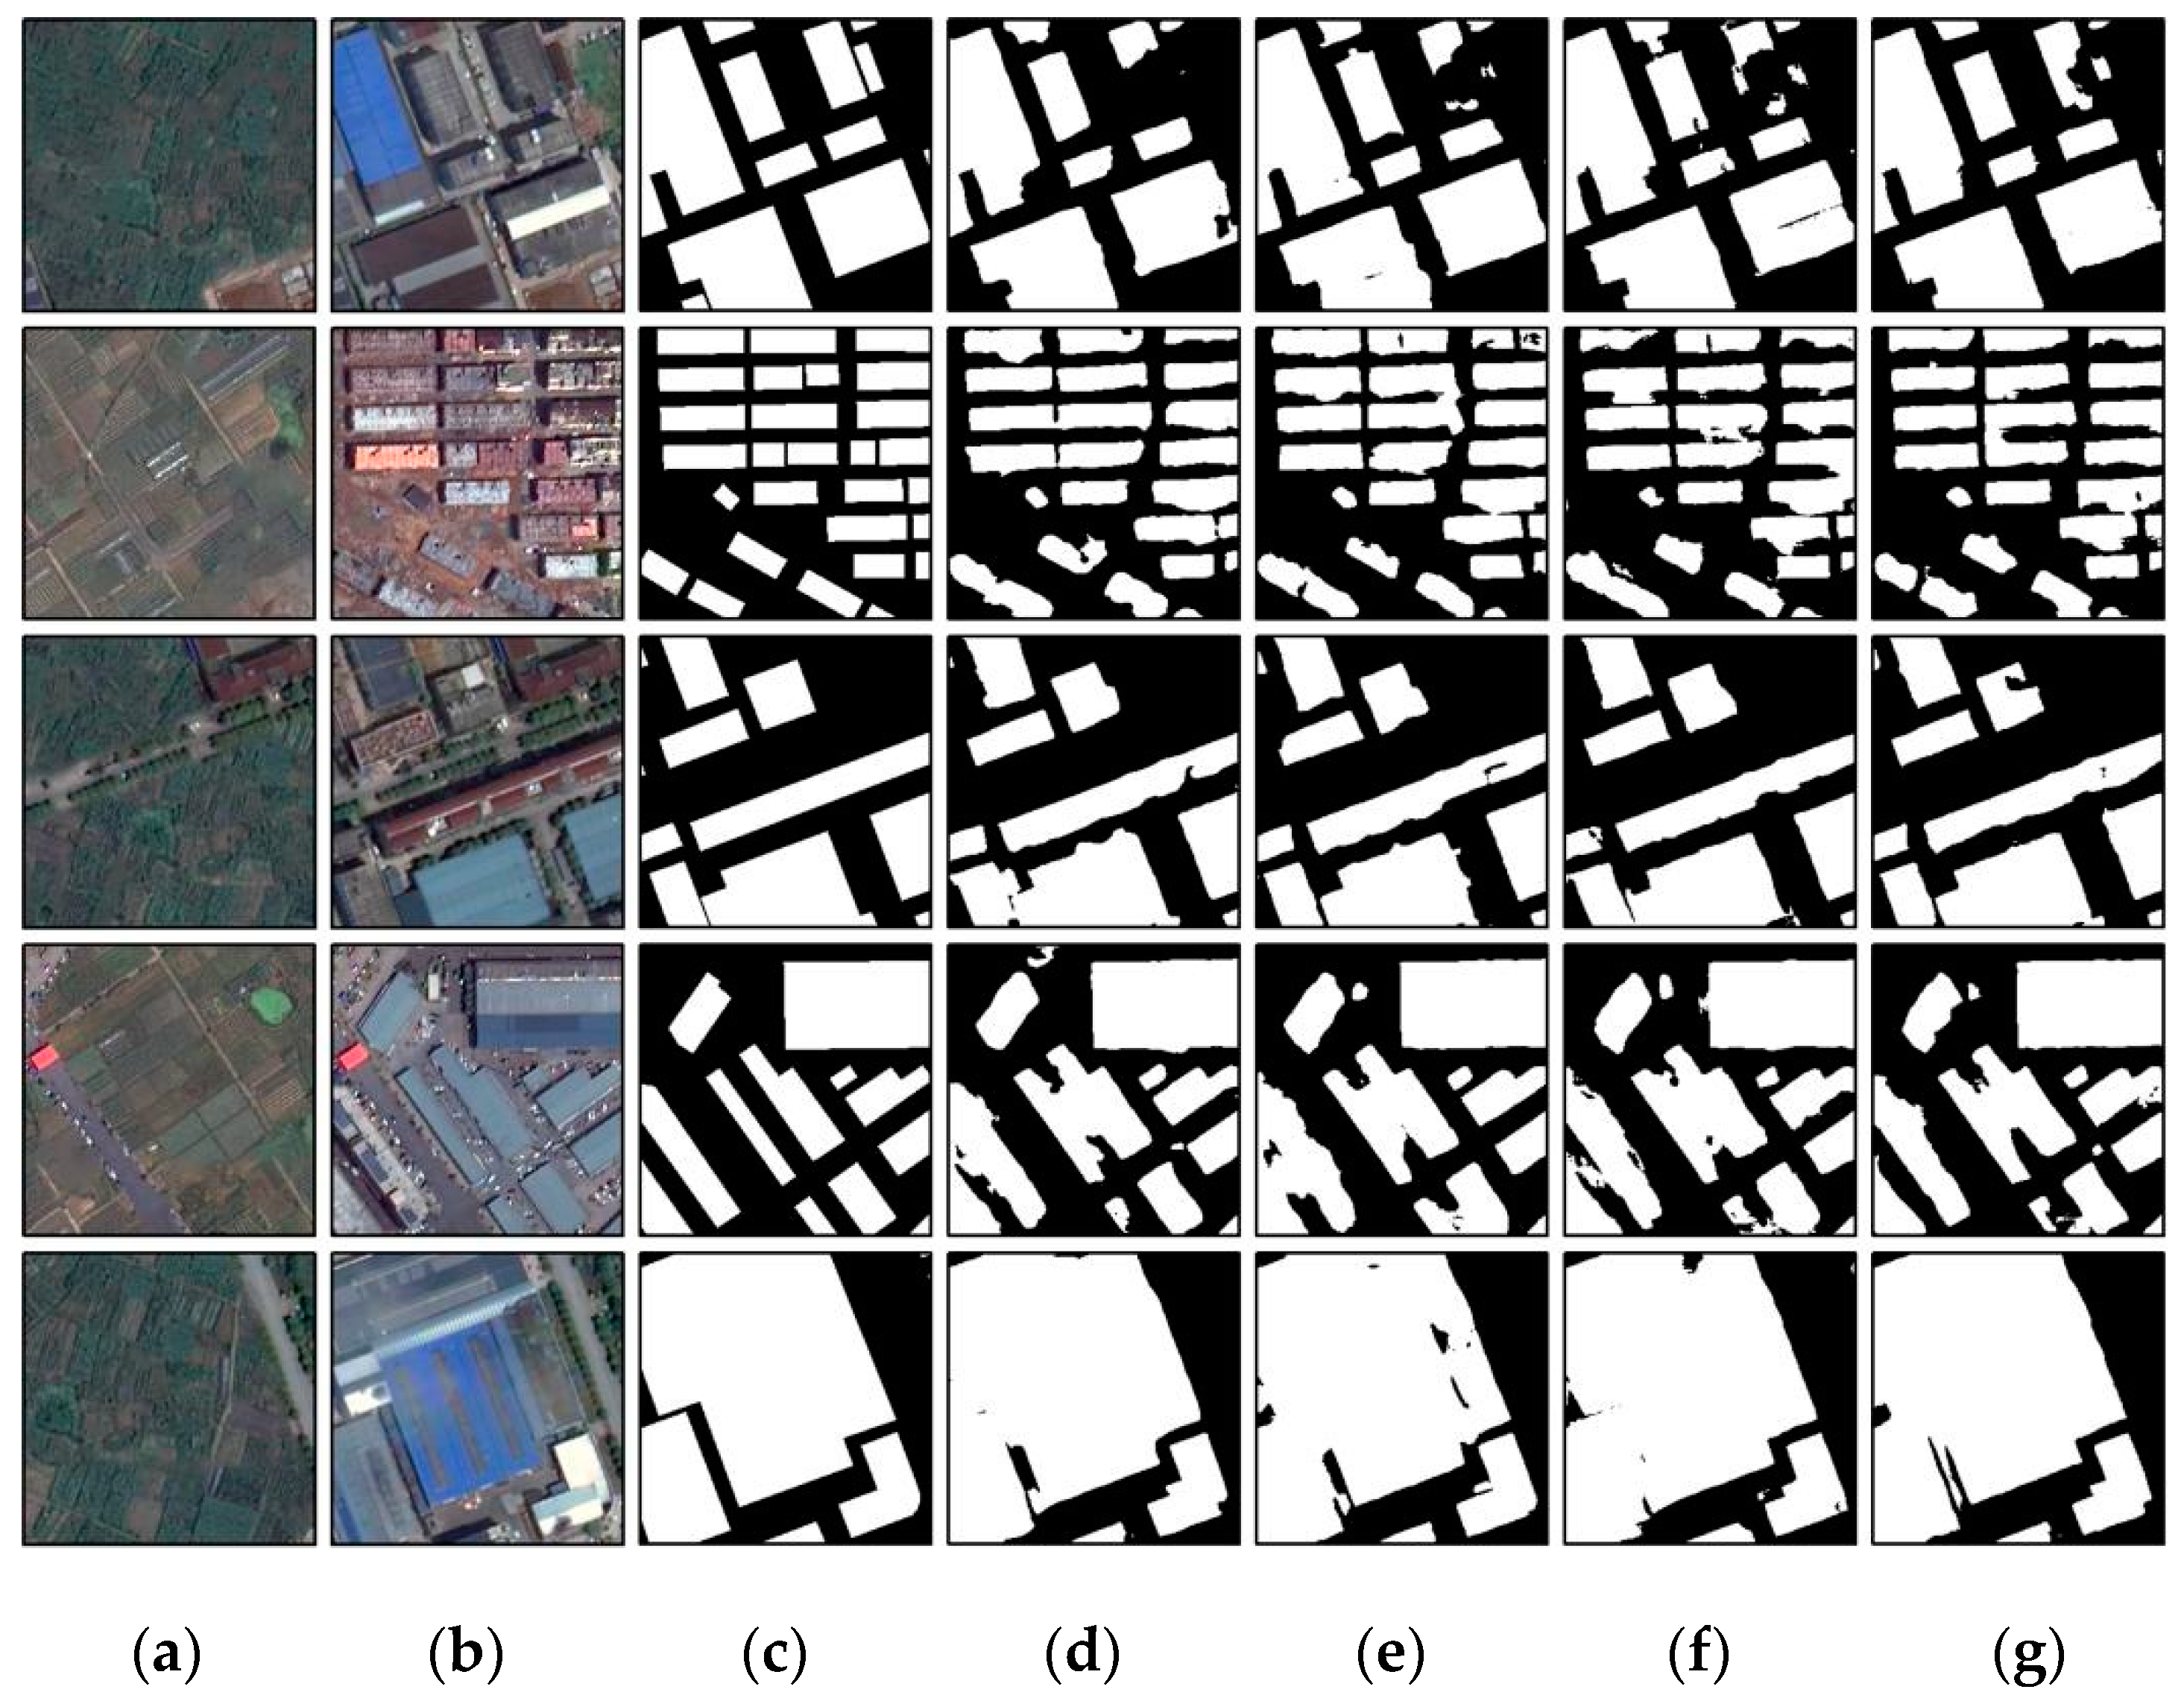
  • Deep Siamese convolutional neural network (DSCN): This network has two identical encoders. Dual-temporal high-resolution remote sensing images and dual-temporal DSM data are fed into these two identical encoding structures for feature learning and extraction tasks, respectively.
  • Multi-path hybrid coding network (MPHE-18/34): This network consists of two different coding structures: (1) a main encoder consisting of a ResNet and (2) a sub-encoder consisting of a set of simple FCNNs. To verify the effect of combining different residual networks with FCNNs, comparative experiments were conducted using two lightly quantized residual networks, ResNet-18 and ResNet-34, paired with FCNNs (Table 2).
    Table 2. Multi-path hybrid coding comparative experiment results.
The precision value of DSCN change detection is the highest among the three methods, at about 91.28%. However, all other evaluation metrics of this model are poor. The MPHE-34 experiment performed the best, which used ResNet-34 as the primary encoder for image feature extraction and a simple FCNN as the secondary encoder for DSM feature extraction. As shown in Figure 7, the boundary of the changed area detected by MPHE-34 is clearer, flatter, and finer, and there is less over-segmentation of neighboring buildings with overlapping boundaries. The comprehensive change detection performance is the strongest, with the recall accuracy evaluation index of the MPHE-34 hybrid coding structure being 94.23%, which is 1.4% higher than that of MPHE-18 and 5.33% higher than that of DSCN. The leakage detection phenomenon is also improved compared with the first two methods; however, we also find that precision decreases to a certain extent, although its comprehensive evaluation index (F1-score) is 91.37%, which is 0.8% higher than that of MPHE-18, and the variance is controlled at about 0.11%. Meanwhile, the OA and kappa evaluation indexes are significantly higher than those of other methods. The multi-path hybrid coding network uses a set of simple FCNNs for the DSM highly variable information shallow learning task. This can reduce the complexity of the model and improve the learning efficiency relative to that using deep neural networks that are unaffected by complex redundant information. For high-resolution images with high feature complexity, ResNet-34 used as the main encoder can capture more global contextual information, greatly improve the problem of inefficient information transfer and information loss in deep neural networks, alleviate the gradient disappearance problem, ensure the integrity and reliability of most of the change information propagation, and, therefore, detect more comprehensive change information.
Figure 7. Experimental results of multi-path coding comparison: (a) T1 time images, (b) T2 time images, (c) ground truth map, (d) DSCN, (e) MPHE-18, and (f) MPHE-34.

4.7. Ablation Experiment

To verify the effectiveness of the different modules of MAHNet, we qualitatively analyzed the MPHE, the DSCD, and the DAFM by ablation experiments (Table 3).
Table 3. Comparison of results of ablation experiments.

4.7.1. Effectiveness of the DAFM

The qualitative comparative experiments that introduced the DAFM into the backbone network MPHE (Table 3) found that the precision and kappa values of change detection were improved by about 1.15% and 0.46%, respectively, with a small loss in recall. This indicates that the predicted results are more consistent with the real change detection results. This is attributed to the fact that the dual self-attentive fusion module can improve the fusion of high- and low-level spatial features, enhance the discriminative ability of local change information in the global view, and, thus, achieve more accurate classification of the possible change elements in the image.

4.7.2. Effectiveness of the DSCD

Adding the DSCD module to the MPHE backbone network increased the values of the OA, precision, F1-score, and kappa coefficient evaluation indexes, among which precision was improved, most obviously, by about 1.69%. This proves that stimulating feature reuse via the DSCD module allows the change features to be propagated and used efficiently, thus improving detection. However, this comes at the cost of losing a certain rate of full detection, although the F1-score overall evaluation index still has a slight improvement compared with that of MPHE.

4.7.3. Effectiveness of the DSCD + the DAFM

Finally, the DSCD module and the DAFM were added to the MPHE backbone network at the same time, and from a quantitative perspective, the experimental results showed a significant improvement in all assessment metrics except for a decrease in the check-all rate. Among them, the change detection accuracy shows a more noticeable improvement. In addition, the increments in OA, precision, F1-score, and kappa are 0.53%, 4.02%, 1.22%, and 1.55%, respectively, and the performance of precision and recall is more balanced. As shown in Figure 8, the proposed MAHNet detects the change region more accurately and flatly. The false detection rate and the hole phenomenon are significantly improved, and the boundary localization is more accurate. This is since the combined model of the DSCD and the DAFM can efficiently propagate and use the high-level semantic features and detailed change information captured from the complex 3D feature combinations of multimodal data. Precision and recall are well balanced, which makes the model more robust and thus effectively improves the final change detection effect.
Figure 8. Comparison results of ablation experiments. (a) T1 time images, (b) T2 time images, (c) ground truth maps, (d) MPHE, (e) MAHNet without DSCD, (f) MAHNet without DAFM, and (g) MAHNet.

5. Discussion

We discuss some of the training details of the change detection experiments in terms of the inference efficiency of the model. The changes in evaluation metrics, such as accuracy and loss during training, are compared between MAHNet and the partial comparison methods via modular ablation experiments under a fixed learning strategy. The evaluation index changes of MAHNet and some comparison methods during the training process are shown in Figure 9. Compared with the 2D change detection learning task carried out by popular semantic segmentation algorithms such as FCN, UNet, SegNet, UNet++, and HRNet for high-resolution remote sensing images, the 3D change detection method integrating high-resolution remote sensing images and the DSM is more robust in both the training and validation sets. The accuracy and loss curves converge significantly faster and are more stable throughout the training process, and the combined performance in accuracy and loss is better than that of other comparative methods and is more robust.
Figure 9. Variations in accuracy and loss during the training process for MAHNet and some comparison methods. (a) Variations in accuracy in the training and (b) validation datasets; (c) variations in loss in the training and (d) validation datasets.
Figure 10 shows the curves of change in each assessment index during the training process for the MPHE comparison experiment and the three-module ablation experiment. MAHNet initially converges faster and tends to converge at about the 30th epoch. The loss value in the validation set reaches 0.04099, which is the best convergence effect. Although the other networks perform more smoothly in the training set, they all converge slightly worse than MAHNet in the validation set, with the MPHE-34 and MPHE + DAFM fused network models showing larger fluctuations in the validation process and poorer performance in the validation set. This shows that MAHNet has strong noise immunity in the training process.
Figure 10. Variations in accuracy and loss during the training process for different modules. (a) Variations in accuracy in the training and (b) validation datasets; (c) variations in loss in the training and (d) validation datasets.
In order to visualize the change detection performance of different algorithms, we have also introduced receiver operating characteristic (ROC) curves to evaluate the change detection effect. Each point on the ROC reflects the perceptibility to the same signal stimulus. A ROC curve is drawn by calculating the detection rate (TPR) and the false detection rate (FPR), where the closer the line is to the upper left, the higher is the detection rate and the better is the detection performance of the model change. The area under the ROC curve is called the area under curve (AUC) and the closer the area is to 1, the better is the detection. The ROC curves of different models are shown in Figure 11. Compared to the comparative algorithms FC-EF, FC-Siam-Covn, FC-Siam-Diff, FCN, SegNet, UNet, UNet++, and HRNet, MAHNet has the highest TPR, better sensitivity, and better check-all effect. In contrast, FPR performed the lowest, indicating that MAHNet had a lower probability of error; its AUC = 0.9547, which is higher than HRNet’s AUC = 0.9121 by 0.0426, making it the best performing of the comparison methods.
Figure 11. Comparison of ROC curves of different models.
Finally, we compared the inference efficiency of MAHNet using the test set. Although our method achieves good change detection performance, it contains a large number of model parameters and has a long inference time, as shown in Figure 12. MAHNet has the best F1-score among all methods; however, it is less efficient in reasoning in the test set. The DAFM significantly improves the change detection performance, while only adding a small number of parameters, while the DSCD module improves the propagation and utilization of features and improves change detection to a certain extent but takes longer to infer due to the addition of more parameters and the more complex spatial structure used in the up-sampling process. MAHNet has the best integrated change detection but, with increases in the number of model parameters, the GPU’s computational cost increases. The inference time of MAHNet increases by 246 s compared with that of the base network MPHE, so the inference efficiency is poor.
Figure 12. Comparison of efficiency of different models.

6. Conclusions

This paper proposes a 3D change detection method called MAHNet, which fuses high-resolution remote sensing imagery with a DSM for multi-path self-attentive hybrid coding in three parts: a multi-path hybrid encoder, a dual self-attentive fusion module, and a dense skip-connection decoder. Targeted feature extraction methods are designed for remote sensing data with two different modalities, namely, high-spatial-resolution remote sensing images and DSMs. This enables feature mining and learning tasks with different types of modal data and improves the efficiency of multi-level and multi-scale feature learning between different types of data. In addition, to enhance the multimodal depth feature fusion and expression effect, we designed a dual self-weighted attention multimodal depth feature fusion structure based on channel attention and spatial attention guidance. This improves the fusion and expression of the high-level abstract features and low-level spatial features in multimodal data by establishing dual-channel feature attention and interdependence of 3D change information. Finally, a dense skip-connection decoder is designed to realize the flexible use of features and improve their utilization and propagation efficiency.
Since there is no applicable public dataset, we conducted qualitative and quantitative experiments and evaluations using the GF-7 dataset, which we produced ourselves. The experimental results show that in complex urban remote sensing scenes, MAHNet provides balanced and excellent performance in terms of all evaluation indexes when applied to the test set. The network has strong robustness and noise immunity, a high comprehensive evaluation index (F1-score = 92.59%), significantly reduced leakage detection and false detection rates, more accurate boundary positioning of areas of change, significantly improved void and boundary errors in the detected change area, and a more complete change polygon, which proves the feasibility of the proposed method. In future work, we will quantitatively validate the method on more datasets and, at the same time, focus on making the network model and change detection scheme more lightweight with small samples and weak supervision. This will help to realize rapid and accurate extraction of surface change information and reduce the over-dependence on change samples so that the method can be better applied to geographic condition monitoring.

Author Contributions

Conceptualization, J.P.; methodology, X.L.; resources, J.P.; data curation, J.P.; formal analysis, B.S. and Z.C.; investigation, X.L.; writing—original draft preparation, X.L.; writing—review and editing, J.P. and X.L.; visualization, W.C.; supervision, J.P. All authors have read and agreed to the published version of the manuscript.

Funding

This work is supported by the National Natural Science Foundation of China (Grant No. 41801394) and the General Project of Chongqing Natural Science Foundation (Grant No. cstc2020jcyj-msxmX0517).

Institutional Review Board Statement

Not applicable.

Data Availability Statement

Not applicable.

Acknowledgments

We sincerely appreciate Yong Hu of the Chongqing Institute of Planning and Natural Resources Monitoring for providing the GF-7 experimental data. The helpful comments and constructive suggestions of academic editors and reviewers.

Conflicts of Interest

The authors declare no conflict of interest.

References

  1. Singh, A. Review Article Digital change detection techniques using remotely-sensed data. Int. J. Remote Sens. 2010, 10, 989–1003. [Google Scholar] [CrossRef] [Green Version]
  2. Ban, Y.; Yousif, O. Change Detection Techniques: A Review. In Multitemporal Remote Sensing; Remote Sensing and Digital Image Processing; Springer: Cham, Switzerland, 2016; pp. 19–43. [Google Scholar] [CrossRef]
  3. Asokan, A.; Anitha, J. Change detection techniques for remote sensing applications: A survey. Earth Sci. Inform. 2019, 12, 143–160. [Google Scholar] [CrossRef]
  4. Lulla, K.; Nellis, M.D.; Rundquist, B. Celebrating Geocarto International’s Reach. Geocarto Int. 2010, 25, 1–2. [Google Scholar] [CrossRef]
  5. Yang, Y.; Zhou, Q.; Gong, J.; Wang, Y. An integrated spatio-temporal classification method for urban fringe change detection analysis. Int. J. Remote Sens. 2011, 33, 2516–2531. [Google Scholar] [CrossRef]
  6. Yan, J.; Wang, L. Suitability Evaluation for Products Generation from Multisource Remote Sensing Data. Remote Sens. 2016, 8, 995. [Google Scholar] [CrossRef] [Green Version]
  7. Pan, Z.; Yu, J.; Huang, H.; Hu, S.; Zhang, A.; Ma, H.; Sun, W. Super-Resolution Based on Compressive Sensing and Structural Self-Similarity for Remote Sensing Images. IEEE Trans. Geosci. Remote Sens. 2013, 51, 4864–4876. [Google Scholar] [CrossRef]
  8. Rostami, M.; Michailovich, O.; Wang, Z. Image deblurring using derivative compressed sensing for optical imaging application. IEEE Trans. Image Process. 2012, 21, 3139–3149. [Google Scholar] [CrossRef] [Green Version]
  9. Kashter, Y.; Levi, O.; Stern, A. Optical compressive change and motion detection. Appl. Opt. 2012, 51, 2491–2496. [Google Scholar] [CrossRef] [Green Version]
  10. Marcia, R.F. Compressed sensing for practical optical imaging systems: A tutorial. Opt. Eng. 2011, 50, 072601. [Google Scholar] [CrossRef] [Green Version]
  11. Huang, X.; Cao, Y.; Li, J. An automatic change detection method for monitoring newly constructed building areas using time-series multi-view high-resolution optical satellite images. Remote Sens. Environ. 2020, 244, 111802. [Google Scholar] [CrossRef]
  12. Leichtle, T.; Geiß, C.; Lakes, T.; Taubenböck, H. Class imbalance in unsupervised change detection—A diagnostic analysis from urban remote sensing. Int. J. Appl. Earth Obs. Geoinf. 2017, 60, 83–98. [Google Scholar] [CrossRef]
  13. Ma, L.; Liu, Y.; Zhang, X.; Ye, Y.; Yin, G.; Johnson, B.A. Deep learning in remote sensing applications: A meta-analysis and review. ISPRS J. Photogramm. Remote Sens. 2019, 152, 166–177. [Google Scholar] [CrossRef]
  14. Zhang, X.; Xiao, P.; Feng, X.; Yuan, M. Separate segmentation of multi-temporal high-resolution remote sensing images for object-based change detection in urban area. Remote Sens. Environ. 2017, 201, 243–255. [Google Scholar] [CrossRef]
  15. Khelifi, L.; Mignotte, M. Deep Learning for Change Detection in Remote Sensing Images: Comprehensive Review and Meta-Analysis. IEEE Access 2020, 8, 126385–126400. [Google Scholar] [CrossRef]
  16. Qin, R.; Tian, J.; Reinartz, P. 3D change detection—Approaches and applications. ISPRS J. Photogramm. Remote Sens. 2016, 122, 41–56. [Google Scholar] [CrossRef] [Green Version]
  17. Ramachandram, D.; Taylor, G.W. Deep Multimodal Learning: A Survey on Recent Advances and Trends. IEEE Signal Process. Mag. 2017, 34, 96–108. [Google Scholar] [CrossRef]
  18. Zhang, C.; Yang, Z.; He, X.; Deng, L. Multimodal Intelligence: Representation Learning, Information Fusion, and Applications. IEEE J. Sel. Top. Signal Process. 2020, 14, 478–493. [Google Scholar] [CrossRef] [Green Version]
  19. Melgani, F.; Moser, G.; Serpico, S. Unsupervised change detection methods for remote sensing images. SPIE 2002, 41, 3288–3297. [Google Scholar] [CrossRef]
  20. Jha, C.S.; Unni, N.V.M. Digital change detection of forest conversion of a dry tropical Indian forest region. Int. J. Remote Sens. 2007, 15, 2543–2552. [Google Scholar] [CrossRef]
  21. Howarth, P.J.; Wickware, G.M. Procedures for change detection using Landsat digital data. Int. J. Remote Sens. 2007, 2, 277–291. [Google Scholar] [CrossRef]
  22. Lambin, E.F.; Strahler, A.H. Indicators of land-cover change for change-vector analysis in multitemporal space at coarse spatial scales. Int. J. Remote Sens. 2007, 15, 2099–2119. [Google Scholar] [CrossRef]
  23. Schoppmann, M.W.; Tyler, W.A. Chernobyl revisited: Monitoring change with change vector analysis. Geocarto Int. 1996, 11, 13–27. [Google Scholar] [CrossRef]
  24. Munyati, C. Use of Principal Component Analysis (PCA) of Remote Sensing Images in Wetland Change Detection on the Kafue Flats, Zambia. Geocarto Int. 2004, 19, 11–22. [Google Scholar] [CrossRef]
  25. Alaibakhsh, M.; Emelyanova, I.; Barron, O.; Mohyeddin, A.; Khiadani, M. Multivariate detection and attribution of land-cover changes in the Central Pilbara, Western Australia. Int. J. Remote Sens. 2015, 36, 2599–2621. [Google Scholar] [CrossRef]
  26. Collins, J.B.; Woodcock, C.E. An assessment of several linear change detection techniques for mapping forest mortality using multitemporal landsat TM data. Remote Sens. Environ. 1996, 56, 66–77. [Google Scholar] [CrossRef]
  27. Collins, J.B.; Woodcock, C.E. Change detection using the Gramm-Schmidt transformation applied to mapping forest mortality. Remote Sens. Environ. 1994, 50, 267–279. [Google Scholar] [CrossRef]
  28. Brondizio, E.S.; Moran, E.F.; Mausel, P.; Wu, Y. Land use change in the Amazon estuary: Patterns of caboclo settlement and landscape management. Hum. Ecol. 1994, 22, 249–278. [Google Scholar] [CrossRef]
  29. Vicente, P.; Soares, R.M.H. Eucalyptus forest change classification using multi-date Landsat TM data. SPIE Proc. 1995, 2314, 281–291. [Google Scholar] [CrossRef]
  30. Bruzzone, L.; Serpico, S.B. An iterative technique for the detection of land-cover transitions in multitemporal remote-sensing images. IEEE Trans. Geosci. Remote Sens. 1997, 35, 858–867. [Google Scholar] [CrossRef] [Green Version]
  31. Ghaderpour, E.; Vujadinovic, T. Change Detection within Remotely Sensed Satellite Image Time Series via Spectral Analysis. Remote Sens. 2020, 12, 4001. [Google Scholar] [CrossRef]
  32. Nemmour, H.; Chibani, Y. Multiple support vector machines for land cover change detection: An application for mapping urban extensions. ISPRS J. Photogramm. Remote Sens. 2006, 61, 125–133. [Google Scholar] [CrossRef]
  33. Liu, X.; Lathrop, R.G. Urban change detection based on an artificial neural network. Int. J. Remote Sens. 2010, 23, 2513–2518. [Google Scholar] [CrossRef]
  34. Eisavi, V.; Homayouni, S. Performance evaluation of random forest and support vector regressions in natural hazard change detection. J. Appl. Remote Sens. 2016, 10, 046030. [Google Scholar] [CrossRef]
  35. Han, T.; Tang, Y.; Yang, X.; Lin, Z.; Zou, B.; Feng, H. Change Detection for Heterogeneous Remote Sensing Images with Improved Training of Hierarchical Extreme Learning Machine (HELM). Remote Sens. 2021, 13, 4918. [Google Scholar] [CrossRef]
  36. Hussain, M.; Chen, D.; Cheng, A.; Wei, H.; Stanley, D. Change detection from remotely sensed images: From pixel-based to object-based approaches. ISPRS J. Photogramm. Remote Sens. 2013, 80, 91–106. [Google Scholar] [CrossRef]
  37. Yang, X.; Liu, H.; Gao, X. Land cover changed object detection in remote sensing data with medium spatial resolution. Int. J. Appl. Earth Obs. Geoinf. 2015, 38, 129–137. [Google Scholar] [CrossRef]
  38. Zhang, L.; Zhang, L.; Du, B. Deep Learning for Remote Sensing Data: A Technical Tutorial on the State of the Art. IEEE Geosci. Remote Sens. Mag. 2016, 4, 22–40. [Google Scholar] [CrossRef]
  39. Shi, W.; Zhang, M.; Zhang, R.; Chen, S.; Zhan, Z. Change Detection Based on Artificial Intelligence: State-of-the-Art and Challenges. Remote Sens. 2020, 12, 1688. [Google Scholar] [CrossRef]
  40. Daudt, R.C.; Saux, B.L.; Boulch, A. Fully Convolutional Siamese Networks for Change Detection. In Proceedings of the 2018 25th IEEE International Conference on Image Processing (ICIP), Athens, Greece, 7–10 October 2018; pp. 4063–4067. [Google Scholar] [CrossRef] [Green Version]
  41. Zheng, Z.; Wan, Y.; Zhang, Y.; Xiang, S.; Peng, D.; Zhang, B. CLNet: Cross-layer convolutional neural network for change detection in optical remote sensing imagery. ISPRS J. Photogramm. Remote Sens. 2021, 175, 247–267. [Google Scholar] [CrossRef]
  42. Zhang, C.; Yue, P.; Tapete, D.; Jiang, L.; Shangguan, B.; Huang, L.; Liu, G. A deeply supervised image fusion network for change detection in high resolution bi-temporal remote sensing images. ISPRS J. Photogramm. Remote Sens. 2020, 166, 183–200. [Google Scholar] [CrossRef]
  43. Samadi, F.; Akbarizadeh, G.; Kaabi, H. Change detection in SAR images using deep belief network: A new training approach based on morphological images. IET Image Process. 2019, 13, 2255–2264. [Google Scholar] [CrossRef]
  44. Mou, L.; Zhu, X.X. A Recurrent Convolutional Neural Network for Land Cover Change Detection in Multispectral Images. In Proceedings of the IGARSS 2018—2018 IEEE International Geoscience and Remote Sensing Symposium, Valencia, Spain, 22–27 July 2018; pp. 4363–4366. [Google Scholar] [CrossRef]
  45. Wang, D.; Chen, X.; Jiang, M.; Du, S.; Xu, B.; Wang, J. ADS-Net:An Attention-Based deeply supervised network for remote sensing image change detection. Int. J. Appl. Earth Obs. Geoinf. 2021, 101, 102348. [Google Scholar] [CrossRef]
  46. Yang, X.; Hu, L.; Zhang, Y.; Li, Y. MRA-SNet: Siamese Networks of Multiscale Residual and Attention for Change Detection in High-Resolution Remote Sensing Images. Remote Sens. 2021, 13, 4528. [Google Scholar] [CrossRef]
  47. Chen, P.; Zhang, B.; Hong, D.; Chen, Z.; Yang, X.; Li, B. FCCDN: Feature constraint network for VHR image change detection. ISPRS J. Photogramm. Remote Sens. 2022, 187, 101–119. [Google Scholar] [CrossRef]
  48. Pan, J.; Cui, W.; An, X.; Huang, X.; Zhang, H.; Zhang, S.; Zhang, R.; Li, X.; Cheng, W.; Hu, Y. MapsNet: Multi-level feature constraint and fusion network for change detection. Int. J. Appl. Earth Obs. Geoinf. 2022, 108, 102676. [Google Scholar] [CrossRef]
  49. Li, H.-C.; Yang, G.; Yang, W.; Du, Q.; Emery, W.J. Deep nonsmooth nonnegative matrix factorization network with semi-supervised learning for SAR image change detection. ISPRS J. Photogramm. Remote Sens. 2020, 160, 167–179. [Google Scholar] [CrossRef]
  50. Lu, N.; Chen, C.; Shi, W.; Zhang, J.; Ma, J. Weakly Supervised Change Detection Based on Edge Mapping and SDAE Network in High-Resolution Remote Sensing Images. Remote Sens. 2020, 12, 3907. [Google Scholar] [CrossRef]
  51. Fang, H.; Du, P.; Wang, X. A novel unsupervised binary change detection method for VHR optical remote sensing imagery over urban areas. Int. J. Appl. Earth Obs. Geoinf. 2022, 108, 102749. [Google Scholar] [CrossRef]
  52. Ma, W.; Xiong, Y.; Wu, Y.; Yang, H.; Zhang, X.; Jiao, L. Change Detection in Remote Sensing Images Based on Image Mapping and a Deep Capsule Network. Remote Sens. 2019, 11, 626. [Google Scholar] [CrossRef] [Green Version]
  53. Hu, J.; Shen, L.; Albanie, S.; Sun, G.; Wu, E. Squeeze-and-Excitation Networks. IEEE Trans. Pattern Anal. Mach. Intell. 2020, 42, 2011–2023. [Google Scholar] [CrossRef] [PubMed] [Green Version]
  54. Zhang, H.; Wang, M.; Wang, F.; Yang, G.; Zhang, Y.; Jia, J.; Wang, S. A Novel Squeeze-and-Excitation W-Net for 2D and 3D Building Change Detection with Multi-Source and Multi-Feature Remote Sensing Data. Remote Sens. 2021, 13, 440. [Google Scholar] [CrossRef]
  55. Tian, J.; Cui, S.; Reinartz, P. Building Change Detection Based on Satellite Stereo Imagery and Digital Surface Models. IEEE Trans. Geosci. Remote Sens. 2014, 52, 406–417. [Google Scholar] [CrossRef] [Green Version]
  56. He, K.; Zhang, X.; Ren, S.; Sun, J. Deep Residual Learning for Image Recognition. In Proceedings of the 2016 IEEE Conference on Computer Vision and Pattern Recognition (CVPR), Las Vegas, NV, USA, 27–30 June 2016; pp. 770–778. [Google Scholar] [CrossRef] [Green Version]
  57. Yang, X.; Li, S.; Chen, Z.; Chanussot, J.; Jia, X.; Zhang, B.; Li, B.; Chen, P. An attention-fused network for semantic segmentation of very-high-resolution remote sensing imagery. ISPRS J. Photogramm. Remote Sens. 2021, 177, 238–262. [Google Scholar] [CrossRef]
  58. Fu, J.; Liu, J.; Tian, H.; Li, Y.; Bao, Y.; Fang, Z.; Lu, H. Dual Attention Network for Scene Segmentation. In Proceedings of the 2019 IEEE/CVF Conference on Computer Vision and Pattern Recognition (CVPR), Long Beach, CA, USA, 15–20 June 2019; pp. 3141–3149. [Google Scholar] [CrossRef] [Green Version]
  59. Huang, G.; Liu, Z.; Maaten, L.V.D.; Weinberger, K.Q. Densely Connected Convolutional Networks. In Proceedings of the 2017 IEEE Conference on Computer Vision and Pattern Recognition (CVPR), Honolulu, HI, USA, 21–26 July 2017; pp. 2261–2269. [Google Scholar] [CrossRef] [Green Version]
  60. Zhou, Z.; Siddiquee, M.M.R.; Tajbakhsh, N.; Liang, J. UNet++: A Nested U-Net Architecture for Medical Image Segmentation. Deep. Learn. Med. Image Anal. Multimodal Learn. Clin. Decis. Support 2018, 11045, 3–11. [Google Scholar] [CrossRef] [Green Version]
  61. Fan, R.; Wang, H.; Cai, P.; Liu, M. SNE-RoadSeg: Incorporating Surface Normal Information into Semantic Segmentation for Accurate Freespace Detection; Springer International Publishing: Cham, Switzerland, 2020; pp. 340–356. [Google Scholar] [CrossRef]
  62. Nielsen, A.A. The Regularized Iteratively Reweighted MAD Method for Change Detection in Multi- and Hyperspectral Data. IEEE Trans. Image Process. 2007, 16, 463–478. [Google Scholar] [CrossRef] [PubMed] [Green Version]
  63. Long, J.; Shelhamer, E.; Darrell, T. Fully convolutional networks for semantic segmentation. In Proceedings of the 2015 IEEE Conference on Computer Vision and Pattern Recognition (CVPR), Boston, MA, USA, 7–12 June 2015; pp. 3431–3440. [Google Scholar] [CrossRef] [Green Version]
  64. Badrinarayanan, V.; Kendall, A.; Cipolla, R. SegNet: A Deep Convolutional Encoder-Decoder Architecture for Image Segmentation. IEEE Trans. Pattern Anal. Mach. Intell. 2017, 39, 2481–2495. [Google Scholar] [CrossRef] [PubMed]
  65. Ronneberger, O.; Fischer, P.; Brox, T. U-Net: Convolutional Networks for Biomedical Image Segmentation. In Proceedings of the Medical Image Computing and Computer-Assisted Intervention—MICCAI 2015, Munich, Germany, 5–9 October 2015; pp. 234–241. [Google Scholar] [CrossRef] [Green Version]
  66. Sun, K.; Xiao, B.; Liu, D.; Wang, J. Deep High-Resolution Representation Learning for Human Pose Estimation. In Proceedings of the 2019 IEEE/CVF Conference on Computer Vision and Pattern Recognition (CVPR), Long Beach, CA, USA, 15–20 June 2019; pp. 5686–5696. [Google Scholar] [CrossRef] [Green Version]
Publisher’s Note: MDPI stays neutral with regard to jurisdictional claims in published maps and institutional affiliations.

Article Metrics

Citations

Article Access Statistics

Multiple requests from the same IP address are counted as one view.