Abstract
A full-polarimetric ground penetrating radar (FP-GPR) uses an antenna array to detect subsurface anomalies. Compared to the traditional GPR, FP-GPR can obtain more abundant information about the subsurface. However, in field FP-GPR measurements, the arrival time of the received electromagnetic (EM) waves from different channels cannot be strictly aligned due to the limitations of human operation errors and the craftsmanship of the equipment. Small misalignments between the radargrams acquired from different channels of an FP-GPR can lead to erroneous identification results of the classic Freeman decomposition (FD) method. Here, we propose a local Freeman decomposition (LFD) method to enhance the robustness of the classic FD method when managing with misaligned FP-GPR data. The tests on three typical targets demonstrate that misalignments will severely interfere with the imaging and the identification results of the classic FD method for the plane and dihedral scatterers. In contrast, the proposed LFD method can produce smooth images and accurate identification results. Besides, the identification of the volume scatterer is not affected by misalignments. A test of ice-fracture detection further verifies the capability of the LFD method in field measurements. Due to the different relative magnitudes of the permittivity of the media on two sides of the interfaces, the ice surface and ice fracture show the features of surface-like and double-bounce scattering, respectively. However, the definition of double-bounce scattering is different from the definition in polarimetric synthetic aperture radar (SAR). Finally, a quantitative analysis shows that the sensitivities of the FD and LFD methods to misalignments are related to both the type of target and the polarized mode of the misaligned data. The tolerable range of the LFD method for misalignments is approximately ±0.2 times the wavelength of the EM wave, which is much wider than that of the FD method. In most cases, the LFD method can guarantee an accurate result of identification.
1. Introduction
Imaging is the primary way in which the ground penetrating radar (GPR) identifies underground objects [1]. However, it is not always feasible to discriminate the targets using only imaging. In recent years, the full-polarimetric ground penetrating radar (FP-GPR) has shown its strong capability in the field of subsurface target detection [2,3,4,5,6,7]. The FP-GPR can measure the effect of the induced field rotation (IFR) when an EM wave irradiates on a target [8,9,10]. This effect is closely related to the shape of the target [11]. For example, Chen et al. [12] extracted the orientation and the linearity features from FP-GPR data and implemented the classification of different types of unexploded ordnance (UXO); Miwa et al. [13] designed a borehole polarimetric radar to better identify subsurface fractures; Roth et al. [14] found that the data from the cross-polarized channels of an FP-GPR can help map the internal structures of landmines; and Liu et al. [15] achieved the orientation estimation of elongated objects using a hybrid polarimetric GPR. These polarimetric techniques expanded the applications of GPR from detection to identification.
To further strengthen the utilization of FP-GPR data, a variety of target decomposition methods were applied to FP-GPR data processing [11]. By decomposing and analyzing the Sinclair matrix, many polarization attributes beyond geometric features can be extracted and used for a better identifications of different types of subsurface anomalies. For example, the H-Alpha method can extract two parameters, namely, the scattering entropy and the average scattering angle, which characterize the randomness of the scattering process and its mechanism, respectively [16,17,18]. Based on these two parameters, Zhao et al. [19] achieved the classification of different types of subsurface fractures. Besides, Feng et al. [20,21,22,23] classified different types of targets and applied the method to subsurface pipe detection, while Liu et al. [24] applied the method to the detection of the early stage rebar corrosion. These impressive works greatly improved the classification ability of FP-GPRs.
Freeman decomposition (FD) is another type of classic polarimetric analysis technique. Unlike the classical H-Alpha decomposition, which is based on mathematical constructions, the FD method is a type of physical model-based, three-component decomposition method [25]. The key idea of the FD method is that, for each scattering point, its scattering mechanism is contributed by three basic scattering components, which refer to the surface-like scattering, the double-bounce scattering, and the volume scattering [25]. By decomposing the polarimetric scattering covariance matrix, the powers of the three components can be obtained, based on which the identification can be performed. The FD method has been applied to the fractures detection of full-polarimetric borehole radars [26] and subsurface target detection of FP-GPRs [27].
The classic FD method directly adopts the measured FP-GPR data to estimate the elements in the covariance matrix, which requires the same arrival time of signals from the same subsurface scattering point in different radargrams. However, during the field FP-GPR measurements, the arriving time of the received EM waves in different channels is generally difficult to align strictly. For the fixed FP-GPR antennas with different polarization channels, misalignments mainly result from minor differences in the cable lengths of different channels and the calibration errors in each polarization channel. For the non-fixed FP-GPR antennas, in addition to the mentioned factors of fixed antennas, the height differences of antenna pairs with different polarization will also lead to misalignment. Therefore, a channel with a greater length of cable or a greater height of antennas above the ground will receive a signal with a time-forward delay compared to those of the other channels. Tiny misalignments between the radargrams acquired by different channels of an FP-GPR can lead to an erroneous result of identification, especially during the field measurements.
Here, a local freeman decomposition (LFD) method is proposed for the robust imaging and identification of subsurface anomalies using misaligned FP-GPR data. This method adopts the shaping regularization method to better estimate the components in the covariance matrix of the classic FD method. The shaping regularization is a non-linear mathematical inversion method that aims to find a smooth model similar to the observed data under certain conditions [28,29]. By using this method, the features of a scattering point can be estimated using the current point with several adjacent points. The obtained features characterize the local properties of FP-GPR data and can suppress the effects of misalignments.
This paper is organized as follows: Section 2 introduces the methodology of the proposed LFD method; the first part of Section 3 uses the experimental data acquired in the laboratory to test the performances of the LFD and the classic FD methods when dealing with misaligned data; the second part of Section 3 applies the two methods to the analysis of the field experimental data; Section 4 discusses the tolerable ranges of the FD and LFD methods; and Section 5 is the conclusion.
2. Local Freeman Decomposition
The FP-GPR signals from a target can be represented by a Sinclair matrix as follow [8]:
where SHH, SHV, SVH, and SVV represent the FP-GPR data obtained using the antenna array in Figure 1.
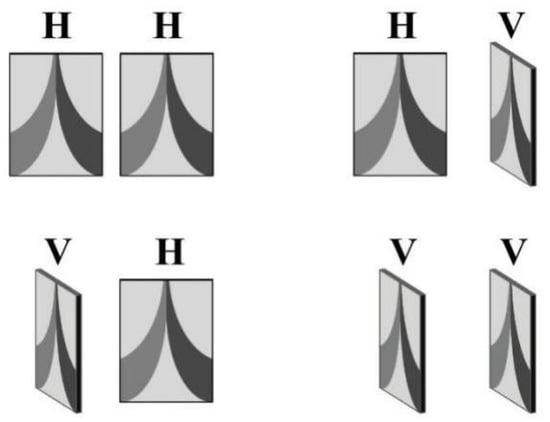
Figure 1.
An antenna array for FP-GPR [8]. H and V represent the horizontal and the vertical polarization, respectively.
The reciprocity indicates that [S] is a symmetrical matrix (SHV = SVH) [30]. A straightforward lexicographic ordering of the [S] called the target vector in radar polarimetry is given by [11]:
where the on the SHV term is used to ensure consistency in the span (total power) computation [31]. In the theory of the classic FD method, kL can be used to generate a 3 × 3 target covariance matrix [CFD] as follow [25]:
where the asterisk and the superscript T denote complex conjugate and transpose, respectively. The details about [CFD] are available in Appendix A, Table A1. In our proposed LFD method, another representation of the covariance matrix is used, which is given by [32]:
where σ, β, ρ, γ, δ, and ε are the polarimetric cross-correlation parameters [32], while σ is the power of SHH; δ and γ represent the ratios between SHV, SVV, and SHH; ρ, β, and ε are the correlations between each two of SHH, SHV, and SVV. The relations between these parameters and the SHH, SHV, and SVV data are given by:
The classic FD method considers that, for each scattering point, its scattering mechanism is attributed to three basic scattering components, which refer to surface-like scattering, the double-bounce scattering, and the volume scattering [25]. Therefore, the covariance matrix [CLFD] is considered to be composed of three matrices and is given by:
where [CS], [CD], and [CV] correspond to the covariance matrices of the ideal surface-like scattering, the ideal double-bounce scattering, and the ideal volume scattering, respectively [25]. fS, fD, and fV denote the powers of the SVV signals (i.e., |SVV|2) for the three types of scatterings, respectively. Besides, a and b represent the data of SHH/SVV for the double-bounce scattering and the surface-like scattering, respectively [25]. Combining (4) and (6), we can first derive that 2fV/8 = δ according to the elements in the second row, second column of the two matrices. Similarly, we can obtain a further three equations:
The ρ, γ, and δ can be computed using (5). However, (5) is not robust when misalignments occur between the radargrams of SHH, SHV, and SVV. In this paper, we innovatively propose the LFD method to better estimate these parameters. First, shaping regularization is applied to localizing the ρ, γ, and δ parameters [28]. For the three A-scan signals acquired at each position, the new presentations of ρ, γ, and δ are given by:
where L and M denote two diagonal matrices whose main diagonal elements are the row data of (|SHH|2|SVV|2)1/2 and |SHH|2, respectively. Furthermore, d1, d2, and d3 represent the row data of SHHSVV, 2|SHV|2, and |SVV|2, respectively. I is the identity matrix. φ1 and φ2 are the two stable parameters used in the process of inversion to accelerate the convergence speed [28]. In general cases, φ1 = ||LTL||2 and φ2 = ||MTM||2. Sk is usually set to a triangle smoothing matrix [28] with a width of (2k + 1), and k is the smoothing radius which is an empirical settable parameter; in this study, we set it to 1/5 times the number of sampling points of the GPR signal.
In (8), the ρ, γ, and δ are related not only to the current computation point but also to the previous and subsequent k points. Therefore, the effect of the tiny misalignments will be suppressed by the localization of these three parameters and the robustness of the computation can be guaranteed. The shaping regularization uses a regularized mathematical-inversion method to eliminate the sliding window in the local correlation calculation. Compared to the sliding-window approach, the shaping regularization has some advantages [29]:
- Only one parameter (the smoothing radius k) needs to be specified, as opposed to several (window size, overlap, and taper) in the sliding-window approach. The smoothing radius directly reflects the locality of the measurement;
- The shaping regularization method continues the measurement smoothly through the regions of absent information. This effect is impossible to achieve in the sliding-window approach unless the window size is always larger than the information gaps in the signal.
Subsequently, the localized parameters ρ, γ, and δ can be substituted into (7). Notably, in the classic FD theory, the sign of Re(SHHSVV) is used to determine the values of a and b [25,26,27]. For LFD, we use the localized parameter ρ for the determination instead. Therefore, if Re(ρ) ≥ 0, the point is dominated by the surface-like scattering with a = −1; if Re(ρ) ≤ 0, the point is dominated by the double-bounce scattering with b = 1. Finally, the set of equations can be solved and the powers of three types of scattering can be computed using the formulas below [25,26,27]:
where PS, PD, and PV are the powers of the surface-like scattering, the double-bounce scattering, and the volume scattering, respectively. Furthermore, an RGB image can be generated to fuse the results and present the color-coded polarization information. The coding can be represented as follows [27]:
3. Results
3.1. LFD Test for Misaligned FP-GPR Data of Typical Targets
To verify the feasibility of the LFD method, FP-GPR measurements were performed in the laboratory on three typical targets. The ultrawide-bandwidth (UWB) stepped-frequency FP-GPR system used in the measurements is shown in Figure 2, which uses a vector network analyzer (VNA) to transmit the electromagnetic waves with the frequency band of 0.8–4 GHz. During a measurement, the system operates as follows: step ①: the PC controls the robot to move the antenna array to a certain position; step ②: the PC controls the VNA to transmit EM waves through the antenna array and to receive the returned signals from the target.
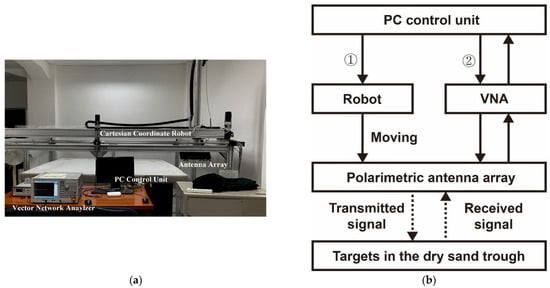
Figure 2.
The ultrawide-bandwidth(UWB) stepped-frequency FP-GPR system. (a) the photo of the system; (b) the operation flow chart of the system.
Three typical targets, a metallic plate, a metallic dihedral, and a volume scatterer with many branches are immersed in a dry sand trough shown in Figure 2a and Figure 3. The plate was 35 cm in length, 20 cm in width and was buried at a depth of 8 cm. The dihedral consisted of two plates at a 90° angle and the buried depth for the intersection of the two plates was 20 cm. The multibranch scatterer was approximately 40 cm in length and its main stem was buried to a depth of 10 cm.

Figure 3.
The typical targets used in the measurements. (a) The metallic plate; (b) The metallic dihedral; (c) The volume scatterer with many branches.
The FP-GPR radargrams of the three targets before and after the Kirchhoff migrations are shown in Figure 4. The red rectangles indicate the main signals from the targets, which are also the main regions for imaging and identification.
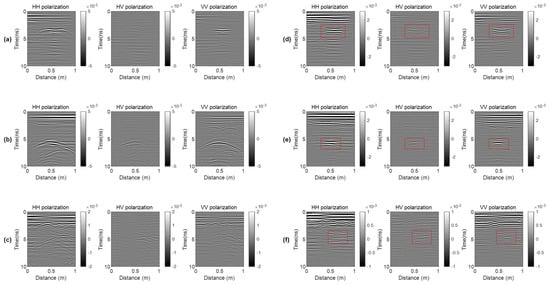
Figure 4.
The FP-GPR data of the three typical targets before and after Kirchhoff migrations. (a–c) are the radargrams of the metallic plate, the metallic dihedral, and the volume scatterer with many branches, respectively. (d–f) are the results after the Kirchhoff migrations.
To test the effect of misalignments on the classic FD method and the proposed LFD method, a time-forward offset and a time-backward offset of five sampling points were added into SHV and SVV signals, respectively. SHH signals had no offset. Figure 5 shows the results of the metallic plate signals as an example.
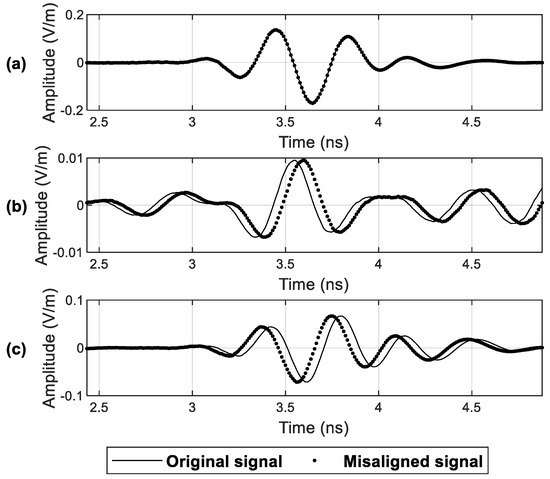
Figure 5.
The misaligned signals of the metallic plate. (a) SHH signals; (b) SHV signals; (c) SVV signals.
Subsequently, the classic FD method and the proposed LFD method were performed for the misaligned data after the Kirchhoff migrations. The single-trace signals in Figure 6 were extracted from the derived PS, PD, and PV results, which are located in the middle of the rectangular regions in Figure 4. The results of the FD and LFD methods are shown in Figure 6a,b, respectively. The PS and PD components alternate in the processing results of the signals from the plate and dihedral targets, which are erroneous and will therefore severely interfere with the identifications of these two objects. The misalignment has little impact on the FD result of the signals from the volume scatterer. However, the LFD method shows more continuous, smoother, and accurate results for the signals from all three types of targets.
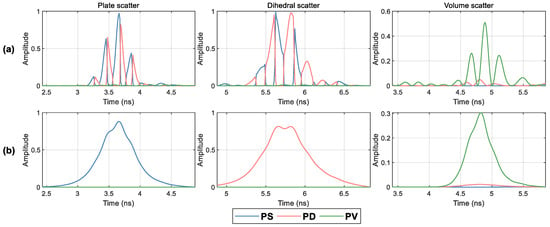
Figure 6.
The single traces of FD and LFD results for misaligned data. (a) The results of the classic FD method; (b) The results of the proposed LFD method.
The RGB imaging results based on the FD and LFD methods are shown in Figure 7, which correspond to the data in the rectangular regions in Figure 4. According to (10), the image colors for the plate scatterer, the dihedral scatterer, and the volume scatterer should be blue, red, and green, respectively. However, for the results of the classic FD method in Figure 7a, the images of the plate and dihedral scatterers present alternating blue and red colors due to the misalignments of the signals. Besides, the results for the volume scatterer are predominantly green, which means the volume scatterer is less affected by misalignments. In contrast to the FD method, the proposed LFD method has better performance in Figure 7b. The images of the plate scatterer, the dihedral scatterer, and the volume scatterer presented by the LFD method show proper blue, red, and green images, respectively, and are more continuous. Based on the results of the LFD, we can perform proper identification for these three types of targets. Overall, the capabilities of imaging and identification of the LFD method are more robust than those of the FD method when dealing with misaligned radargrams.
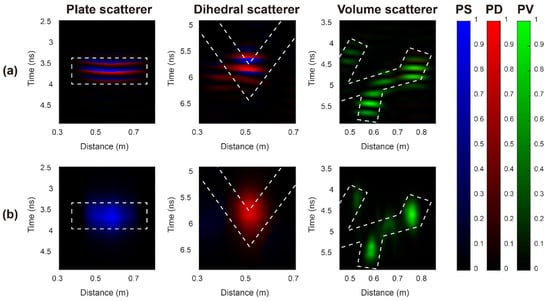
Figure 7.
The RGB images of FD and LFD results for misaligned data. (a) results of classic FD method; (b) results of proposed LFD method. The white dashed lines denote the general contours of the targets.
3.2. Field Application in Ice Fracture Detection
A field FP-GPR measurement of an ice fracture was conducted to test the proposed method. The FP-GPR system used for the field measurement consisted of a VNA, a PC controller, a GPS antenna, and a polarimetric antenna array. The structure of the antenna array is shown in Figure 8a, which consists of two fixed rectangular horn antennas. In the field measurement, the frequency band was set to 1–4 GHz. The length of the measurement route and the distance interval were set to 1 m and 0.01 m, respectively. The time window and the sampling point were set to 8 ns and 512, respectively.
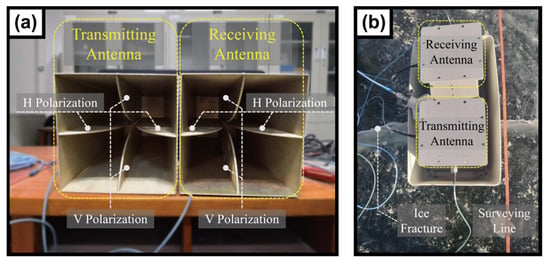
Figure 8.
The FP-GPR system and the ice fracture detection test. (a) The polarimetric antenna array used in the field measurement; (b) The field FP-GPR measurement on the ice fracture.
The ice fracture is shown in Figure 8b which penetrates the entire ice sheet. Figure 9 presents the FP-GPR data before and after Kirchhoff migrations. The signals from the ice fracture are composed of many hyperbolas. As the boundaries of the ice fracture are irregular and rough, these hyperbolas are considered to be generated by the scattering points on the ice-fracture boundaries, which can be illustrated by Figure 10. According to this schematic diagram, we can find that the signals from the ice fracture mainly contain the surface-like scattering component. However, we would like to highlight that the ideal surface-like and the double-bounce scatterers in synthetic aperture radar (SAR) theory, defined under the important condition that the EM waves are transmitted from a medium with a low dielectric constant to a medium with a high dielectric constant (air and land) [30,31,32,33]. In this case, the SHH and SVV are in-phase for the surface scattering and out-phase for the double-bounce scattering [33,34,35]. In contrast, when the EM waves are transmitted from a high dielectric constant media to a low dielectric constant media as Figure 10 shows and the incident angle is less than the angle of total reflection (), the SHH and SVV will be out-phase for the surface-like scattering instead [33,34,35]. Therefore, the signals from ice fracture in Figure 10 will present double-bounce scattering signatures. Notably, this double-bounce scattering is different from the dihedral scattering in Section 3.1 and does not result from the double bounces of the EM waves on the targets but the different relative values of the dielectric constants on the two sides of the interface. This conclusion can also be reached for the detection of other targets as long as the condition of < is satisfied.
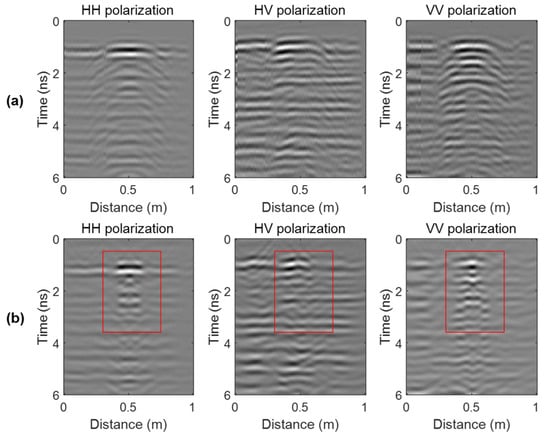
Figure 9.
The field FP-GPR data of the ice fracture. (a) Data before Kirchhoff migrations; (b) Data after Kirchhoff migrations.
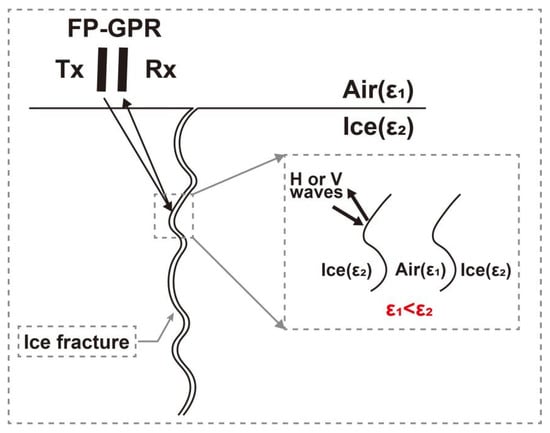
Figure 10.
The schematic diagram for analyzing the obtained FP-GPR data in the field ice fracture detection test.
The red rectangles in Figure 9 indicate the main signals from the targets, which are the main region for imaging and identifications. The upper half of the rectangles are strong reflections from the ice surface, which mainly contain the surface scattering and the FD and LFD results should be blue. The lower half of the rectangles are the signals from the ice fracture which, according to our analysis, contains mainly double-bounce scattering, and the FD and LFD results should be red.
In this test, no artificial offsets were added to the data. For the data collected by the FP-GPR system used for the field measurement, the misalignments mainly resulted from the minor differences in the cable lengths of different channels and the calibration errors for the four polarization channels. The single-trace signals in Figure 11 were extracted from the derived PS, PD, and PV results of the FD and the LFD methods, which are located in the middle of the rectangular regions in Figure 9. The results of the FD and LFD methods are shown in Figure 11a,b, respectively. For the results of the FD method, the PS and PD components alternate in some regions. The erroneous PD component appears in the region of the signals from the ice surface, whereas the erroneous PS component appears in the region of the signals from the subsurface ice fracture. Besides, the results also contain the PV component, which is likely to be generated by clutters. The LFD results show more continuous, smoother, and accurate results for both the ice surface and fracture.
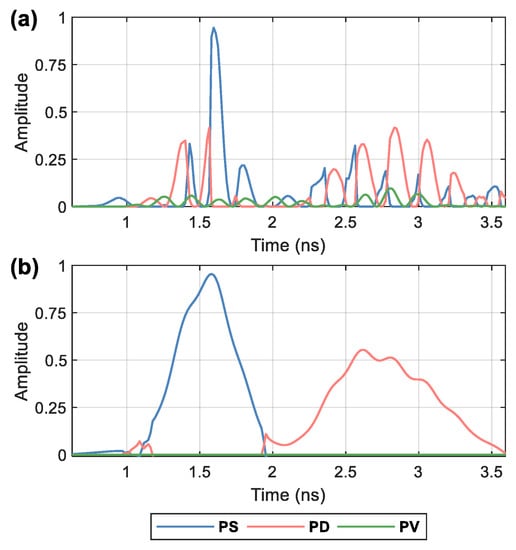
Figure 11.
The single traces of FD and LFD results for the misaligned data. (a) The results of the classic FD method; (b) The results of the proposed LFD method.
The RGB imaging results of FD and LFD methods are shown in Figure 12. Similar to Figure 7, the result of the FD method shows an improper image with a lot of clutter interference of different scattering modes (colors) and the targets cannot be identified. The result of the LFD method shows a more accurate, continuous, and smoother image. Consistent with the analysis before, the ice surface and the fracture are colored blue and red, referring to the surface-like scatterer and the dihedral scatterer, respectively. Besides, the clutters around target signals were also suppressed. As a result, the LFD can present a more accurate and high-quality result that can help to identify the ice surface and fracture.
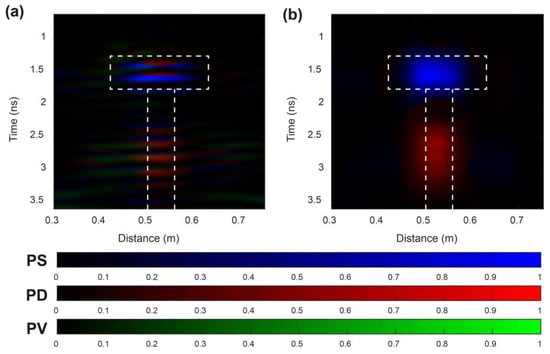
Figure 12.
The imaging and identification results of field FP-GPR data using the two methods. (a) The result using the classic FD method; (b) The result using the proposed LFD method. The white dashed lines denote the general contours of the targets.
4. Discussion
It is of vital importance to figure out the tolerable ranges of the FD and LFD methods and their relations to the target types and the misaligned polarization modes. So, in this section, we analyze the effects of different misalignment degrees for different target types and polarization modes on FD and LFD results.
To illustrate, we chose the typical FP-GPR data used in Section 3.1 to perform our experiments. The misalignments from the time-backward twenty sampling points to the time-forward twenty sampling points were added into SHV or SVV data in turn. Subsequently, for different methods and targets, the proportions of the points with correct colors among the points with amplitudes of greater than 0.1 were computed. For example, for the result of the plate scatterer, we computed the proportion of blue points among the points with PS values greater than 0.1; for the dihedral scatterer, we computed the proportion of red points among the points with PD values greater than 0.1; and for the volume scatterer, we computed the proportion of green points among the points with PV values greater than 0.1.
The results are shown in Figure 13. It is obvious that the signal with a smaller wave length λ will be more sensitive to the misalignment. Here, we use the wave length λ as the unit of the misalignment length and the scales of the horizontal axes in Figure 13 are computed by:
where c and Δt represent the velocity of the EM wave in the vacuum and the time interval in the GPR measurements, respectively. n denotes the number of time-forward or backward points. According to the results, when the misalignment reaches a large degree (more than ±0.5λ), the ratios of the points with correct colors provided by both methods will drop to 0, which means that the colors of the images will be inaccurate.
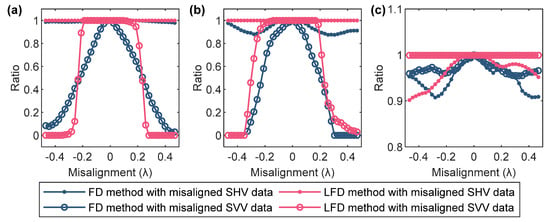
Figure 13.
The accuracy curves of the FD and LFD results when increasing the degrees of misalignments. (a) The plate scatterer; (b) The dihedral scatterer; (c) The volume scatterer.
For the results of the plate scatterer in Figure 13a, misalignments in SHV data had little impact on both the FD and LFD results, but when the SVV data was misaligned, the curves of the FD and LFD results varied over wide ranges. When an offset was added to the SVV data, the proportion of the FD result decreased rapidly. However, the proportion of the LFD result just began to fall when the misalignment reached ±0.2λ. So in this case, the tolerable range of the LFD method for the misalignment between different pairs of antennas is estimated to be ±0.2λ.
The results of the dihedral scatterer in Figure 13b are similar to those of the plate scatterer. The tolerable range of the LFD method for this data is also estimated to be ±0.2λ. Differently, the misalignments in SHV data had little impact on the FD results, with curves varying between 0.9 and 1. However, the curve of the LFD result was close to 1 when the SHV data was misaligned, which also indicates that the LFD method is more robust.
The results in Figure 13c demonstrate that the identification of the volume scatterer was less affected by the misalignments of SHV or SVV data. All four curves are stable between 0.9 and 1. The effect of misalignment of the SHV data is slightly stronger than that of SVV data. In the range of ±0.2λ, the curves of the LFD method are all higher than those of the FD method. Therefore, the LFD method is also more robust for the imaging and identification of the volume scatterer.
Figure 14 illustrates the examples of misinterpretations due to misalignments. Figure 14a–d show the FD results when the misalignments are set to 0, 0.1λ, 0.2λ, and 0.3λ, whereas Figure 14e–h show the LFD results. The results clearly show that the FD method will produce distorted RGB imaging results for the plate and dihedral targets when the misalignment reaches 0.1λ. The red color, which represents the double-bounce scattering, will appear in the FD result of the plate target whereas the blue color which represents surface-like scatter will appear in the FD result of the dihedral target. When the misalignments reach 0.2λ and 0.3λ, the FD method produces severely erroneous results. The wrong colors dominate in the results, and the identification of these two targets will lead to highly inaccurate conclusions.
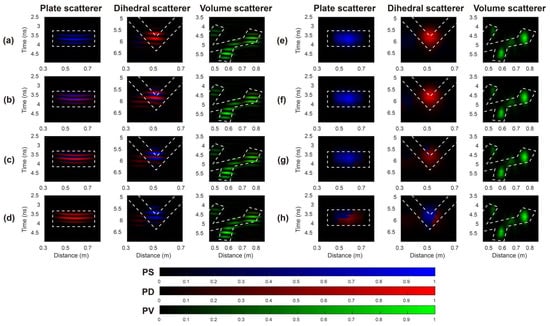
Figure 14.
The test for producing the cases of misinterpretations due to the misalignments (a–d) The FD results when the misalignments are set to 0, 0.1λ, 0.2λ, and 0.3λ. (e–h) The LFD results. The white dashed lines denote the general contours of the targets.
However, the LFD results only show some distortions when the misalignment reaches 0.2λ, which will not interfere with the identification results. When the misalignment reaches 0.3λ, the LFD method will also produce the wrong results, because the misalignment of 0.3λ is beyond the tolerable range of the LFD method. Besides, the FD and LFD results of the volume scatterer are not affected by the misalignments. These results correspond to the analysis for the curves in Figure 13.
Overall, the tolerable range of the LFD method for misalignments is estimated to be ±0.2λ, which is a wide range that can tolerate the effects of misalignments due to human operation errors or craftsmanship of equipment. For example, if the frequency of the transmitted EM wave is 500 MHz, the corresponding maximum tolerable misalignment length is approximately ±12 cm. Therefore, in most cases, LFD can guarantee proper results of imaging and identification.
5. Conclusions
In this paper, a local freeman decomposition (LFD) method was proposed to enhance the imaging and identification of misaligned full-polarimetric ground penetrating radar (FP-GPR) data. The data of three typical targets were processed to verify the feasibility and superiority of the LFD method compared to the classic freeman decomposition (FD) method. The results indicate that the LFD method is more robust than the FD method when dealing with misaligned FP-GPR data. The field test of ice-fracture detection further verified the superiority of the LFD method. The ice surface and the ice fracture can generate surface-like and dihedral scatterings, respectively. The LFD method can present more accurate, continuous, and smoother imaging and identification results and can suppress the clutter interference. Further quantitative analysis shows that the FD and LFD results of the plate and dihedral scatterers are more sensitive to the misalignments in SVV data than those in SHV data, and the results of the volume scatterer are not affected by both SHV and SVV misalignments. The tolerable range of the LFD method for misalignment is estimated to be ±0.2λ, which is much wider than that of the classic FD method. In most cases, LFD can guarantee accurate results of imaging and identification. By using this method, we no longer need to manually adjust the misaligned data and can achieve automatic and robust imaging and identification during field measurements using FP-GPR.
Author Contributions
Conceptualization, H.Z., X.F. and C.L.; methodology, H.Z. and Z.D.; software, H.Z.; validation, H.Z., X.F., Z.D. and Y.A.; formal analysis, H.Z.; resources, C.L.; data curation, W.L.; writing—original draft preparation, H.Z.; writing—review and editing, H.Z., X.F. and Z.D.; visualization, H.Z.; supervision, X.F.; project administration, X.F.; funding acquisition, X.F. All authors have read and agreed to the published version of the manuscript.
Funding
This research was funded by the National Key Research and Development Program of China under Grant 2021YFC1523401, Technology Innovation Center for Land Engineering and Human Settlements, Shaanxi Land Engineering Construction Group Co., Ltd. and Xi’an Jiaotong University under Grant 2021WHZ0080, and Graduate Innovation Fund of Jilin University under Grant 101832020CX226, and the National Natural Science Foundation of China under Grant 41974129.
Data Availability Statement
The data used in this study is available by contacting the corresponding author.
Conflicts of Interest
The authors declare no conflict of interest.
Appendix A

Table A1.
Explanations of terms in the article.
Table A1.
Explanations of terms in the article.
| Terms | Explanations |
|---|---|
| FP-GPR | Full-polarimetric ground penetrating radar |
| H polarization | Horizontal polarization, the electric vector is parallel to the patrolling direction of GPR. |
| V polarization | Vertical polarization, the electric vector is vertical to the patrolling direction of GPR. |
| Sinclair matrix | A matrix composes of four types of data in radar polarimetry. |
| Target decomposition | Analyzing the characteristics of a Sinclair matrix. mathematically or physically and obtain the polarization properties of a target. |
| Target vector | The vector form of a Sinclair matrix. |
| Straightforward lexicographic ordering | Decomposing a Sinclair matrix into a target vector using the lexicographic basis: |
| Span (total power) | |
| Target covariance matrix | A matrix generated by multiplying a target vector and its conjugate transpose. |
References
- Feng, X.; Sato, M. Pre-stack migration applied to GPR for landmine detection. Inverse Prob. 2004, 20, 99–115. [Google Scholar] [CrossRef]
- Sassen, D.S.; Everett, M.E. 3D polarimetric GPR coherency attributes and full-waveform inversion of transmission data for characterizing fractured rock. Geophysics 2009, 74, J23–J34. [Google Scholar] [CrossRef]
- Böniger, U.; Tronicke, J. Subsurface Utility Extraction and Characterization: Combining GPR Symmetry and Polarization Attributes. IEEE Trans. Geosci. Remote Sens. 2011, 50, 736–746. [Google Scholar] [CrossRef]
- Allred, B.J.; Daniels, J.J.; Fausey, N.R.; Chen, C.C.; Peters, L., Jr.; Youn, H.S. Important Considerations for Locating Buried Agricultural Drainage Pipe Using Ground Penetrating Radar. J. Appl. Eng. Agric. 2005, 21, 71–87. [Google Scholar] [CrossRef]
- O’Neill, K. Discrimination of UXO in Soil Using Broadband Polarimetric GPR Backscatter. IEEE Trans. Geosci. Remote Sens. 2001, 39, 356–367. [Google Scholar] [CrossRef]
- Tsoflias, G.P.; VanGestel, J.P.; Stoffa, P.L.; Blankenship, D.D.; Sen, M. Vertical fracture detection by exploiting the polarization properties of ground-penetrating radar signals. Geophysics 2004, 69, 803–810. [Google Scholar] [CrossRef]
- Tsoflias, G.P.; Hoch, A. Investigating multi-polarization GPR wave transmission through thin layers: Implications for vertical fracture characterization. Geophys. Res. Lett. 2006, 33, L20401. [Google Scholar] [CrossRef] [Green Version]
- Dong, Z.; Feng, X.; Zhou, H.; Liu, C.; Sato, M. Effects of Induced Field Rotation from Rough Surface on H-Alpha Decomposition of Full-Polarimetric GPR. IEEE Trans. Geosci. Remote Sens. 2021, 59, 9192–9208. [Google Scholar] [CrossRef]
- Dong, Z.; Feng, X.; Zhou, H.; Liu, C.; Sato, M. Assessing the Effects of Induced Field Rotation on Water Ice Detection of Tianwen-1 Full-Polarimetric Mars Rover Penetrating Radar. IEEE Trans. Geosci. Remote Sens. 2021. [Google Scholar] [CrossRef]
- O’Neill, K.; Haider, S.A.; Shireen, D.G.; Paulsen, K.D. Effects of the Ground Surface on Polarimetric Features of Broadband Radar Scattering from Subsurface Metallic Objects. IEEE Trans. Geosci. Remote Sens. 2001, 39, 1556–1565. [Google Scholar] [CrossRef]
- Cloude, S.R.; Pottier, E. A review of target decomposition theorems in radar polarimetry. IEEE Trans. Geosci. Remote Sens. 1996, 34, 498–518. [Google Scholar] [CrossRef]
- Chen, C.C.; Higgins, M.B.; O’Neill, K.; Detsch, R. Ultrawidebandwidth fully-polarimetric ground penetrating radar classification of subsurface unexploded ordnance. IEEE Trans. Geosci. Remote Sens. 2001, 39, 1221–1230. [Google Scholar] [CrossRef]
- Miwa, T.; Sato, M.; Niitsuma, H. Subsurface fracture measurement with polarimetric borehole radar. IEEE Trans. Geosci. Remote Sens. 1999, 37, 828–837. [Google Scholar] [CrossRef]
- Roth, F.; van Genderen, P.; Verhaegen, M. Processing and analysis of polarimetric ground penetrating radar landmine signatures. In Proceedings of the 2nd International Workshop on Advanced GPR, Delft, The Netherlands, 14–16 May 2003; pp. 14–16. [Google Scholar]
- Liu, H.; Huang, X.; Han, F.; Cui, J.; Spencer, B.F.; Xie, X. Hybrid Polarimetric GPR Calibration and Elongated Object Orientation Estimation. IEEE J. Sel. Top. Appl. Earth Observ. Remote Sens. 2019, 12, 2080–2087. [Google Scholar] [CrossRef]
- Cloude, S.R.; Pottier, E. An entropy based classification scheme for land applications of polarimetric SAR. IEEE Trans. Geosci. Remote Sens. 1997, 35, 68–78. [Google Scholar] [CrossRef]
- Yu, Y.; Chen, C.C.; Feng, X.; Liu, C. Modified Entropy-Based Fully Polarimetric Target Classification Method for Ground Penetrating Radars (GPR). IEEE J. Sel. Top. Appl. Earth Observ. Remote Sens. 2017, 10, 4304–4312. [Google Scholar] [CrossRef]
- Yu, Y.; Chen, C.C. Full-Polarization Target Classification Using Single-Polarization Ground Penetrating Radars. IEEE Trans. Geosci. Remote Sens. 2021, 60, 4504508. [Google Scholar] [CrossRef]
- Zhao, J.G.; Sato, M. Radar polarimetry analysis applied to single-hole fully polarimetric borehole radar. IEEE Trans. Geosci. Remote Sens. 2006, 44, 3547–3554. [Google Scholar] [CrossRef]
- Feng, X.; Yu, Y.; Liu, C.; Fehler, M. Combination of H-Alpha Decomposition and Migration for Enhancing Subsurface Target Classification of GPR. IEEE Trans. Geosci. Remote Sens. 2015, 53, 4852–4861. [Google Scholar] [CrossRef]
- Feng, X.; Yu, Y.; Liu, C.; Fehler, M. Subsurface polarimetric migration imaging for full polarimetric ground-penetrating radar. Geophys. J. Int. 2015, 202, 1324–1338. [Google Scholar] [CrossRef] [Green Version]
- Zhou, H.; Feng, X.; Zhang, Y.; Nilot, E.; Zhang, M.; Dong, Z.; Qi, J. Combination of Support Vector Machine and H-Alpha Decomposition for Subsurface Target Classification of GPR. In Proceedings of the 17th International Conference on Ground Penetrating Radar (GPR), Rapperswil, Switzerland, 18–21 June 2018; pp. 635–638. [Google Scholar]
- Feng, X.; Zhou, H.; Liu, C.; Zhang, Y.; Liang, W.; Nilot, E.; Zhang, M.; Dong, Z. Particle center supported plane for subsurface target classification based on full polarimetric ground penetrating radar. Remote Sens. 2019, 11, 405. [Google Scholar] [CrossRef] [Green Version]
- Liu, H.; Zhong, J.; Ding, F.; Meng, X.; Liu, C.; Cui, J. Detection of Early-stage Rebar Corrosion Using a Polarimetric Ground Penetrating Radar System. Constr. Build. Mater. 2022, 317, 1–10. [Google Scholar] [CrossRef]
- Freeman, A.; Durden, S.L. A three-component scattering model for polarimetric SAR Data. IEEE Trans. Geosci. Remote Sens. 1998, 36, 963–973. [Google Scholar] [CrossRef] [Green Version]
- Zhao, J.; Sato, M. Consistency Analysis of Subsurface Fracture Characterization Using Different Polarimetry Techniques by a Borehole Radar. IEEE Geosci. Remote Sens. Lett. 2007, 4, 359–363. [Google Scholar] [CrossRef]
- Feng, X.; Liang, W.J.; Liu, C.; Nilot, E.; Zhang, M.; Liang, S. Application of Freeman decomposition to full polarimetric GPR for improving subsurface target classification. Signal Process. 2017, 132, 284–292. [Google Scholar] [CrossRef]
- Fomel, S. Shaping regularization in geophysical-estimation problems. Geophysics 2007, 72, R29–R36. [Google Scholar] [CrossRef]
- Fomel, S. Local Seismic Attributes. Geophysics 2007, 72, A29–A33. [Google Scholar] [CrossRef]
- van Zyl, J.J.; Zebker, H.A.; Elachi, C. Imaging radar polarization signatures: Theory and observation. Radio Sci. 1987, 22, 529–543. [Google Scholar] [CrossRef]
- Boerner, W.M.; Mott, H.; Lfineburg, L.; Livingstone, C.; Pottier, E. Polarimetry in radar remote sensing: Basic and applied concepts. In Principles and Applications of Imaging Radar, The Manual of Remote Sensing, 3rd ed.; Wiley: New York, NY, USA, 1998; Volume 2. [Google Scholar]
- Ziegler, V.; Luneburg, E.; Schroth, A. Mean Backscattering Properties of Random Radar Targets: A Polarimetric Covariance Matrix Concept. In Proceedings of the IGARSS ’92, 12th Annual International Geoscience and Remote Sensing Symposium, Houston, TX, USA, 26–29 May 1992; pp. 266–268. [Google Scholar]
- van Zyl, J.J. Unsupervised Classification of Scattering Behavior Using Radar Polarimetry Data. IEEE Trans. Geosci. Remote Sens. 1989, 27, 36–45. [Google Scholar] [CrossRef]
- Ulaby, F.T.; Held, D.; Dobson, M.C.; McDonald, K.C.; Senior, T.B.A. Relating Polaization Phase Difference of SAR Signals to Scene Properties. IEEE Trans. Geosci. Remote Sens. 1987, GE-25, 83–92. [Google Scholar] [CrossRef]
- Cloude, S.R. Polarisation Applications in Remote Sensing; Oxford University Press: New York, NY, USA, 2010. [Google Scholar]
Publisher’s Note: MDPI stays neutral with regard to jurisdictional claims in published maps and institutional affiliations. |
© 2022 by the authors. Licensee MDPI, Basel, Switzerland. This article is an open access article distributed under the terms and conditions of the Creative Commons Attribution (CC BY) license (https://creativecommons.org/licenses/by/4.0/).