


Monitoring Spatial-Temporal Variations of Lake Level in Western China Using ICESat-1 and CryoSat-2 Satellite Altimetry


Abstract
1. Introduction
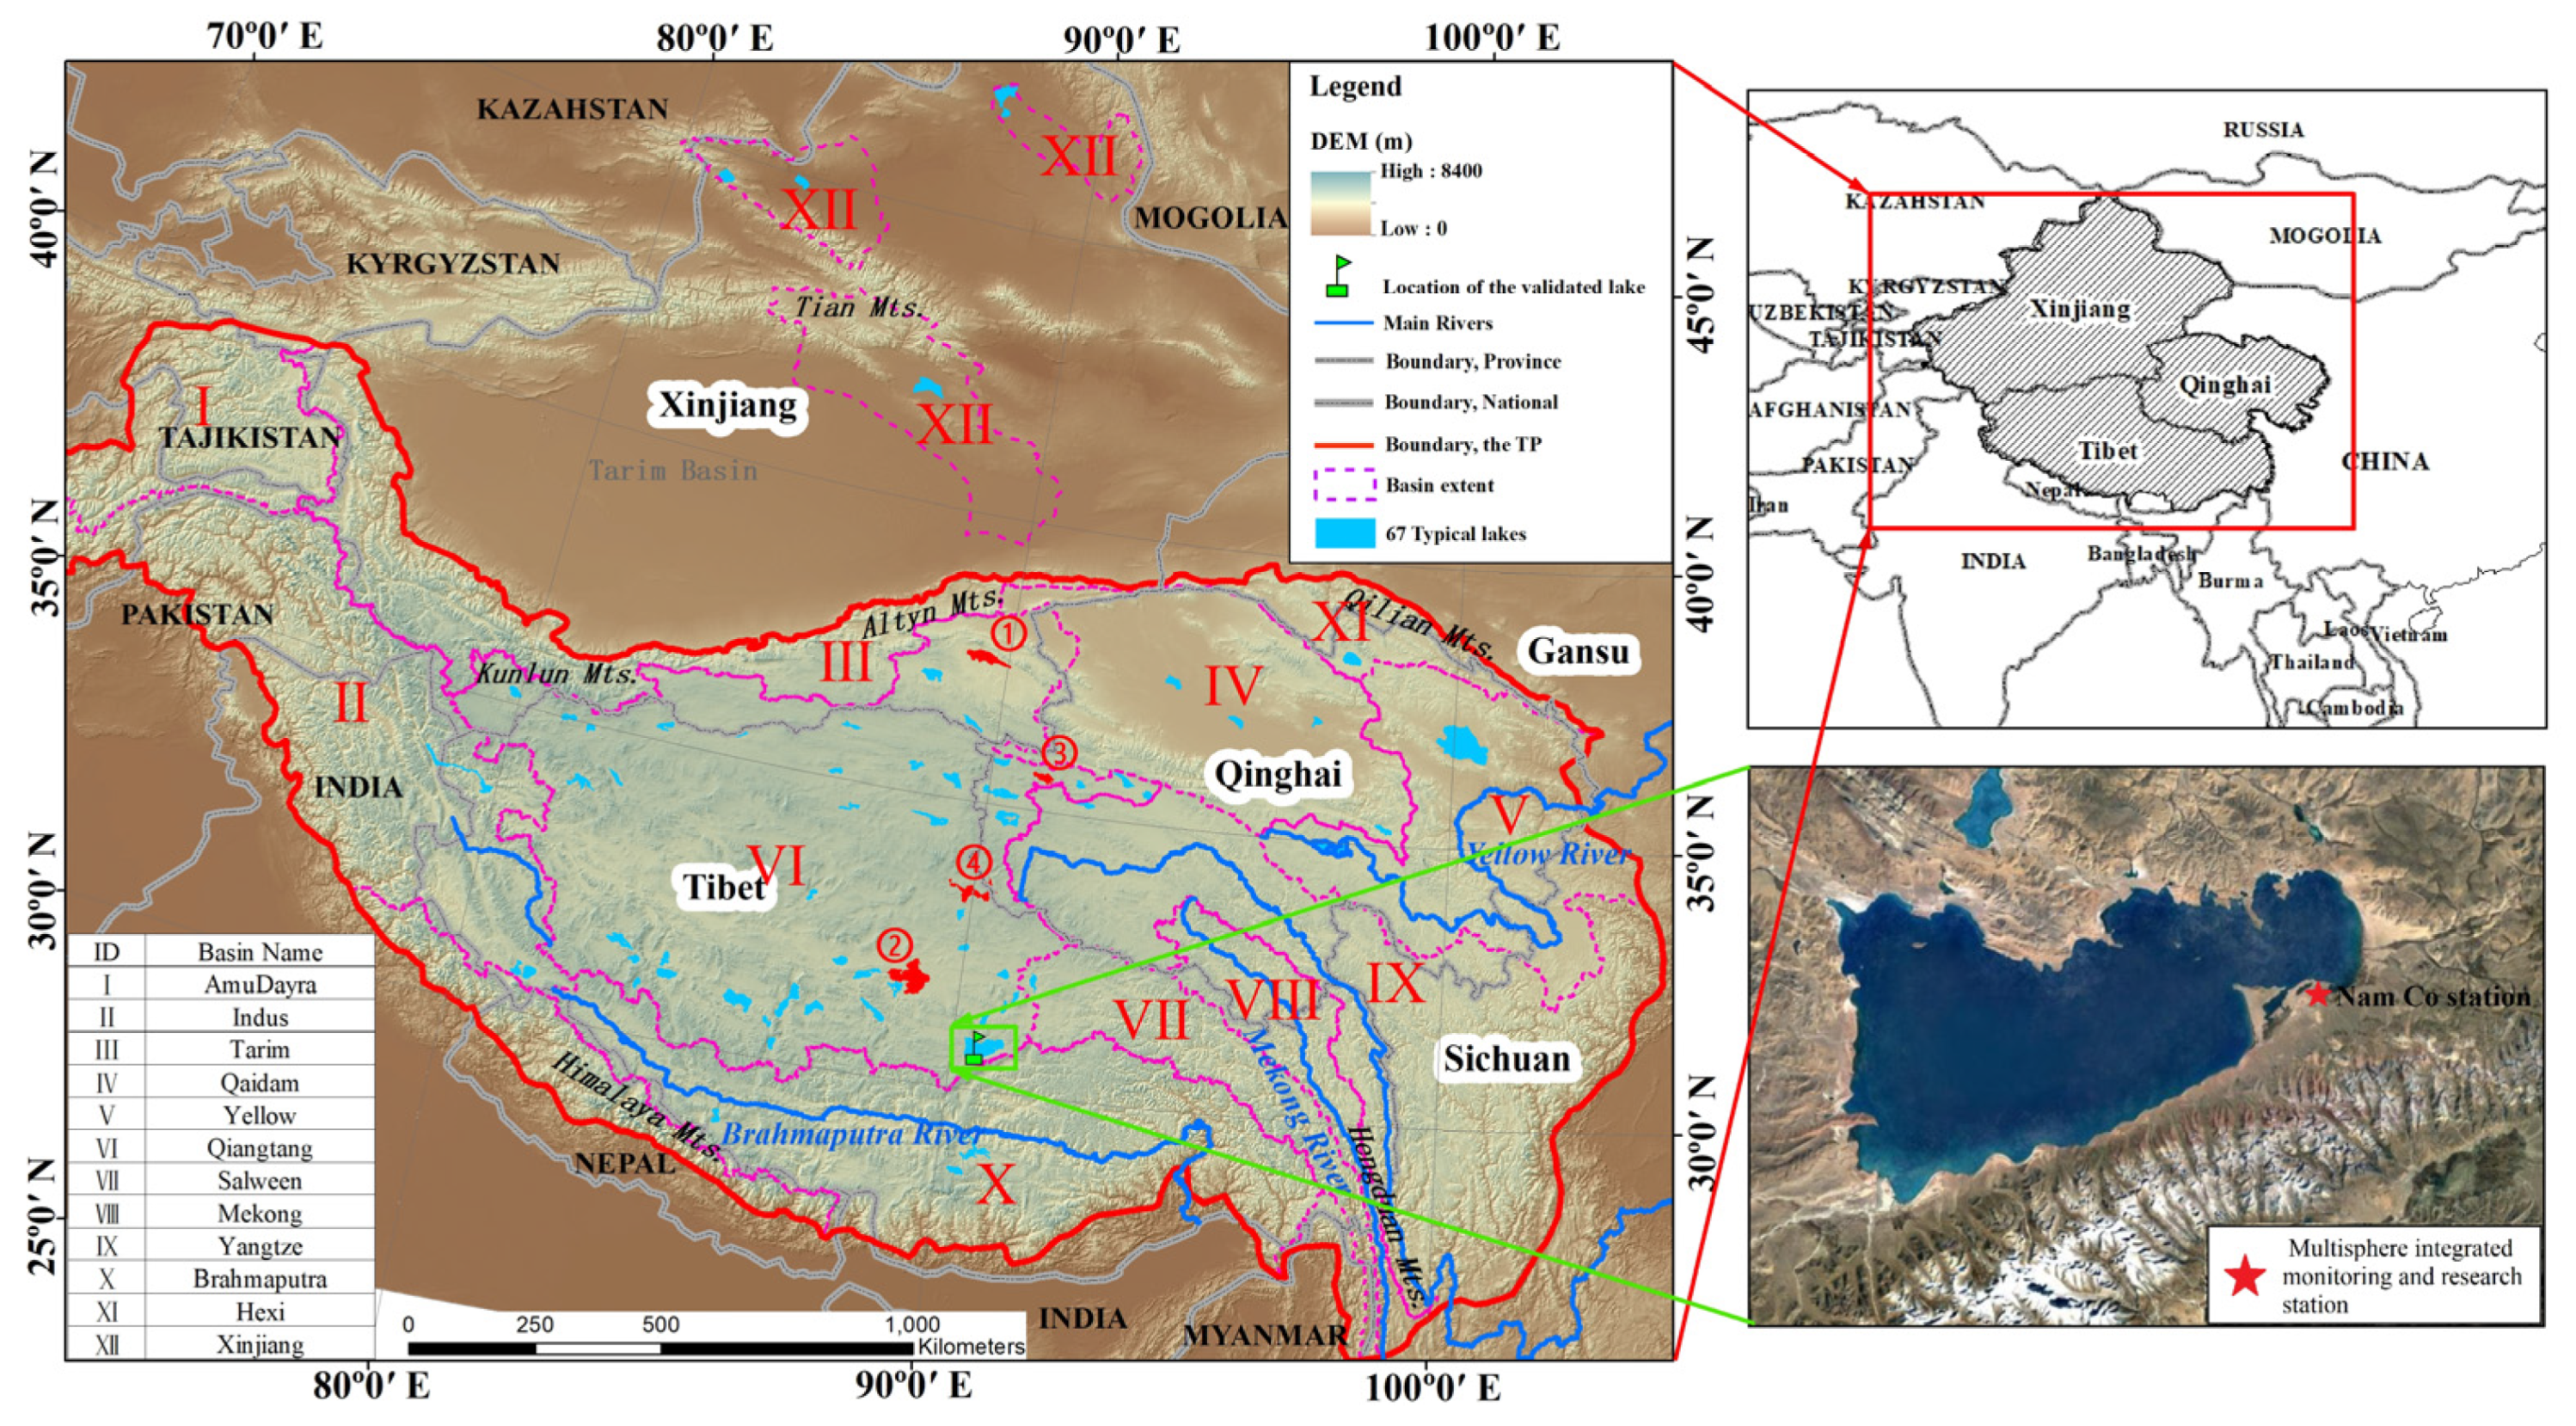
2. Study Area
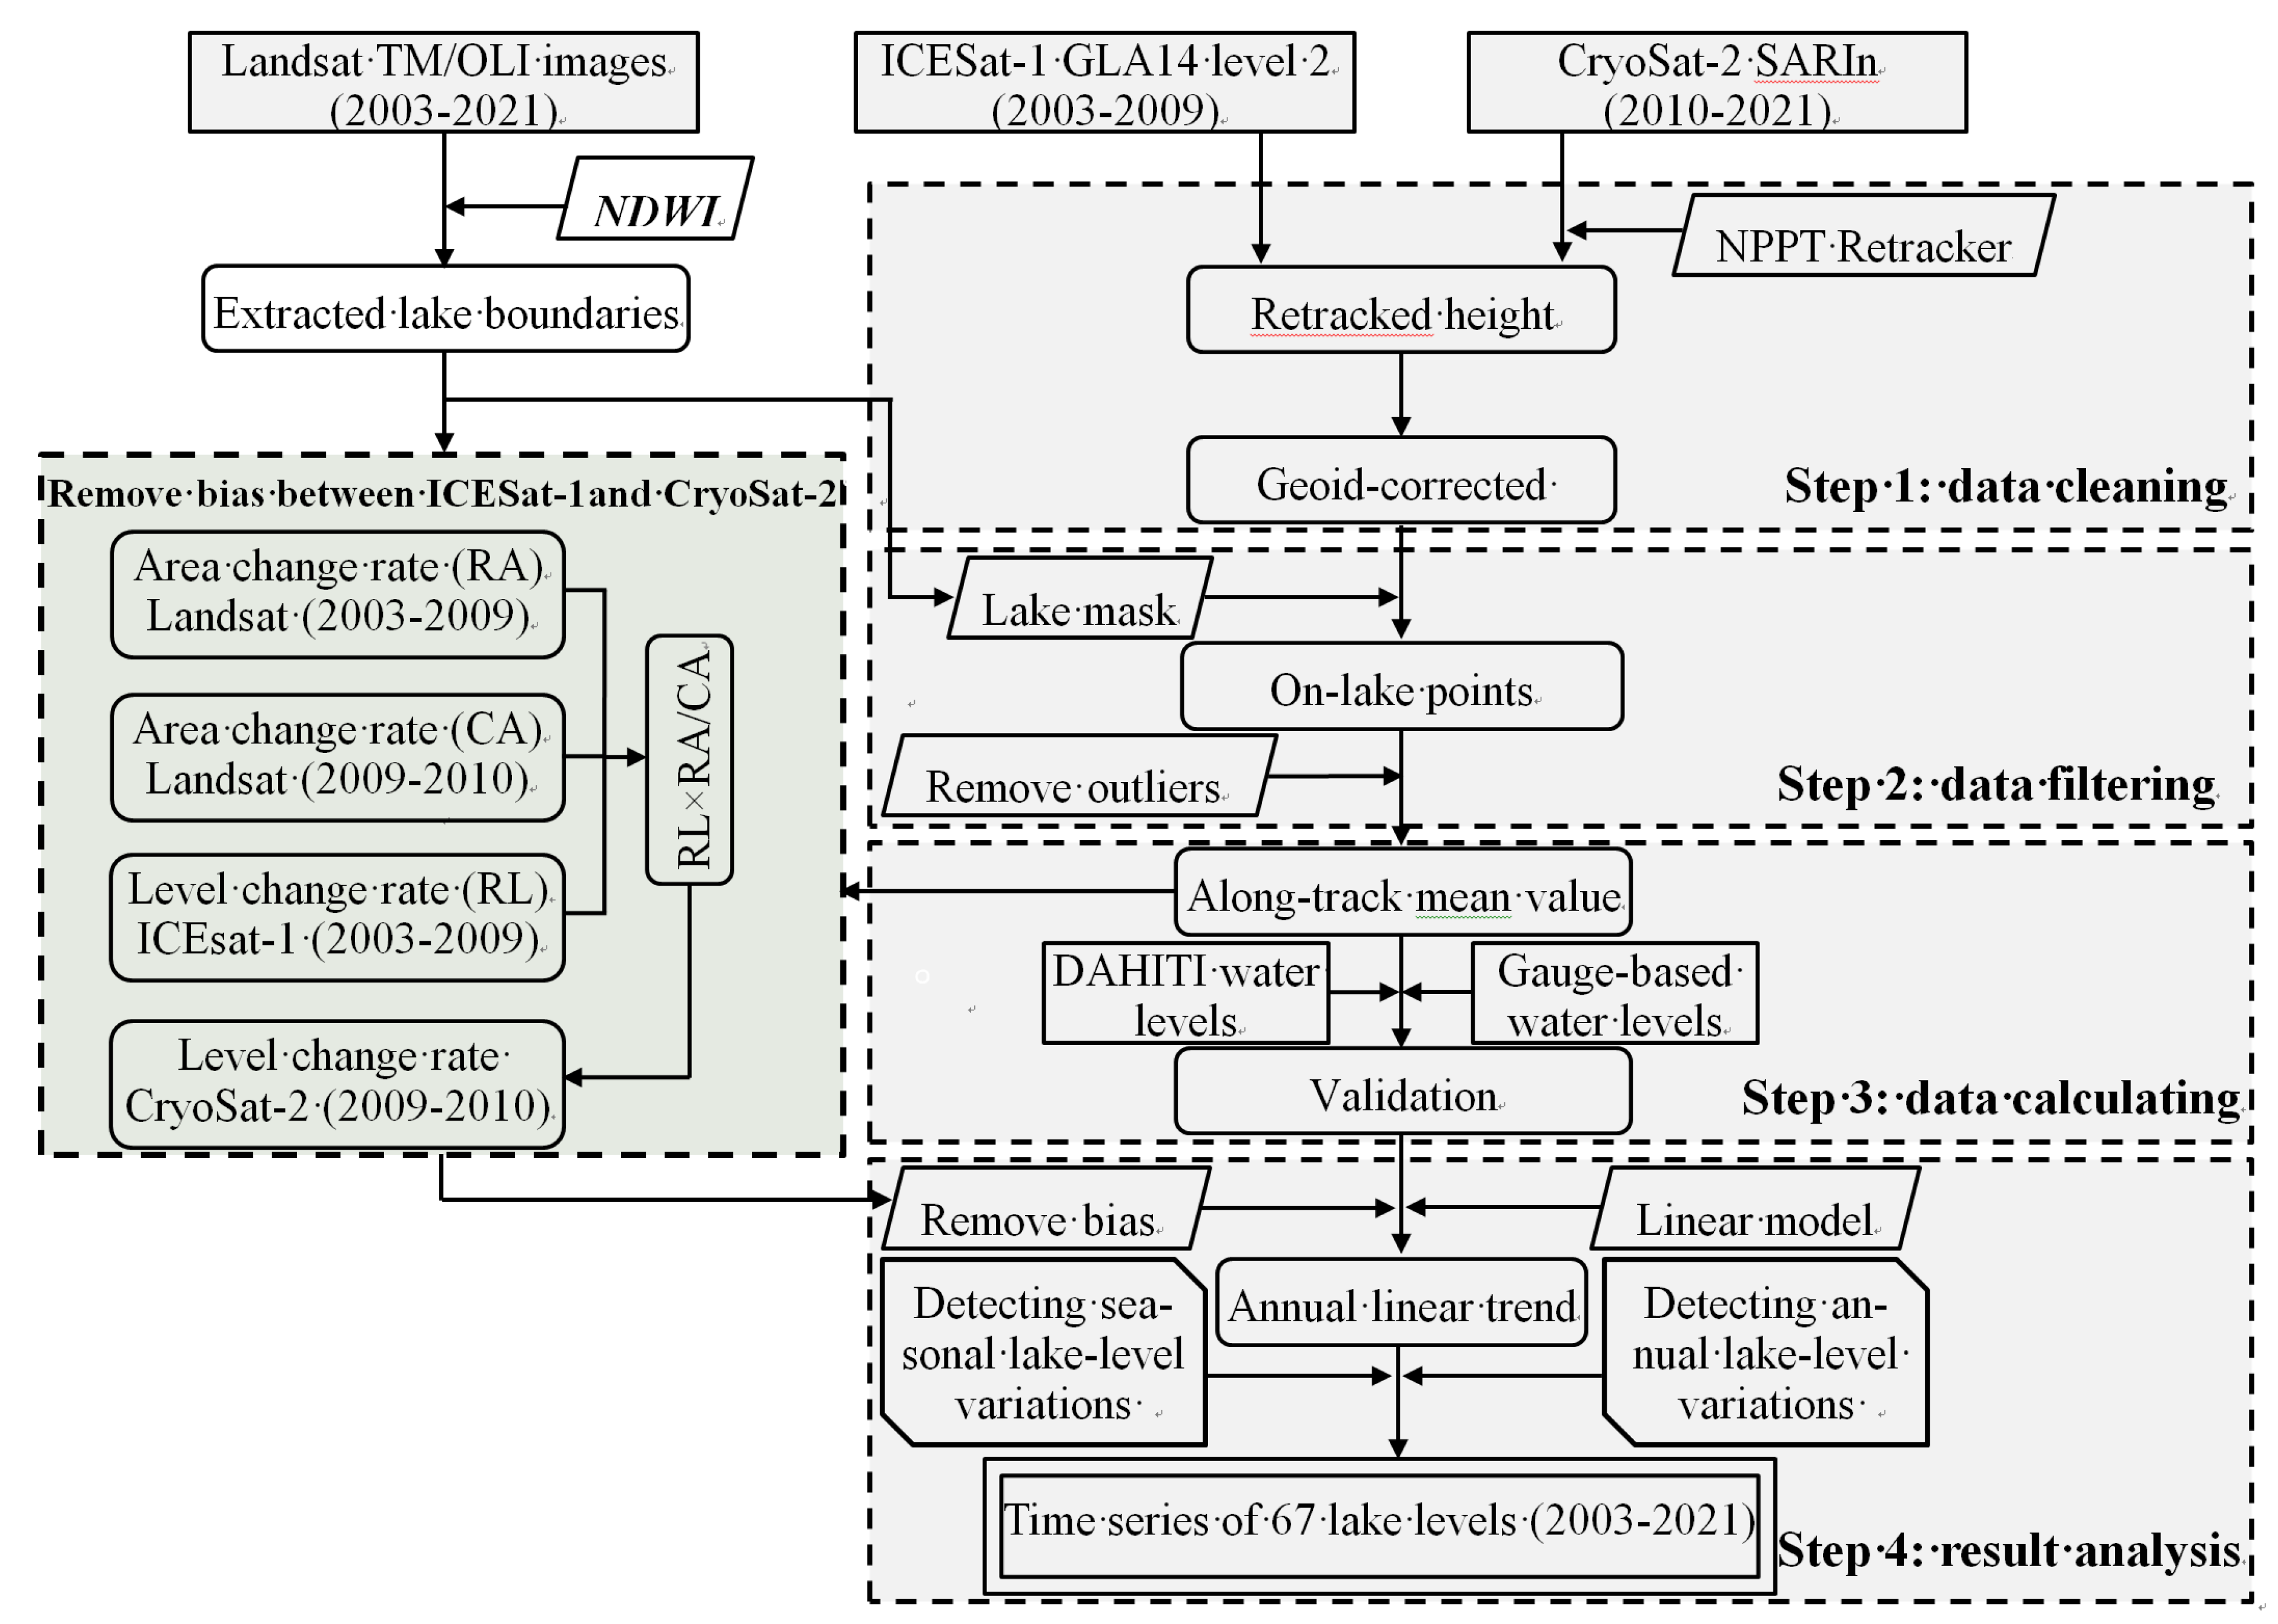
3. Data and Methodology
3.1. Landsat Images and Processing
3.2. CryoSat-2 Radar Altimetry Data and Processing
3.3. ICESat-1 GLA14 Product and Processing
3.4. Meteorological Data and Processing
3.5. In Situ Lake Levels and DAHITI Database
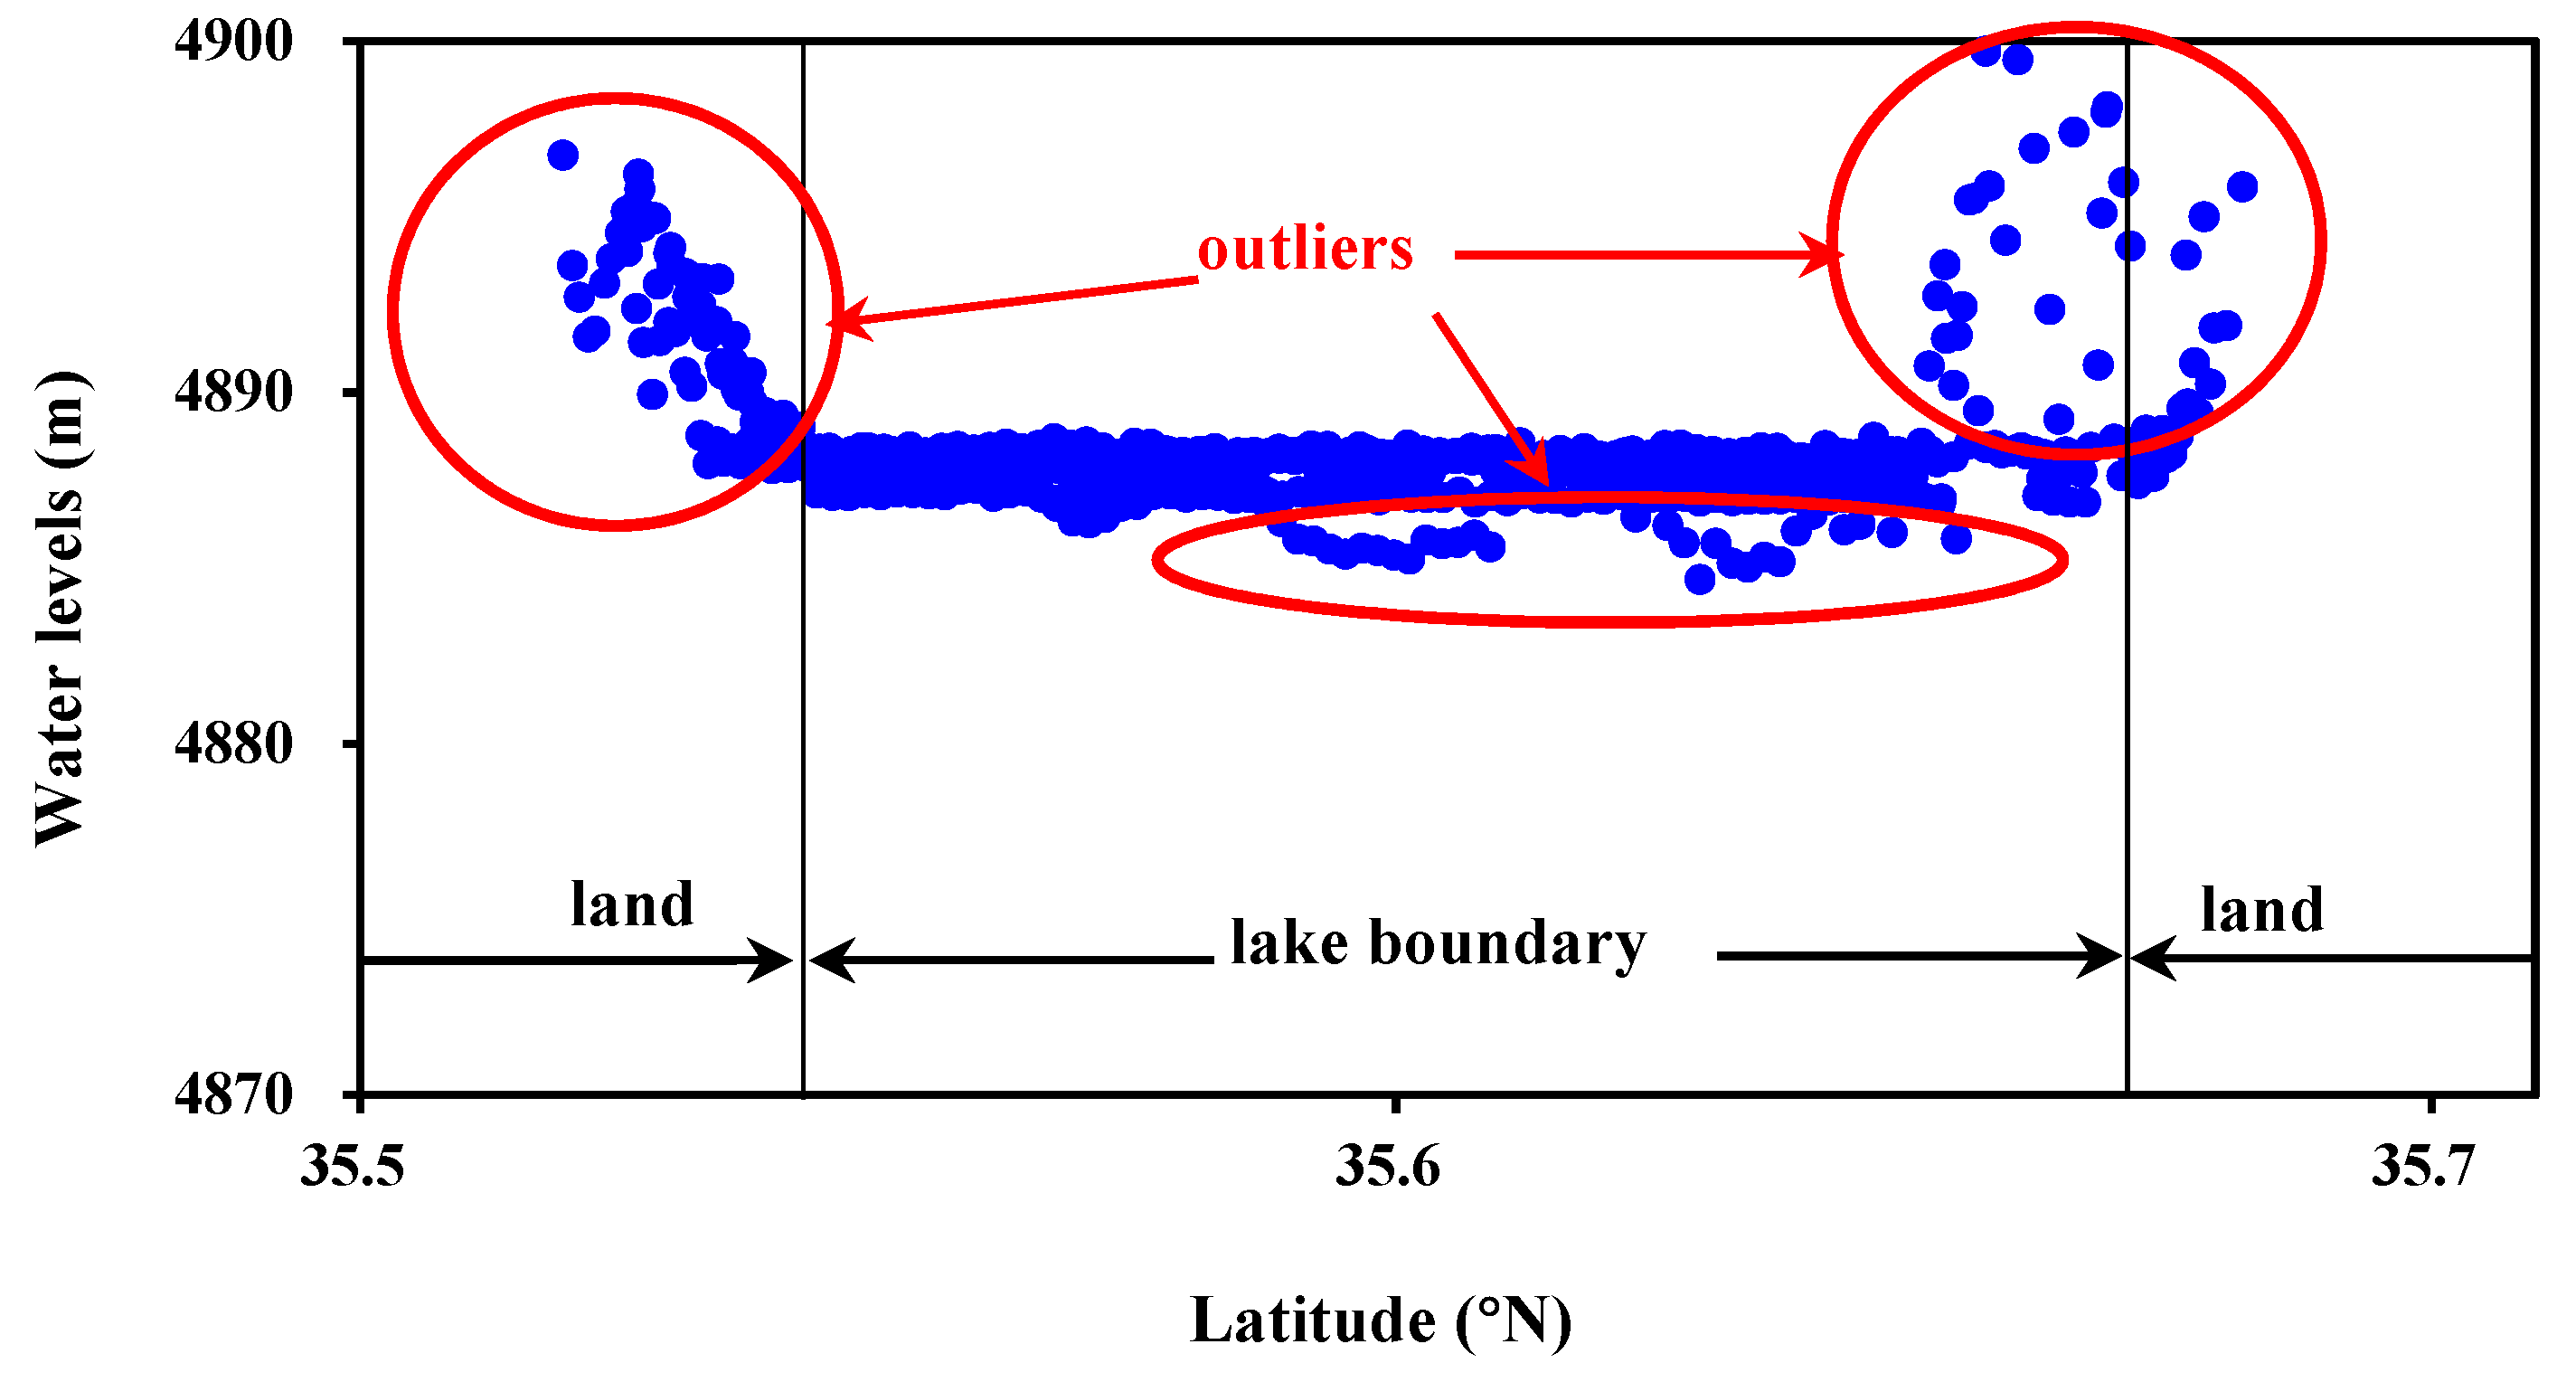
3.6. Removing Systematic Elevation Bias and Estimating Linear Change Trends
4. Results
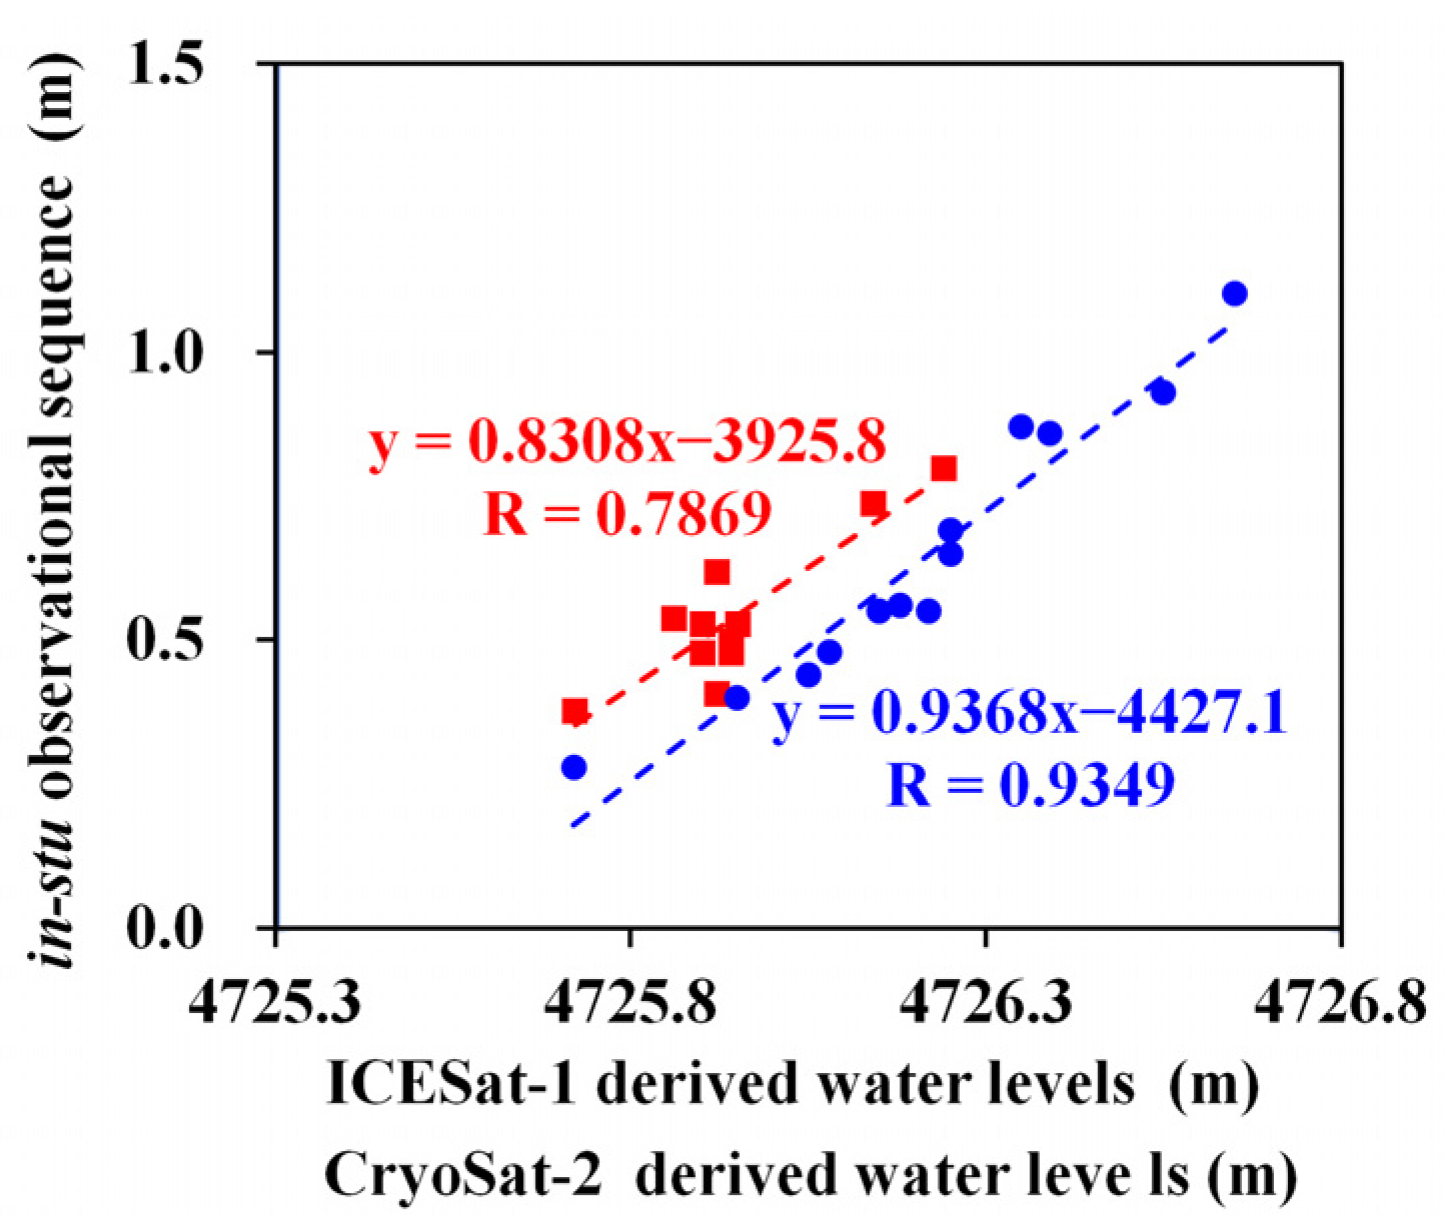
4.1. Validation with In Situ Lake Levels and Comparison with DAHITI Database
4.2. The Detailed Characteristics of Water Levels Changes in Four Typical Lakes
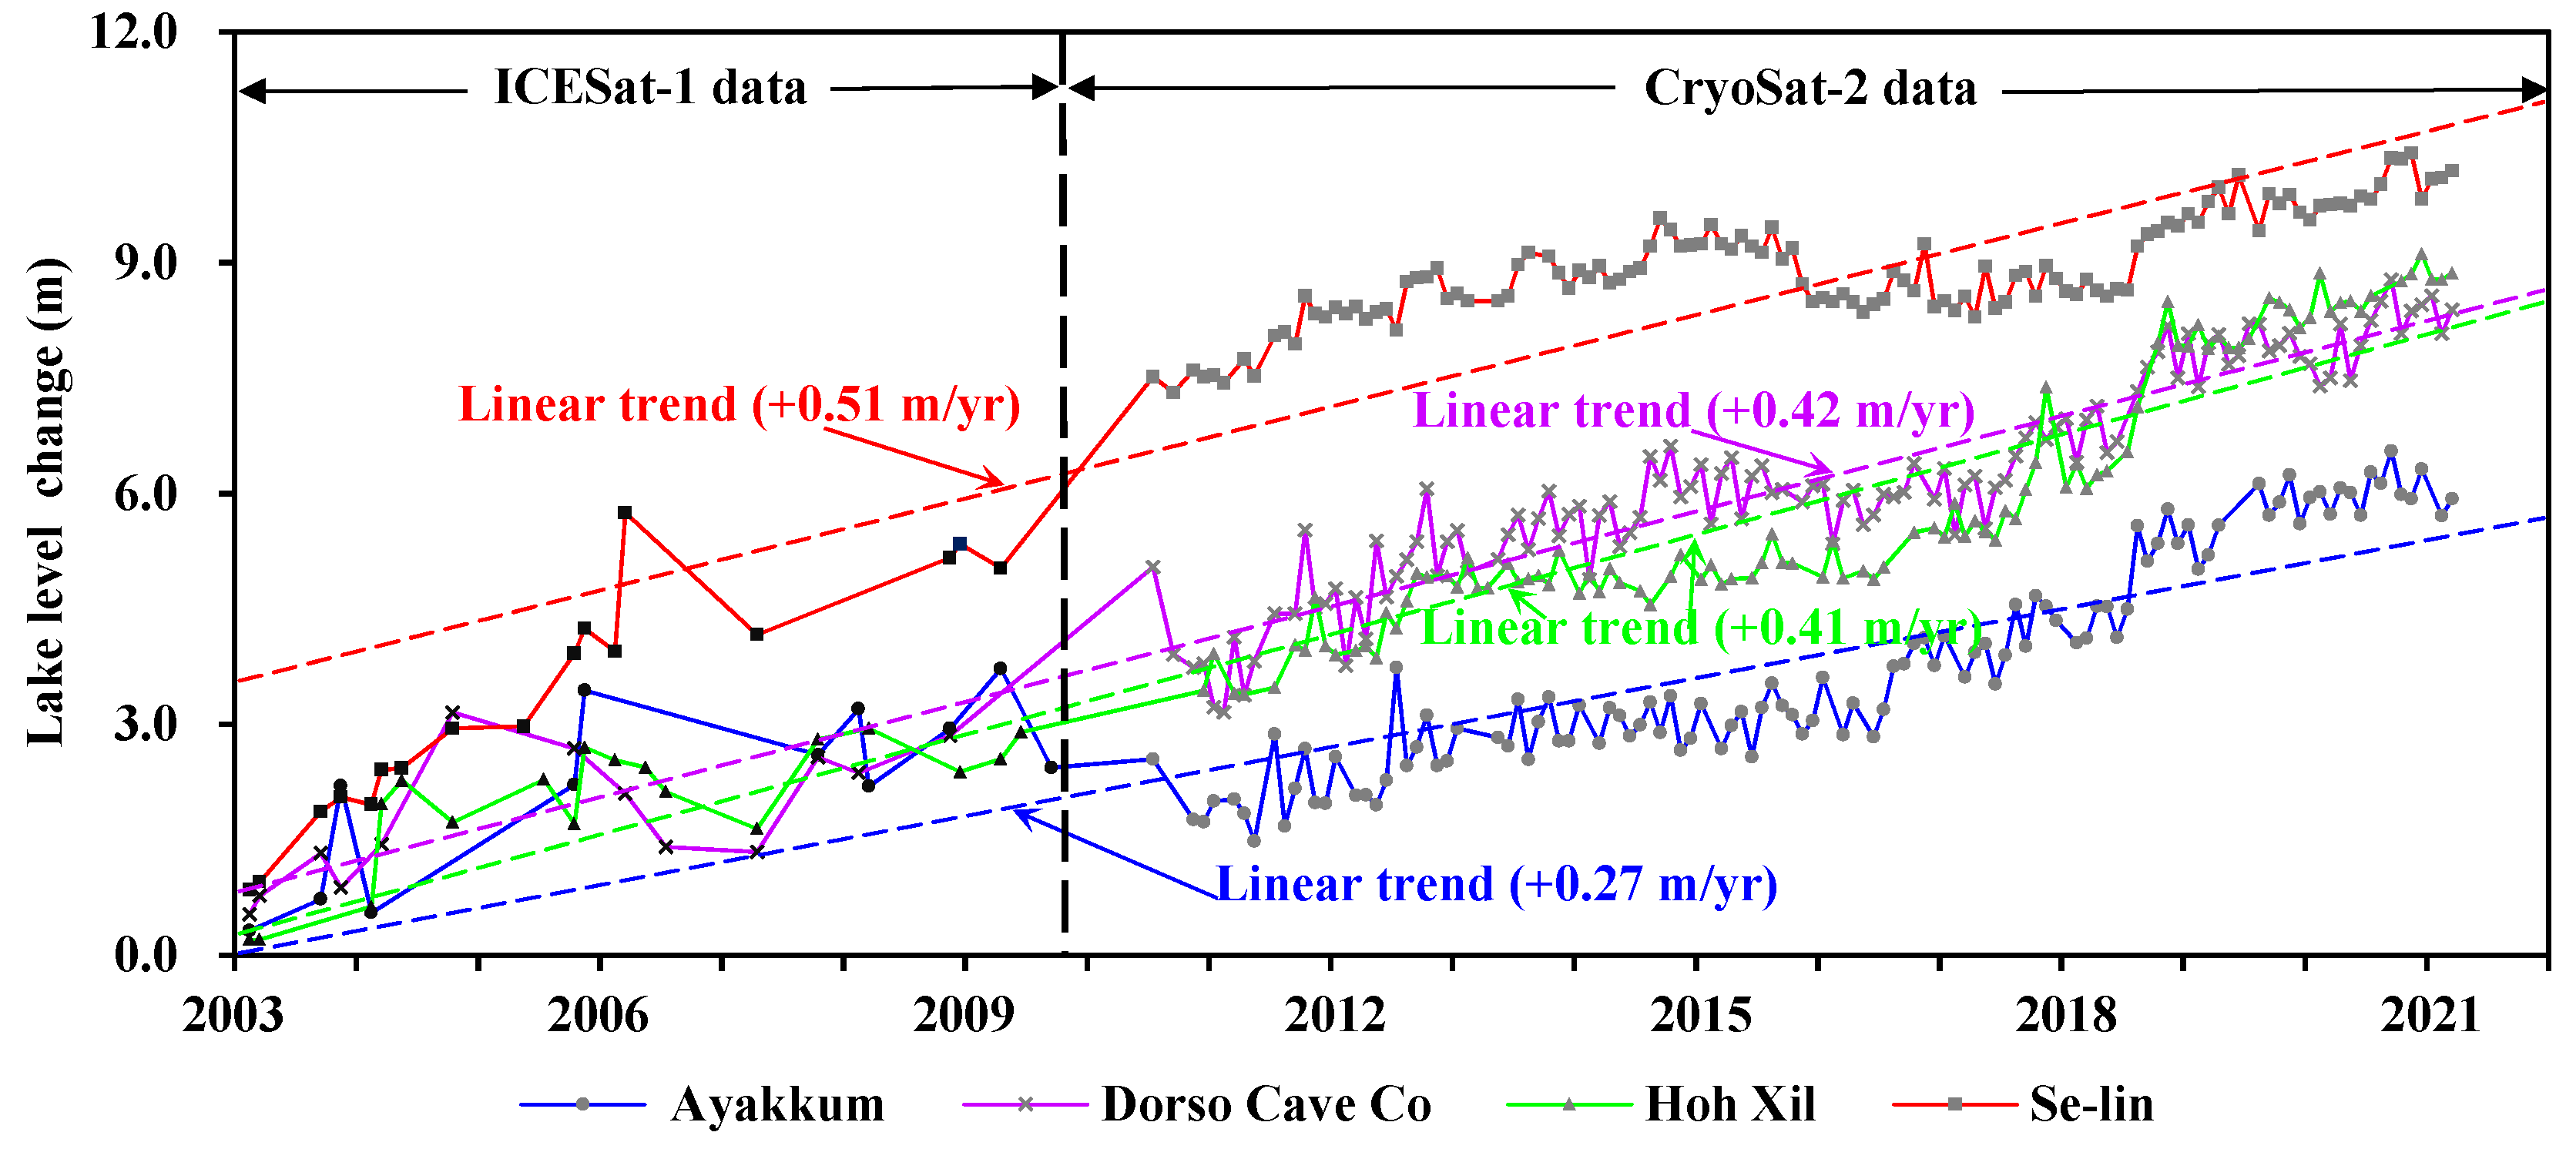
4.2.1. Interannual Variations in Water Level for Four Typical Lakes
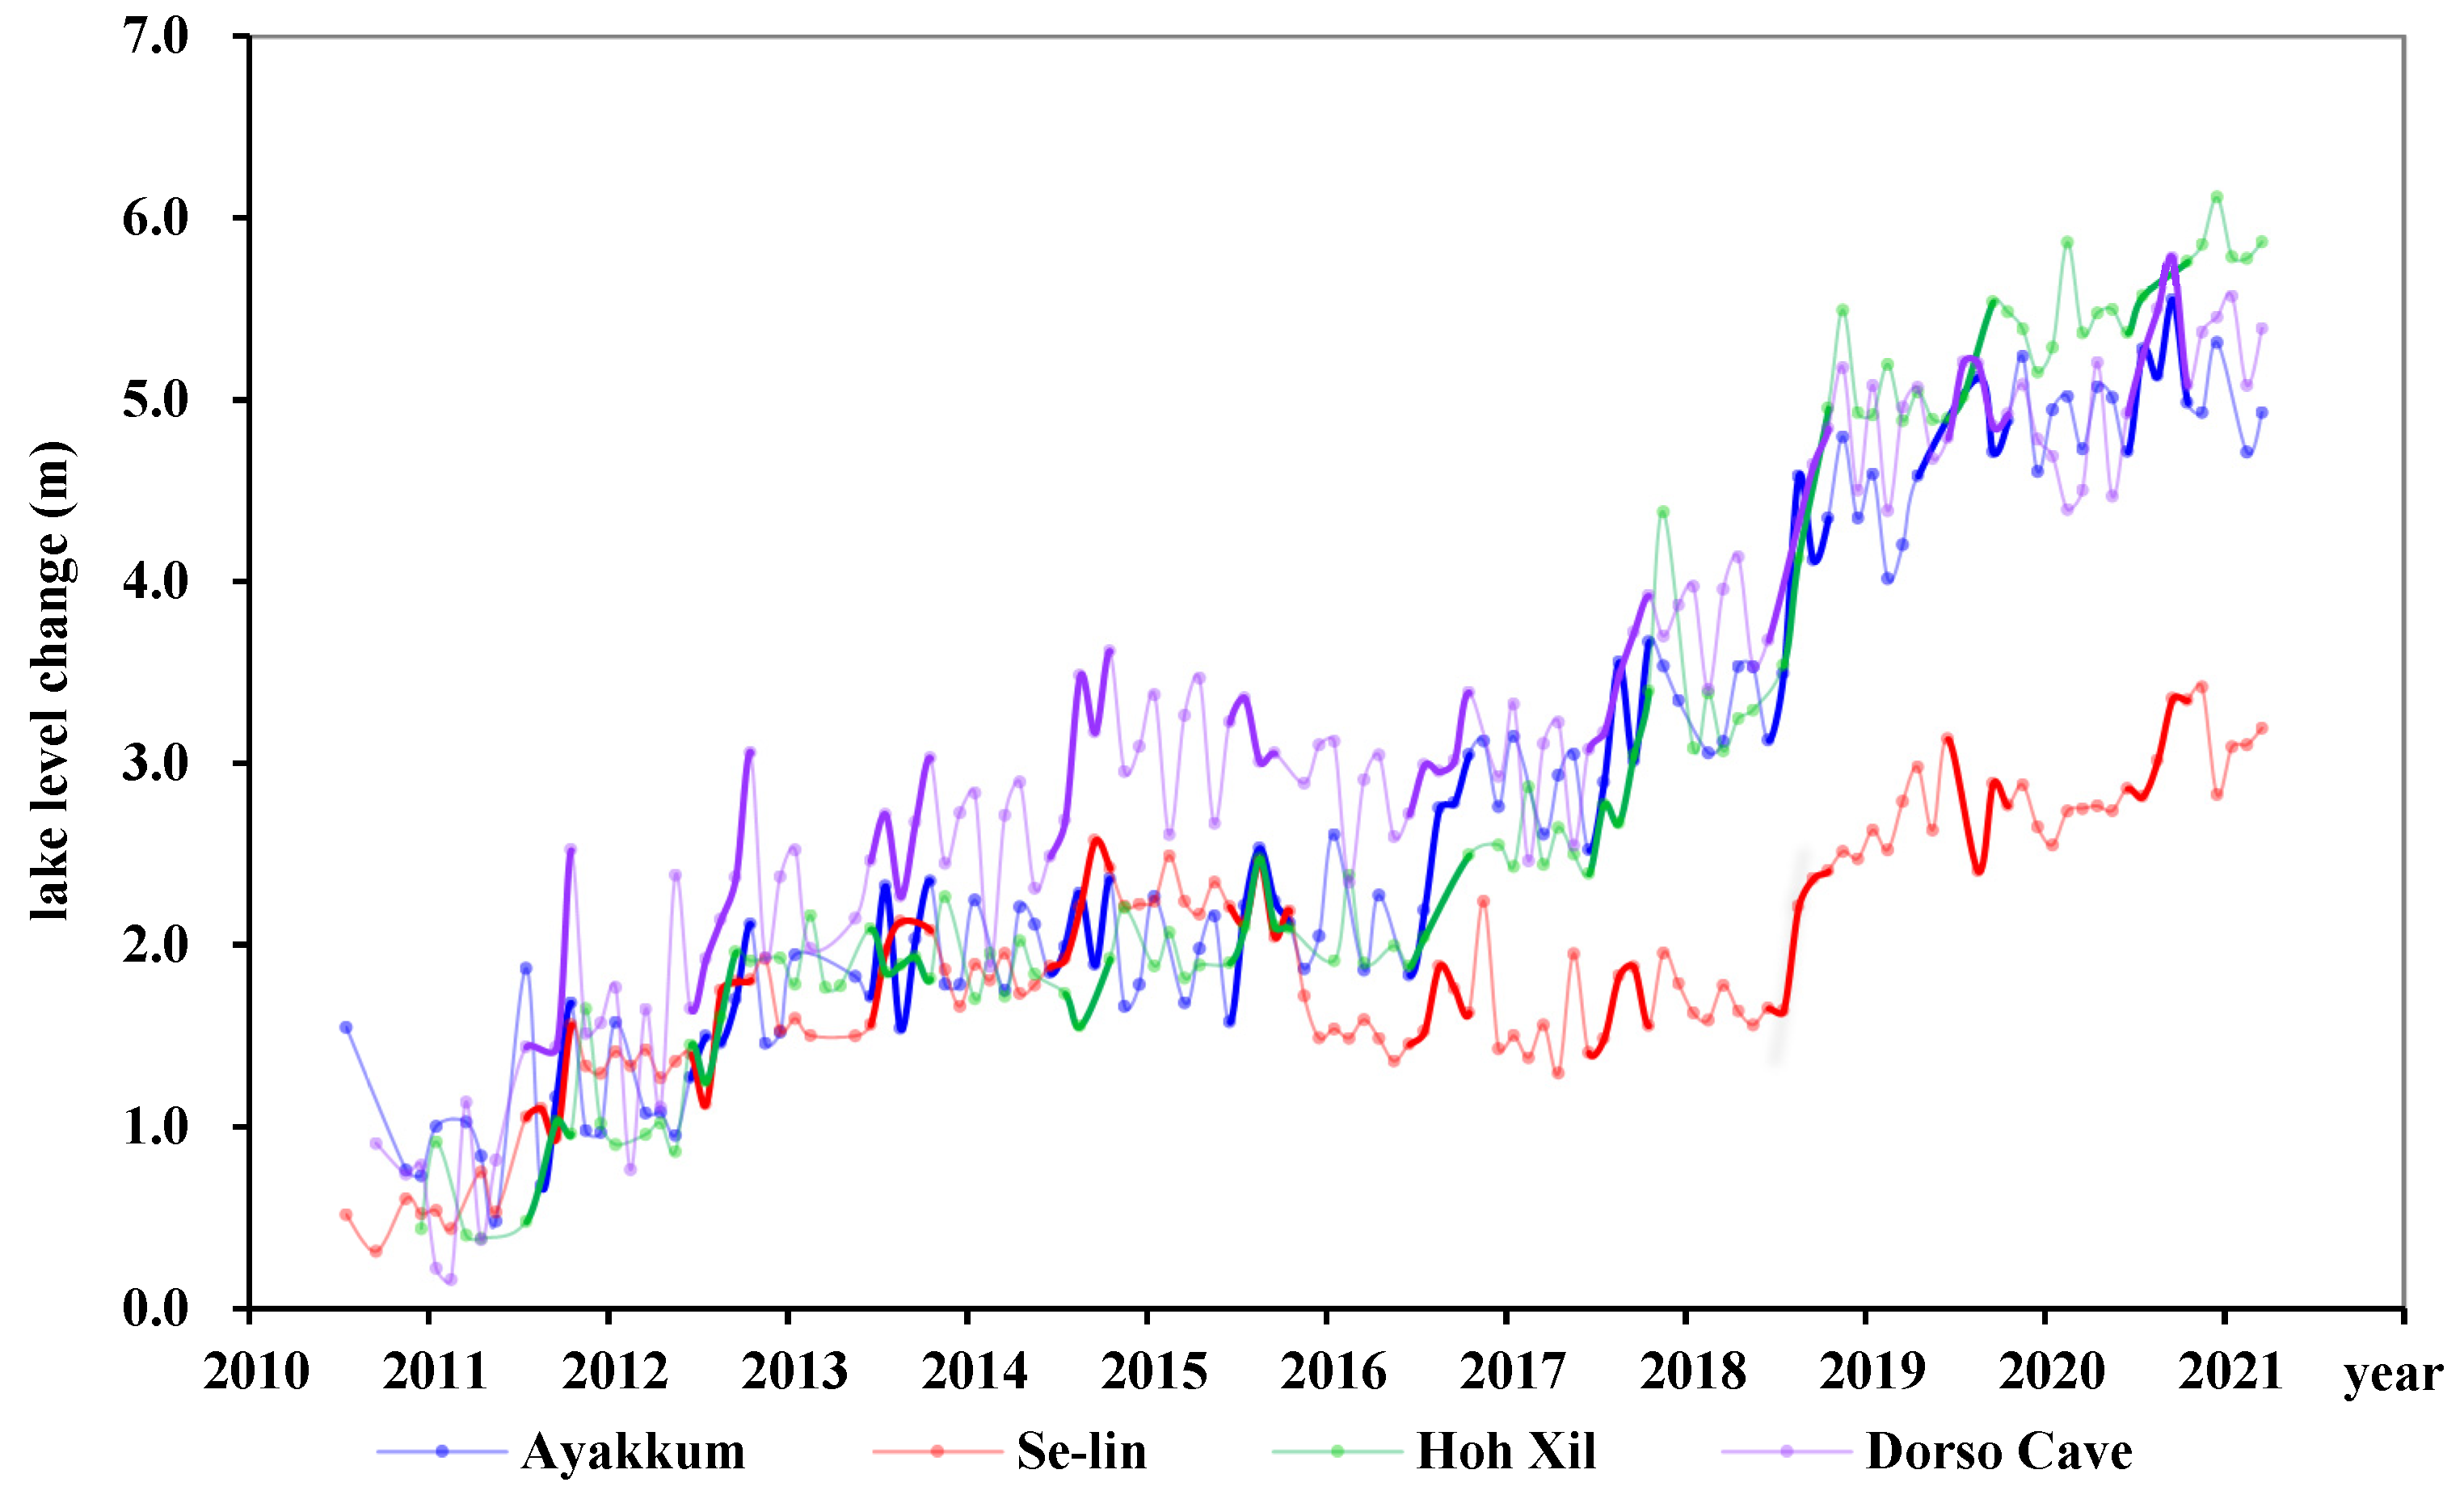
4.2.2. Monthly and Seasonal Characteristics of Lake Level Variations
4.3. Overall Water Level Changes of the 67 Studied Lakes
4.3.1. Temporal Variations of Lake Level in Western China
4.3.2. Spatial Patterns of Lake Level Variations
5. Discussion
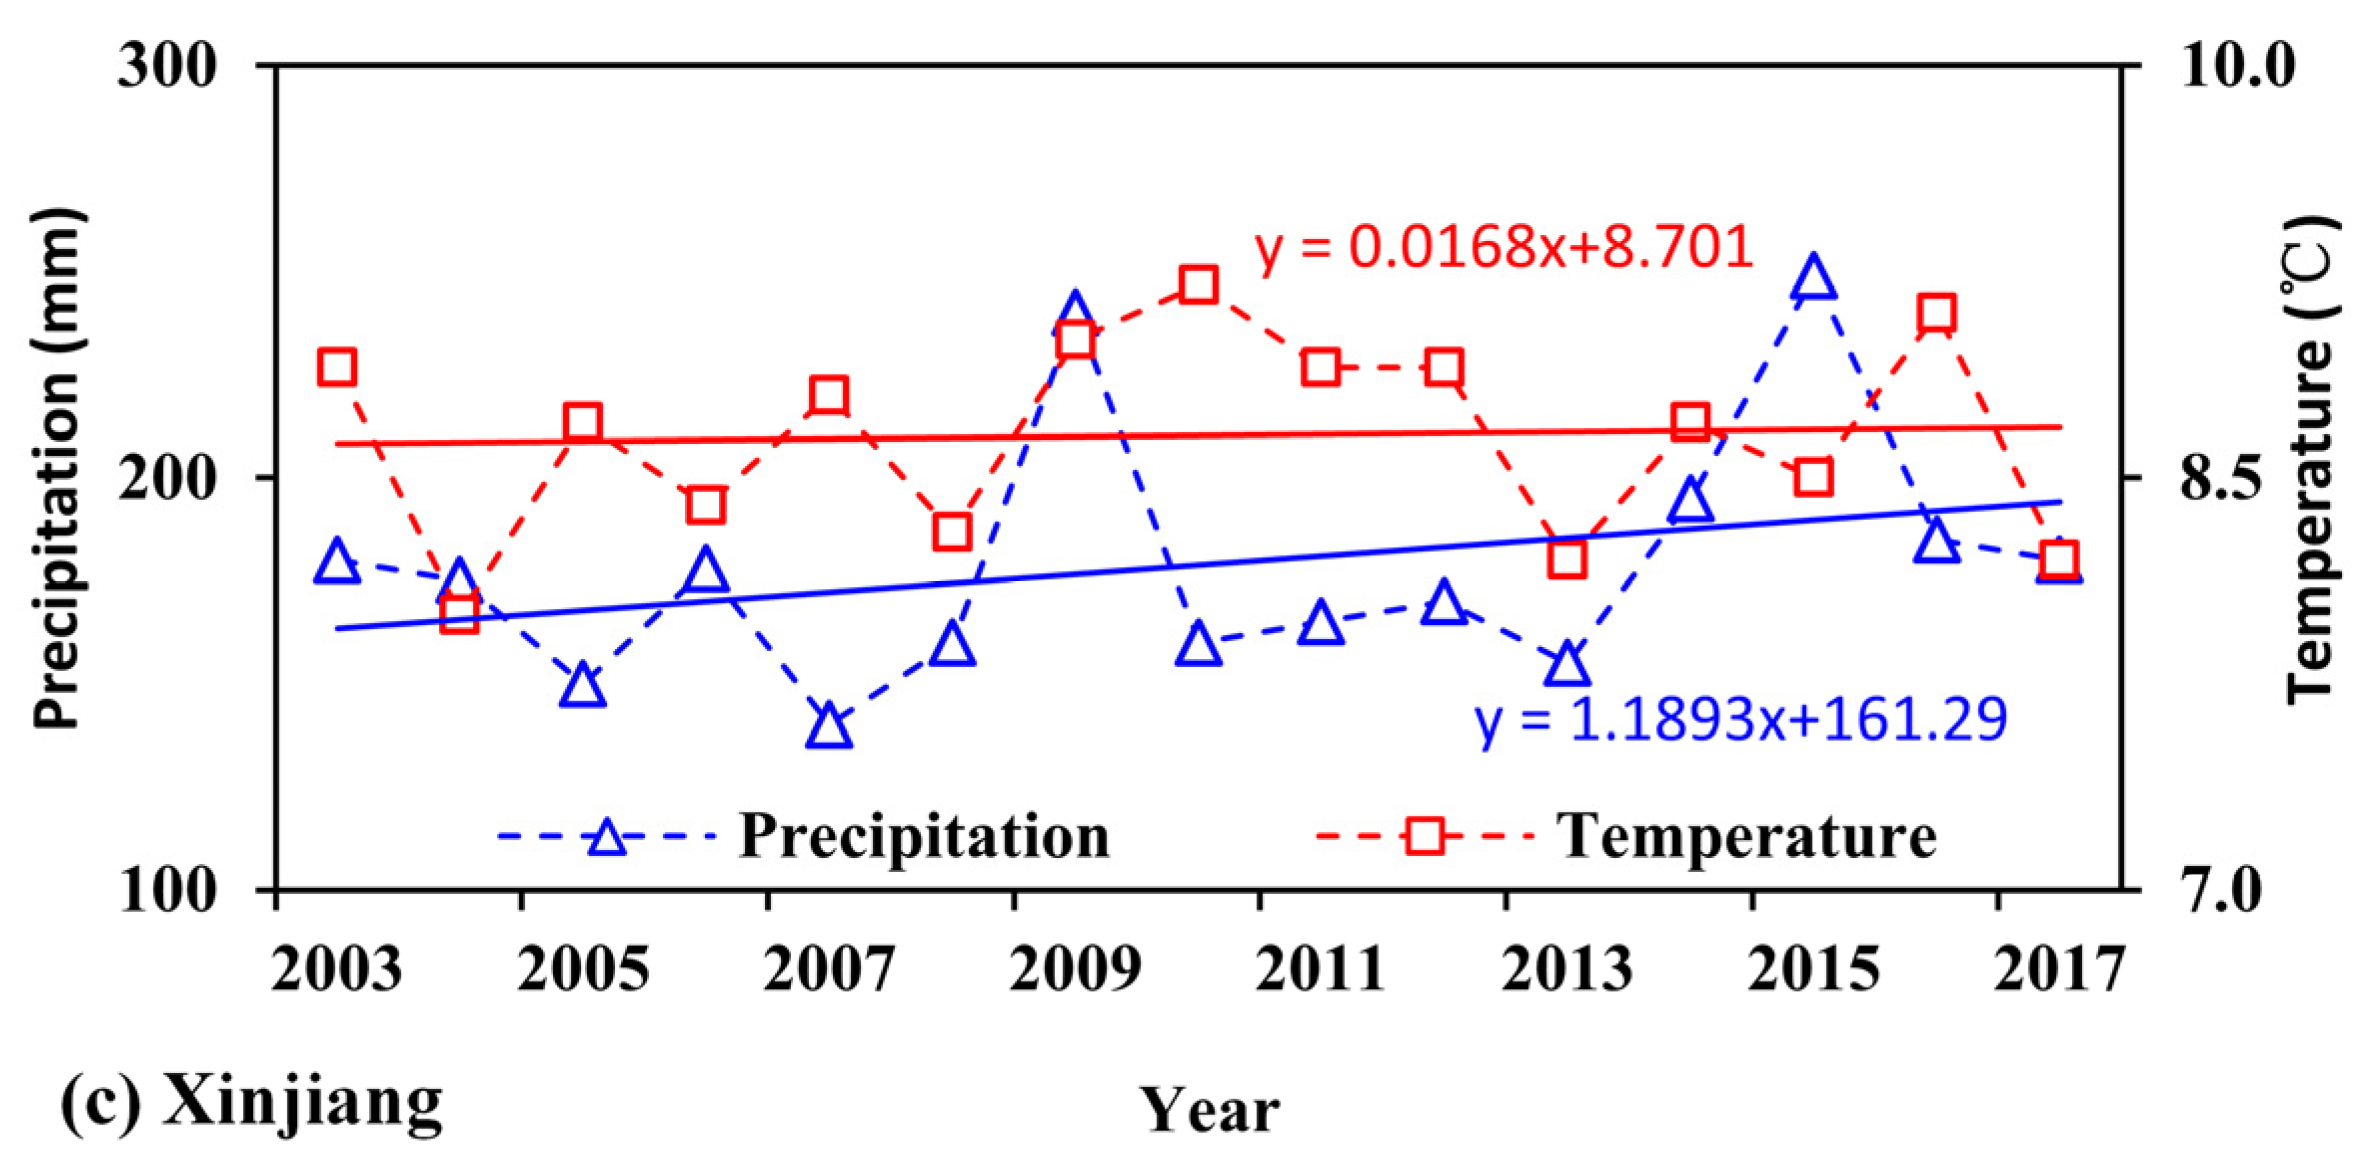
5.1. The Lake Level Rise in the Context of a Warm and Humid Climate State
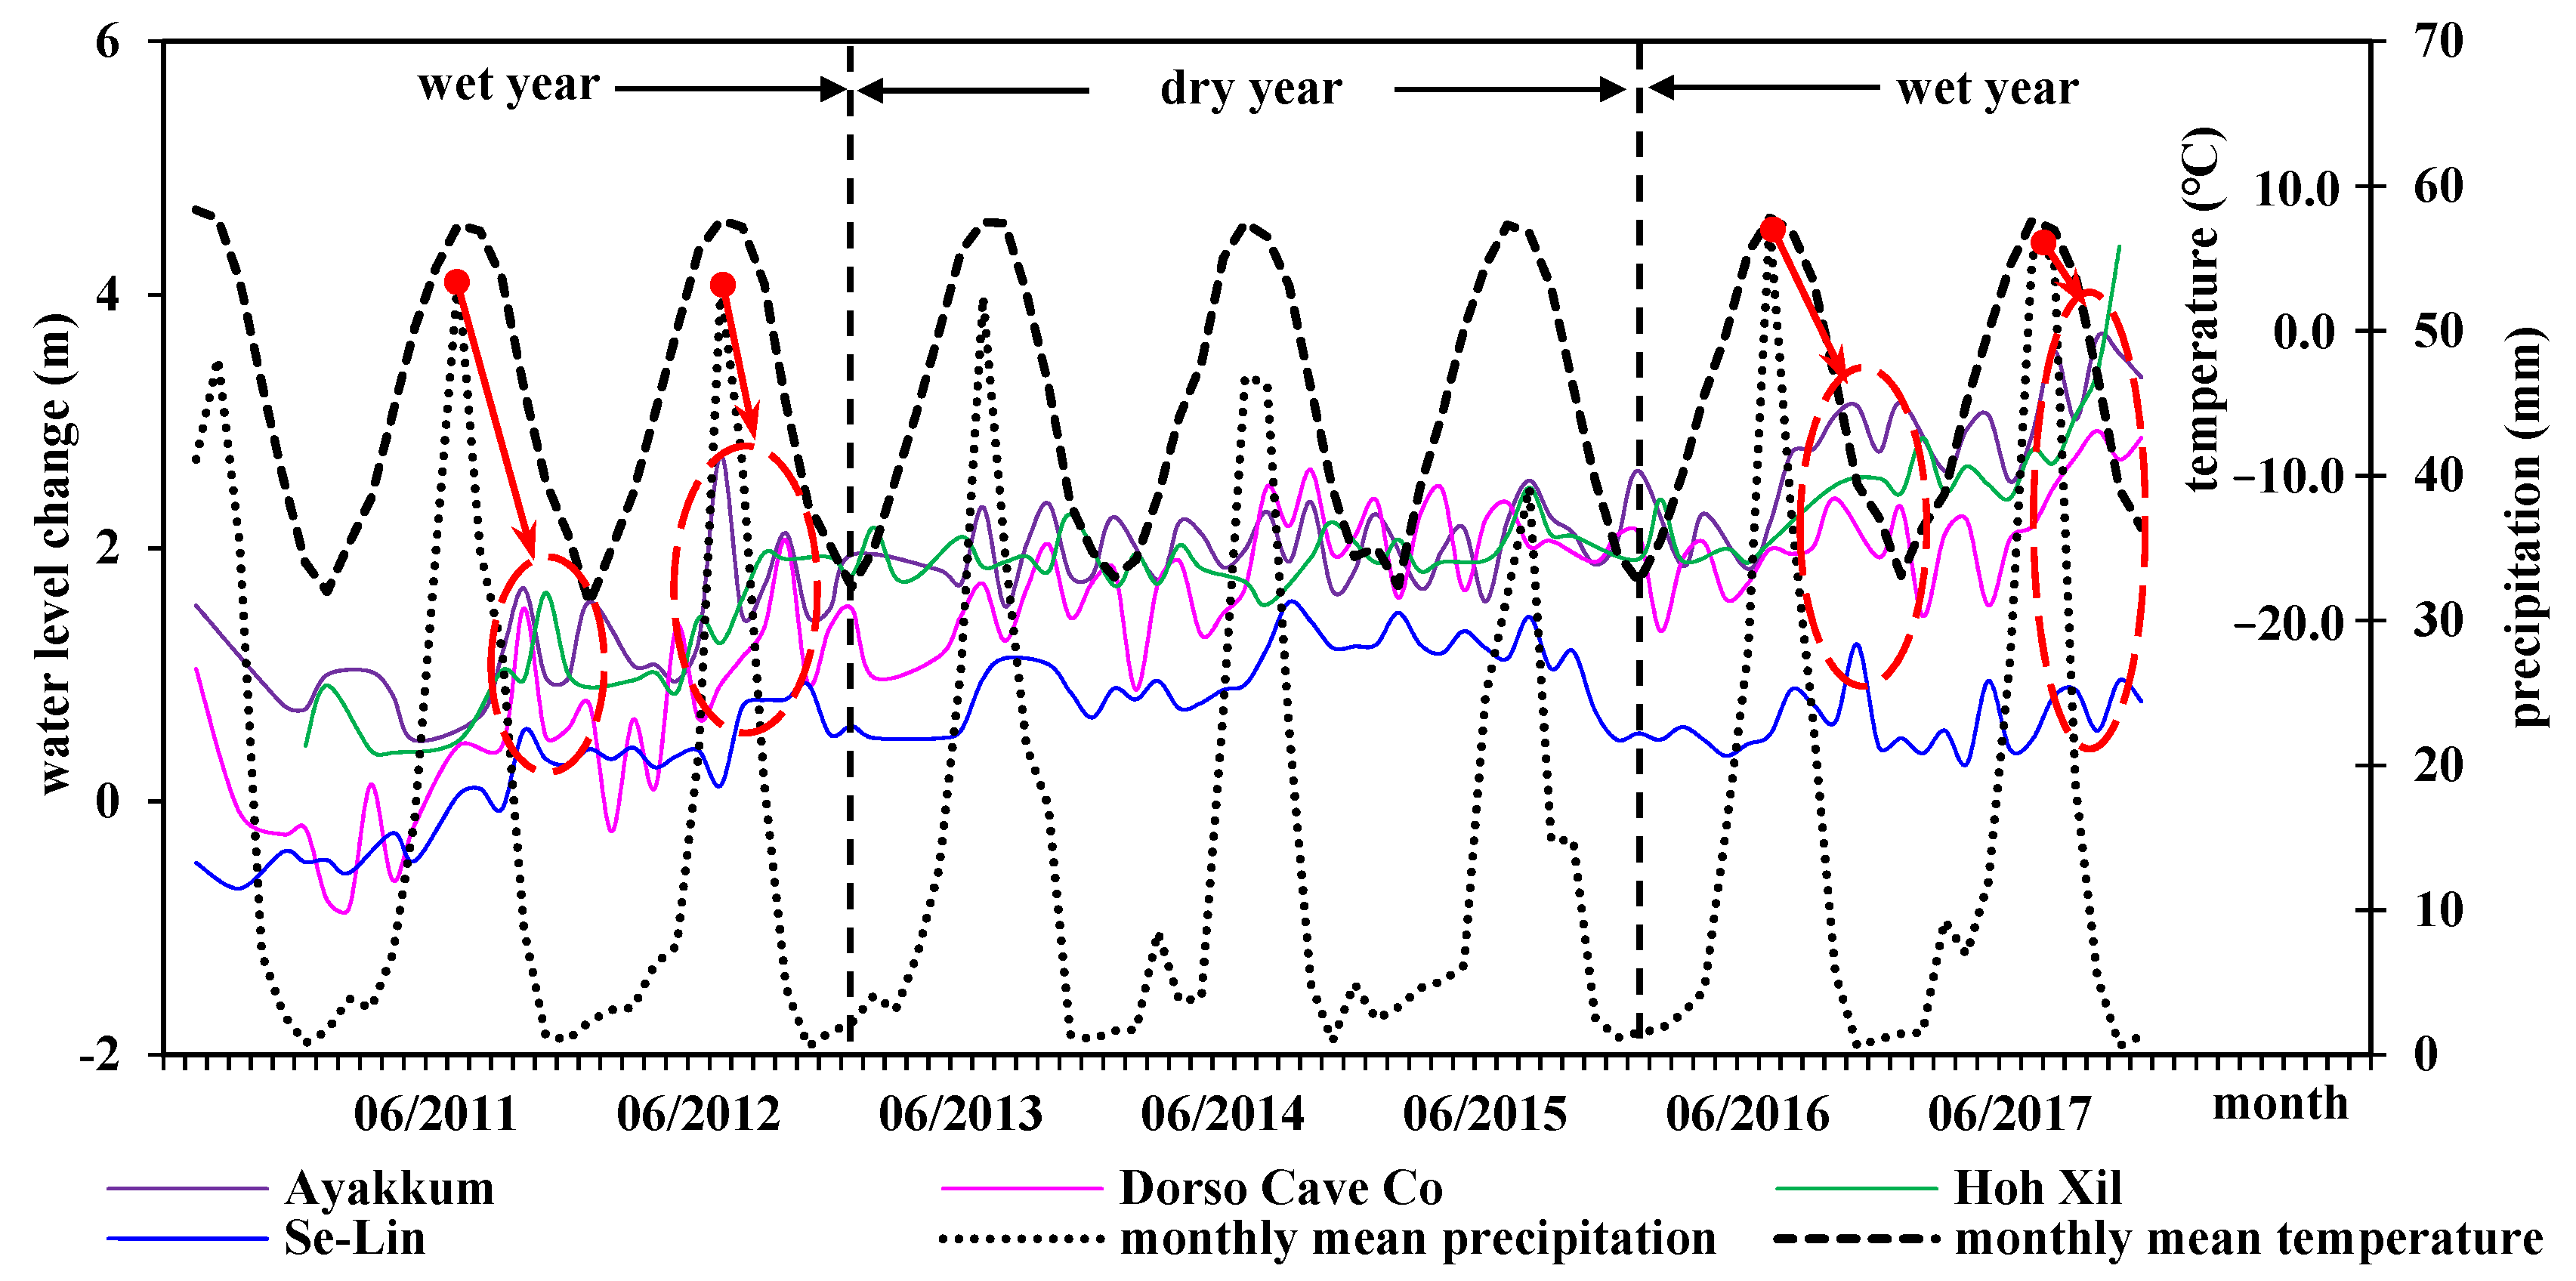
5.2. Precipitation Seasonality and Lake Level Monthly Variations
5.3. Spatial Heterogeneity for Climate Driving Mechanism of Lake Level Change
6. Conclusions
Author Contributions
Funding
Data Availability Statement
Conflicts of Interest
References
- Lehner, B.; Doll, P. Development and validation of a global database of lakes, reservoirs and wetlands. J. Hydrol. 2004, 296, 1–22. [Google Scholar] [CrossRef]
- William, Y.B.; Chang, W. Large Lakes of China. J. Great Lakes Res. 1987, 13, 235–249. [Google Scholar]
- Qin, B.; Huang, Q. Evaluation of the Climatic Change Impacts on the Inland Lake—A Case Study of Lake Qinghai, China. Resour. Res. 1998, 39, 695–714. [Google Scholar]
- Williams, W.D. Chinese and Mongolian saline lakes: A limnological overview. Hydrobiologia 1991, 210, 39–66. [Google Scholar] [CrossRef]
- Revelle, R.R.; Waggoner, P.E. Effects of a Carbon Dioxide-Induced Climatic Change on Water Supplies in 7 the Western United States. Chang. Clim. 1983, 496, 419–432. [Google Scholar]
- Guo, Z.; Miao, Q.; Li, X. Variation Characteristics of Temperature over Northern China in Recent 50 Years. Entia Geogr. Sin. 2005, 25, 448–454. [Google Scholar]
- Liu, C.; Du, L.; Chen, X.; Qiao, X. The Change of Effectively Irrigated Land Area in China during the Past 20 Years. Resour. Sci. 2006, 28, 8–12. [Google Scholar]
- Song, C.; Huang, B.; Ke, L.; Richards, K.S. Remote sensing of alpine lake water environment changes on the Tibetan Plateau and surroundings: A review. Isprs. J. Photogramm. 2014, 92, 26–37. [Google Scholar] [CrossRef]
- Khanal, S.; Lutz, A.F.; Kraaijenbrink, P.D.A.; Hurk, B.V.D.; Immerzeel, W.W. Variable 21st Century Climate Change Response for Rivers in High Mountain Asia at Seasonal to Decadal Time Scales. Water Resour. Res. 2021, 57, e2020WR029266. [Google Scholar] [CrossRef]
- Duan, Z.; Bastiaanssen, W. Estimating water volume variations in lakes and reservoirs from four operational satellite altimetry databases and satellite imagery data. Remote Sens. Environ. 2013, 134, 403–416. [Google Scholar] [CrossRef]
- Peng, G. Remote sensing of environmental change over China: A review. Sci. Bull. 2012, 57, 2793–2801. [Google Scholar]
- Chen, T.; Song, C.; Ke, L.; Wang, J.; Li, K.; Wu, Q. Estimating seasonal water budgets in global lakes by using multi-source remote sensing measurements. J. Hydrol. 2020, 593, 125781. [Google Scholar] [CrossRef]
- Crétaux, J.F.; Jelinski, W.; Calmant, S.; Kouraev, A.; Vuglinski, V.; Bergé-Nguyen, M.; Gennero, C.M.; Nino, F.; Del Rio, R.A.; Cazenave, A.; et al. SOLS: A lake database to monitor in the Near Real Time water level and storage variations from remote sensing data. Adv. Space Res. 2011, 47, 1497–1507. [Google Scholar] [CrossRef]
- Li, J.; Chen, X.; Bao, A. Spatial-temporal Characteristics of Lake Level Changes in Central Asia during 2003–2009. Acta Geogr. Sin. 2011, 66, 1219–1229. [Google Scholar]
- Luo, R.; Yuan, Q.; Yue, L.; Shi, X. Monitoring Recent Lake Variations Under Climate Change Around the Altai Mountains Using Multimission Satellite Data. IEEE J-STARS 2020, 14, 1374–1388. [Google Scholar] [CrossRef]
- Luo, S.; Song, C.; Zhan, P.; Liu, K. Refined estimation of lake water level and storage changes on the Tibetan Plateau from ICESat/ICESat-2. Catena 2021, 200, 105177. [Google Scholar] [CrossRef]
- Zhang, G.; Xie, H.; Kang, C.; Yi, D.; Ackley, S. Monitoring lake level changes on the Tibetan Plateau using ICESat altimetry data (2003–2009). Remote Sens. Environ. 2011, 115, 1733–1742. [Google Scholar] [CrossRef]
- Zhang, G.; Chen, W.; Xie, H. Tibetan Plateau’s Lake Level and Volume Changes From NASA’s ICESat/ICESat-2 and Landsat Missions. Geophys. Res. Lett. 2019, 46, 13107–13118. [Google Scholar] [CrossRef]
- Jiang, L.; Nielsen, K.; Andersen, O.B.; Bauer-Gottwein, P. A bigger picture of how the Tibetan lakes change over the past decade revealed by CryoSat-2 altimetry. J. Geophys. Res-Atmos. 2020, 125, e2020JD033161. [Google Scholar] [CrossRef]
- Kleinherenbrink, M.; Ditmar, P.G.; Lindenbergh, R.C. Retracking Cryosat data in the SARIn mode and robust lake level extraction. Remote Sens. Environ. 2014, 152, 38–50. [Google Scholar] [CrossRef]
- Fan, C.; Song, C.; Li, W.; Liu, K.; Wang, J. What drives the rapid water-level recovery of the largest lake (Qinghai Lake) of China over the past half century? J. Hydrol. 2021, 593, 125921. [Google Scholar] [CrossRef]
- Zhao, Y.; Liao, J.; Shen, G.; Zhang, X. Monitoring the water level changes in Qinghai Lake with satellite altimetry data. J. Remote Sens. 2017, 21, 633–644. [Google Scholar]
- Zhang, G. China Lake Dataset (1960s–2020); National Tibetan Plateau Data Center: Beijing, China, 2019. [Google Scholar]
- Mcfeeters, S.K. The use of the Normalized Difference Water Index (NDWI) in the delineation of open water features. Int. J. Remote Sens. 1996, 17, 1425–1432. [Google Scholar] [CrossRef]
- Kumari, N.; Srivastava, A.; Kumar, S. Hydrological Analysis Using Observed and Satellite-Based Estimates: Case Study of a Lake Catchment in Raipur, India. J. Indian Soc. Remote Sens. 2022, 50, 115–128. [Google Scholar] [CrossRef]
- Labroue, S.; Boy, F.; Picot, N.; Urvoy, M.; Ablain, M. First quality assessment of the Cryosat-2 altimetric system over ocean. Adv. Space Res. 2012, 50, 1030–1045. [Google Scholar] [CrossRef]
- Wingham, D.J.; Francis, C.R.; Baker, S.; Bouzinac, C.; Brockley, D.; Cullen, R.; de Chateau-Thierry, P.; Laxon, S.W.; Mallow, U.; Mavrocordatos, C. CryoSat: A mission to determine the fluctuations in Earth’s land and marine ice fields. Adv. Space Res. 2006, 37, 841–871. [Google Scholar] [CrossRef]
- Jain, M.; Jain, M.; Andersen, O.B.; Dall, J.; Stenseng, L. Sea surface height determination in the Arctic using Cryosat-2 SAR data from primary peak empirical retrackers. Adv. Space Res. 2015, 55, 40–50. [Google Scholar] [CrossRef]
- Nielsen, K.; Stenseng, L.; Andersen, O.; Villadsen, H.; Knudsen, P. Validation of CryoSat-2 SAR mode based lake levels. Remote Sens. Environ. 2015, 171, 162–170. [Google Scholar] [CrossRef]
- Chen, J.; Liao, J. Monitoring lake level changes in China using multi-altimeter data (2016–2019). J. Hydrol. 2020, 590, 125544. [Google Scholar] [CrossRef]
- Guo, H.; Jiao, W.; Yang, Y. The Systematic Difference and Its Distribution between the 1985 National Height Datum and the Global Quasigeoid. Acta Geod. Cartogr. Sin. 2004, 33, 100–104. [Google Scholar]
- Bhang, K.J.; Schwartz, F.W.; Braun, A. Verification of the Vertical Error in C-Band SRTM DEM Using ICESat and Landsat-7, Otter Tail County, MN. IEEE Trans. Geosci. Remote Sens. 2007, 45, 36–44. [Google Scholar] [CrossRef]
- Zwally, H.J.; Yi, D.; Kwok, R.; Zhao, Y. ICESat measurements of sea ice freeboard and estimates of sea ice thickness in the Weddell Sea. J. Geophys. Res. Ocean 2008, 113, 1–17. [Google Scholar] [CrossRef]
- Zwally, H.J.; Schutz, B.; Abdalati, W.; Abshire, J.; Bentley, C.; Brenner, A.; Bufton, J.; Dezio, J.; Hancock, D.; Harding, D.; et al. ICESat’s laser measurements of polar ice, atmosphere, ocean, and land. J. Geodyn. 2002, 34, 405–445. [Google Scholar] [CrossRef]
- Ding, M. Temperature and Precipitation Grid Data of the Qinghai Tibet Plateau and Its Surrounding Areas in 1998–2017 Grid Data of Annual Temperature and Annual Precipitation on the Tibetan Plateau and Its Surrounding Areas during 1998–2017; National Tibetan Plateau Data Center: Beijing, China, 2019. [Google Scholar]
- Song, C.; Ye, Q.; Sheng, Y.; Gong, T. Combined ICESat and CryoSat-2 Altimetry for Accessing Water Level Dynamics of Tibetan Lakes over 2003–2014. Water 2015, 7, 4685–4700. [Google Scholar] [CrossRef]
- Wang, J. The lake Level Observation Data of Lake Namco from the Integrated Observation and Research Station of Multisphere in Namco (2007–2016); National Tibetan Plateau Data Center: Beijing, China, 2018. [Google Scholar]
- Siddique-E-Akbor, A.; Hossain, F.; Lee, H.; Shum, C.K. Inter-comparison study of water level estimates derived from hydrodynamic–hydrologic model and satellite altimetry for a complex deltaic environment. Remote Sens. Environ. 2011, 115, 1522–1531. [Google Scholar] [CrossRef]
- Schwatke, C.; Dettmering, D.; Bosch, W.; Seitz, F. DAHITI—An innovative approach for estimating water level time series over inland waters using multi-mission satellite altimetry. Hydrol. Earth Syst. Sci. 2015, 19, 4345–4364. [Google Scholar] [CrossRef]
- Liu, Z.; Yao, Z.; Wang, R. Evaluation and Validation of CryoSat-2-Derived Water Levels Using In Situ Lake Data from China. Remote Sens. 2019, 11, 899. [Google Scholar] [CrossRef]
- Busker, T.; Roo, A.D.; Gelati, E.; Schwatke, C.; Cottam, A. A global lake and reservoir volume analysis using a surface water dataset and satellite altimetry. Hydrol. Earth Syst. Sci. 2019, 23, 669–690. [Google Scholar] [CrossRef]
- Li, X.; Long, D.; Huang, Q.; Han, P.; Zhao, F.; Wada, Y. High-temporal-resolution water level and storage change data sets for lakes on the Tibetan Plateau during 2000–2017 using multiple altimetric missions and Landsat-derived lake shoreline positions. Earth Sysy. Sci. Data. 2019, 11, 1603–1627. [Google Scholar] [CrossRef]
- Xu, F.; Zhang, G.; Yi, S.; Chen, W. Seasonal trends and cycles of lake-level variations over the Tibetan Plateau using multi-sensor altimetry data. J. Hydrol. 2022, 604, 127251. [Google Scholar] [CrossRef]
- Jiang, L.; Nielsen, K.; Andersen, O.B.; Bauer-Gottwein, P. Monitoring recent lake level variations on the Tibetan Plateau using CryoSat-2 SARIn mode data. J. Hydrol. 2017, 544, 109–124. [Google Scholar] [CrossRef]
- Yang, R.; Yu, X.; Li, Y. The dynamic analysis of remote sensing information for monitoring the expansion of the selincuo lake in tibet. Remote Sens. Land Resour. 2003, 2, 64–67. [Google Scholar]
- Li, L.; Wang, W. The response of lake change to climate fluctuation in north Qinghai-Tibet Plateau in last 30 years. J. Geogr. Sci. 2009, 19, 131–142. [Google Scholar]
- Guo, Y.; Zhang, Y.; Ma, N.; Xu, J.; Zhang, T. Long-term changes in evaporation over Siling Co Lake on the Tibetan Plateau and its impact on recent rapid lake expansion. Atmos. Res. 2019, 216, 141–150. [Google Scholar] [CrossRef]
- Zhu, L.; Zhang, G.; Yang, R.; Liu, C.; Yang, K.; Qiao, B.; Han, B. Lake Variations on Tibetan Plateau of Recent 40 Years and Future Changing Tendency. Bull. Chin. Acad. Sci. 2019, 34, 1254–1263. [Google Scholar] [CrossRef]
- Yao, T.; Thompson, L.; Yang, W.; Yu, W.; Gao, Y.; Guo, X.; Yang, X.; Duan, K.; Zhao, H.; Xu, B.; et al. Different glacier status with atmospheric circulations in Tibetan Plateau and surroundings. Nat. Clim. Change. 2012, 2, 663–667. [Google Scholar] [CrossRef]
- Lei, Y.; Yang, K.; Wang, B.; Sheng, Y.; Bird, B.W.; Zhang, G.; Tian, L. Response of inland lake dynamics over the Tibetan Plateau to climate. Clim. Change 2014, 125, 281–290. [Google Scholar] [CrossRef]
- Qiao, B.; Zhu, L. Differences and cause analysis of changes in lakes of different supply types in the north-western Tibetan Plateau. Hydrol. Process. 2017, 31, 2752–2763. [Google Scholar] [CrossRef]
- Lei, Y.; Yao, T.; Yang, K.; Sheng, R.; Kleinherenbrink, M.; Yi, S.; Bird, B.W.; Zhang, X.; Zhu, L.; Zhang, G. Lake seasonality across the Tibetan Plateau and their varying relationship with regional mass changes and local hydrology. Geophys. Res. Lett. 2017, 44, 892–900. [Google Scholar] [CrossRef]
- Li, Y.; Liao, J.; Guo, H.; Liu, Z.; Shen, G. Patterns and Potential Drivers of Dramatic Changes in Tibetan Lakes, 1972–2010. PLoS ONE 2014, 9, e111890. [Google Scholar] [CrossRef]
- Zhu, L.; Peng, P.; Zhang, G.; Qiao, B.; Wang, J. The role of Tibetan Plateau lakes in surface water cycle under global changes. J. Lake Sci. 2020, 32, 597–608. [Google Scholar]
- Ye, Q.; Yao, T.; Zheng, H.; Zhang, X. Glacier and lake co-variations and their responses to climate change in the Mapam Yumco Basin on Tibet. Geogr. Res. 2008, 27, 1178–1190. [Google Scholar]
- Lioubimtseva, E.; Henebry, C.M. Climate and environmental change in arid Central Asia: Impacts, vulnerability, and adaptations. J. Arid. Environ. 2009, 73, 963–977. [Google Scholar] [CrossRef]
- Hu, R.; Yang, C.; Ma, H.; Jiang, F.; Urkunbek, A. Glaciers and lakes in the Tianshan mountains and climate trends. Arid Land Geo. 1994, 17, 1–9. [Google Scholar]
- Tourian, M.J.; Tarpanelli, A.; Elmi, O.; Qin, T.; Brocca, L.; Moramarco, T.; Sneeuw, N. Spatiotemporal densification of river water level time series by multimission satellite altimetry. Water Resour. Res. 2016, 52, 1140–1159. [Google Scholar] [CrossRef]


| Spatial Location | Lake Name | Start Date | Start Elevation (m) | Period 1 Date | Period 1 Elevation (m) | Period 2 Date | Period 2 Elevation (m) | Period 3 Date | Period 3 Elevation (m) | End Date | End Elevation (m) | Linear Trend |
|---|---|---|---|---|---|---|---|---|---|---|---|---|
| Brahmaputra | P’ei-k’u t’so | 03/2003 | 4579.3 | 03/2006 | 4580 | 05/2011 | 4580.3 | 05/2015 | 4580.4 | 03/2021 | 4579.6 | 0.04 |
| P’u-mo-ts’o | 02/2004 | 5011.1 | 03/2006 | 5011 | 11/2010 | 5012.2 | 11/2015 | 5012.1 | 09/2020 | 5012.4 | 0.14 | |
| Yang-Cho-Yung | 03/2003 | 4441.9 | 03/2006 | 4442.1 | 12/2010 | 4439.6 | 11/2015 | 4438.5 | 03/2021 | 4437.9 | −0.46 | |
| Hexi | Har | 05/2004 | 4077.8 | 03/2006 | 4077.8 | 10/2010 | 4078.4 | 11/2015 | 4079.3 | 03/2021 | 4081.5 | 0.21 |
| Indus | Bangong | 11/2003 | 4244.9 | 03/2006 | 4244.8 | 11/2010 | 4241.7 | 10/2015 | 4244.4 | 01/2021 | 4243.7 | −0.07 |
| Langa | 10/2010 | 4567.4 | 11/2015 | 4566.8 | 12/2020 | 4565.5 | −0.11 | |||||
| Mapam Yum | 03/2003 | 4586.8 | 11/2005 | 4586.9 | 10/2010 | 4586.4 | 11/2015 | 4586.5 | 04/2021 | 4586.4 | −0.03 | |
| Qaidam | Dabsan | 02/2004 | 2677.8 | 10/2005 | 2678.3 | 10/2010 | 2679.5 | 11/2015 | 2678.6 | 04/2021 | 2679.8 | 0.1 |
| Donggi Cona | 03/2003 | 4086.3 | 11/2010 | 4086.8 | 11/2015 | 4086.9 | 01/2021 | 4087.4 | 0.08 | |||
| Sitaginel | 11/2003 | 2686.8 | 03/2006 | 2687.1 | 03/2011 | 2687.1 | 10/2015 | 2687.2 | 03/2021 | 2689.3 | 0.12 | |
| Toson | 09/2010 | 2805.8 | 11/2015 | 2810 | 02/2021 | 2813.6 | 0.76 | |||||
| Qiangtang | Aksayquin | 02/2004 | 4852.5 | 03/2006 | 4852.8 | 11/2010 | 4849.8 | 11/2015 | 4850.9 | 03/2021 | 4852 | 0.07 |
| Ang-la jen | 03/2003 | 4716.6 | 03/2006 | 4717.3 | 11/2010 | 4716.7 | 11/2015 | 4716.1 | 02/2021 | 4718.5 | 0.06 | |
| Ang-tzu | 03/2004 | 4687.4 | 05/2006 | 4688.2 | 11/2010 | 4689.6 | 10/2015 | 4690.6 | 02/2021 | 4691.6 | 0.26 | |
| Aqqikkol | 05/2004 | 4256.9 | 05/2006 | 4258.3 | 07/2010 | 4256.6 | 11/2015 | 4259.3 | 03/2021 | 4262.4 | 0.29 | |
| Arkatag | 03/2003 | 4720.9 | 11/2005 | 4723.1 | 11/2010 | 4716.8 | 10/2015 | 4718.8 | 02/2021 | 4722.6 | −0.02 | |
| Ayakkum | 02/2003 | 3879.3 | 10/2005 | 3881.2 | 07/2010 | 3881.5 | 10/2015 | 3882.1 | 03/2021 | 3884.9 | 0.27 | |
| Bangdag | 03/2004 | 4910.2 | 03/2006 | 4910.9 | 04/2009 | 4913.7 | 11/2015 | 4913.8 | 10/2020 | 4917.8 | 0.44 | |
| Zhari Nam | 03/2003 | 4613.6 | 07/2005 | 4614.6 | 10/2010 | 4614.2 | 11/2015 | 4613.8 | 03/2021 | 4617 | 0.13 | |
| Cha-pu-yeh ch’a-k’a | 10/2010 | 4424.1 | 11/2015 | 4424.1 | 02/2021 | 4424.2 | 0.01 | |||||
| Dagze | 11/2003 | 4552.4 | 06/2006 | 4551.6 | 11/2010 | 4553.2 | 11/2015 | 4552.7 | 03/2021 | 4552.5 | 0.03 | |
| Dogai Coring | 02/2004 | 4819.2 | 02/2006 | 4820.3 | 11/2010 | 4820.8 | 11/2015 | 4821.3 | 03/2021 | 4822.8 | 0.19 | |
| Dogen | 12/2010 | 4554.2 | 12/2015 | 4554.1 | 12/2020 | 4553.6 | −0.07 | |||||
| Dorso Cave Co | 03/2003 | 4933.8 | 03/2006 | 4935.1 | 11/2010 | 4936.7 | 11/2015 | 4938.9 | 03/2021 | 4941.4 | 0.42 | |
| Duogecuoren | 07/2010 | 4793.2 | 11/2015 | 4795.2 | 03/2021 | 4797.6 | 0.41 | |||||
| Gozha | 5080 | 11/2015 | 5079.7 | 12/2020 | 5080.1 | 0.03 | ||||||
| Hoh Sai | 11/2003 | 4479.2 | 10/2007 | 4481.9 | 11/2010 | 4480 | 11/2015 | 4485.5 | 02/2021 | 4485.3 | 0.37 | |
| Hoh Xil | 10/2004 | 4888.7 | 05/2006 | 4889.4 | 12/2010 | 4890.4 | 10/2015 | 4892.1 | 03/2021 | 4895.9 | 0.41 | |
| Hsu-ju | 07/2010 | 4716.1 | 05/2015 | 4716.4 | 11/2020 | 4717.9 | 0.17 | |||||
| Rinqin Xubco | 02/2004 | 4761 | 10/2007 | 4761.7 | 01/2011 | 4761.9 | 04/2015 | 4762.6 | 12/2020 | 4764.1 | 0.17 | |
| Jianshui hu | 05/2004 | 4905.6 | 10/2007 | 4906.8 | 07/2010 | 4906.5 | 06/2015 | 4904.8 | 04/2021 | 4906.9 | 0.02 | |
| Ko-jen | 02/2004 | 4648 | 10/2007 | 4649 | 09/2009 | 4648.9 | 11/2015 | 4648.9 | 03/2021 | 4649.2 | 0.06 | |
| Lixi’Oidain | 11/2003 | 4872.3 | 10/2007 | 4873.3 | 07/2010 | 4874 | 05/2015 | 4876.1 | 03/2021 | 4879.8 | 0.7 | |
| Lumajangdong | 11/2003 | 4814.4 | 03/2006 | 4816.1 | 09/2011 | 4815.7 | 09/2015 | 4816.8 | 01/2021 | 4818.1 | 0.19 | |
| Malgai tea card | 09/2003 | 4798.4 | 03/2006 | 4803.1 | 11/2010 | 4799.4 | 05/2015 | 4801.2 | 01/2021 | 4804.1 | 0.22 | |
| Memar | 03/2004 | 4925.3 | 10/2006 | 4925.8 | 11/2010 | 4926.1 | 05/2015 | 4928.5 | 02/2021 | 4931.6 | 0.34 | |
| Mu-ts’o-ping-ni | 12/2010 | 4687 | 12/2015 | 4686.5 | 12/2020 | 4686.7 | −0.02 | |||||
| Namru | 11/2003 | 4568.4 | 11/2005 | 4571.6 | 11/2010 | 4571.4 | 11/2015 | 4572.7 | 02/2021 | 4572.8 | 0.23 | |
| Na-Mu | 03/2003 | 4723.2 | 03/2006 | 4724.9 | 11/2010 | 4726.2 | 11/2015 | 4726 | 03/2021 | 4726.1 | 0.16 | |
| Ngoin | 03/04 | 4564.5 | 03/2006 | 4563.2 | 11/2010 | 4565 | 11/2015 | 4564.4 | 03/2021 | 4565 | 0.05 | |
| P’a-lung | 03/2011 | 5101.1 | 03/2015 | 5101.8 | 03/2021 | 5102.6 | 0.15 | |||||
| Pa-Mu-Ts’o | 12/2010 | 4567.3 | 05/2015 | 4567.9 | 12/2020 | 4567.7 | 0.04 | |||||
| P’eng-Ts’o | 11/2010 | 4538.5 | 05/2015 | 4538.3 | 02/2021 | 4536.7 | −0.1 | |||||
| Qixiangcuo | 11/2003 | 4615.1 | 03/2006 | 4617.5 | 03/2011 | 4619.5 | 07/2015 | 4620.5 | 02/2021 | 4620.7 | 0.33 | |
| Rola Tso | 07/2010 | 4818.3 | 11/2015 | 4820.1 | 03/2021 | 4822.5 | 0.25 | |||||
| Salt Lake | 03/2004 | 4462.7 | 03/2006 | 4465.3 | 03/2011 | 4450.7 | 11/2015 | 4458.5 | 02/2021 | 4466.9 | 0.04 | |
| Se-lin | 03/2003 | 4540 | 03/2006 | 4544.8 | 11/2010 | 4546.6 | 11/2015 | 4547.7 | 03/2021 | 4549.2 | 0.51 | |
| T’a-jo | 03/2004 | 4567.4 | 11/2005 | 4568.7 | 10/2010 | 4568.6 | 11/2015 | 4567.5 | 02/2021 | 4569.1 | 0.05 | |
| Tang-je yung-ts’o | 11/2003 | 4536.7 | 07/2006 | 4537.4 | 09/2010 | 4537.5 | 11/2015 | 4537.5 | 03/2021 | 4539.3 | 0.13 | |
| Ta-tse | 09/2003 | 4471.5 | 05/2006 | 4468 | 11/2010 | 4470.8 | 11/2015 | 4472.9 | 03/2021 | 4476 | 0.32 | |
| Tupo | 11/2003 | 4924.5 | 06/2006 | 4925.9 | 07/2010 | 4926.2 | 11/2015 | 4927 | 03/2021 | 4927 | 0.24 | |
| Ulan Ula | 11/2003 | 4857 | 03/2006 | 4859.7 | 07/2010 | 4859.3 | 05/2015 | 4861 | 02/2021 | 4862.7 | 0.47 | |
| Vidration Spring | 03/2003 | 4796.5 | 03/2006 | 4798.1 | 09/2010 | 4796.1 | 10/2015 | 4797.2 | 03/2021 | 4799.1 | 0.17 | |
| Xijir Ulan | 11/2003 | 4772.9 | 03/2006 | 4774.4 | 11/2010 | 4776.2 | 11/2015 | 4776.4 | 03/2021 | 4779.5 | 0.58 | |
| Yaggain Canco | 02/2004 | 4871.7 | 03/2006 | 4872.9 | 09/2010 | 4873.4 | 07/2015 | 4875.1 | 09/2020 | 4875.3 | 0.37 | |
| Yang hu | 11/2003 | 4787.6 | 03/2006 | 4789.7 | 10/2010 | 4789.2 | 11/2015 | 4791.7 | 02/2021 | 4796.4 | 0.78 | |
| Yibug caka | 02/2011 | 4556.7 | 11/2015 | 4556.8 | 12/2020 | 4558 | 0.12 | |||||
| Zonag | 12/2010 | 4756.2 | 10/2015 | 4743.6 | 03/2021 | 4742.4 | −1.4 | |||||
| Salween | Na | 11/2003 | 4586.8 | 03/2006 | 4585.1 | 12/2010 | 4585.1 | 10/2015 | 4586 | 01/2021 | 4586.8 | 0.04 |
| Xinjiang | Ai-pi | 10/2010 | 194.3 | 11/2015 | 194 | 03/2021 | 194.6 | 0.03 | ||||
| Bosten | 11/2003 | 1047.9 | 03/2006 | 1046.4 | 09/2009 | 1045.5 | 11/2015 | 1046.6 | 02/2021 | 1048.4 | 0.03 | |
| Sai li-mu | 02/2004 | 2074.1 | 10/2006 | 2074.6 | 10/2010 | 2074 | 11/2015 | 2074.2 | 02/2021 | 2074.7 | 0.03 | |
| Ulungar | 03/2003 | 483.4 | 05/2006 | 483.7 | 10/2010 | 484.4 | 07/2015 | 482 | 08/2020 | 483.6 | −0.05 | |
| Yangtze | Dorge | 12/2010 | 4686.8 | 11/2015 | 4686.9 | 03/2021 | 4686.5 | −0.03 | ||||
| Yellow | Gyaring | 02/2004 | 4292.1 | 10/2005 | 4293.2 | 10/2010 | 4293.7 | 11/2015 | 4293.4 | 03/2021 | 4292.8 | 0.04 |
| Ngoring | 11/2010 | 4273.6 | 11/2015 | 4273.4 | 03/2021 | 4272.8 | −0.05 | |||||
| Qinghai | 02/2004 | 3193.5 | 05/2006 | 3193.9 | 11/2010 | 3194.7 | 10/2015 | 3195.2 | 03/2021 | 3197.6 | 0.23 |
Publisher’s Note: MDPI stays neutral with regard to jurisdictional claims in published maps and institutional affiliations. |
© 2022 by the authors. Licensee MDPI, Basel, Switzerland. This article is an open access article distributed under the terms and conditions of the Creative Commons Attribution (CC BY) license (https://creativecommons.org/licenses/by/4.0/).
Share and Cite
Chen, J.; Duan, Z. Monitoring Spatial-Temporal Variations of Lake Level in Western China Using ICESat-1 and CryoSat-2 Satellite Altimetry. Remote Sens. 2022, 14, 5709. https://doi.org/10.3390/rs14225709
Chen J, Duan Z. Monitoring Spatial-Temporal Variations of Lake Level in Western China Using ICESat-1 and CryoSat-2 Satellite Altimetry. Remote Sensing. 2022; 14(22):5709. https://doi.org/10.3390/rs14225709
Chicago/Turabian StyleChen, Jun, and Zheng Duan. 2022. "Monitoring Spatial-Temporal Variations of Lake Level in Western China Using ICESat-1 and CryoSat-2 Satellite Altimetry" Remote Sensing 14, no. 22: 5709. https://doi.org/10.3390/rs14225709
APA StyleChen, J., & Duan, Z. (2022). Monitoring Spatial-Temporal Variations of Lake Level in Western China Using ICESat-1 and CryoSat-2 Satellite Altimetry. Remote Sensing, 14(22), 5709. https://doi.org/10.3390/rs14225709