Abstract
Several studies have shown the relevance of satellite systems in detecting, monitoring, and characterizing fire events as support to fire management activities. On the other hand, up to now, only a few satellite-based platforms provide immediately and easily usable information about events in progress, in terms of both hotspots, which identify and localize active fires, and the danger conditions of the affected area. However, this kind of information is usually provided through separated layers, without any synthetic indicator which, indeed, could be helpful, if timely provided, for planning the priority of the intervention of firefighting resources in case of concurrent fires. In this study, we try to fill these gaps by presenting an Integrated Satellite System (ISS) for fire detection and prioritization, mainly based on the Robust Satellite Techniques (RST), and the Fire Danger Dynamic Index (FDDI), an original re-structuration of the Índice Combinado de Risco de Incêndio Florestal (ICRIF), for the first time presented here. The system, using Moderate Resolution Imaging Spectroradiometer (MODIS), Advanced Very High Resolution Radiometer (AVHRR), and Spinning Enhanced Visible and InfraRed Imager (SEVIRI) data, provides near real-time integrated information about both the fire presence and danger over the affected area. These satellite-based products are generated in common formats, ready to be ingested in Geographic Information System (GIS) technologies. Results shown and discussed here, on the occasion of concurrent winter and summer fires in Italy, in agreement with information from independent sources, demonstrate that the ISS system, operating at a regional/national scale, may provide an important contribution to fire prioritization. This may result in the mitigation of fire impact in populated areas, infrastructures, and the environment.
1. Introduction
Wildfires are one of the most important causes of ecosystem degradation because of their strong impact on flora, fauna, and soils [1,2,3]. On a local scale, fires influence the soil structure, plant nutrition, composition, and competition among species. Burned areas are particularly sensitive to leaching nutrients and soil erosion, because of ensuing changes affecting hydrological processes [2]. Nowadays, wildfires represent a huge problem on a global scale. A large increase in the fire rate has been recorded globally, with social impacts including the loss of human life, and economic effects, such as damage to houses and infrastructures as well as impacts on the climate. Examples are the devastating fires occurring in 2019–2020 in Siberia [4,5,6], Australia [6,7,8,9,10], and South America [6,11,12,13].
The huge economic and environmental damage directly or indirectly related to fires has constantly pushed the international space agencies (i.e., EUMETSAT, NASA) to better exploit satellite observations to detect fires, especially through sensors such as SEVIRI (Spinning Enhanced Visible and InfraRed Imager), AVHRR (Advanced Very High Resolution Radiometer), MODIS (Moderate Resolution Imaging Spectroradiometer), and VIIRS (Visible Infrared Imaging Radiometer Suite). The performance of those systems relies on the accuracy of algorithms used to detect thermal anomalies with a low false-positive rate. The pros and cons of the algorithms and systems used, including their potential in promptly alerting for fires, have been analyzed in recent studies (e.g., [14,15]).
In addition, satellite remote sensing may provide information about a number of variables suited to evaluate fire danger ratings [16,17,18]. Danger estimations can be generally approached at two temporal scales: short-term and long-term (e.g., [19,20,21]). Long-term fire danger estimations provide information useful for management activities, and to plan prevention strategies. Short-term estimations are suited for operational activities during the fire emergency phase, for the management of fire-fighting resources, early detection, and timely attack on the flame front (for a state-of-art review see [19,20,21]). Those estimations require dynamic information updated daily (or even hourly) on the moisture content of the fuel, and additional meteorological parameters, such as temperature, relative humidity, wind, and precipitation. Moreover, fire danger is typically evaluated using static indices based on topography, fuel type, and load, which may be also derived from remote sensing data [21,22,23].
However, up to now, only a few fire-monitoring systems provide additional information about fires and relative flame conditions as separated layers (e.g., meteorological fire danger maps, weather forecasts, fire perimeters, and susceptibility maps). Among these, it is worth mentioning some systems such as the European Forest Fire Information System (EFFIS, [24]), the Instituto Nacional de Pesquisas Espaciais (INPE, Brazilian Institute for Space Research [25]), the Advanced Fire Information System (AFIS, [26,27]), the FSI Fire Alerts System (FAST, [28,29]). The above-mentioned systems are generally modular web-based platforms at the global (AFIS), continental (INPE over South America, EFFIS over Europe), or sub-continental (FAST on India) scale. They allow end users to fully monitor forest fire activity by means of a series of separate modules, which aim at managing different aspects of fire contrast actions. The active fire detection is the basic module of these systems and may include hotspots only from polar satellite data (e.g., in EFFIS and FAST) or both polar and geostationary satellite data (such as in INPE and AFIS). The availability of other modules (e.g., fire danger forecast, fire spread modeling, rapid damage assessment) may vary or differ in terms of spatial resolution according to the specific system. In all cases, end users may have considerable useful information in separated layers which may or may not be displayed, but there is no synthetic indicator for priority action against simultaneous fires. Apart from a few pioneering studies performing fire prioritization, which required assessment in the field (e.g., [30]), there are no systems combining/integrating satellite hotspot products and fire danger information to define priority levels, in operational fire contrast action. On the other hand, the above-mentioned systems are not generally useful for supporting firefighter activity which needs fire products in real-time mode, i.e., frequently updated and delivered in a timely manner. This happens, for example, when hotspots are only provided from low-frequency overpass satellite sensors (e.g., polar orbiting) and/or fire danger products are only furnished daily. This issue is particularly significant in highly populated areas like the Italian territory.
In this study, we fill these gaps by presenting a satellite-based system called the Integrated Satellite System (ISS), which combines fire detections in near real-time from satellite, through the RST-FIRES (Robust Satellite Techniques for FIRES detection and monitoring) algorithm [15], to an innovative index used to flag the most vulnerable areas, called the Fire Dynamic Danger Index (FDDI), developed for the prioritization of fire events in near real-time. In particular, FDDI is structured similarly to the Forest Fire Risk Combined Index (Índice Combinado de Risco de Incêndio Florestal–ICRIF, [31]), based on the Fire Weather Index (FWI) [32], which is updated every 24 h. FDDI, instead, is based on the Fuel Moisture Index (FMI) [33] which, unlike FWI, can be updated hourly. Moreover, two synthetic Priority Indicators (PINGEO and PINLEO) are proposed to immediately estimate the priority order of intervention. This system has been designed for rapid identification, localization, and danger characterization of active fires over the Italian territory, to support firefighting activities and fire management.
2. Study Area
The ISS system has been developed to perform over the entire Italian territory. Italy has two fire regimes: the winter regime, affecting the northern part of the country; and the summer regime which typically affects the central and southern regions. Drought and vegetative rest in regions characterized by the Mediterranean climate are the first factors affecting summer fires, while dry winds (i.e., Föen), combined with a general dryness of the vegetation are responsible for winter fires in alpine or alpine-like climate regions (e.g., [34]). Italian local regional authorities are responsible for extinguishing forest fires with the support of ground teams (Regional Forest Corps, National Fire Corps, volunteers, etc.), exploiting aerial regional resources (light and medium helicopters). Moreover, the national forest firefighting air fleet (Canadair aircraft and heavy helicopters) is operative through the Unified Air Operational Center (COAU), managed by the National Fire Corps [35]. In this work, we test the proposed system in the case of summer as well as winter fires, which always represent a challenge for satellite fire detection and monitoring due, for example, to critical weather conditions (i.e., frequent and dense cloud cover) [36].
3. Data and Methods
The final goal of the ISS system is to establish a suitable priority order of intervention in the case of concurrent fire events at large scale (e.g., for the Italian territory). To this end, different data, products, and information are integrated together as shown in Figure 1 All these resources as well as the methods used for their analysis and integration will be described in the following sub-sections. In more detail, satellite data and products (Section 3.1.1) are automatically processed through the RST-FIRES (Section 3.2.1) algorithm to identify active fires. Weather forecasts (Section 3.1.2) are used to produce two dynamic indices, the Fire Danger Dynamic Index (FDDI, Section 3.2.2), depending on the health status of the vegetation, and the Wind Intensity (WI, Section 3.2.4), which is calculated for the same area. Geomorphology data (Section 3.1.3) are used to generate the Morphological Danger Index (MDI) (Section 3.2.3). Both WI and MDI are produced for polar-orbiting satellite data only (i.e., AVHRR and MODIS) offering data at higher spatial resolution (about 1 km) than those provided by geostationary platforms (i.e., SEVIRI). Two synthetic indicators, PINGEO and PINLEO (Section 6), are then built from the above-mentioned indices. In the following section, we describe the system inputs and the methodologies used.
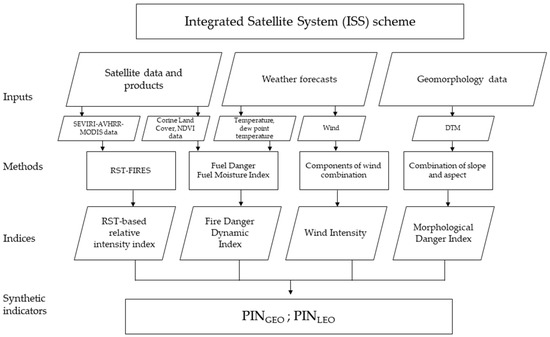
Figure 1.
Integrated Satellite System scheme.
3.1. Data
3.1.1. Satellite Data and Products
The ISS system has been developed for a prompt fire identification, exploiting high temporal resolution data, which are able to detect fires at their early stage and continuously monitor their evolution. ISS analyzes satellite data acquired in the Middle, Thermal InfraRed, and Visible bands (MIR, TIR, VIS) for this purpose. The system elaborates all 96 daily observations from SEVIRI, aboard Meteosat Second Generation (MSG) geostationary satellites. SEVIRI provides data with a very high temporal sampling (15 min), but also with a rough spatial resolution (around 13–15 km2 at the considered latitudes). The ISS system also uses satellite data at a higher spatial resolution (1 km2), but with a lower frequency of observation (from 3 to 6 h) from AVHRR and MODIS, respectively, onboard the National Oceanic and Atmospheric Administration (NOAA)/Meteorological Operational Satellites (MetOP) and the Earth Observing System (EOS). ISS runs operationally using satellite data directly acquired at the multi-mission receiving stations (EUMETCast and L+X-band direct readout antenna) operational at the Institute of Methodologies for Environmental Analysis of National Research Council (IMAA-CNR) and the School of Engineering of University of Basilicata (SI-UNIBAS).
The system analyzes fire danger in terms of the health status of the vegetation. For this purpose, it implements the EUMETSAT NDVD product (NDVI Decadal, [37]) for SEVIRI, and the Copernicus 10-day NDVI product for MODIS and AVHRR data [38]. The NDVD is a decadal aggregated product based on the daily SEVIRI NDVI. Aggregation is made for days 1 to 10, 11 to 20, and 21 up to the last day of each month. This product, widely used to characterize vegetation density and vigor as well as to identify vegetation stress and drought, is distributed by EUMETSAT at the SEVIRI pixel spatial resolution, together with the raw data. For AVHRR and MODIS, ISS uses the Copernicus Global Land Service NDVI product. This product is based on the Maximum Value Composite (MVC) of NDVI, computed over a 10-day period, considering the SPOT/VEGETATION C3 and PROBA-V C1 satellite data, which are atmospherically corrected and cloud-free. The used product is distributed at the 1 km resolution within three days of the end of the aggregation period. Moreover, to characterize fire danger in terms of fuel danger (FD), level three of the CORINE (Coordination of Information on the Environment) Land Cover 2012 (CLC2012) map is used.
3.1.2. Weather Forecast
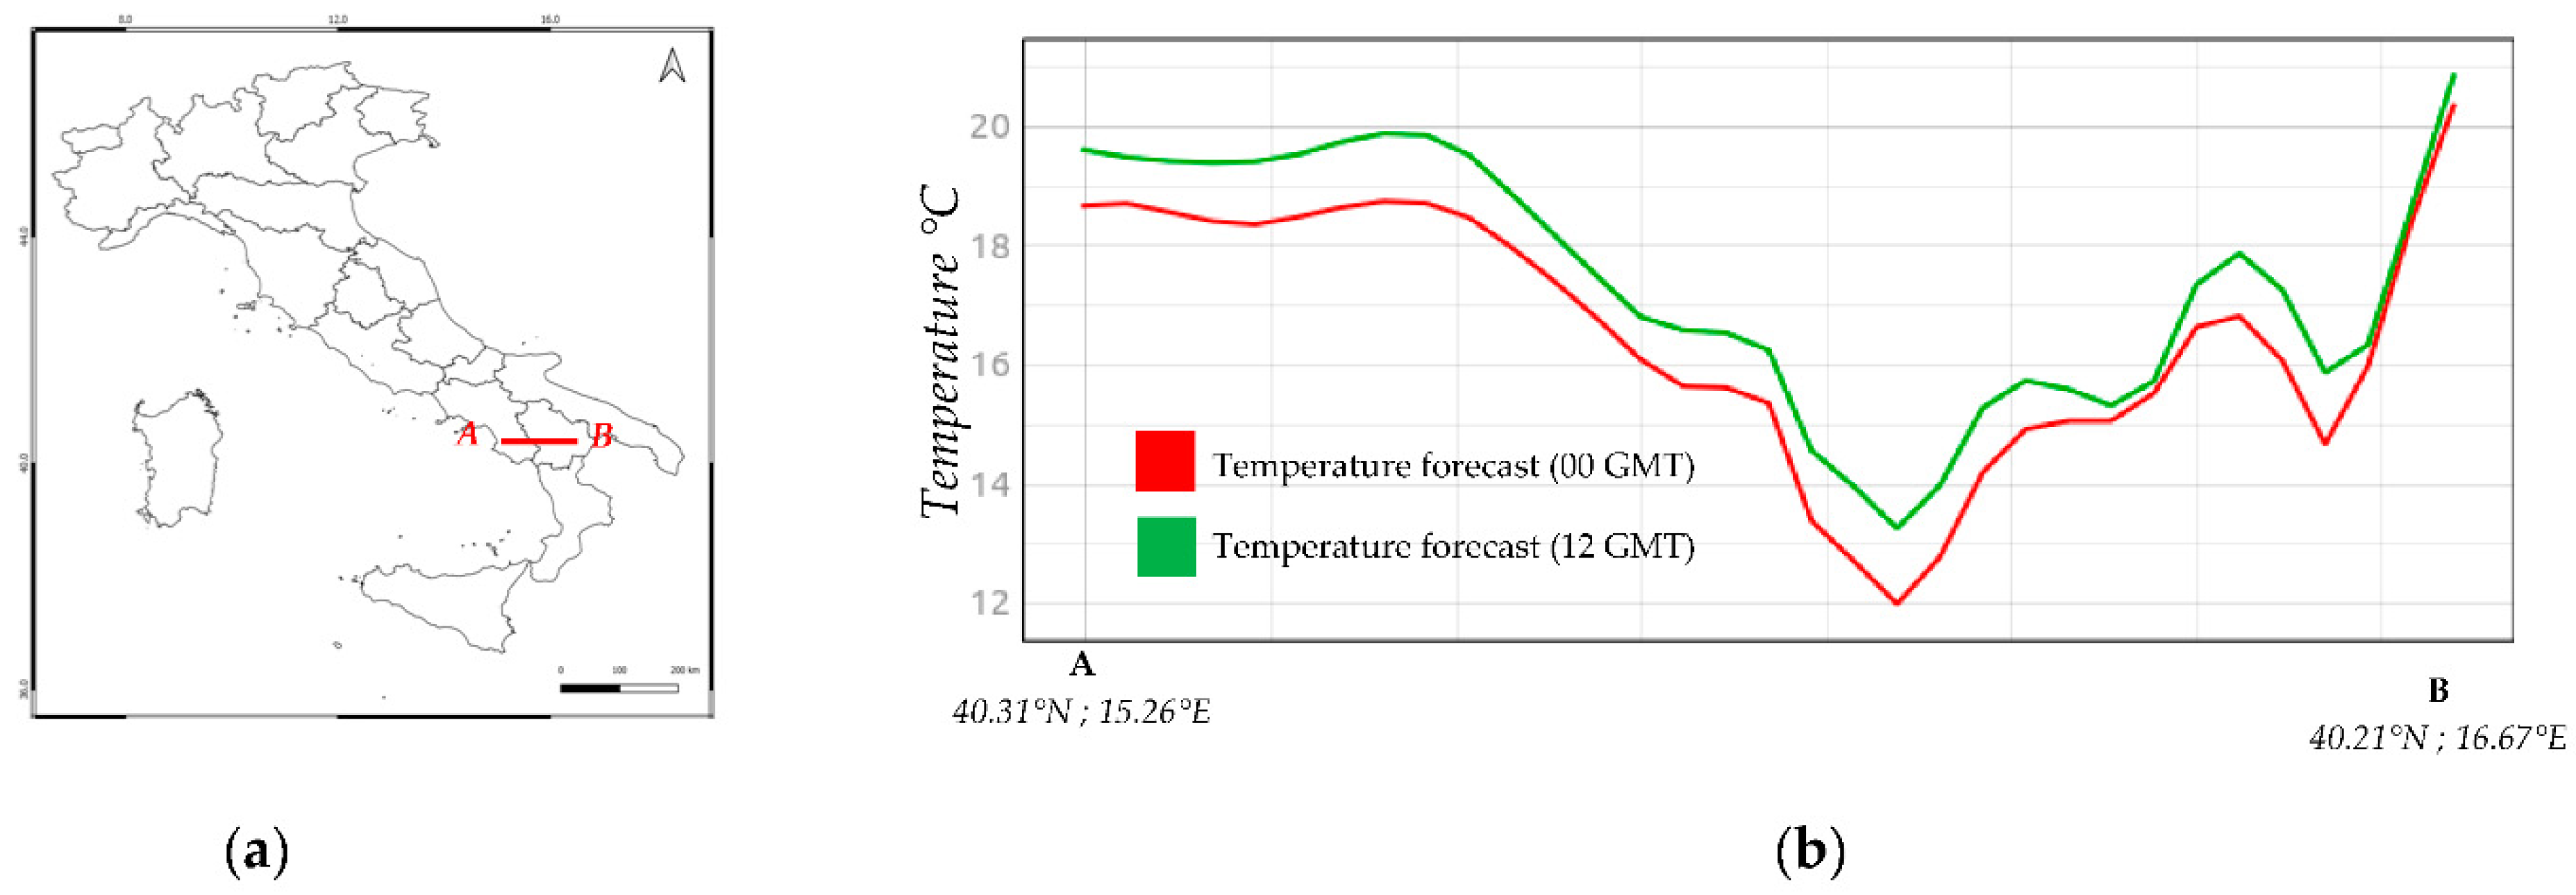
Air temperature, humidity, and wind are key parameters for fire predisposition conditions. They are considered using weather forecasts generated by the COSMO (Consortium for Small-scale Modeling) meteorological model [39]. We included the forecast from the LAMI application (Limited Area Model Italy) in the system. As part of the LAMI agreement, Cosmo 5M operational chain provides numerical forecasts on the Mediterranean area, with a grid of 5 km. The model processes twice a day, at 00 and 12 GMT, and makes forecasts for a time horizon of three days (72 h), although only 25 h are stored. The two sets of weather forecasts are always available for each hour of the day. ISS integrates only the 00 GMT set of forecasts (very similar to 12 GMT as reported in Figure 2), storing 12 GMT as a backup solution, for time computation saving. These products are distributed in GRIB (GRIdded Binary) format and contain 17 information layers (regarding pressure, geopotential, temperature, wind, albedo, precipitation, snow). To determine the FDDI, the ISS system automatically extracts both temperature (T2m) and dew point temperature (Td2m) generated at 2 m above ground, and the u and v components of the wind, provided at 10 m above the ground.
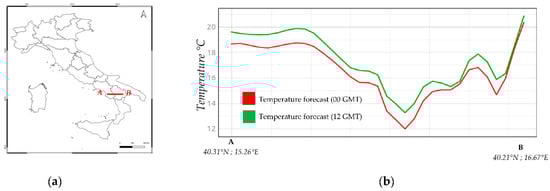
Figure 2.
(a) Transect AB of about 120 km. (b) Temperature trend observed along with the transect AB for 25 October 2018, 13:00 GMT forecast at 00 GMT (red line) and 12 GMT (green line). It is worth noting that the trend of both the curves is similar; the difference never exceeds about 1.5 °C.
3.1.3. Geomorphology Data
To consider the possible “fire accelerating factors” due to the morphology of the territory, ISS uses a Digital Terrain Model (DTM) with a resolution of 20 m. Although this layer (in terms of slope and aspect) has an immediate impact on fire dynamics, it was upscaled only at the spatial resolution of MODIS and AVHRR (1 km). Indeed, no upscaling procedure was performed for SEVIRI due to its low spatial resolution, and consequently, no MDI was generated.
3.2. Methods Implemented and Indices Developed
3.2.1. The RST-FIRES Methodology
The ISS system implements the RST-FIRES algorithm [15] to detect and monitor fires. This approach was successfully used to detect thermal anomalies related to both winter (e.g., [36,40]) and summer fires (e.g., [15,41,42,43,44]), in different operational contexts. RST-FIRES is a specific configuration of the RST multi-temporal approach [45,46,47], which requires: (i) characterization of the satellite signal under unperturbed conditions; and (ii) identification of anomalous signals through an automatic change detection scheme. In particular, RST considers “anomalous” a signal that significantly diverges from the “normal” condition (i.e., expected value), which is typical of the site and observation time. The normal unperturbed condition can be defined using multi-annual time series of satellite records. The ALICE (Absolutely Llocal Index of Change of the Environment, [45,46,47]) index detects perturbing events:
where V(x,y,t) is the signal observed at time t in a single spectral band or a band combination at the pixel (x,y); µV(x,y) is the expected value (temporal mean) of the signal, while σV(x,y) is the temporal standard deviation. Those terms are computed by analyzing homogenous cloud-free satellite records acquired at the same time of day and period of the year (same month). The frequency/intensity of fires in the used time-series may possibly contaminate μV(x,y) and σV(x,y) values; a kσ-clipping procedure such as that described in [15,45] is applied to exclude corresponding V(x,y,t) values from the reference field computation.
Therefore, the ALICE index quantifies the signal excess of V(x,y,t) in reference to the mean value µch(x,y), weighted by its natural variability σch(x,y). Since fires emit the maximum of thermal radiation in the MIR region (3–5 µm), the ALICEMIR index analyzing the brightness temperature (BT) measured in the MIR channel of used sensors (V(x,y,t) = BTMIR(x,y,t)) is computed by RST-FIRES to detect fires. A wide description of the RST-FIRES methodology, including the other indices that are used to timely detect fires at an early stage, can be found in previous studies (e.g., [15,36,40]).
3.2.2. The Fire Danger Dynamic Index
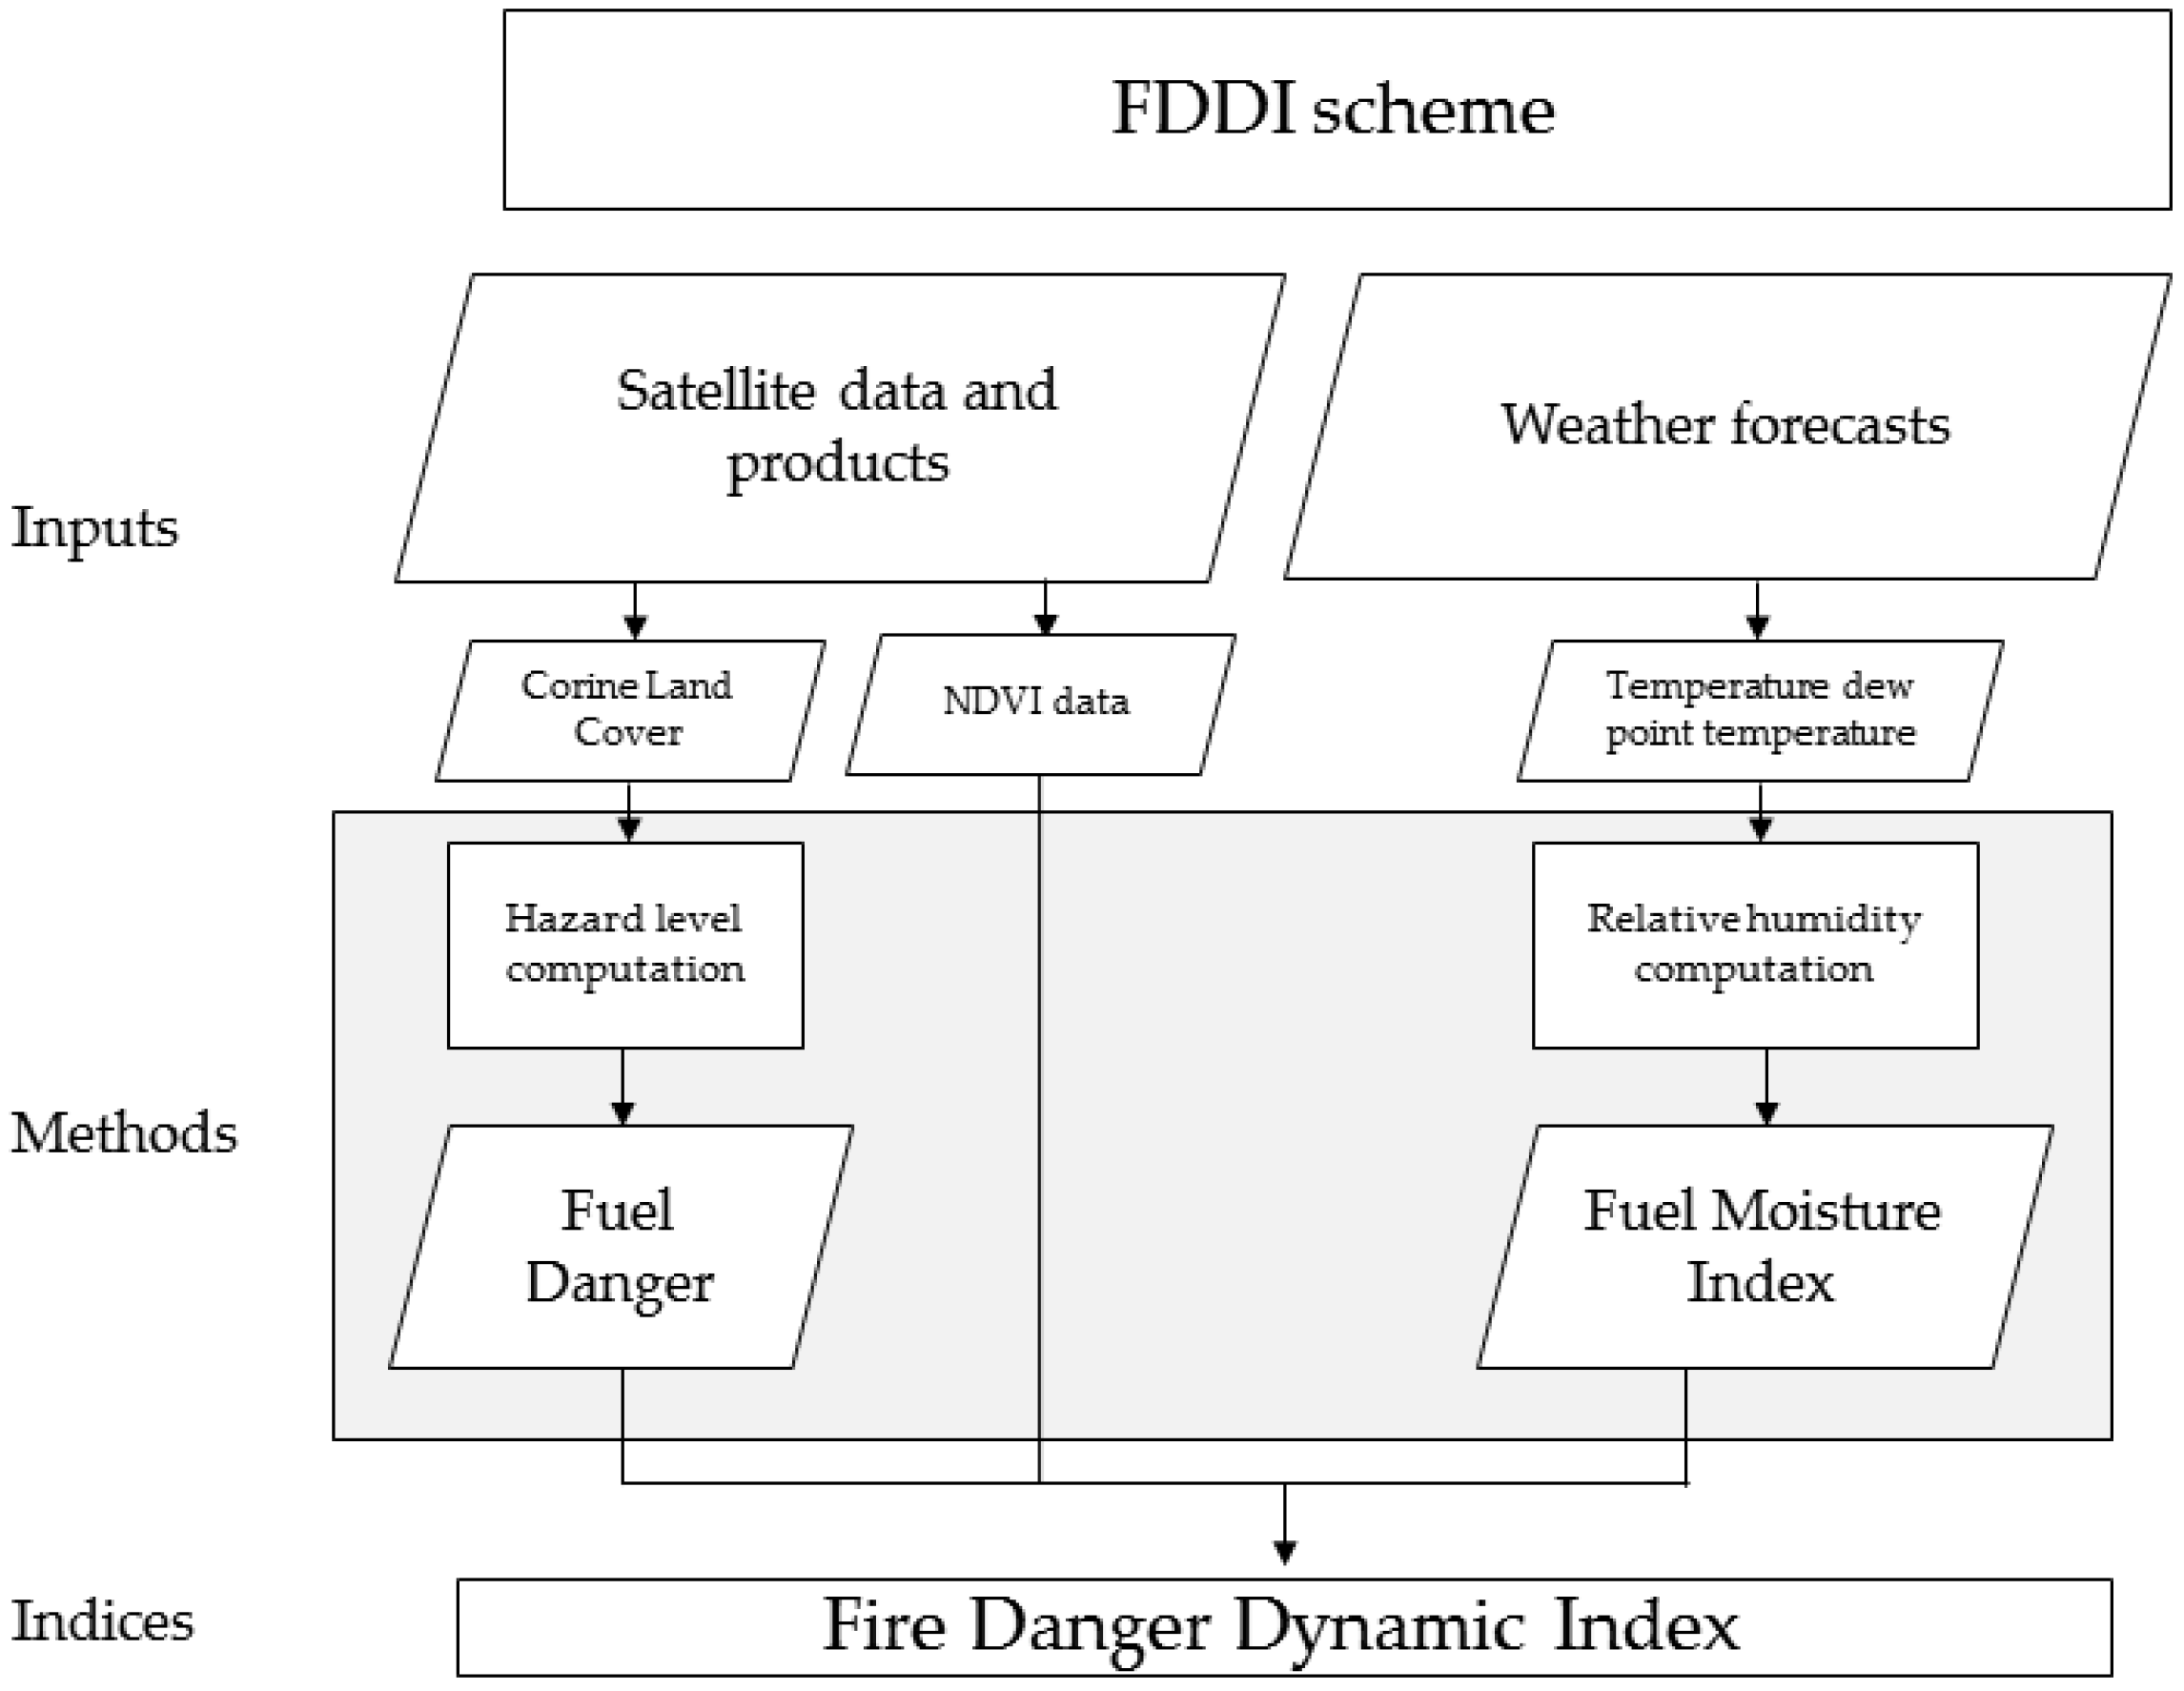
The Fire Danger Dynamic Index is an indicator based on a conceptual multiscale model, which combines satellite-derived indices. FDDI, whose performance is evaluated in Appendix A, is a dynamic fire hazard index, which analyzes the fuel characteristics and state of the vegetation. This index is updated hourly, to analyze changes in the weather parameters during the day. It is calculated for each pixel of satellite imagery and integrates both structural and meteorological indices:
- Fuel Moisture Index (FMI), derived from meteorological forecast data;
- NDVD index (decadal value of NDVI);
- Fuel Danger (FD).
Figure 3 shows a synthetic scheme.
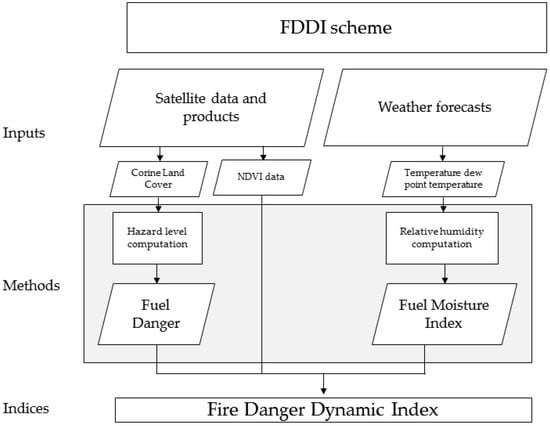
Figure 3.
Fire Danger Dynamic Index scheme.
The latter is derived from CLC2012 and resampled for each satellite sensor (AVHRR, MODIS, and SEVIRI). Its values are indicative of the hazard associated with each kind of land cover and can be updated based on the latest available land use maps. Each pixel is represented by a vector with 38 elements indicating the fraction area occupied by each CLC class (Ak). The fuel map was generated by associating a hazard level to each class (Dk, [31]), as reported in Table 1.

Table 1.
Level 3 of the CLC classes that are associated with the hazard level Dk.
The final structural index is a combination of the corresponding area-weighted hazard:
The Fuel Moisture Index is a dynamic dimensionless parameter that can be considered as a direct estimate of the moisture content of the necromass (dead vegetable organic substance). It is updated hourly, and calculated using a well-known index for assessing fire danger rating [33]:
where T2m and RH are the temperature (in Celsius) at 2 m above ground level and the relative humidity (in %), respectively. RH is calculated from actual vapor pressure (E) and saturation vapor pressure (Es), assuming standard atmospheric conditions:
where:
FMI = 10 − 0.25 × (T2m − RH)
RH = (E/Es) × 100
Es = 6.11 × 10 (7.5 × T2m/(237.7 + T2m))
E = 6.11 × 10 (7.5 × Td2m/(237.7 + Td2m))
Temperature (T2m) and dew point temperature (Td2m) at 2 m above ground level are based on the weather forecast. The FDDI is then defined by the following equation:
Figure 4 shows an example of an FDDI map generated for Italy for a particular day and hour.
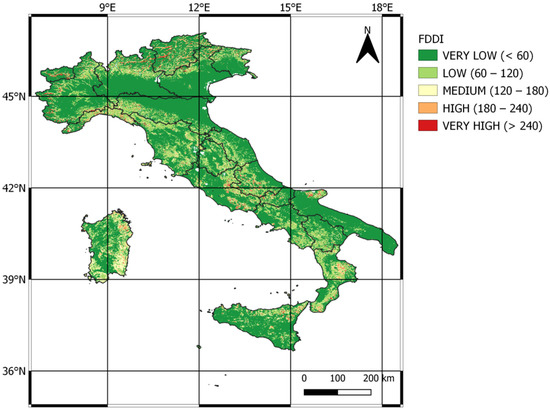
Figure 4.
Example of an FDDI map generated over Italy using MODIS data, based on weather forecast of 02/07/2018 (00 GMT). Higher index values, lighter tones, indicate areas at greater danger if affected by fires.
3.2.3. The Morphological Danger Index
The Morphological Danger Index (MDI) is derived by combining two relevant topographic elements (slope and aspect) used for estimating the fire hazard:
where DV is Danger Value. We have used a Multi-Criterial Decision Analysis (MCDA) to attribute appropriate weights.
MDI = (SlopeDV × 0.7) + (AspectDV × 0.3)
Table 2 shows the classes relating to the identified topographic static factors and the attribution of relative weights.
Table 2.
Topographical factors and corresponding weights.
These values were defined, based on the following theoretical considerations:
- the slope determines an increase in the speed of propagation, and thus the danger correlated to the event. The inclination of the slopes affects the pre-heating capacity of the fuels by accelerating the combustion process and so the rate of spread of the fire;
- the slope affects the formation of an angle between the surface and the sun’s rays: the closer this is to 90°, the greater the calorific value of the sun’s rays on the ground. Experimental observations [48] estimate that under the same wind conditions, inclinations of up to about 16° increase fire speed by two times, and at inclinations of up to about 30°, by four times;
- the aspect influences the duration of exposure to the solar irradiation, the type of wind, and the temperature and humidity. SW exposures, for instance, suffer from more irradiation than others, heating up more, and thus fuels suffer from greater relative humidity losses. Consequently, the types of vegetation that are present on the slopes most exposed will be more combustible than others.
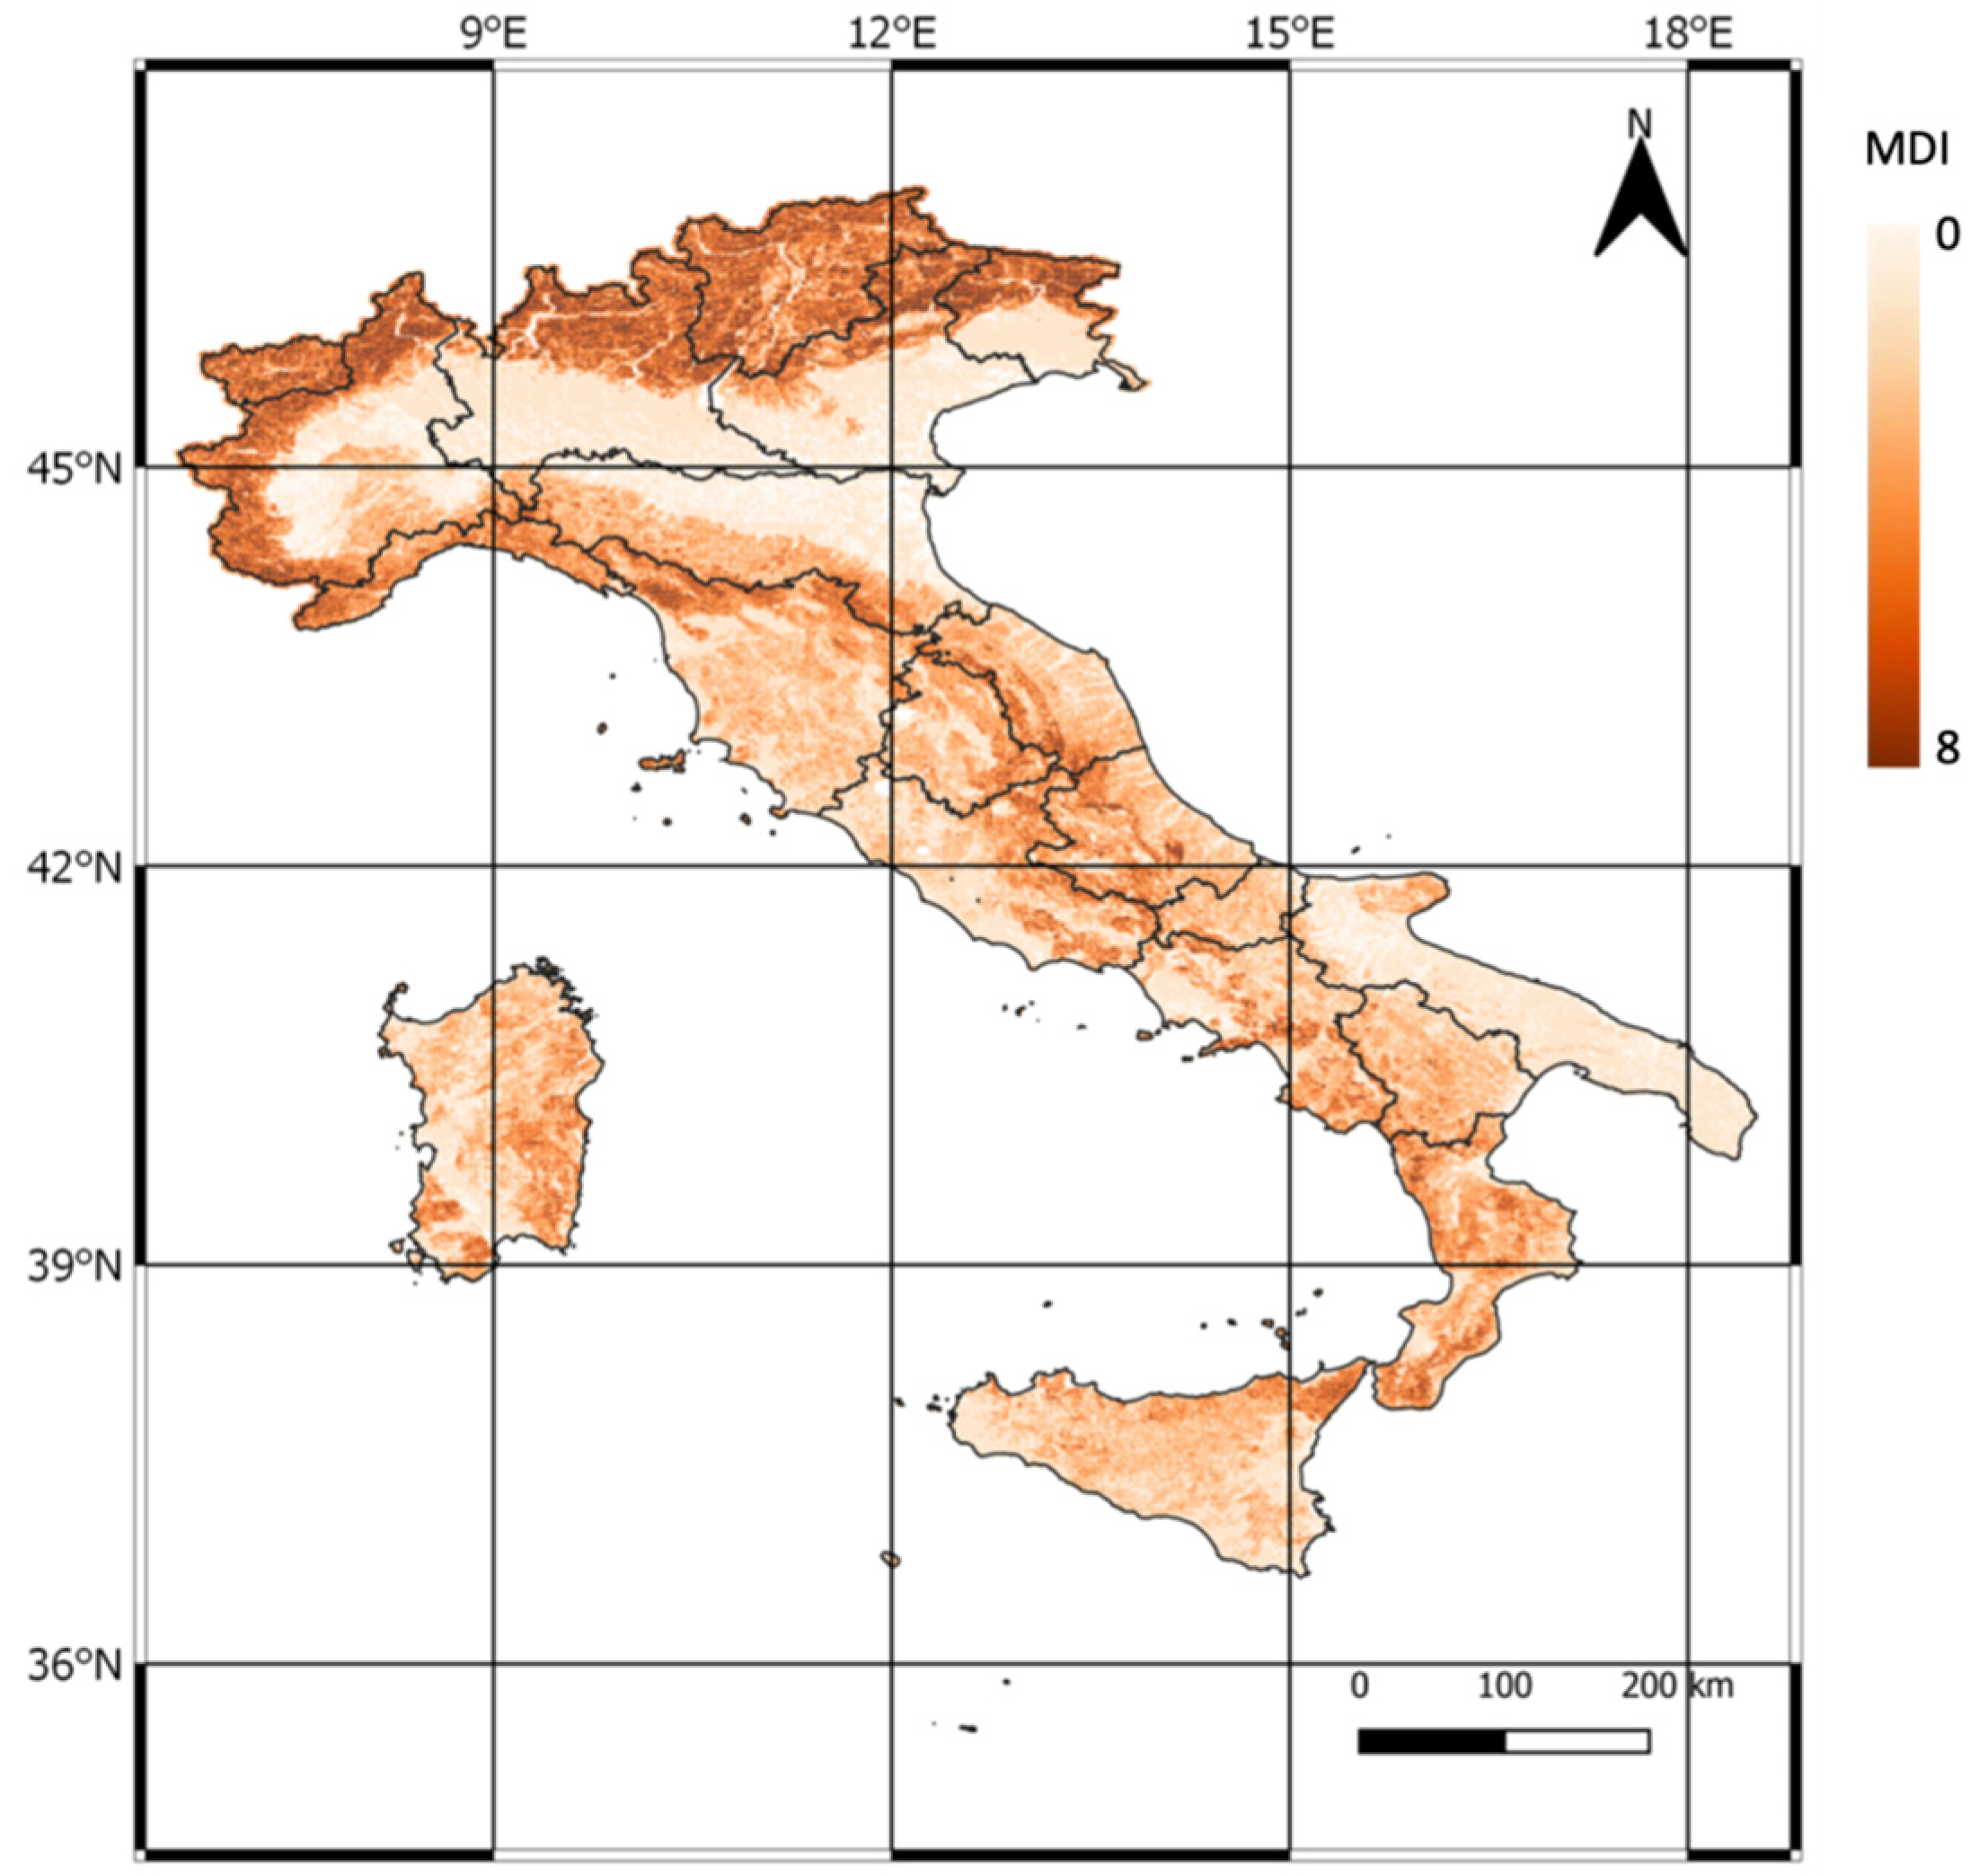
Figure 5 shows the MDI resampled for MODIS data. The figure shows that the index assumes values from 1 to 8, with the highest values corresponding to mountainous areas.

Figure 5.
Example of Morphological Danger Index (MDI) implemented for MODIS data, over the area of interest.
3.2.4. The Wind Intensity
Starting from the values of u and v components of wind contained in the COSMO-5M weather forecast, we generated the values of the indicator of wind intensity (WI) according to the following relationship:
WI = √ (u2 + v2)
Figure 6 shows an example of elaboration over Italy (10 December 2019 at 13:00 GMT).
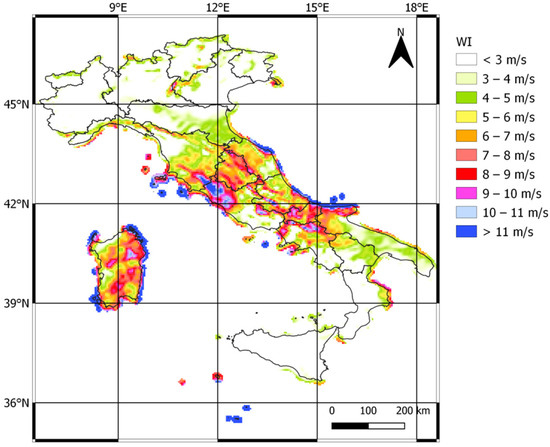
Figure 6.
Wind intensity calculated starting from Cosmo-5M forecast of 10 December 2019 at 13:00 GMT.
4. Synthetic Indicators
Within operational conflicts, and mainly in the presence of concurrent events, some parameters, such as the number of thermal anomalies (i.e., RST-FIRES detections) and the relative intensity index (in terms of ALICEMIR) should be considered and monitored in real-time to better evaluate the space-time dynamics of each fire, and timely action against the most dangerous. Furthermore, in addition to the above-mentioned factors, the danger evaluation (FDDI) of an area gradually affected by fires should be considered to assess the actual situation and better prioritize firefighter actions. In addition, the time persistence of thermal anomalies should be considered when high temporal resolution data are used.
Finally, a synthetic indicator, Priority Index (PIN), which combines the above-mentioned significant parameters and gives an immediate danger overview as well as a measure for comparing simultaneous fires, can be defined starting from the different needs of the end-users and data availability. Thus, the higher the PIN value, the higher the intervention priority should be.
A potential PIN for geostationary satellites (PINGEO) is presented for SEVIRI data in equation (10). The index is calculated for each time slot, considering all anomalous pixels detected by RST-FIRES related to the event within an area of interest (AI).
where:
- t0 is the first time slot when thermal anomalies are detected;
- tcurr is the current time slot;
- AI is the area affected by the fire;
- kRST is a weighting factor of the ALICEMIR index;
- ALICEMIR(x,y,t) is the value of the ALICEMIR index, at time t, relating to each SEVIRI anomalous pixel of coordinates (x,y);
- kFDDI is a weighting factor of the FDDI index;
- FDDI(x,y,t) is the value of the FDDI index, at time t, relating to each SEVIRI anomalous pixel of coordinates (x,y);
- NumPT (t) is the number of time slots in which SEVIRI thermal anomalies related to the event are detected from the beginning (t0) up to time t, on the area AI;
- kPT is a weighting factor related to the temporal persistence of SEVIRI thermal anomalies on the area under observation;
- NumAnom(t) is the number of SEVIRI thermal anomalies related to the event from the beginning (t0) to t, over the area AI;
- kES is a weighting factor that accounts for the spatial extension of the thermal anomalies in the area affected by the fire.
In Equation (11), a similar index (PINLEO) is proposed for polar satellite data (MODIS and AVHRR), giving up temporal persistence for their worse temporal resolution than SEVIRI, but exploiting useful information about wind (WI) and geomorphology (MDI), thanks to their greater spatial resolution.
where t0, tcurr, AI, kRST, ALICEMIR(x,y,t), kFDD, FDDI(x,y,t), NumPT (t), kPT, NumAnom(t), kES have the same meaning as in relation (10), and
- kMDI is a weighting factor of the MDI index;
- MDI (x,y) is the value of the MDI index for each anomalous AVHRR or MODIS pixel (x,y);
- kWI is a weighting factor of the WI index;
- WI (x,y,t) is the value of the WI index for each anomalous AVHRR or MODIS pixel (x,y), at time t.
PINGEO, ALICEMIR, FDDI, and NumPT are weighted respectively by the coefficients kRST, kFDDI, kPT (equal to 0.3) to consider them at the same importance level; NumAnom is weighted by the constant kES (equal to 0.1) to take account of possible errors due to duplication effects, rather than the actual size of a fire. In PINLEO, the parameter related to the temporal persistence of thermal anomalies is replaced by MDI and WI. These two indicators could be utilized to characterize an area affected by an event when used with AVHRR and MODIS data (the weight constants kMDI and kWI are both set equal to 0.15).
5. Results
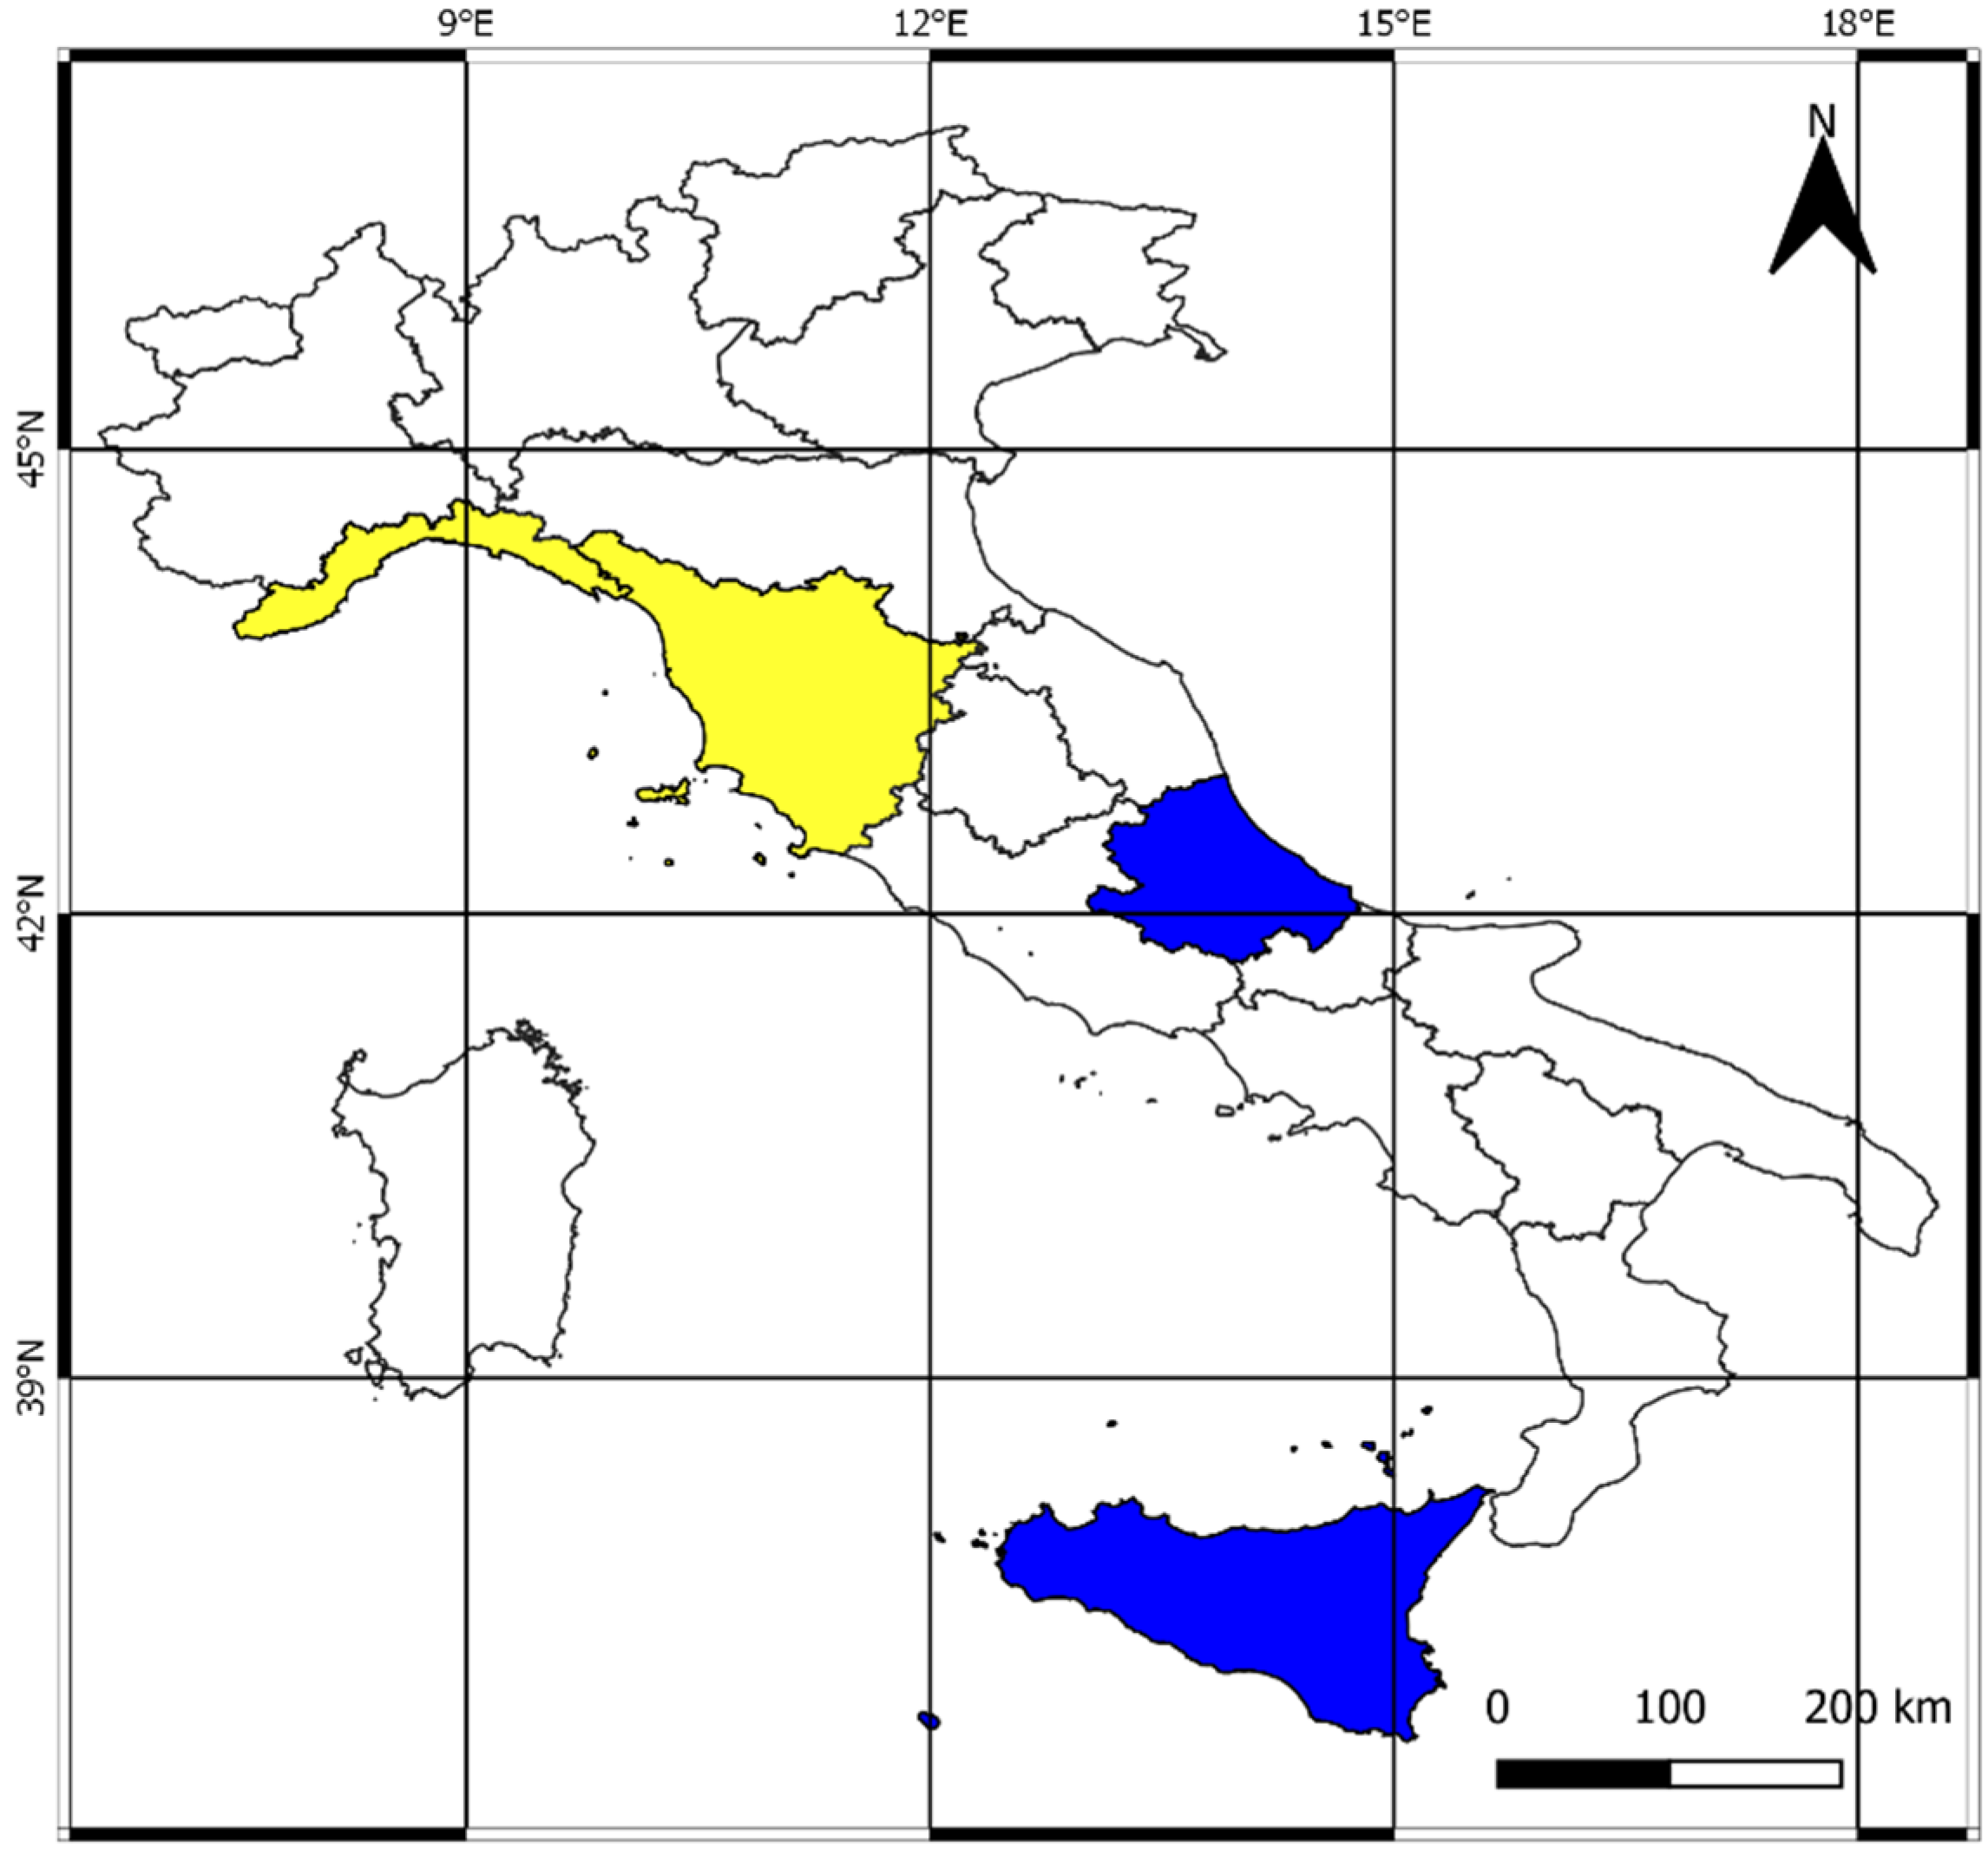
In this section, we show some preliminary results of the ISS system experimentation. To perform a first assessment of the system performance, we analyzed some concurrent fires occurring during the summer and winter seasons. In the first case, the fires analyzed occurred in central and southern Italy, in the Abruzzo and Sicily regions (shown in blue in Figure 7) at the end of July 2020. In 2020, the Sicily region registered the largest total burned area at the national level (more than 23,000 ha, equal to 40% of the total). The Abruzzo region registered a burned area roughly equal to 27.5 ha, the second largest at the national level after Sicily (40.8 ha) [49].
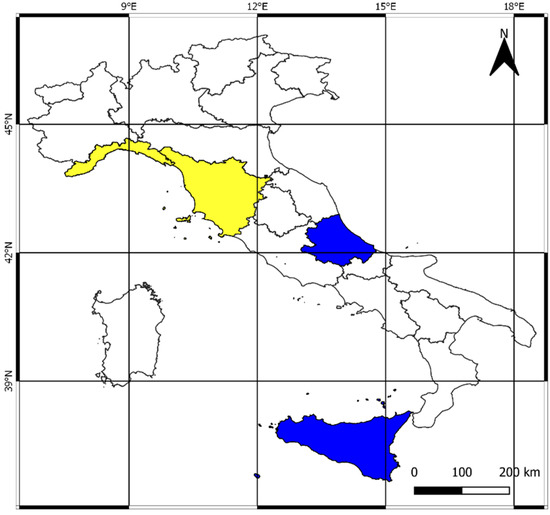
Figure 7.
Liguria and Tuscany regions, in yellow, affected by the winter fires analyzed in this paper; Abruzzo and Sicily, in blue, affected by the concurrent summer fires analyzed.
In the second case, some fires occurring in Northern Italy at the end of February 2019 were considered. In that period and area, both the number of fires and the area burned were particularly significant [35]. Liguria and Tuscany (shown in yellow in Figure 7) were among the Italian regions which were most affected by fires, due to dry wind from the north, high temperatures, and sparse rainfall [35].
Table 3 summarizes the fire events occurring between 24 and 26 February 2019, extracted from the EFFIS fire news section and showing differences in burned areas. In addition, the table also reports the results from the ISS system in terms of the number of detected thermal anomalies (referred to as each active event and aggregated in space and time) and relative intensity levels (ALICEMIR min-max), for both single (i.e., only AVHRR, MODIS or SEVIRI observations) and integrated satellite systems.
Table 3.
Winter forest fires occurring during February 2019 in Northern Italy, and relative results from the ISS system in terms of fire detections.
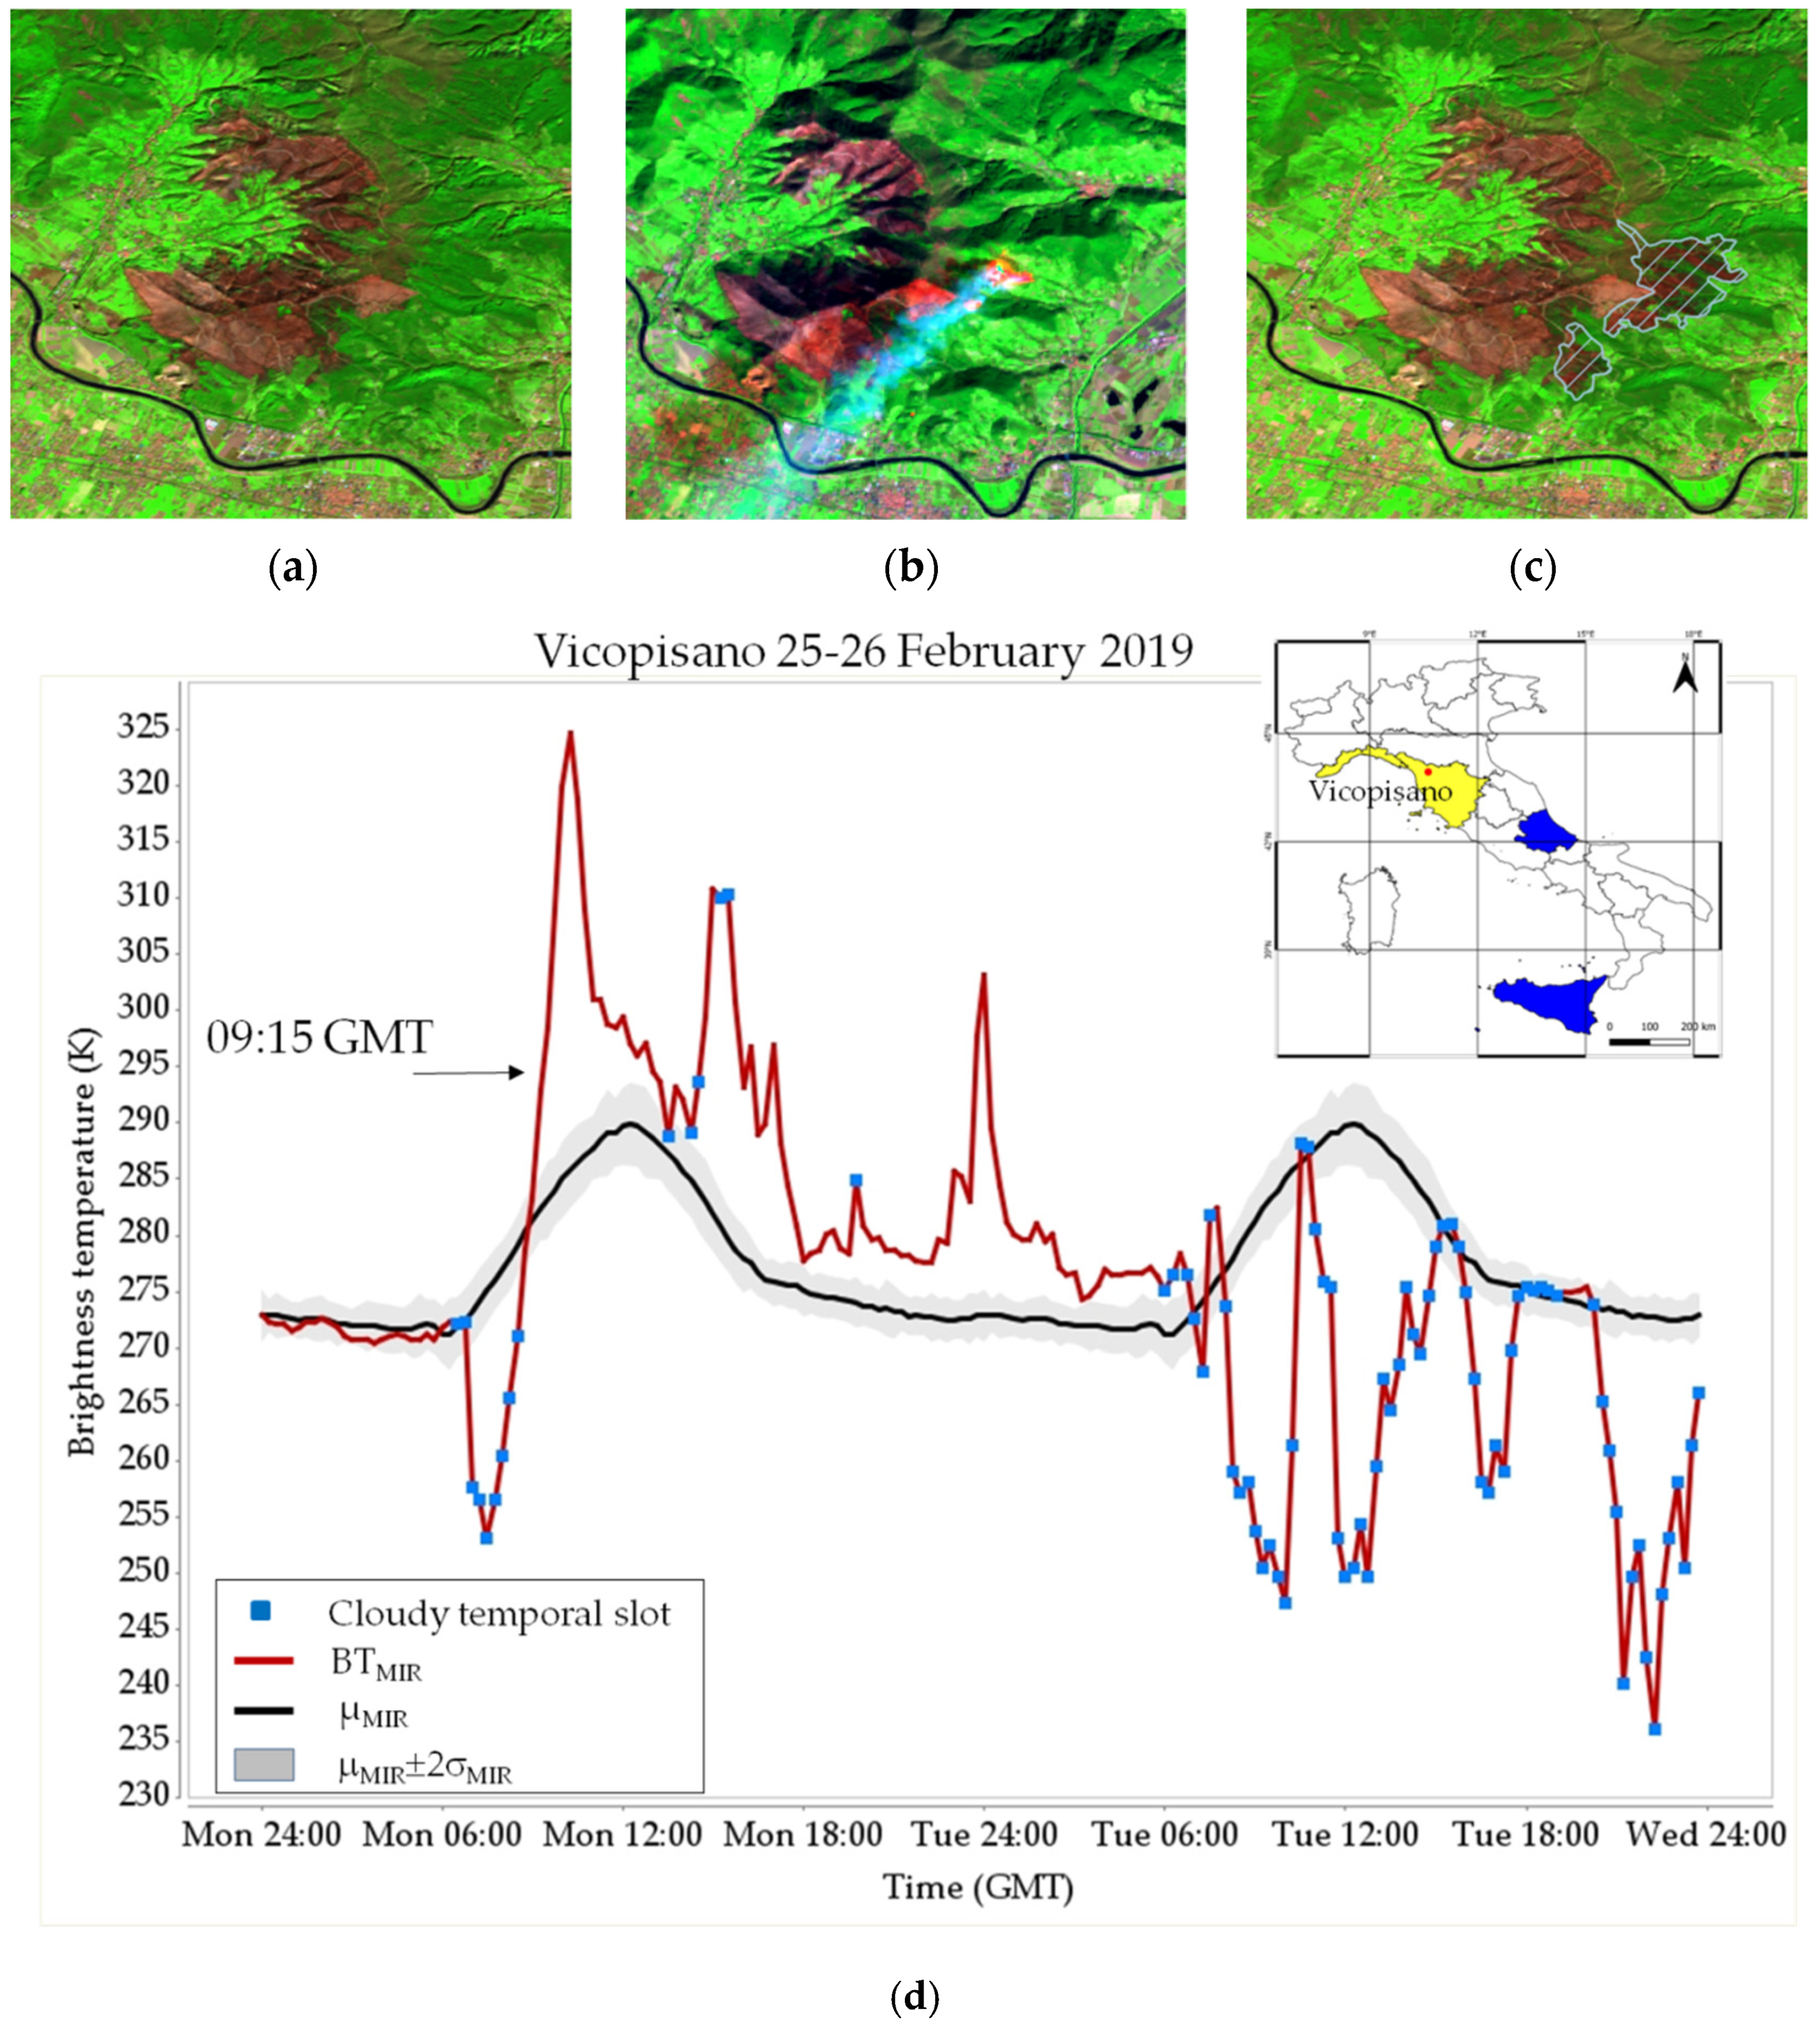
As can be seen in Table 3, the Vicopisano event was the largest one, affecting about 230 hectares. The images in Figure 8 show the area of the Vicopisano fire during (b) and after (c) the event, in comparison with a pre-event image (a). In addition, Figure 8d shows the temporal trend of the MIR signal (in red) detected by SEVIRI in correspondence with the same event. The abrupt increment of the thermal signal, correctly detected by ISS at 09:15 GMT, is in line with the information of local newspapers which report 9:30 GMT as the start of the event [50,51].

Figure 8.
RGB combinations (SWIR–NIR–RED) using Sentinel 2/MSI (a,c) and Landsat 8/OLI (b) data available for the area of Vicoposano pre- (a), during (b), and post-fire (c). (a) In brown showing evidence of a previous 2018 devasting fire. (b) flames and smoke of the 2019 Vicopisano event over Landsat 8/OLI image. (c) burned area of the 2019 Vicopisano fire (dashed polygon). (d) temporal trend of the MIR-SEVIRI signal (in red) measured in correspondence with the Vicopisano fire during 25 and 26 February 2019, together with the expected value and normal variations of the same signal (in black and gray tones, respectively).
In correspondence with the Vicopisano event, as can be seen in Table 3, the values of thermal signal intensity, in terms of the ALICEMIR index, are the highest observed by all satellites (29.8 in case of SEVIRI data, 16.8 in case of AVHRR, 7.2 in case of MODIS). Moreover, the event is characterized by the highest number of detections (142). The same can be observed for the other large fire here analyzed occurring near Sillano (about 100 hectares of total burned area), which generated a high number of thermal anomalies (27) as well as high values of the ALICEMIR index (18.3).
Each satellite sensor contributed differently to the ISS results, especially in the presence of fires just starting and/or short-lived events, which were, in general, better detected using SEVIRI (e.g., Sesta Godano, Careggine, and Passo della Bocchetta). This analysis reveals a good correlation between total burned area and analyzed parameters (i.e., number of thermal anomalies, ALICEMIR values), despite the possible impact of clouds/smoke on results of thermal anomaly identification. By using the PINGEO and PINLEO indicators, it was then possible to analyze concurrent fires and their space-time dynamics. Here, we show some examples of PINGEO and PINLEO applications for the same events in Table 3. Figure 9 shows the temporal trend of PINGEO for the concurrent fire events:
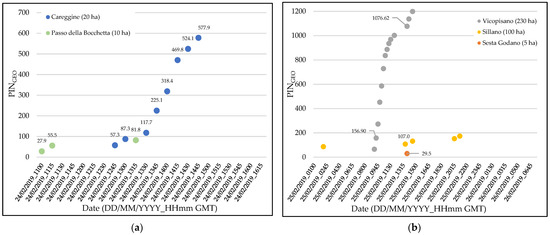
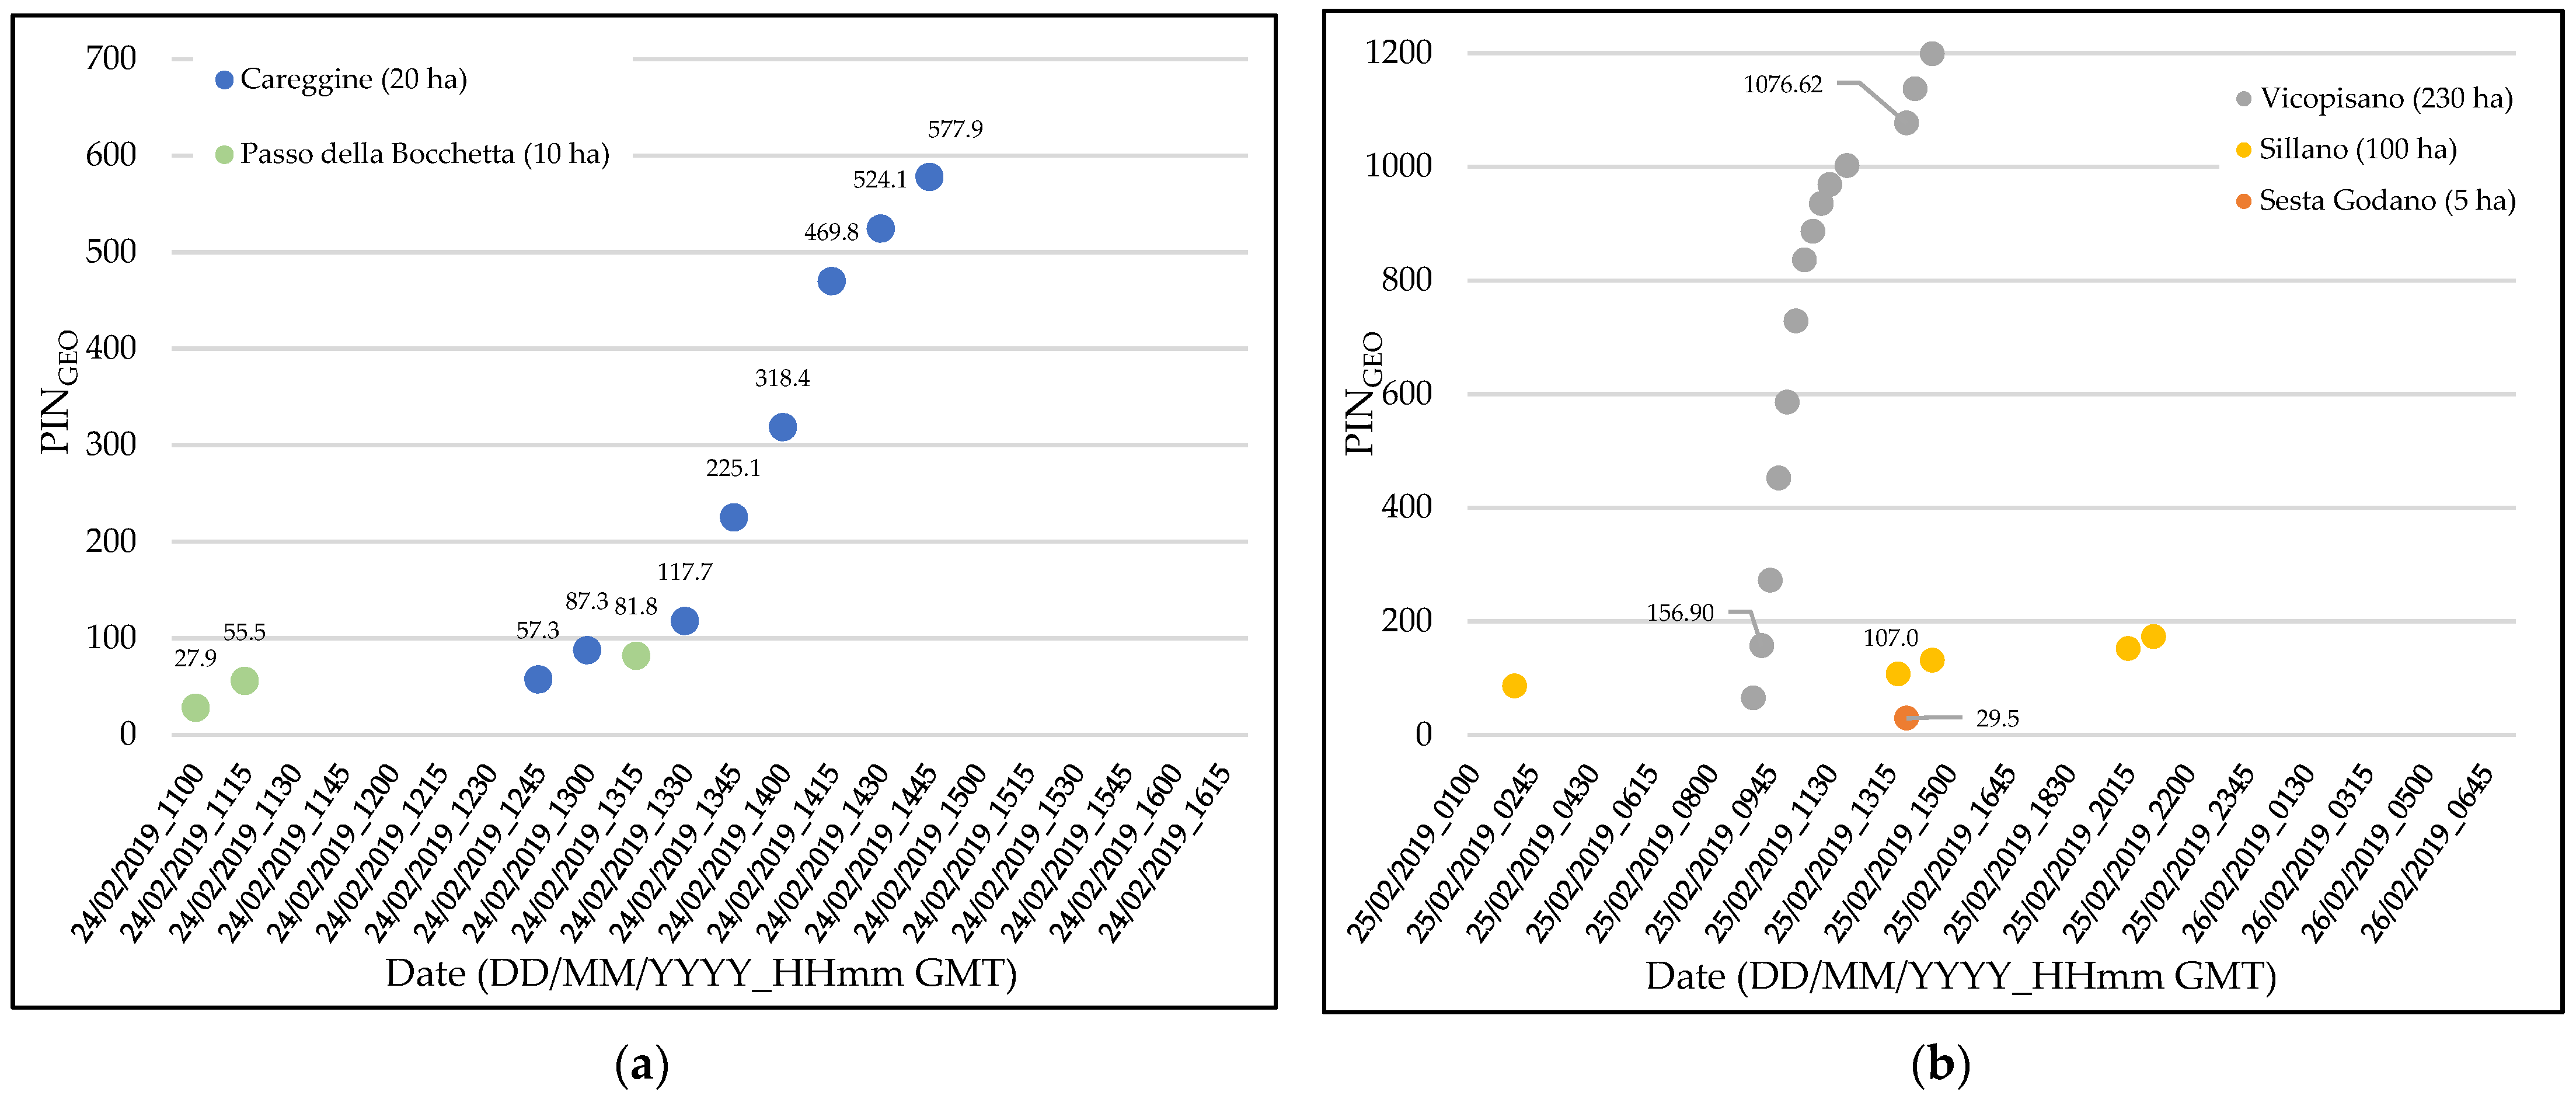
Figure 9.
PINGEO values, calculated using RST-FIRES/SEVIRI detections, for the concurrent event that occurred: (a) during 24 February 2019 near Careggine, and Passo della Bocchetta; (b) during 25 and 26 February 2019 near Vicopisano, Sillano, and Sesta Godano.
It can be noted how the above-mentioned events were characterized by different PINGEO values, which were derived at 15 min time intervals by exploiting the high temporal resolution of SEVIRI data. This analysis provides a first overview of the active fires and makes available a smart indicator that allows us to compare simultaneous fire events, promptly evaluating the priority of fire contrast action in operational contexts.
In Figure 9a with more detail, the first PINGEO value (57.3) for Careggine (12:45 GMT) is greater than the last value (55.5) retrieved at Passo della Bocchetta (11:15 GMT). This trend was also confirmed in the following hours when the PINGEO value at Careggine increased up to 87.3 (13:00 GMT). This value is even higher than the PINGEO derived at Passo della Bocchetta (81.8) fifteen minutes later (i.e., at 13:15 GMT). Those differences suggest the priority of intervention at Careggine, in agreement with information provided by local sources, reporting the use of a higher number of ground and aerial resources at Careggine [52,53] to extinguish flames.
Figure 9b shows another example of the indicator developed in reference to the concurrent fire events of Vicopisano, Sillano, and Sesta Godano, at around 13:45 GMT. Comparing the PINGEO values, the Vicopisano fire is clearly the event to be looked at with greater attention. Indeed, the value of the index analyzed is from 10 to 36 times greater than Sillano and Sesta Godano, respectively. Moreover, it is worth noting that already about four hours before, at 09:30 GMT, the value of the Vicopisano PINGEO is the greatest observed. The different number of ground and aerial firefighting resources used to extinguish flames, from local newspapers, confirms the greater danger posed by the Vicopisano event. In particular, online information records an evident difference in the deployment of resources: 22 ground teams, 1 helicopter, and 3 Canadair aircraft employed at Vicopisano [50], in place of 5 ground teams, 2 helicopters, and 1 Canadair at Sillano [50] and 1 ground team at Sesta Godano [54].
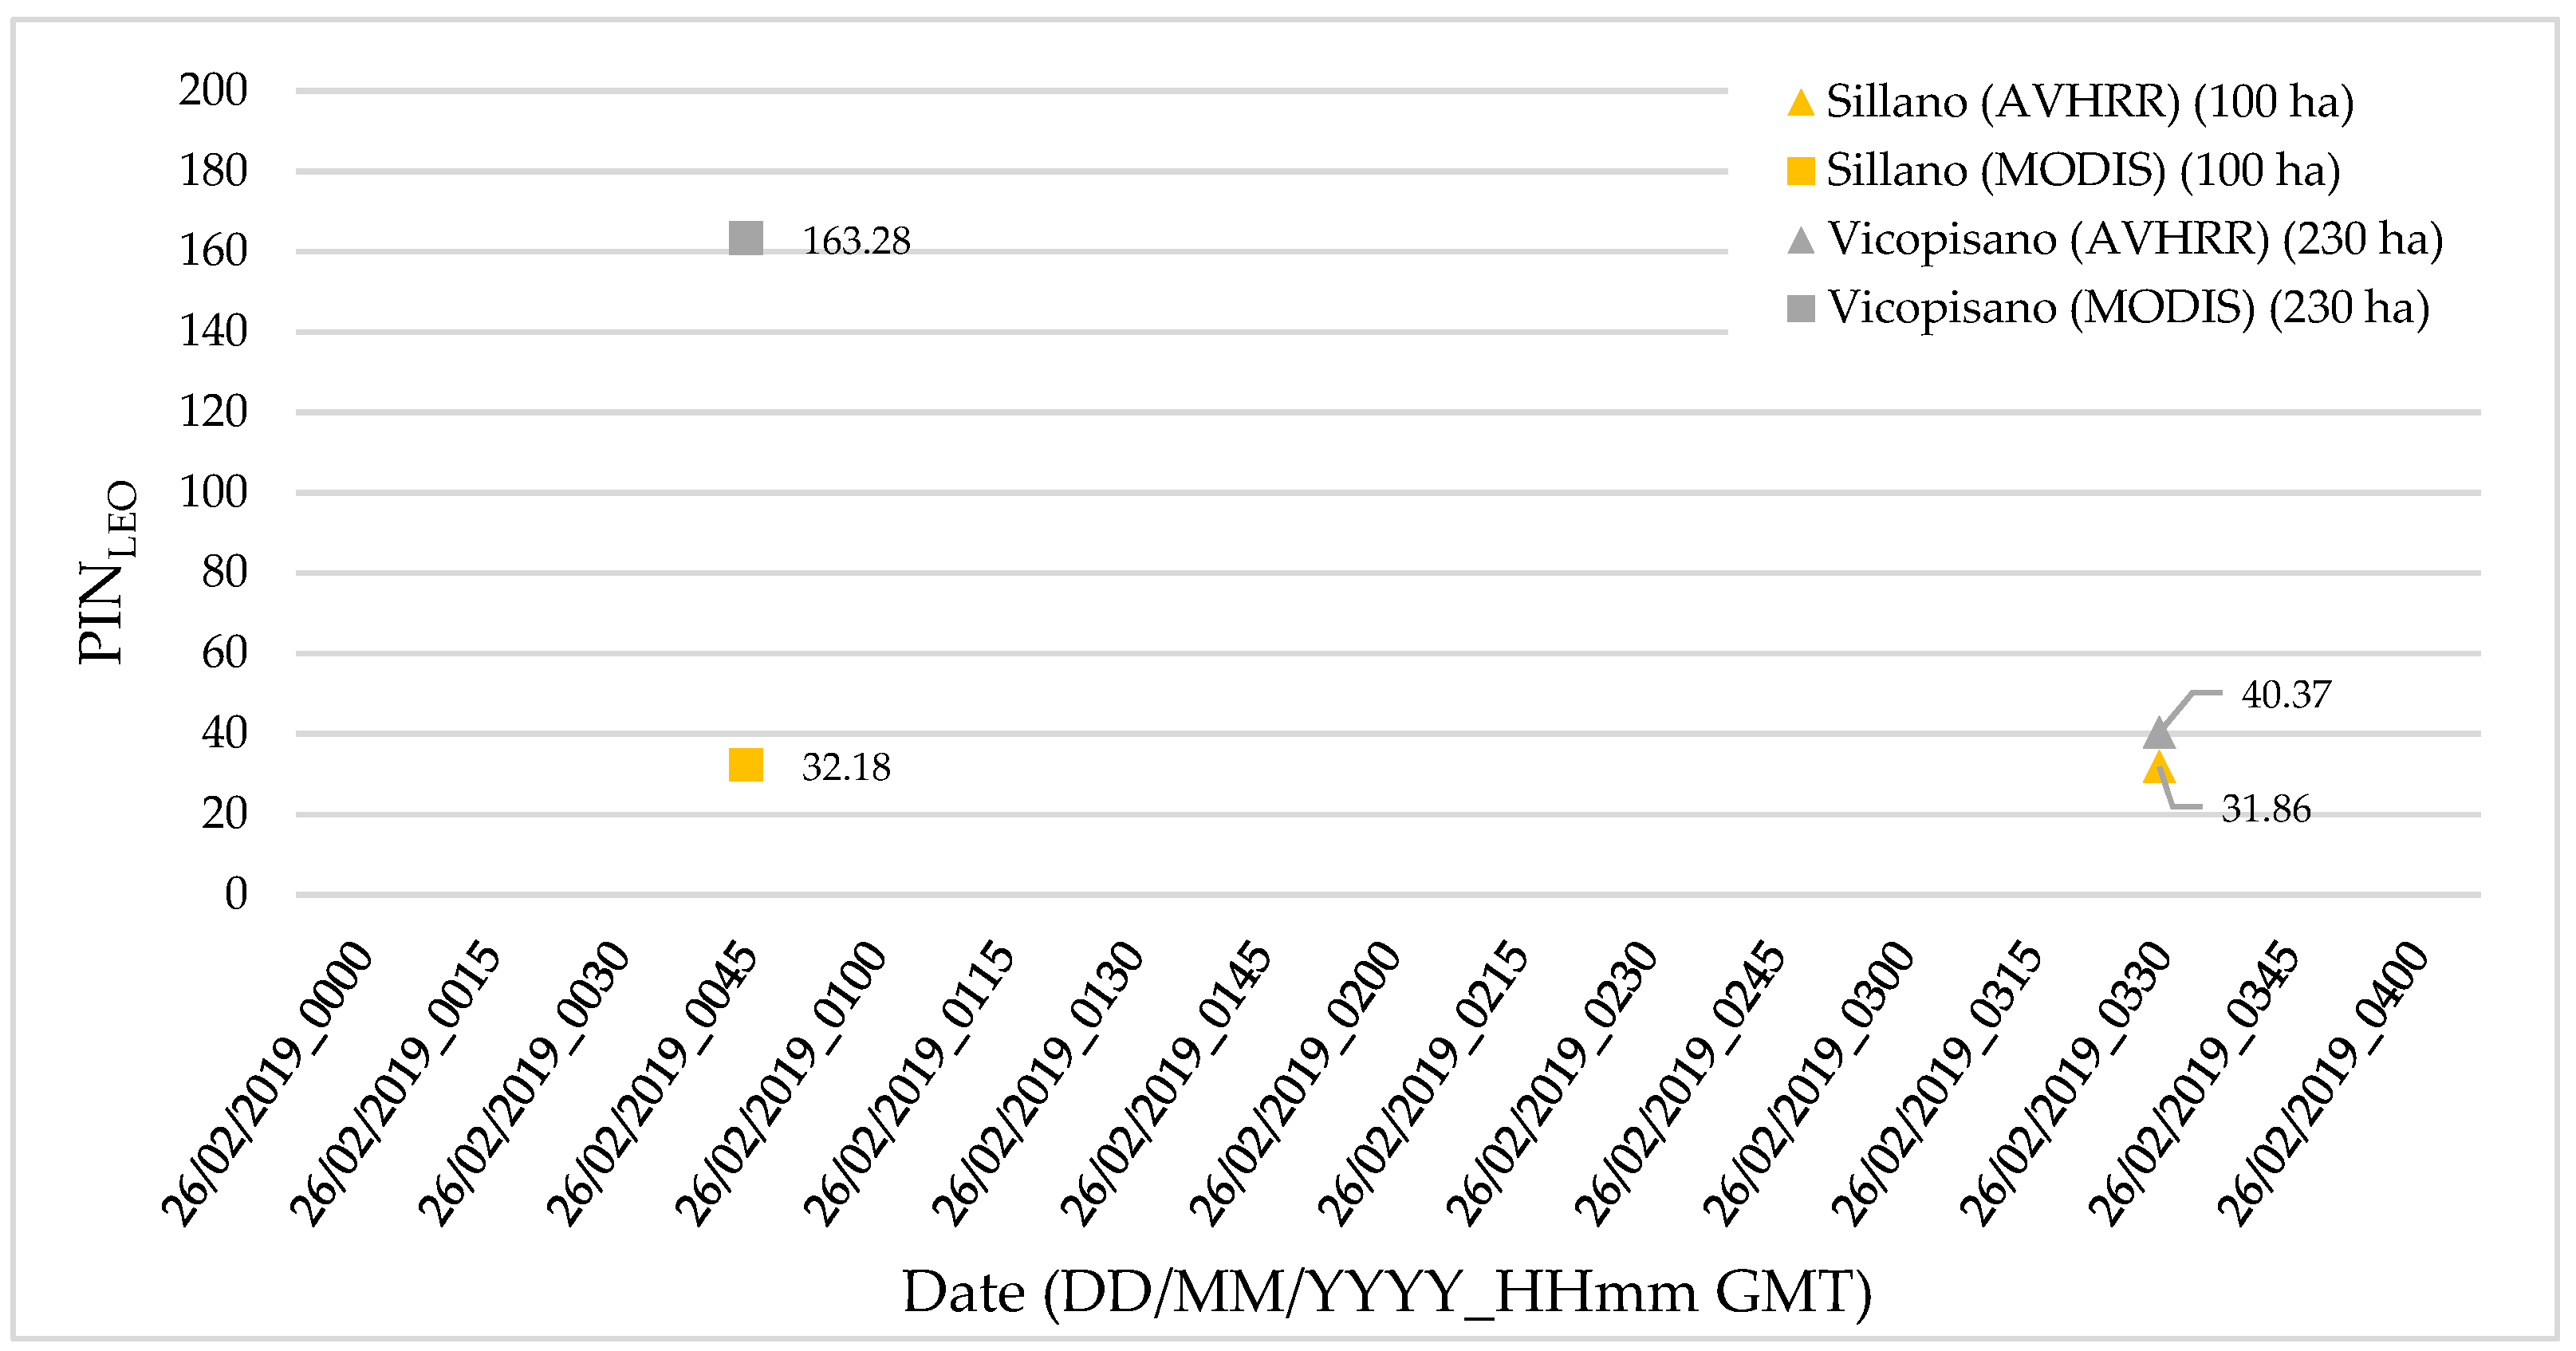
Similar findings are derived from PINLEO for the same aforementioned fire events. Figure 10 shows the values of PINLEO retrieved during the early morning of 26 February 2019, with forest fires simultaneously occurring near Sillano and Vicopisano, whose results are detectable using AVHRR and/or MODIS data. As for PINGEO, the higher values of the index recorded at Vicopisano indicate that this fire event required continuous monitoring and prompt intervention.
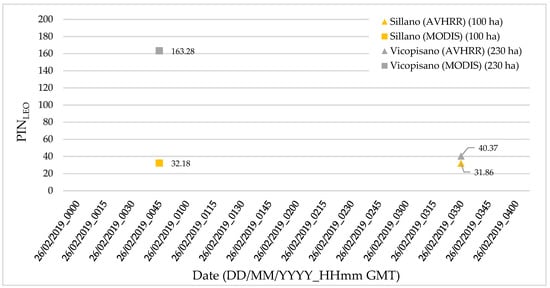
Figure 10.
PINLEO values, calculated using RST-FIRES/MODIS-AVHRR detections, for the events of Vicopisano and Sillano that occurred in the early morning of 26 February 2019.
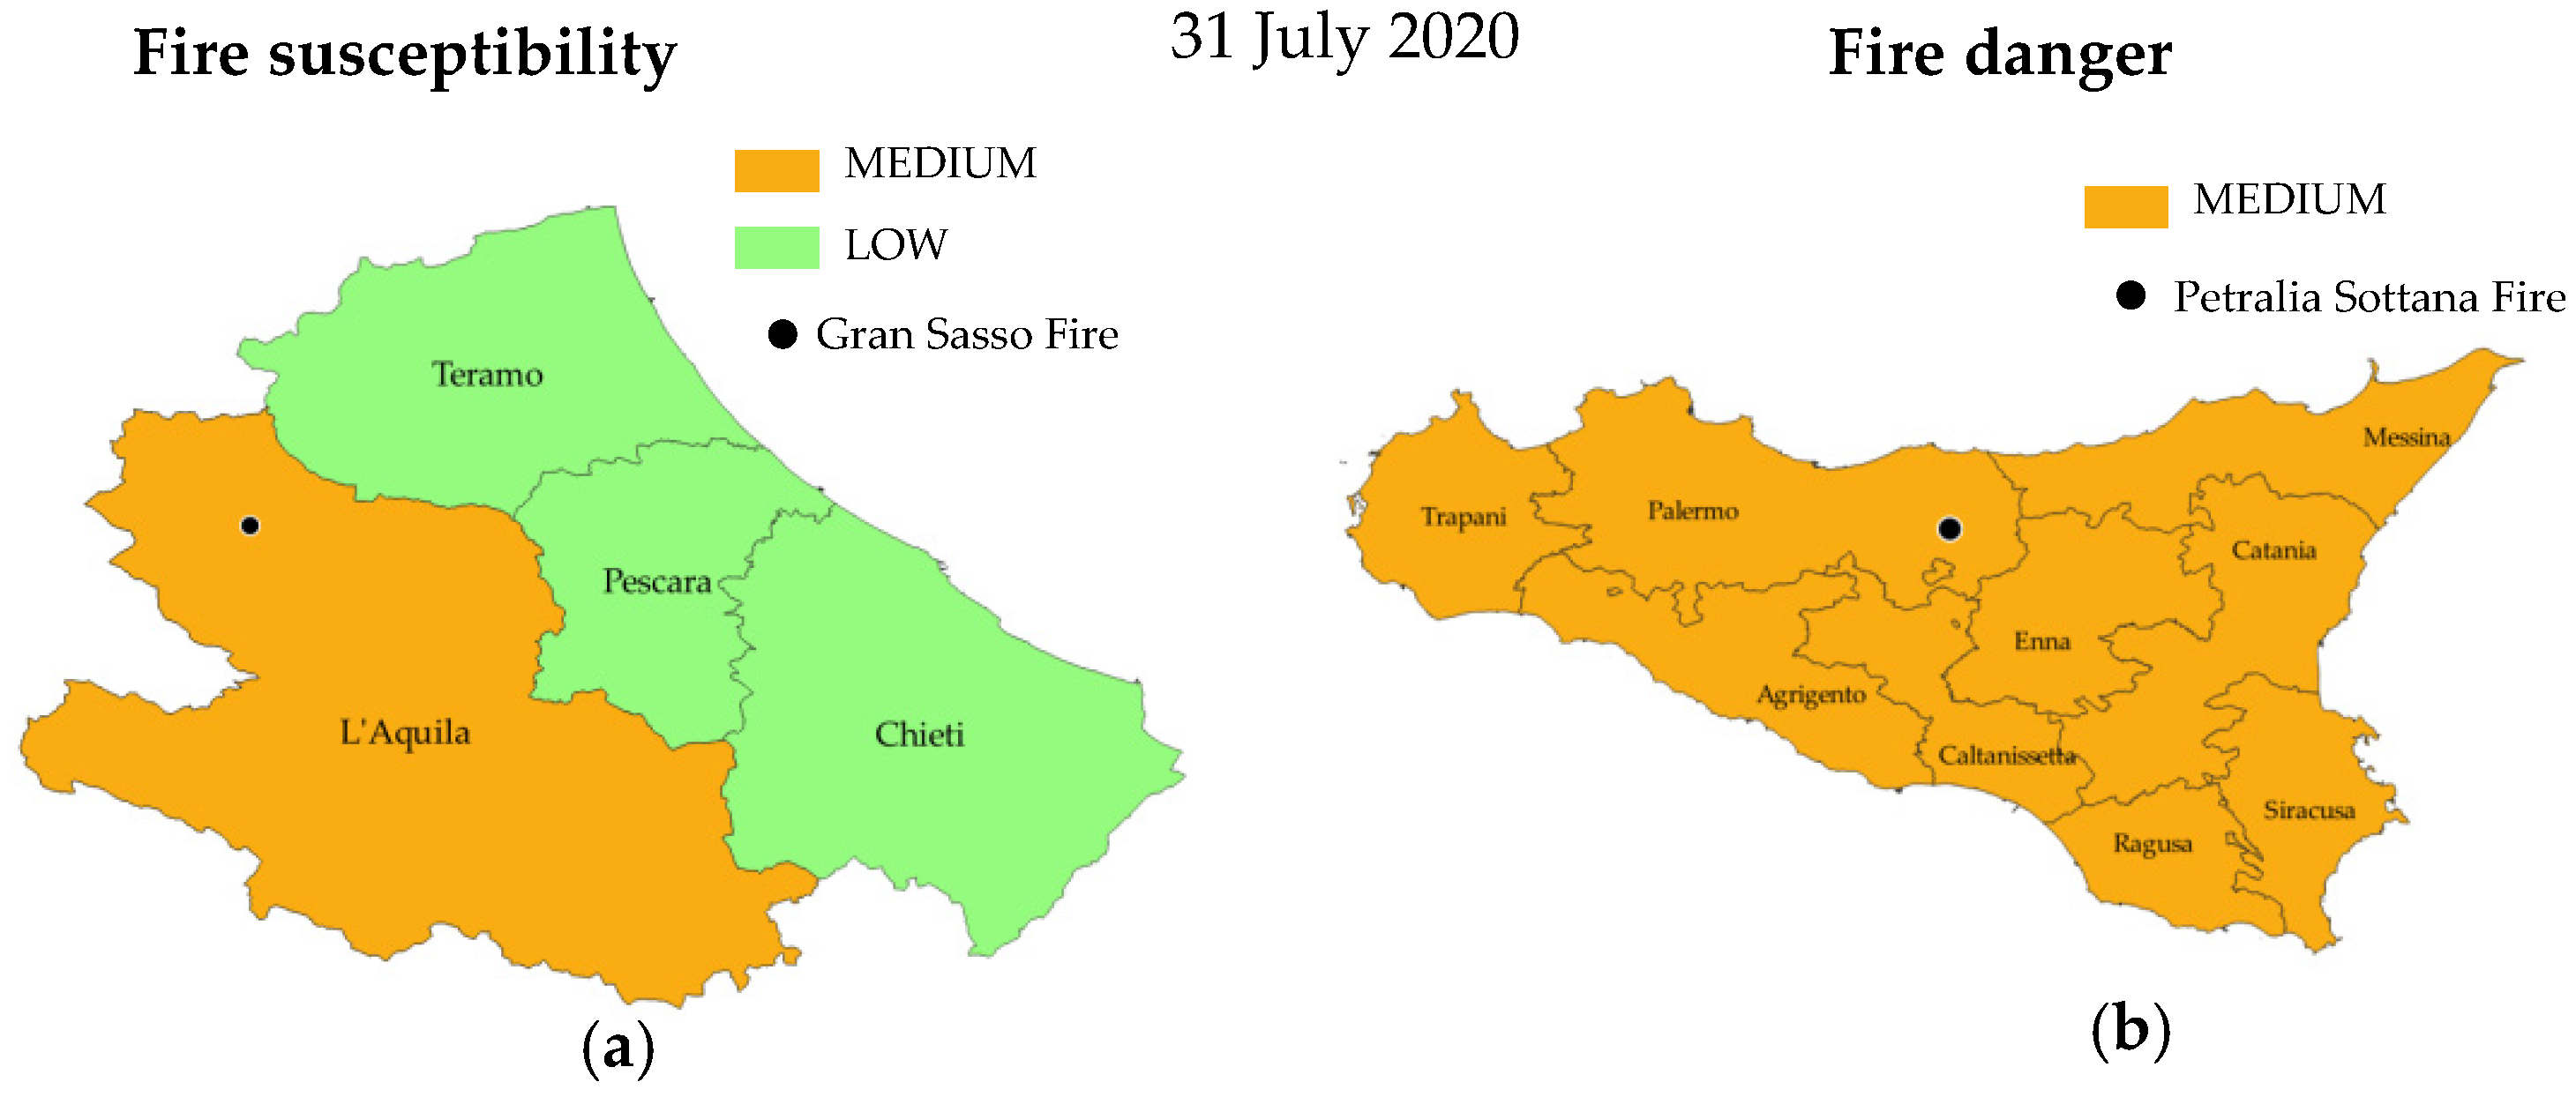
Analogous outcomes can be found considering the case of two concurrent summer fires (Table 4), occurring in central and southern Italy on 31 July 2020. July 2020 saw a high percentage of warm days, mainly in the center-south of Italy, as compared with the 1981–2010 reference period [55]. Abruzzo and Sicily were two of the Italian regions affected by fires on 31 July 2020 and, in particular, an awful event started around 11:00 GMT in the Gran Sasso area (L’Aquila Province, Abruzzo), while another fire was active in Petralia Sottana (Palermo Province, Sicily). Regional Civil Protection Departments had declared a medium fire susceptibility for L’Aquila Province for that day (Figure 11a, [56]) and a medium fire danger level (Figure 11b, [57]) for Palermo Province. The Petralia Sottana fire was identified by RST-FIRES starting from 08:15 GMT, while the first identification of the Gran Sasso fire was at 10:15 GMT. The total number of RST thermal anomalies identified by SEVIRI and MODIS gives an idea of the differences in the spatial extension and intensity of the two events at the end of the day. However, the PIN value trends allow us to highlight different space-time dynamics during fire evolution.
Table 4.
Summer forest fires occurring in central and southern Italy during 31 July 2020 and relative results from the ISS system in terms of fire detections.
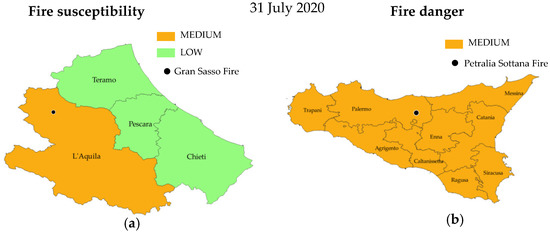
Figure 11.
(a) Fire susceptibility foreseen for 31 July 2020 in Abruzzo Provinces; (b) Fire danger foreseen for 31 July 2020 in Sicily Provinces.
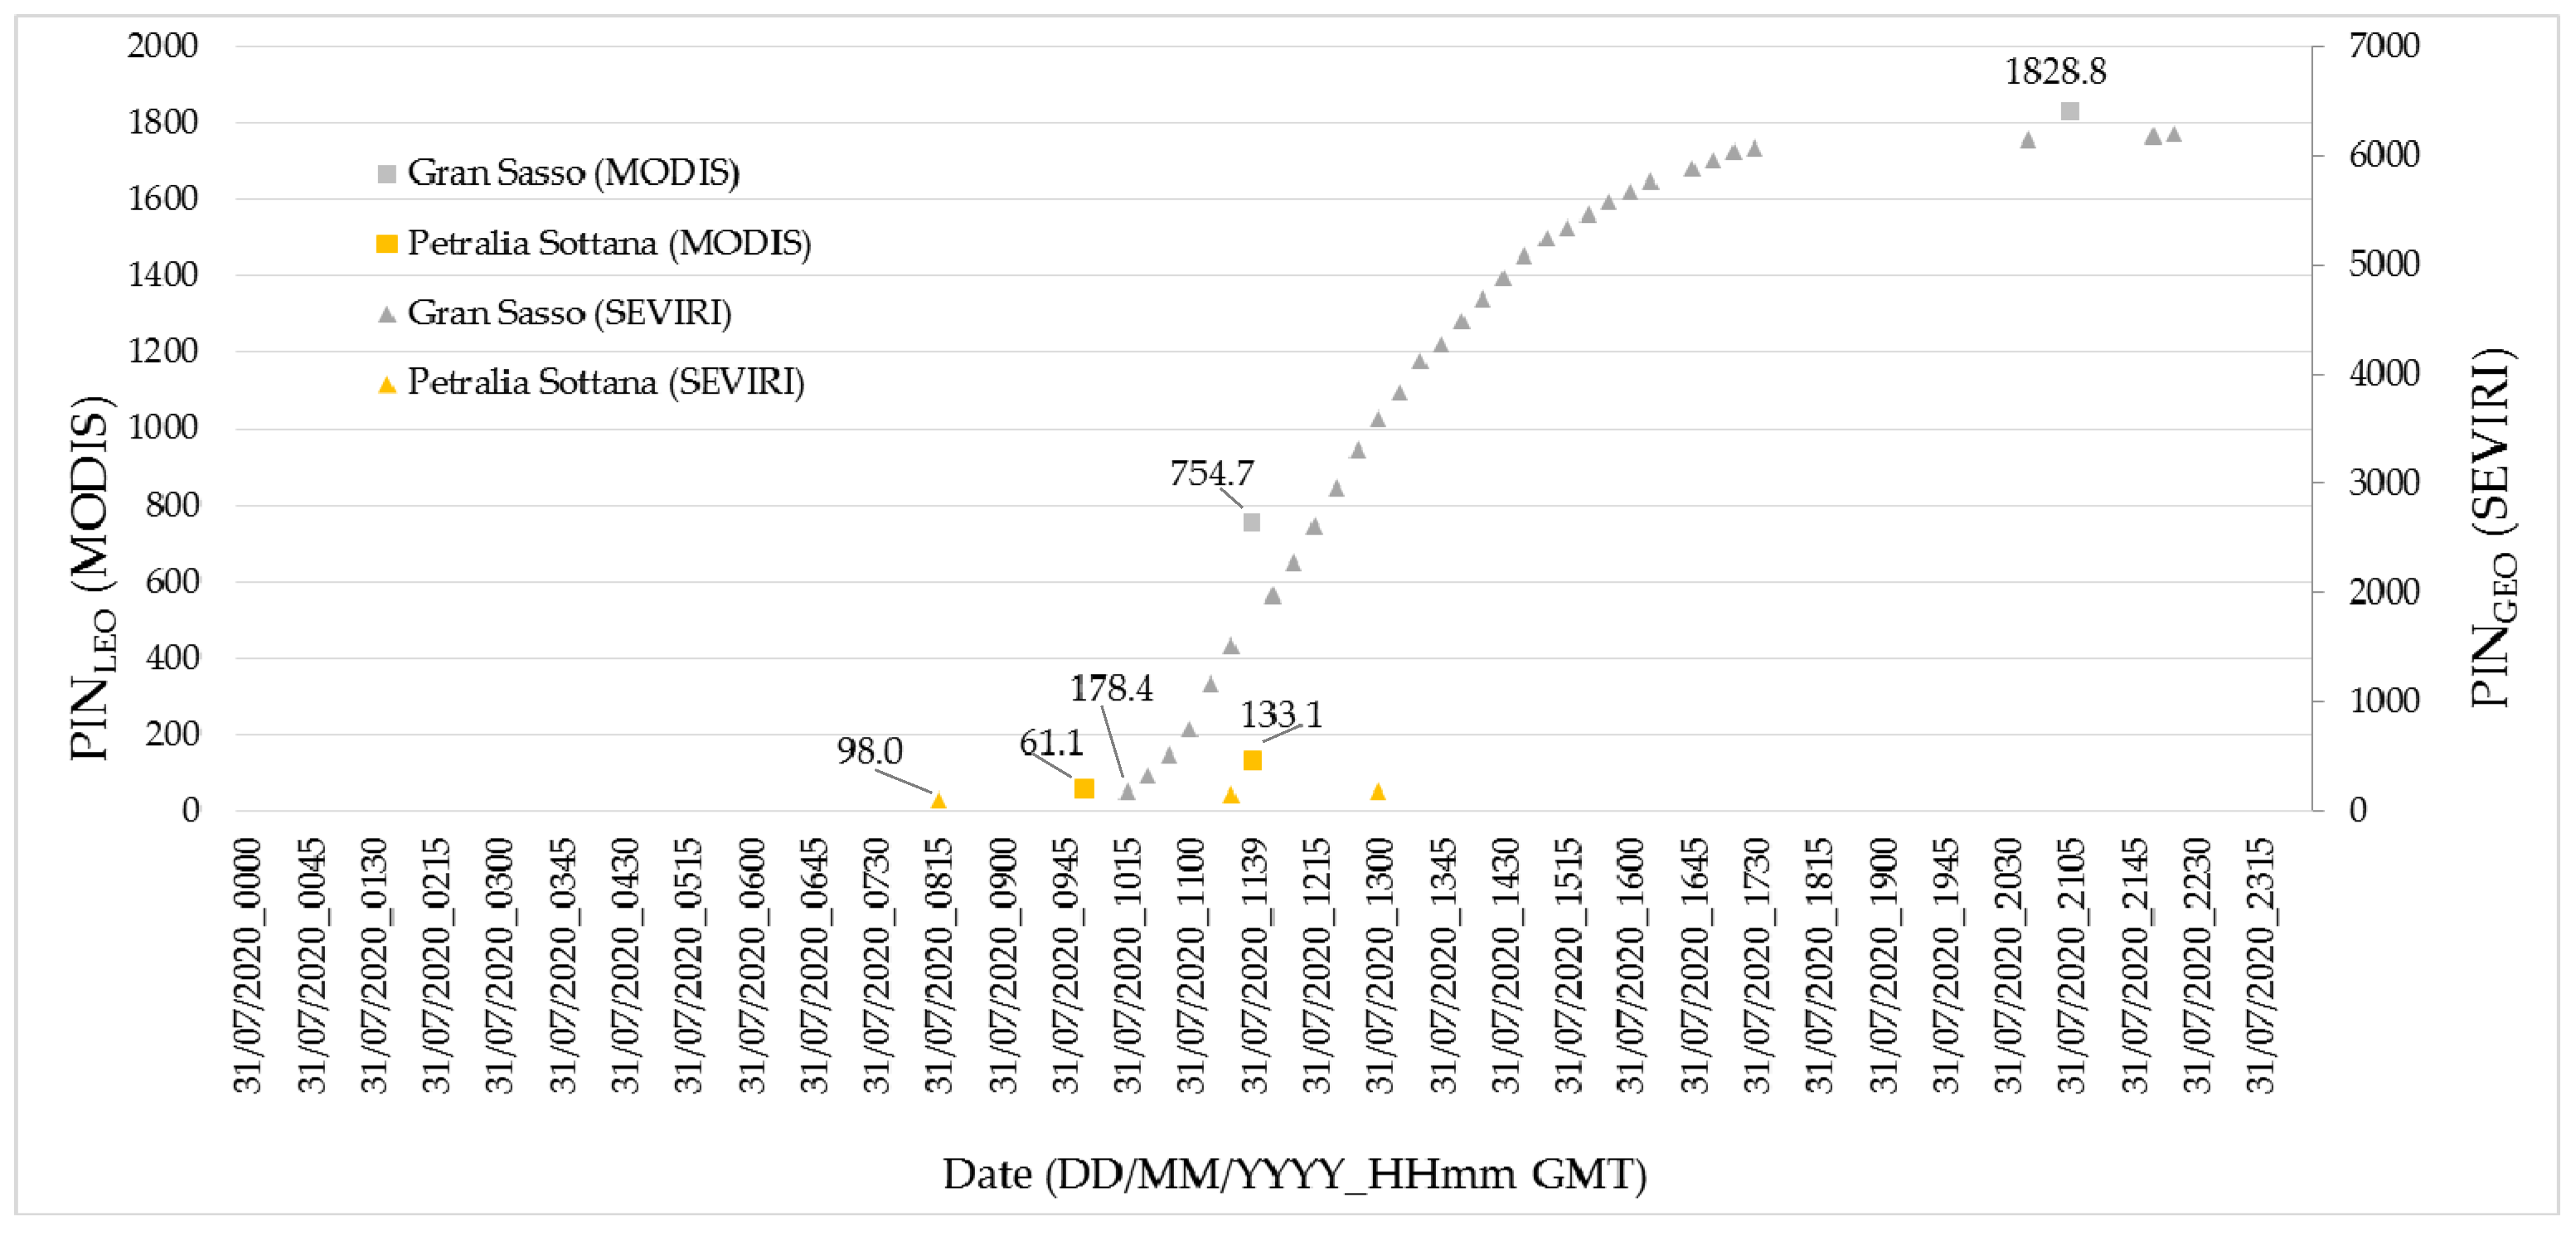
Figure 12 shows, in particular, the integrated use of PINGEO and PINLEO. As described above, the two PINs are based on different weighted indices and therefore their values cannot be directly compared. For this reason, the vertical axis on the left of the graph refers to the PINLEO values, while the vertical axis on the right is related to the PINGEO values. Comparison of the same PIN for the two events clearly shows that greater attention should be given to the Gran Sasso fire. In detail, the Gran Sasso PINGEO value turns out to be 178.4 at the first RST-based detection (10:15 GMT); therefore, it is greater than the last available Petralia Sottana PINGEO (98.0 at 08:15 GMT).
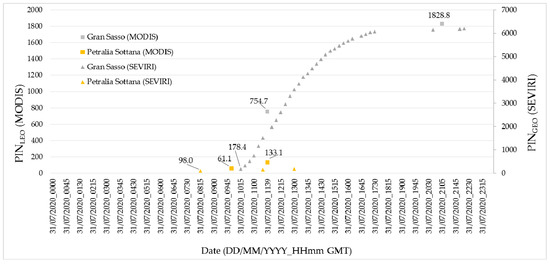
Figure 12.
PINGEO and PINLEO values, calculated using RST-FIRES/SEVIRI and RST-FIRES/MODIS detections, for the concurrent summer events that occurred on 31 July 2020.
Similarly, the first PINLEO value for Petralia Sottana is 61.1 at 09:59 GMT; during the following MODIS overpass (at 11:39 GMT), the Petralia Sottana PINLEO value increases (133.1), but at that time the Gran Sasso PINLEO value (754.7) is five times greater than Petralia Sottana PINLEO. Therefore, PINLEO comparison also confirms the need for primary intervention against the Gran Sasso event.
On the other hand, although PINGEO and PINLEO are not directly comparable and PINLEO can only be computed during polar satellite passages, the information from PINLEO can strengthen the PINGEO information.
Suggestions from PINGEO and PINLEO are corroborated by online news, which indicates the intervention of several teams of volunteers, an army helicopter, and five Canadair aircraft against the Gran Sasso fire [58], while the Petralia Sottana fire required a more limited mobilization of fire-fighting teams and vehicles [59].
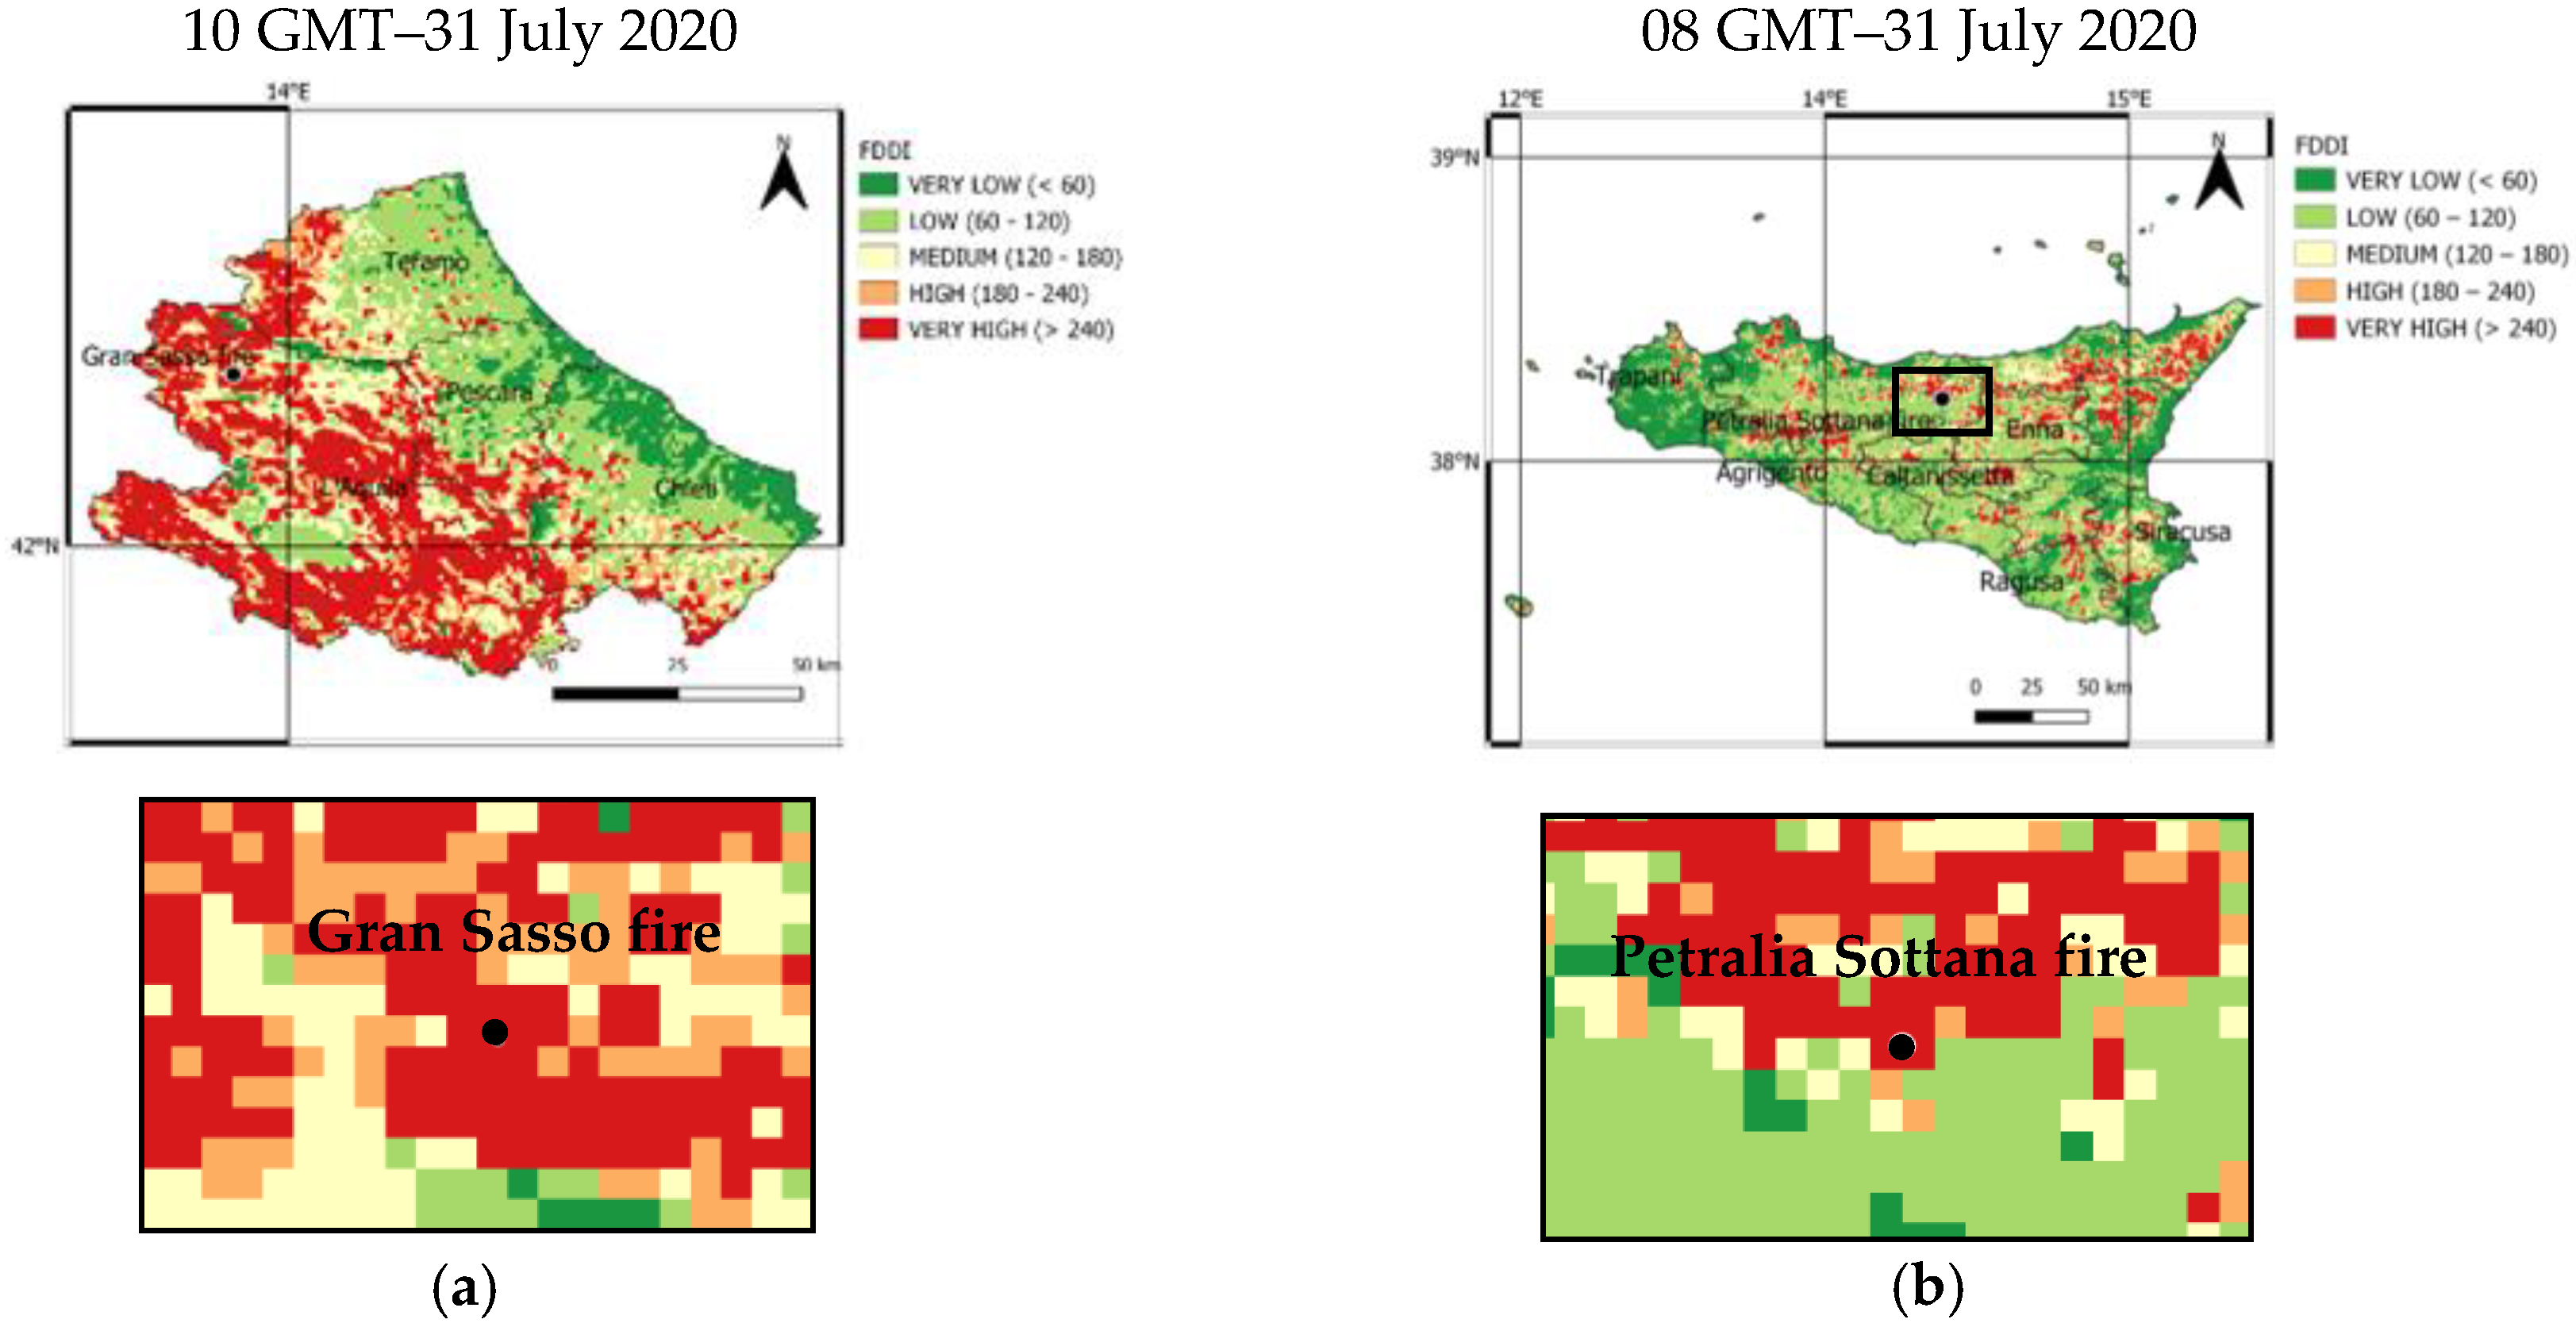
Moreover, it should be highlighted that FDDI values foreseen in correspondence with these two fires fall in the ‘very high’ class (Figure 13). Concerning that point, it is also worth noting that:
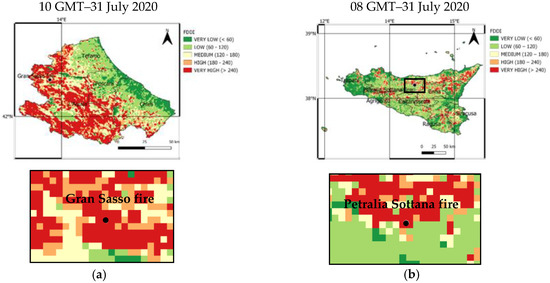
Figure 13.
(a) Gran Sasso fire, identified by RST-FIRES since 10:15 GMT, overlapped by the FDDI map foreseen for 10 GMT on 31 July 2020 in Abruzzo; (b) Petralia Sottana fire, identified by RST-FIRES at 08:15 GMT, overlapped by the FDDI map foreseen for 08 GMT on 31 July 2020 in Sicily.
- the FDDI index used in ISS is able to give information on a local scale and with a 1-h update, unlike the forecasts that are used in operational mode by Civil Protection Departments (daily, at a Province level, see Figure 11);
- the use of the FDDI index alone is not enough to establish prioritization if it is not coupled with other indices that are at the basis of the PINs.
6. Discussion
Preliminary results presented in previous sections have shown the potential of the ISS system in providing information about fire monitoring and prioritization. Like other satellite-based systems, however, ISS suffers from some limitations due to the use of optical band data for fire detection. Both clouds and smoke obscuring the areas affected by fires may cause significant omission errors or lead to the underestimation of fire events (e.g., [14]).
In this study, we retrieved information required to assess the alert from the ISS system from some of the summer fires as well as the winter fires, aiming at testing the system in different conditions. The test included fires occurring in the summertime, when meteorological conditions are generally favorable for satellite fire surveillance, as well as the events occurring in the winter season, when dense and persistent cloud coverage is more frequent and capable of obscuring active fires, making them more difficult to be continuously monitored. On the other hand, the reliability of fire detection algorithms in the winter season is severely tested due to the possibility of having a false alarm proliferation mainly related to a high MIR signal, observed for example in correspondence with cloud edges.
It is then evident that the capacity of the ISS system for forest fires prioritization needs to be verified in further cases.
Moreover, accurate validation of fire products, including those provided by the ISS system, is not a trivial task. This analysis not only requires detailed information about fires (e.g., starting and end time, duration, size) which may sometimes be derived from local sources (as for this study), but also information about a number of other important factors, such as fire propagation speed, space-time dynamics, flame intensity, and front height and length. This information is usually not available, particularly during the evolution of fire events. Hence, the results of this study give a first indication of the potential of the proposed system in providing information of great relevance for firefighting activities regarding the possibility of better managing available resources.
Regarding the advantages of the ISS system, although it has been developed to perform over the Italian territory, it can be easily scaled to a local (i.e., regional territory) and continental scale. This is possible thanks to the use of an efficient fire detection algorithm (RST-FIRES) exportable to different geographic areas, which may be applied to data from different sensors (both polar and geostationary).
Clearly, ancillary data (i.e., weather forecasts) are required to implement the ISS system operationally.
The availability of high-resolution and/or updated layers also at the regional level (i.e., maps of land use) could further improve the performance of the system developed. It is customizable to different end-users. Additionally, both PINGEO and PINLEO developed here are synthetic indicators that can use different weights for the parameters considered. Specific end-users could then require a different set of PIN constants, based on their own needs.
7. Conclusions
Fires are a complex environmental risk generally addressed with a multiplicity of systems at all stages of their development: hazard evaluation, monitoring, and damage assessment.
In this paper, we have presented an automatic satellite-based system for fire detection and prioritization that, for the first time, integrates two different approaches. The first one is focused on early warning and monitoring, while the second one is devoted to an assessment of danger and damage reduction. The ISS system integrates the following modules:
- hot spot real-time detection by using the RST-FIRES technique, implemented with multi-mission satellite data (AVHRR, MODIS, SEVIRI);
- evaluation of fire ignition/propagation, for each detected hot spot, by using a simplified index, FDDI, to consider the state of vegetation, the wind intensity (WI), and geomorphological characteristics (MDI) for the area affected by the event;
- construction of synthetic priority indicators, PINGEO and PINLEO, for an immediate (and continuously updated) overview of the situation.
ISS extends the performance of the RST-FIRES system, which was successfully used in operational contexts [15] by implementing ancillary information to evaluate, pixel by pixel, the predisposition and the possibility of the fire occurrence. The system is then capable of early fire detection, characterizing some crucial features of the territory potentially affected by flames. Moreover, it may represent a decision support tool to prioritize active concurrent fires driving priorities for intervention, by optimizing the use of available ground and aerial resources to extinguish fires. To perform a first assessment of the developed system, we analyzed a number of winter fires of different sizes and intensity levels occurring in northern Italy, exploiting the information from the EFFIS fire news section and local online newspapers. In addition, the case of two concurrent summer fires was analyzed.
In both cases, the priority synthetic indices, PINGEO and PINLEO, were then calculated for satellite imagery acquired during the fire events demonstrating their usefulness to fire prioritization.
Although further analyses are required to fully evaluate the performance of the ISS system, it may support civil protection, firefighters, volunteers, and other operators involved in better managing active fires, minimizing the impact of dangerous and highly destructive events on populations and the environment, in agreement with European legislation [60]. Finally, the ISS system is also in line with the key objectives (i.e., reduction of the “incidence and extent of forest fires”) of the EU forest strategy, described in the European Green Deal [61].
Author Contributions
Conceptualization, G.M., C.F., A.F.; methodology, A.L., N.P., C.F.; software, A.F.; validation, C.P., F.D.S., G.N., V.S.; formal analysis, A.L., C.F., G.M., T.L., F.M., writing G.M, C.F., A.L., F.M., T.L.; supervision, N.P. All authors have read and agreed to the published version of the manuscript.
Funding
This research was partially funded by the SPOT (Development of a platform for innovative services based on Earth Observation data) project, funded within the framework of the National Operational Programme (PON) on Enterprises and competitiveness 2014–2020 and by the project OT4CLIMA (Development of Innovative Earth Observation Technologies for the Study of Climate Change and Its Impacts on the Environment), funded by the Italian Ministry of Education, University and Research (MIUR), in the framework of the National Operational Programme (PON), Research and Innovation 2014–2020, Specialization Area Aerospace (D.D. 2261 del 6.9.2018, PON R&I 2014–2020 and FSC).
Institutional Review Board Statement
Not applicable.
Informed Consent Statement
Not applicable.
Data Availability Statement
Not applicable.
Acknowledgments
The authors wish to thank EUMETSAT and the Aeronautica Militare Italiana for its support in accessing the MSG-SEVIRI data used in this study.
Conflicts of Interest
The authors declare no conflict of interest.
Abbreviations
| AFIS | Advanced Fire Information System |
| AI | Area of Interest |
| ALICE | Absolutely Llocal Index of Change of the Environment |
| AVHRR | Advanced Very High Resolution Radiometer |
| CLC2012 | CORINE Land Cover 2012 |
| COAU | Unified Air Operational Center |
| CORINE | Coordination of Information on the Environment |
| COSMO | Consortium for Small-scale Modeling |
| DTM | Digital Terrain Model |
| DV | Danger Value |
| EDI | Extremal Dependence Index |
| EFFIS | European Forest Fire Information System |
| EOS | Earth Observing System |
| FAST | FSI Fire Alerts System |
| FD | Fuel danger |
| FDDI | Fire Danger Dynamic Index |
| FMI | Fuel Moisture Index |
| FWI | Fire Weather Index |
| GIS | Geographic Information System |
| GRIB | GRIdded Binary |
| ICRIF | Índice Combinado de Risco de Incêndio Florestal |
| INPE | Instituto Nacional de Pesquisas Espaciais |
| ISS | Integrated Satellite System |
| LAMI | Limited Area Model Italy |
| MCDA | Multi-Criterial Decision Analysis |
| MDI | Morphological Danger Index |
| MetOP | Meteorological Operational Satellites |
| MIR | Middle InfraRed |
| MODIS | Moderate Resolution Imaging Spectroradiometer |
| MSG | Meteosat Second Generation |
| MVC | Maximum Value Composite |
| NDVD | NDVI Decadal |
| NDVI | Normalized Difference Vegetation Index |
| NIR | Near InfraRed |
| NOAA | National Oceanic and Atmospheric Administration |
| PIN | Priority Indicators |
| PINGEO | PIN for geostationary satellites |
| PINLEO | PIN for polar satellites |
| POD | Probability Of Detection |
| RST | Robust Satellite Techniques |
| RST-FIRES | Robust Satellite Techniques for FIRES detection and monitoring |
| SEVIRI | Spinning Enhanced Visible and InfraRed Imager |
| SWIR | Short Wave InfraRed |
| TIR | Thermal InfraRed |
| VIIRS | Visible Infrared Imaging Radiometer Suite |
| VIS | Visible |
| WI | Wind Intensity |
Appendix A
The performance of FDDI in predicting the occurrence of fire events is evaluated here by assuming wildfires as rare, low-frequency events [62,63,64]. In these cases, the problem to be addressed is that the lower the frequency of the events, the more the performance measure of the prediction model degenerates [62]. The Extremal Dependence Index (EDI), proposed by [63,65], is less dependent, compared to other validation methods, on the relative frequency with which the event was observed to occur. Therefore, EDI performs well in checking for rare event predictions. In [65],the authors calculated EDI with the following equation:
EDI = (LogF − LogPOD)/(LogF + LogPOD)
POD is the Probability of Detection and F is the Fire Alarm Rate, described by the following relation:
where a (hits) is the number of times that the forecast indicates fire danger and fire is observed, while c (misses) is the number of times that the forecast indicates no fire danger, but fire is observed.
where b (false alarms) is the number of times that the forecast indicates fire danger, but a fire event is not observed, and d (correct negatives) is the number of times that the forecast indicates no fire danger, and no fires are observed.
POD = a/(a + c)
F = b/(b + d)
To calculate EDI, we propose a modification of POD, as shown in Equation (A4) by considering the largely probabilistic character of the considered phenomenon. Fires are generally anthropogenic events (especially in Italy). Therefore, to apply EDI in the validation of FDDI, we accept the simplification of the binary partition of events (fire/no-fire), but we modify the calculation of the Probability of Detection (POD) considering that we are verifying the validity of Forecasts of Rare Binary Events of a probabilistic and not a deterministic nature.
For this purpose, therefore, we consider the number of events in relation to the surface attributed by the FDDI forecasts to the fire occurrence zone or to the no-fire occurrence zone. We divided FDDI into 5 danger classes, attributing them to the relative occurrence zone, as shown in Table A1.
The fire occurrence zone is the area for which FDDI falls into classes 4 and 5, characterized by high probability fire events, while a no-fire occurrence zone is referred to as classes 1, 2, and 3 with low probability fire events.
Table A1.
FDDI classes and relative occurrence zone.
Table A1.
FDDI classes and relative occurrence zone.
| Class | FDDI Value | Occurrence Zone | Description |
|---|---|---|---|
| 1 | FDDI ≤ 60 | No-fire occurrence zone | Low probability fire events |
| 2 | 60 < FDDI ≤ 120 | ||
| 3 | 120 < FDDI ≤ 180 | ||
| 4 | 180 < FDDI ≤ 240 | Fire occurrence zone | High probability fire events |
| 5 | FDDI > 240 |
Therefore:
where amod and cmod are the hits and misses categories modified, as indicated above, to consider the spatialization of values
PODmod = amod/(amod + cmod)
amod = a/numb_pixel_fire
cmod = c/numb_pixel_no-fire
The Fire Alarm Rate is then modified (Fmod) according to following the relations
Fmod = bmod/(bmod + dmod)
bmod = numb_pixel_fire − a
dmod = numb_pixel_no-fire − c
The goal is to demonstrate that fire is more likely to occur in FDDI classes 4 and 5 than in FDDI classes 1, 2, and 3 by calculating EDI.
We calculated the FDDI index for the Basilicata region during the 2018 fire summer season, in particular from 12 June 2018 to 30 September 2018, for which official databases of fire events were available; for the 94 fires that occurred during this period, we generate the value of FDDI for the corresponding SEVIRI fire pixel, at the start time of the event.
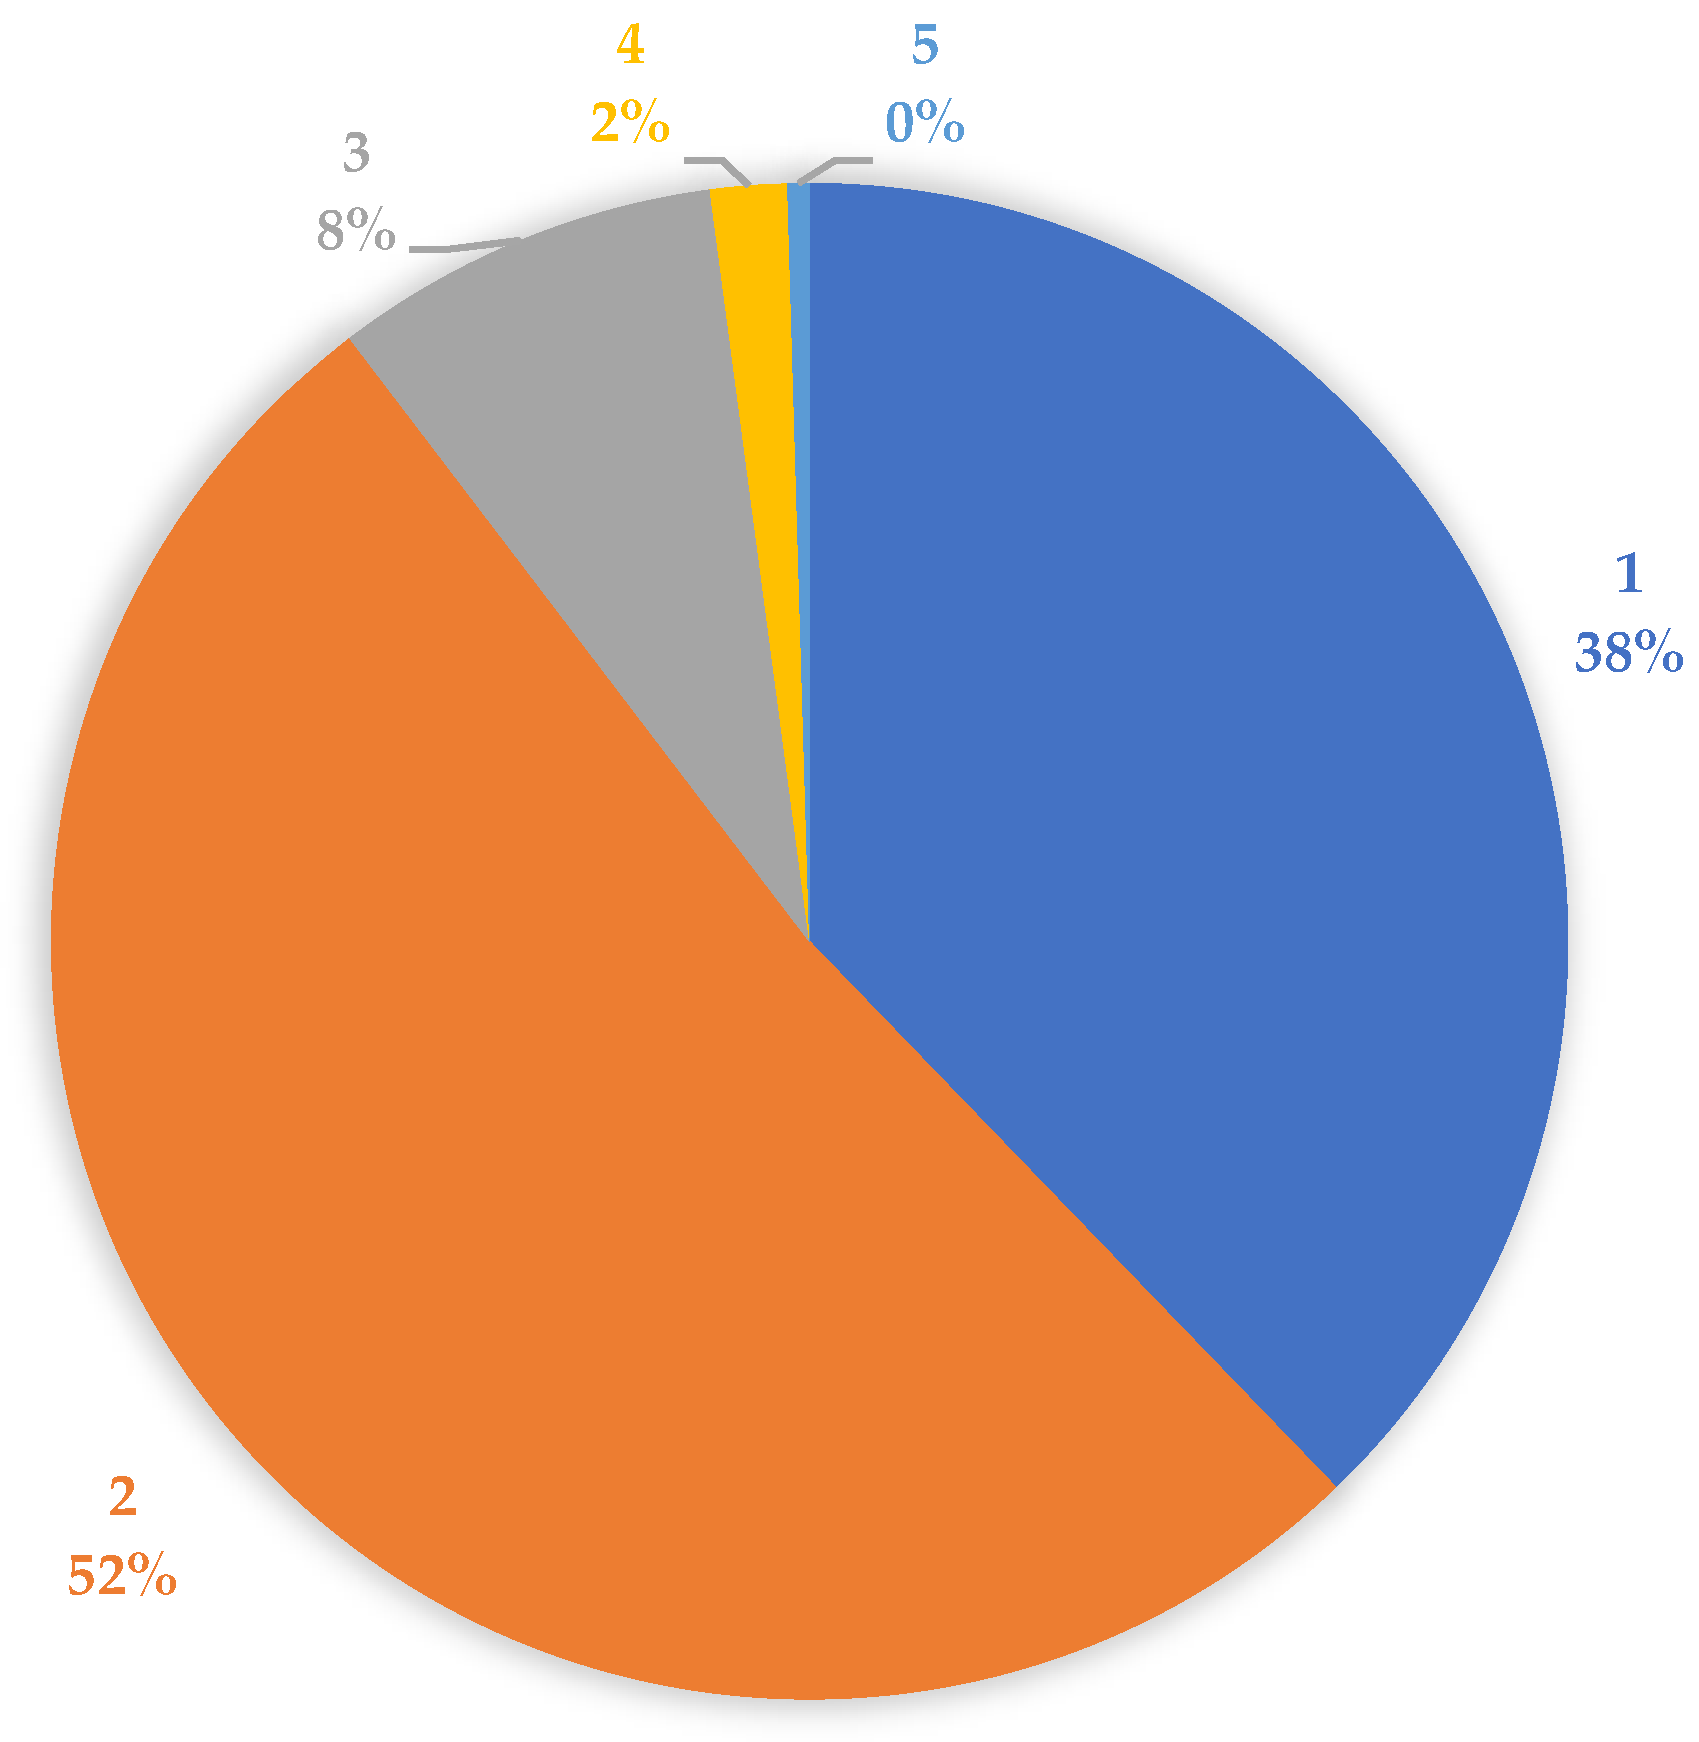
In Figure A1, the results of this classification are reported:
- 97% (91 fires) belong to the non-fire occurrence zone (classes 1–2–3);
- 3% (3 fires) belong to the fire occurrence zone (classes 4–5).
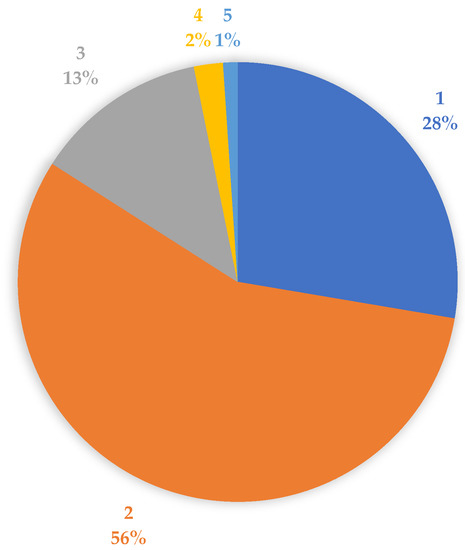
Figure A1.
Classification of SEVIRI fire pixels in correspondence with the 94 events that occurred in Basilicata during the 2018 summer fire campaign.
Figure A1.
Classification of SEVIRI fire pixels in correspondence with the 94 events that occurred in Basilicata during the 2018 summer fire campaign.

Moreover, considering the area of Basilicata (approximately equal to 952 SEVIRI pixel) and the 94 time slots corresponding to the start time of the events considered, we have classified 88,440 SEVIRI pixels of the regional territory. The results (in Figure A2) show that:
- 86,586 pixels (about 98%) belong to classes 1, 2, and 3 (no-fire occurrence zones);
- 1854 pixels (about 2%) belong to classes 4 and 5 (fire occurrence zones).

Figure A2.
Classification of 88,440 SEVIRI pixels covering the Basilicata region in correspondence with the events that occurred during the 2018 summer fire campaign.
Figure A2.
Classification of 88,440 SEVIRI pixels covering the Basilicata region in correspondence with the events that occurred during the 2018 summer fire campaign.
Based on these considerations, we calculated the above-mentioned PODmod and Fmod to obtain the spatialized value:
amod = 3/1854 = 0.001618
cmod = 91/86,586 = 0.001051
PODmod = 0.001618/0.002669 = 0.6062
bmod = 1854 − 3 = 1851
dmod = 86,585 − 91 = 86,495
Fmod = 1851/88,310 = 0.021
The modified EDI (EDImod) is calculated according to the following equation:
EDImod = (LogFmod − LogPODmod)/(LogFmod + LogPODmod)
EDImod = (−1.6788 + 0.2174)/(−1.6788 − 0.2174) = −1.4614/−1.8961 = 0.77
EDI provides a skill score in the range [−1, 1]: 1 is for perfect forecasts, 0 is for random forecasts. It is >0 for forecasts that have hit rates that converge to 0, and slower than those of random forecasts, and can be negative in the opposite situation. Therefore, the system beats a random forecast for values >0 and could be considered skillful as in our case [64].
References
- Food and Agriculture Organization of the United Nations (FAO). Fire Management—Global Assessment 2006. A Thematic Study Prepared in the Framework of the Global Forest Resources Assessment 2005; FAO Forestry Paper 151; FAO: Rome, Italy; Available online: https://www.fao.org/3/a0969e/a0969e00.htm (accessed on 1 November 2021).
- Neary, D.G.; Ryan, K.C.; DeBano, L.F. Wildland Fire in Ecosystems: Effects of Fire on Soils and Water; General Technical Report RMRS-GTR-42; Department of Agriculture, Forest Service, Rocky Mountain Research Station: Ogden, UT, USA, 2005; Volume 4, p. 250. [CrossRef] [Green Version]
- Jhariya, M.K.; Raj, A.K. Effects of wildfires on flora, fauna and physico-chemical properties of soil—An overview. J. Appl. Nat. Sci. 2014, 6, 887–897. Available online: https://core.ac.uk/download/pdf/158352765.pdf (accessed on 1 November 2021).
- Vaks, A.; Mason, A.J.; Breitenbach, S.F.M.; Kononov, A.M.; Osinzev, A.V.; Rosensaft, M.; Borshevsky, A.; Gutareva, O.S.; Henderson, G.M. Palaeoclimate evidence of vulnerable permafrost during times of low sea ice. Nature 2020, 577, 221–225. [Google Scholar] [CrossRef] [PubMed]
- Greenpeace. Massive Forest Fires in Siberia Is a Climate Emergency. Available online: https://www.greenpeace.org/international/press-release/23660/massive-forest-fires-in-siberia-is-a-climate-emergency/ (accessed on 26 March 2020).
- CareOurEarth (COE). Over 37.2 Million Hectares Scorched By Wildfires Around the World in 2019. Available online: https://www.careourearth.com/over-37-million-hectares-scorched-by-wildfires-around-the-world-in-2019/ (accessed on 25 March 2020).
- Bishop, J. Burnt Assets: The 2019–2020 Australian Bushfires; WWF: Sydney, Australia, 2020; p. 34. [Google Scholar]
- Hughes, L.; Steffen, W.; Mullins, G.; Dean, A.; Weisbrot, E.; Rice, M. Summer of Crisis; Climate Council of Australia Limited: Potts Point, Australia, 2020; p. 34. [Google Scholar]
- Richards, L.; Brew, N.; Smith, L. 2019–20 Australian Bushfires—Frequently Asked Questions: A Quick Guide; Research Paper Series, 2019–2020; Parliament of Australia, Department of Parliamentary Services: Canberra, Australia, 2020; p. 12.
- Academy of Australian Science (AAS). The Australian Bushfires—Why They Are Unprecedented. Available online: www.science.org.au/news-and-events/news-and-media-releases/australian-bushfires-why-they-are-unprecedented (accessed on 20 March 2020).
- Maretti, C.C.; Riveros, S.J.C.; Hofstede, R.; Oliveira, D.; Charity, S.; Granizo, T.; Alvarez, C.; Valdujo, P.; Thompson, C. State of the Amazon: Ecological Representation in Protected Areas and Indigenous Territories; WWF Living Amazon (Global) Initiative: Brasilia, Brazil; Quito, Ecuador, 2014; p. 82. [Google Scholar]
- Food and Agriculture Organization of the United Nations (FAO). Global Forest Resources Assessment 2015; FAO: Rome, Italy; Available online: https://www.fao.org/forest-resources-assessment/past-assessments/fra-2015/en/ (accessed on 1 November 2021).
- Lizundia-Loiola, J.; Pettinari, M.L.; Chuvieco, E. Temporal Anomalies in Burned Area Trends: Satellite Estimations of the Amazonian 2019 Fire Crisis. Remote Sens. 2020, 12, 151. [Google Scholar] [CrossRef] [Green Version]
- Wooster, M.J.; Roberts, G.J.; Giglio, L.; Roy, D.; Freeborn, P.; Boschetti, L.; Justice, C.; Ichoku, C.; Schroeder, W.; Davies, D.; et al. Satellite remote sensing of active fires: History and current status, applications and future requirements. Remote Sens. Environ. 2021, 267, 112694. [Google Scholar] [CrossRef]
- Filizzola, C.; Corrado, R.; Marchese, F.; Mazzeo, G.; Paciello, R.; Pergola, N.; Tramutoli, V. RST-FIRES, an exportable algorithm for early-fire detection and monitoring: Description, implementation, and field validation in the case of the MSG-SEVIRI sensor. Remote Sens. Environ. 2017, 192, e2–e25. [Google Scholar] [CrossRef]
- Zhou, W.; Zhou, Y.; Wang, S.; Zhao, Q. Early warning for grassland fire danger in North China using remote sensing. In Proceedings of the International Geoscience and Remote Sensing Symposium (IGARSS03), Toulouse, France, 21–25 July 2003; pp. 2505–2507. Available online: https://ieeexplore.ieee.org/stamp/stamp.jsp?arnumber=1294373 (accessed on 1 November 2021).
- Leblon, B. Monitoring Forest Fire Danger with Remote Sensing. Nat Hazards 2005, 35, 343–359. [Google Scholar] [CrossRef]
- Gillespie, T.W.; Chu, J.; Frankenberg, E.; Thomas, D. Assessment and prediction of natural hazards from satellite imagery. Prog. Phys. Geogr. 2007, 31, 459–470. [Google Scholar] [CrossRef] [PubMed] [Green Version]
- San Miguel-Ayanz, J.; Carlson, J.D.; Alexander, M.; Tolhurst, K.; Morgan, G.; Sneeuwjagt, R.; Dudley, M. Current Methods to Assess Fire Danger Potential. In Wildland Fire Danger Estimation and Mapping. The Role of Remote Sensing Data; Chuvieco, E., Ed.; World Scientific Publishing: Singapore, 2003; pp. 21–61. [Google Scholar]
- Chowdhury, E.H.; Hassan, Q.K. Operational perspective of remote sensing-based forest fire danger forecasting systems. ISPRS J. Photogramm. Remote Sens. 2015, 104, 224–236. [Google Scholar] [CrossRef]
- Chuvieco, E. Wildland Fire Danger Estimation and Mapping: The Role of Remote Sensing; World Scientific Publishing: Singapore, 2003; Volume 4, p. 280. [Google Scholar] [CrossRef]
- Keane, R.E.; Mincemoyer, S.E.; Schmidt, K.M.; Long, D.G.; Garner, J.L. Mapping Vegetation and Fuels for Fire Management on the Gila National Forest Complex; General Technical Report RMRS-GTR-46-CD; USDA Forest Service, Rocky Mountain Research Station: Ogden, UT, USA, 2000. [CrossRef] [Green Version]
- Riaño, D.; Chuvieco, E.; Salas, J.; Palacios-Orueta, A.; Bastarrika, A. Generation of fuel type maps from Landsat TM images and ancillary data in Mediterranean ecosystems. Can. J. For. Res. 2002, 32, 1301–1315. [Google Scholar] [CrossRef]
- European Forest Fire Information System EFFIS. Available online: https://effis.jrc.ec.europa.eu/ (accessed on 1 November 2021).
- Queimadas Instituto Nacional de Pesquisas Espaciais (INPE). Available online: https://queimadas.dgi.inpe.br/queimadas/portal (accessed on 1 November 2021).
- McFerren, G.; Frost, P. The Southern African advanced fire information system. In Proceedings of the 6th International Information Systems for Crisis Response and Management (ISCRAM) Conference, Gothenburg, Sweden, 10–13 May 2009; pp. 1–6. [Google Scholar]
- AFIS Map Viewer. Available online: https://viewer.afis.co.za/map/ (accessed on 1 November 2021).
- Kumar, S.; Chaudhary, C.; Biswas, T.; Ghosh, S.; Ashutosh, S. Identification of Fire Prone Forest Areas Based on GIS Analysis of Archived Forest Fire Points Detected in the Last Thirteen Years; Technical information series; Forest Survey of India. Ministry of Environment, Forest & Climate Change, Government of India: Dehradun, India, 2019; Volume 1. Available online: http://www.indiaenvironmentportal.org.in/files/file/technical-information-series.pdf (accessed on 1 November 2021).
- FSI Fire Alert System (FAST), Version 3.0. Available online: http://fsiforestfire.gov.in/ (accessed on 1 November 2021).
- Barbosa, M.R.; Sícoli Seoane, J.C.; Guimarães Buratto, M.; Santana de Oliveira Dias, L.; Carvalho Raivel, J.P.; Lobos Martins, F. Forest Fire Alert System: A Geo Web GIS prioritization model considering land susceptibility and hotspots—A case study in the Carajás National Forest, Brazilian Amazon. Int. J. Geogr. Inf. Syst. 2010, 24, 873–901. [Google Scholar] [CrossRef]
- Bugalho, L.; Pessanha, L. The forest fire risk index (ICRIF) operational processing and validation. In Proceedings of the 4th International Wildland Fire Conference, Seville, Spain, 13–17 May 2007; Available online: http://citeseerx.ist.psu.edu/viewdoc/download?doi=10.1.1.587.8123&rep=rep1&type=pdf (accessed on 1 November 2021).
- Stocks, B.J.; Lawson, B.D.; Alexander, M.E.; Van Wagner, C.E.; McAlpine, R.S.; Lynham, T.J.; Dube, D.E. The Canadian Forest Fire Danger Rating System: An Overview. For. Chron. 1989, 65, 450–457. [Google Scholar] [CrossRef]
- Sharples, J.J.; McRae, R.H.D.; Weber, R.O.; Gill, A.M. A simple index for assessing fire danger rating. Environ. Model. Softw. 2009, 24, 764–774. [Google Scholar] [CrossRef]
- Bertani, R.; Blasi, C.; Biondi, E.; Bovio, G.; Camia, A.; Capogna, F.; Corona, P.; Cullotta, S.; Esposito, A.; Fabiani, M.L.; et al. Incendi E Complessità Ecosistemica—Dalla Pianificazione Forestale Al Recupero Ambientale; Blasi, C., Bovio, G., Corona, P., Marchetti, M., Maturani, A., Eds.; Ministero dell’Ambiente e Tutela del Territorio: Italia, Rome; Società Botanica Italianal: Florence, Italy, 2004; p. 353. Available online: https://www.mite.gov.it/sites/default/files/archivio/allegati/aib/incendi_e_complessita_ecosistemica.pdf (accessed on 1 November 2021).
- San-Miguel-Ayanz, J.; Durrant, T.; Boca, R.; Maianti, P.; Libertá, G.; Artés-Vivancos, T.; Oom, D.; Branco, A.; de Rigo, D.; Ferrari, D.; et al. Forest Fire in Europe, Middle East and North Africa 2019; EUR30402 EN; JRC122115; Publications Office of the European Union: Luxembourg, 2020. [Google Scholar] [CrossRef]
- Marchese, F.; Mazzeo, G.; Filizzola, C.; Coviello, I.; Falconieri, A.; Lacava, T.; Paciello, R.; Pergola, N.; Tramutoli, V. Issues and Possible Improvements in Winter Fires Detection by Satellite Radiances Analysis: Lesson Learned in Two Regions of Northern Italy. IEEE J. Sel. Top. Appl. Earth Obs. Remote Sens. 2017, 10, 3297–3313. [Google Scholar] [CrossRef]
- The European Organisation for the Exploitation of Meteorological Satellites (EUMETSAT). Normalised Difference Vegetation Index: Product Guide; Doc. No. EUM/TSS/USR/14/770105, v1A e-signed; EUMETSAT: Darmstadt, Germany, 2015; Available online: https://www-cdn.eumetsat.int/files/2020-04/pdf_ndvi_pg.pdf (accessed on 1 November 2021).
- Smets, B.; Jacobs, T.; Swinnen, E.; Toté, C.; Wolfs, D. Gio Global Land Component—Lot I: ”Operation of the Global Land Component”, Framework Service Contract N° 388533 (JRC), 30/01/2018, issue I2.31. Product User Manual: Normalized Difference Vegetation Index (NDVI)—Collection 1 km, version 2.2. Available online: https://land.copernicus.eu/global/sites/cgls.vito.be/files/products/GIOGL1_PUM_NDVI1km-V2.2_I2.31.pdf (accessed on 1 November 2021).
- Marsigli, C.; Boccanera, F.; Montani, A.; Paccagnella, T. The COSMO-LEPS mesoscale ensemble system: Validation of the methodology and verification. Nonlinear Process. Geophys. 2005, 12, 527–536. [Google Scholar] [CrossRef] [Green Version]
- Mazzeo, G.; Marchese, F.; Filizzola, C.; Pergola, N.; Tramutoli, V. A Multi-Temporal Robust Satellite Technique (RST) for Forest Fire Detection. In Proceedings of the 2007 International Workshop on the Analysis of Multi-temporal Remote Sensing Images, Leuven, Belgium, 18–20 July 2007. [Google Scholar] [CrossRef]
- Baldassarre, G.; Benigno, G.; Corrado, R.; Coviello, I.; Filizzola, C.; Lacava, T.; Marchese, F.; Mazzeo, G.; Paciello, R.; Pergola, N.; et al. Assessment of the Robust Satellite Technique (RST) in Real Time Detection of Summer Fires. In Proceedings of the Fifth International Workshop on the Analysis of Multitemporal Remote Sensing Images, Groton, CT, USA, 28–30 July 2009; Civco, D.L., Ed.; pp. 216–223. [Google Scholar]
- Mazzeo, G.; Baldassarre, G.; Corrado, R.; Filizzola, C.; Genzano, N.; Marchese, F.; Paciello, R.; Pergola, N.; Tramutoli, V. Assessment of a Robust Satellite Technique for Forest Fire Detection and Monitoring by Using a Total Validation Approach. In Proceedings of the 33rd International Symposium on Remote Sensing of Environment (ISRSE33), Stresa, Italy, 4–8 May 2009; pp. 607–610. [Google Scholar]
- Filizzola, C.; Baldassarre, G.; Benigno, G.; Corrado, R.; Coviello, I.; Lacava, T.; Marchese, F.; Mazzeo, G.; Paciello, R.; Pergola, N.; et al. Automatic RST-Based System for a Rapid Detection of Fires. In Proceedings of the VI International Conference on Forest Fire Research (ICFFR), Coimbra, Portugal, 15–18 November 2010; Viegas, D.X., Ed.; Available online: http://www.researchgate.net/profile/Francesco_Marchese2/publication/234055644_Automatic_RST-based_system_for_a_rapid_detection_of_fires/links/54818e200cf22525dcb621a5.pdf (accessed on 1 November 2021).
- Marchese, F.; Corrado, R.; Filizzola, C.; Mazzeo, G.; Paciello, R.; Pergola, N.; Tramutoli, V. On the Potential of Robust Satellite Techniques (RST-FIRES) for Forest Fire Detection and Monitoring. In Proceedings of the VI International Conference on Forest Fire Research (ICFFR), Coimbra, Portugal, 15–18 November 2010; Viegas, D.X., Ed.; Available online: https://www.researchgate.net/publication/234055645_On_the_potential_of_Robust_Satellite_Techniques_RST-FIRES_for_forest_fire_detection_and_monitoring.pdf (accessed on 1 November 2021).
- Tramutoli, V. Robust AVHRR Techniques (RAT) for environmental monitoring: Theory and applications. In Proceedings of the SPIE 3496, Earth Surface Remote Sensing II, Barcelona, Spain, 11 December 1998; pp. 101–113. [Google Scholar] [CrossRef]
- Tramutoli, V. Robust Satellite Techniques (RST) for natural and environmental hazards monitoring and mitigation: Ten years of successful applications. In Proceedings of the 9th International Symposium on Physical Measurements and Signatures in Remote Sensing XXXVI (7/W20), Beijing, China, 17–19 October 2005; pp. 792–795. [Google Scholar]
- Tramutoli, V. Robust Satellite Techniques (RST) for natural and environmental hazards monitoring and mitigation: Theory and applications. In Proceedings of the 2007 International Workshop on the Analysis of Multi-Temporal Remote Sensing Images, Leuven, Belgium, 18–20 July 2007. [Google Scholar] [CrossRef]
- Marzano, R.; Bovio, G.; Guglielmet, E.; Jappiot, M.; Lampin, C.; Dauriac, F.; Deshayes, M.; Salas, J.; Aguado, I.; Martínez, J.; et al. Common Methods for Mapping the Wildland Fire Danger; EUFIRELAB: Euro-Mediterranean Wildland Fire Laboratory, a “wall-less” Laboratory for Wildland Fire Sciences and Technologies in the Euro-Mediterranean Region. Deliverable D-08-05; HAL Inrea: Bangalore, India, 2004. [Google Scholar]
- San-Miguel-Ayanz, J.; Durrant, T.; Boca, R.; Maianti, P.; Libertá, G.; Artés-Vivancos, T.; Oom, D.; Branco, A.; de Rigo, D.; Ferrari, D.; et al. Forest Fires in Europe, Middle East and North Africa 2020; EUR 30862 EN; JRC126766; Publications Office of the European Union: Luxembourg, 2021. [Google Scholar] [CrossRef]
- Toscana Notizie. DIRETTA–Incendi in Garfagnana e sui Monti Pisani. Available online: https://www.toscana-notizie.it/-/diretta-incendi-in-garfagnana-e-sui-monti-pisani (accessed on 1 November 2021).
- Pisa Today. Incendio sul Serra: Il Monte Brucia Ancora. Available online: https://www.pisatoday.it/cronaca/incendio-monte-serra-vicopiano-25-febbraio-2019.html (accessed on 1 November 2021).
- SerchioinDiretta.it. Vasto Rogo nei Boschi di Careggine. Available online: https://www.serchioindiretta.it/garfagnana/2019/02/24/vasto-rogo-nei-boschi-di-careggine/90933/ (accessed on 1 November 2021).
- Il Tirreno—Lucca. Grosso Incendio tra Castelnuovo e Careggine. Available online: https://iltirreno.gelocal.it/lucca/cronaca/2019/02/24/news/grosso-incendio-tra-castelnuovo-e-careggine-1.30039154 (accessed on 1 November 2021).
- La Gazzetta della Spezia. Sesta Godano, Bruciano oltre 5 Ettari di Bosco. Available online: https://www.gazzettadellaspezia.it/cronaca/item/94766-sesta-godano-bruciano-oltre-5-ettari-di-bosco (accessed on 1 November 2021).
- Copernicus Climate Change Service. Summer 2020 Heatwaves. Available online: https://climate.copernicus.eu/sites/default/files/inline-images/C3S_ESOTC20_heatwaves_Fig1_branded.png (accessed on 14 December 2021).
- Centro Funzionale Protezione Civile Abruzzo. Fire Susceptibility for 31 July 2020. Available online: http://allarmeteo.regione.abruzzo.it/segnalazioni/7230/previsione-incendi-per-il-giorno-31-luglio-2020 (accessed on 14 December 2021).
- Protezione Civile Regione Sicilia. Fire and Heatwave Warning for 31 July 2020. Available online: https://www.protezionecivilesicilia.it/tinymce/js/tinymce/source/Rischio%20Incendi%20e%20Ondate%20di%20calore/Avviso%20Rischio%20Incendi%20e%20Ondate%20di%20calore%20n.%20150%20del%2030.07.2020.pdf (accessed on 14 December 2021).
- Il Centro. Incendio Devasta Oltre 100 Ettari di Pineta. Available online: https://www.ilcentro.it/l-aquila/incendio-devasta-oltre-100-ettari-di-pineta-1.2473224 (accessed on 14 December 2021).
- La Repubblica. Palermo, Incendio sulla Montagna di Petralia Sottana: Fiamme Alimentate dallo Scirocco. Available online: https://palermo.repubblica.it/cronaca/2020/07/31/foto/palermo_incendio_sulla_montagna_di_petralia_sottana_fiamme_alimentate_dallo_scirocco-263360078/1/ (accessed on 14 December 2021).
- European Union. Decision (EU) 2019/420 of the European Parliament and of the Council of 13 March 2019, amending Decision No 1313/2013/EU on a Union Civil Protection Mechanism. Off. J. Eur. Union L 77I 2019, 62, 1–15. Available online: https://eur-lex.europa.eu/legal-content/EN/TXT/PDF/?uri=CELEX:32019D0420&from=EN (accessed on 1 November 2021).
- European Commission. Communication from the Commission to the European Parliament, the European Council, the Council, the European Economic and Social Committee and the Committee of the Regions; COM (2019) 640 Final, The European Green Deal; European Commission: Brussels, Belgium, 2019; Available online: https://eur-lex.europa.eu/resource.html?uri=cellar:b828d165-1c22-11ea-8c1f-01aa75ed71a1.0002.02/DOC_1&format=PDF (accessed on 1 November 2021).
- Coles, S.; Heffernan, J.; Tawn, J. Dependence measures for extreme value analyses. Extremes 1999, 2, 339–365. [Google Scholar] [CrossRef]
- Ferro, C.A.; Stephenson, D.B. Extremal dependence indices: Improved verification measures for deterministic forecasts of rare binary events. Weather Forecast. 2011, 26, 699–713. [Google Scholar] [CrossRef] [Green Version]
- Di Giuseppe, F.; Pappenberger, F.; Wetterhall, F.; Krzeminski, B.; Camia, A.; Libertá, G.; San Miguel, J. The Potential Predictability of Fire Danger Provided by Numerical Weather Prediction. J. Appl. Meteorol. Climatol. 2016, 55, 2469–2491. Available online: https://journals.ametsoc.org/view/journals/apme/55/11/jamc-d-15-0297.1.xml (accessed on 1 November 2021).
- Stephenson, D.; Casati, B.; Ferro, C.; Wilson, C. The extreme dependency score: A non-vanishing measure for forecasts of rare events. Meteorol. Appl. 2008, 15, 41–50. [Google Scholar] [CrossRef]


Publisher’s Note: MDPI stays neutral with regard to jurisdictional claims in published maps and institutional affiliations. |
© 2022 by the authors. Licensee MDPI, Basel, Switzerland. This article is an open access article distributed under the terms and conditions of the Creative Commons Attribution (CC BY) license (https://creativecommons.org/licenses/by/4.0/).