Abstract
L-band passive microwave remote sensing (RS) is an important tool for monitoring global soil moisture (SM) and freeze/thaw state. In recent years, progress has been made in its in-depth application and development in the Tibetan Plateau (TP) which has a complex natural environment. This paper systematically reviews and summarizes the research progress and the main applications of L-band passive microwave RS observations and associated SM retrievals on the TP. The progress of observing and simulating L-band emission based on ground-, aircraft-based and spaceborne platforms, developing regional-scale SM observation networks, as well as validating satellite-based SM products and developing SM retrieval algorithms are reviewed. On this basis, current problems of L-band emission simulation and SM retrieval on the TP are outlined, such as the fact that current evaluations of SM products are limited to a short-term period, and evaluation and improvement of the forward land emission model and SM retrieval algorithm are limited to the site or grid scale. Accordingly, relevant suggestions and prospects for addressing the abovementioned existing problems are finally put forward. For future work, we suggest (i) sorting out the in situ observations and conducting long-term trend evaluation and analysis of current L-band SM products, (ii) extending current progress made at the site/grid scale to improve the L-band emission simulation and SM retrieval algorithms and products for both frozen and thawed ground at the plateau scale, and (iii) enhancing the application of L-band satellite-based SM products on the TP by implementing methods such as data assimilation to improve the understanding of plateau-scale water cycle and energy balance.
1. Introduction
As an essential climate variable, soil moisture (SM) is an important state variable for quantifying water, energy, and carbon exchange processes in the soil–vegetation–atmosphere system [1,2,3,4]. It plays an important role in regulating processes such as the partitioning of surface sensible and latent heat flux, surface water budget, and vegetation transpiration [5,6,7,8]. This further affects the dynamical and thermal processes in the planetary boundary layer, which in turn impacts the atmospheric state and climate change [9]. SM is also an important factor affecting the growth of vegetation and an important indicator of crop drought, and the effective monitoring of SM can help to accurately implement irrigation measures on farmland [10,11,12]. Due to its important role in the whole Earth system, SM information is important for a wide range of applications, including climatic modeling, hydrologic modeling, and agriculture growth and drought monitoring. Therefore, effective and large-scale monitoring of SM is important for accurate forecasting of weather and guidance of farming-related measures in the agricultural sector.
The Tibetan Plateau (TP), known as the Third Pole of the World, is one of the most sensitive areas to global climate change due to its special topographic and climatic characteristics. The thermal and dynamic effects of the TP have a very important impact on regulating the weather and climate around the plateau, in Asia, and in the Northern Hemisphere [13]. The TP is also known as the Water Tower of Asia, where the Yellow River, Yangtze River, and Lancang River originate, and its water retention capacity is inextricably linked to the maintenance of ecosystems around the plateau and in Asia. SM, as an important component of the water cycle, is important for understanding and studying the water cycle on the TP [6,7,8]. In addition, the TP is a typical alpine region with extensive permafrost distribution, and the coexistence of ice and unfrozen water in permafrost can greatly change the soil’s hydraulic and thermal properties, thus affecting the regional water and heat exchange and runoff processes [14,15]. Therefore, monitoring SM and freeze–thaw changes on the TP is of great significance for the in-depth understanding of the plateau moisture cycle and energy balance processes.
A ground-based observation network consisting of multiple SM observation sites can provide accurate and long-term SM observations, but its spatial representativeness is limited. At present, several regional-scale SM observation networks have been built on the TP [16,17,18]. However, due to the complex climate and topographic characteristics of the TP, the SM presents strong spatial heterogeneity, and the regional scale observation networks are insufficient to completely characterize the spatial and temporal distribution of SM across the whole TP.
Since the 1970s, the development of satellite observation technology has provided a new way to monitor SM on a large scale. At present, the technologies commonly used for SM monitoring include visible optical satellites, thermal infrared satellites, and microwave satellites. Research shows that the visible optical remote sensing (RS) and the thermal infrared RS are more frequently influenced by the atmosphere, clouds, and vegetation when retrieving the SM, and the detection depth is only within a few millimeters of the surface soil. On the contrary, the microwave RS not only has the advantage of all-weather and all-day observation capacity but also shows a stronger penetration ability to clouds, rain, snow, and vegetation, which is thus more sensitive to the SM dynamics. Therefore, microwave RS is often treated as the more suitable method to monitor large-scale and long-term SM variations [19,20].
The commonly used microwave RS bands include L-(1–2 GHz), C-(4–8 GHz), and X-band (8–12 GHz). Compared to the C- and X-band, the L-band has a longer wavelength and stronger penetration ability that is more sensitive to SM changes. Therefore, the L-band is usually considered the best band for monitoring global surface SM [20]. In recent years, several L-band microwave RS satellites have been launched worldwide, such as the Soil Moisture and Ocean Salinity (SMOS) satellite of the European Space Agency (ESA) [21], as well as NASA’s Aquarius satellite [22] and Soil Moisture Active Passive (SMAP) satellite [23]. In addition, the Global Water Cycle Observation (WCOM) satellite program proposed by Chinese scientists [24] will be expected to achieve continuous observation of L-band microwave RS and to provide higher accuracy and long time series of SM and freeze/thaw state datasets.
Based on satellite observations, researchers around the world have developed a series of L-band microwave emission models and SM retrieval algorithms, which have gone through the process from ground-based validation of theoretical models/algorithms to calibration and validation of satellite observations to global operational monitoring of SM [20]. For the validation of L-band microwave RS observations and products, numerous ground-based and airborne experiments have been conducted in a variety of land conditions and climatic regions around the world, such as the MELBEX III experiment at a Vineyard site in Valencia, Spain [25], the SMOS airborne validation experiment in the Jehol and Erfurt river basins, Germany [26], and the SMAPEx [27] and SMAPVEX15 [28] experiments in Australia and the United States, respectively, which have contributed to the evaluation and improvement of SMOS and SMAP satellite products [20]. Similar experiments have been conducted in China, such as the Heihe Watershed Allied Telemetry Experimental Research (HiWATER) [29] in the Heihe River basins and the L-band SM active-passive thematic experiment in the Luan River basins [30]. In addition, the SMAP satellite team has selected several ground-based core validation networks in various vegetation types and climate regions across the world to calibrate and validate the performance of its products, including the Maqu SM observation network located on the TP [31].
Complex topographic characteristics, the extensive distribution of lakes, the existence of frozen ground with distinct seasonal freeze–thaw transitions, and the lack of accurate soil data have posed many challenges to SM retrievals on the TP. In addition, the impact of Radio Frequency Interference (RFI), topographic relief, and field of view blending has led to the poor quality of satellite observations such as SMOS [32]. To further improve SMOS and SMAP satellite products, Zheng et al. [33] set up an L-band microwave radiometer, i.e., ELBARA-III, in the Maqu SM observation network, which has collected more than five years of consecutive ground-based bright temperature () observations up to now [34,35]. Currently, many studies have been conducted to evaluate L-band satellite-based SM products and retrieval algorithms based on several SM observation networks on the TP. For example, Dente et al. [36] and Chen et al. [37] evaluated the applicability of SMOS and SMAP SM products on the TP, respectively. Zheng et al. [38,39] evaluated and improved the vegetation and surface roughness parameterizations implemented in the current SMAP SM retrieval algorithm and developed a new algorithm for retrieving unfrozen (liquid) water content in the frozen ground. These research efforts related to product validation and algorithm improvement have further promoted the development of L-band microwave RS and the application of L-band satellite products on the TP.
This paper systematically reviews and summarizes the research progress and main applications of L-band passive microwave RS and associated SM retrieval algorithms and products on the TP in recent years. On this basis, the current problems of L-band emission simulation and SM retrieval on the TP are outlined, and relevant suggestions and prospects for addressing the existing problems are finally put forward. Section 2 introduces the study area. In Section 3, we introduce the airborne and ground-based L-band microwave passive RS experiments carried out on the TP and the preliminary validation of satellite-based L-band observations and summarize the research progress in simulating microwave emission on the TP; Section 4 presents the existing SM observation networks on the TP and summarizes the research progress of evaluation and improvement of SM products and retrieval algorithms based on the L-band microwave RS on the TP. On this basis, Section 5 summarizes the main problems of SM retrieval research on the TP and provides related outlooks.
2. Study Area
Known as the Third Pole of the World, the TP is the highest plateau in the world, with an average elevation of over 4000 m. The mountain ranges of the TP extend across Afghanistan, Pakistan, India, China, Bhutan, Myanmar, and Nepal, and more than 4,000,000 km2 is mainly composed of high-elevation rugged terrain. It is generally high in the northwest and low in the southeast. Grasslands are widely distributed and dominate the vegetation type on the TP. The climate is humid in the southeast and arid in the northwest. In addition, the TP has strong solar insolation and sufficient sunshine, but the overall temperature is low, and the diurnal amplitude of temperature is large. The TP is often regarded as the Asian water tower since more than 10 of the largest rivers in Asia originate from this region, including the Yellow River, the Yangtze River, the Mekong river, the Brahmaputra river, and the Indus river, providing freshwater supply for more than a fifth of the world’s population.
3. Progress of L-Band Microwave Emission Observation and Simulation on the TP
In recent years, researchers have validated the satellite observations using L-band observations collected from airborne and ground-based platforms on the TP and have conducted studies related to L-band emission simulation. This section will introduce in detail L-band microwave observation experiments on the TP, including airborne and ground-based experiments and evaluation of satellite observations, and summarize the current forward land emission model adopted by the L-band satellite missions and their applications and improvements in the TP.
3.1. L-Band Microwave Emission Observation
3.1.1. Airborne and Ground-Based Observation Experiments Conducted in the TP
In order to promote observational studies of L-band microwave emission on the TP, airborne and ground-based experiments were carried out in the Heihe River Basin in the northeastern part of the TP and the Maqu area in the southeastern part of the Yellow River source region, respectively [29,33]. In order to improve the observation capability of hydrological and ecological processes at the watershed scale and to establish a leading watershed observation system around the world, an ecohydrological remote sensing experiment, i.e., Heihe Watershed Allied Telemetry Experimental Research (HiWATER), was carried out via combining ground-based, airborne remote sensing, and satellite observation methods [29,40]. Among them, in order to develop passive microwave RS-based SM retrieval products at the watershed scale, several airborne PLMR (Polarimetric L-band Multibeam Radiometer) radiometer-based observations were carried out from 29 June to 2 August 2012 to collect multi-angle dual-polarized data in the middle and upper regions of the Heihe River basin. The flight altitude of the airborne experiment was 0.3–3 km, corresponding to a ground resolution of 0.1–1 km, and the incidence angles of the radiometer were ±7°, ±21.5°, and ±38.5°, respectively, with a center frequency of 1.41 GHz.
To validate the SMOS and SMAP satellite observations and develop microwave emission models as well as SM retrieval algorithms, Zheng et al. [33] deployed an L-band microwave radiometer (i.e., ELBARA-III) in the Maqu SM observation network at the beginning of 2016. The radiometer was mounted on a 4.8 m height tower with the antenna centered at approximately 6.5 m above the ground, and the antenna beam was generally oriented to the south. The observations at both horizontal () and vertical () polarizations were collected every 30 min in steps of 5° from 40° to 70° scanning angles [33,35]. Micro-meteorological observations were also set up near the radiometer to measure a variety of micro-meteorological elements. In late 2016, a rain gauge and an eddy covariance observation system were installed near the radiometer. In addition, vertical SM profile observation probes were added in August 2016 to automatically collect SM observations at 20 soil depths ranging from 2.5 to 100 cm every 15 min [35]. Based on the ELBARA-III microwave radiometer observations, Zheng et al. [33,34,35,41] conducted several studies on the L-band microwave passive RS of soil freeze–thaw transitions, including the development of a microwave emission model for frozen ground, a new retrieval algorithm for retrieving unfrozen (liquid) soil water content in frozen ground, and a new finding that the sampling depth of L-band microwave radiometry is about 2.5 cm for both frozen and thawed soil conditions.
3.1.2. Satellite Observations and Accuracy Assessment
After a long period of development, three satellites carrying L-band microwave radiometers were successfully launched worldwide, including ESA’s SMOS, NASA’s Aquarius, and SMAP. The main information about these three satellites is shown in Table 1.

Table 1.
Basic information of SMOS, Aquarius, and SMAP satellites.
The SMOS satellite is the world’s first L-band passive microwave RS satellite, and one of its main objectives is to provide global surface SM products with an accuracy of about 0.04 m3 m−3 [21,42]. The SMOS satellite carries an L-band microwave radiometer (1.41 GHz) in a sun-synchronous orbit at a mean altitude of 757 km, providing ascending and descending data corresponding to passages through the equator at 6:00 and 18:00 of local solar time, respectively. The microwave radiometer uses a Y-shaped antenna that provides observations at incidence angles of 0–55°. SM is retrieved using multi-angular and dual-polarization SMOS observations via inverting the L-MEB model in combination with an iterative inversion algorithm [42].
The Aquarius/SAC-D is an ocean observation satellite mission aiming to provide data such as monthly ocean surface salinity for the study of ocean circulation, coupling between global water cycle and climate, and others [22,43]. The observation system consists of three dual-polarized L-band radiometers (1.41 GHz) and one fully polarized L-band scatterometer (1.26 GHz). The orbit of the Aquarius is a sun-synchronous orbit at 657 km, which passes the equator at 6:00 (descending orbit) and 18:00 (ascending orbit) local solar time and covers the globe every 7 days. The Aquarius mission was terminated on 8 June 2015 due to a failure of the power supply and altitude control system. SM is retrieved using Aquarius observations at the horizontal polarization using the single channel retrieval algorithm [43].
The SMAP satellite aims to provide high precision and high resolution of SM and freeze/thaw state data on a global scale [23,44]. It carries an L-band microwave radiometer (1.41 GHz) and a synthetic aperture radar (SAR) (1.26 GHz) to obtain simultaneous measurements of and backscatter coefficients. The SMAP satellite orbit is in a sun-synchronous orbit at 685 km and passes through the equator at 6:00 (descending orbit) and 18:00 (ascending orbit) local solar time. On 7 July 2015, the SMAP radar stopped working due to a malfunction, and so far, the SMAP radiometer is still working stably. SM is retrieved using SMAP observations at vertical polarization using the single channel retrieval algorithm [44].
To validate the accuracy of satellite-based L-band observations in the TP, the SMAP and SMOS observations are compared to the in situ ELBARA-III observations in the Maqu SM observation network. Figure 1 show the comparison of SMAP, SMOS, and ELBARA-III observations from August 2016 to July 2017 for the evening overpass. It can be found that the is significantly correlated with soil dryness and wetness and freeze–thaw transitions. For example, the increases during the soil freezing period (November to February) and then decreases as the unfrozen (liquid) soil water increases with soil thawing. As shown in the figure, the variations of SMOS and SMAP observations are generally consistent with the ELBARA-III measured trends, whereby the SMAP observations are more consistent with the ELBARA-III observations. The correlation coefficients between SMAP and ELBARA-III observations are greater than 0.87, and the RMSE and ubRMSE for the observations are smaller than these of . Good performance of SMAP observations was also reported in ref. [39,45]. Compared to the performance of SMAP data, the SMOS data show degraded accuracy and larger fluctuating, which may be related to the influence of RFI and the stability of the radiometer [36]. To further investigate the impact of RFI on the SMOS observation, Figure 2 provide the root-mean-square error (RMSE) computed between the SMOS observations and simulations produced by the CMEM model for both descending and ascending overpasses performed by the authors. From the figure, it can be found that the RMSE for the SMOS observation in the TP is as high as 10–20 K, indicating that the SMOS satellite may be seriously affected by RFI in the TP. A similar finding was also reported by Dente et al. [36].
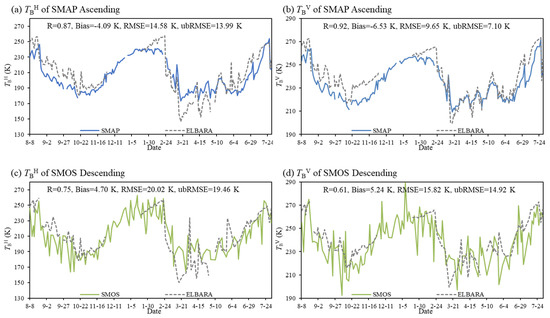
Figure 1.
Time series of SMAP and ELBARA-III measured (a) and (b) , and SMOS and ELBARA-III measured (c) and (d) during the evening overpasses between August 2016 and July 2017. (a,b) are modified from Zheng et al. [39].
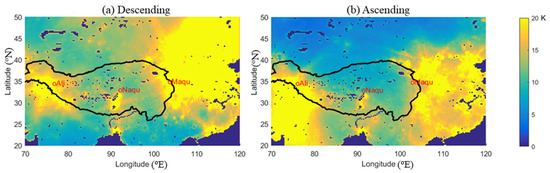
Figure 2.
RMSE computed between the SMOS observations and simulations produced by the CMEM model for both (a) ascending and (b) descending overpasses.
3.2. L-Band Microwave Emission Simulation
3.2.1. Forward Land Emission Model Adopted by Current Satellite Missions
The current three L-band satellite missions, i.e., SMAP, SMOS, and Aquarius, all use the zero-order forward microwave emission model, i.e., τ-ω model, developed by Mo et al. [46] for simulations. generally consists of three components: (1) direct upwelling vegetation emission; (2) downwelling vegetation emission reflected by the soil and attenuated by the canopy layer; (3) upwelling soil emission attenuated by the canopy [38,46]. The model is expressed as follows:
where the superscript p represents the polarization (p = V for vertical polarization and p = H for horizontal polarization), ωp, γp, and τp are the single scattering albedo, transmittance, and optical depth of vegetation, respectively, TC and TG are the effective temperatures of vegetation and soil, respectively, rp is the reflectivity of rough surface, and ψ is the satellite observation angle.
Table 2 summarize the main parameterizations used in the current forward land emission models for SMOS, Aquarius, and SMAP satellite missions, including the simulation of rough surface reflectivity rp, soil permittivity εs, effective soil temperature TG, vegetation temperature TC, single scattering albedo ω, and vegetation optical depth τp. Usually, the vegetation single scattering albedo ω is determined by the specific vegetation type that is independent of the polarization. For instance, ω = 0 for sparse vegetation and ω = 0.06–0.08 for forest in the SMOS mission. For the simulation of vegetation optical depth τp, which is a function of the leaf area index (LAI) in the SMOS mission (see Table 2) [20], whereby the parameters b′ and b″ depend on the structures of the specific vegetation type. For the Aquarius and SMAP missions, the τp is linearly related to the vegetation water content (VWC) [47], whereby the VWC is determined by the normalized vegetation difference index (NDVI) and vegetation type.
The h-Q-N model is adopted by the three satellite missions to simulate the rough surface reflectivity rp as [48,49]:
where and (p = H, V; q = V, H) are the smooth surface reflectivity, which is related to the soil permittivity εs and can be obtained by the Fresnel equation. Parameter h is the roughness height parameter, which is related to the type of land cover, e.g., h = 0.1 for sparsely vegetated subsurface and h = 0.3 for forested subsurface in the SMOS mission. In the Aquarius mission, h is taken as a constant value of 0.1. Parameter Q denotes the polarization mixing factor, which is usually assumed as 0 at L-band. Parameter N represents the angular effect of observation angle, which is introduced to better account for multi-angle and dual-polarization measurements. In the SMOS mission, N is related to the polarization, while it is taken as a constant value of 2 in both Aquarius and SMAP missions.
Various soil dielectric constant models have been developed for passive microwave remote sensing, such as the Dobson model [50], the Wang and Schmugge model [51], and the Mironov model [52]. Currently, the Mironov model [52] is implemented by both SMOS and SMAP satellite missions, and the Wang and Schmugge model is adopted for the Aquarius satellite mission. However, these models are only applicable to unfrozen soil conditions, resulting in the inability of current satellite missions to retrieve the unfrozen (liquid) soil water content under frozen soil conditions [38].
Table 2.
Parameterizations adopted by the SMOS, Aquarius, and SMAP satellite missions for key parameters in the forward land emission model.
Table 2.
Parameterizations adopted by the SMOS, Aquarius, and SMAP satellite missions for key parameters in the forward land emission model.
| Parameters | SMOS (L2 and L3) | Aquarius (L2) | SMAP (L2) |
|---|---|---|---|
| rp | h-Q-N model | ||
| h = 0.1 for sparse vegetation, and h = 0.3 for forest | h = 0.1 | h = f(IGBP) | |
| Q = 0; NV = 0, NH = 2 | Q = 0; Np = 2 | Q = 0; Np = 2 | |
| εs | Mironov model [52] | Wang and Schmugge model [51] | Mironov model [52] |
| εs = f(SM, TG, % clay) | |||
| TG | TG = f(Tsoil_surf, Tsoil_deep) | ||
| CT = (SM/W0)b0 | CT = 0.246 | ||
| TC | Skin temperature from ECMWF land surface model | TC = TG | |
| ω | ω = 0 for sparse vegetation, and ω = 0.06–0.08 for forest | ω = 0.05 | ω = f(IGBP) |
| τp | τp = b′·LAI + b″ | τp = b·VWC, VWC = f(NDVI, IGBP) | |
| b = 0.8 | b = f(IGBP) | ||
The estimation of TG is related to the profile soil temperature, which can be estimated as [53]:
where Tsoil_surf and Tsoil_deep are the soil temperatures at the surface (~5 cm) and deep layers (~50 cm), respectively. Currently, the SMOS satellite mission uses the soil temperature simulations of the first and third soil layers obtained from the land surface model of the European Centre of Medium Range Weather Forecasting (ECMWF) as the Tsoil_surf and Tsoil_deep, and both Aquarius and SMAP missions use the soil temperature simulations of the first and second layers obtained from NASA GEOS-5 (Goddard Earth Observation System Model Version 5) as the Tsoil_surf and Tsoil_deep [20]. In addition, CT is a fitting parameter, which is related to SM and parameters W0 and b0 in the SMOS satellite mission, where the standard values of parameters W0 and b0 are taken as 0.3 m3 m−3 and 0.3, respectively. The value of CT is taken as 0.246 for both Aquarius and SMAP missions [20]. Both Aquarius and SMAP satellite missions assume that the atmosphere, vegetation, and near-surface soil are in thermal equilibrium during the satellite overpasses, then the TC is approximately equal to the TG, while the SMOS mission uses the surface temperature output from the ECMWF land surface model as the TC [20].
3.2.2. Progress of L-Band Microwave Emission Simulation on the TP
In the past few years, researchers have used a combination of airborne, ground-based, and satellite-based L-band microwave observations to evaluate the applicability of the widely used τ-ω model and its parameterizations on the TP. Based on this, new parameterizations for surface roughness, vegetation optical depth, and soil permittivity have been developed specifically for the TP conditions, improving microwave emission simulations across different climatic and land conditions of the TP. Zheng et al. [38,54] used the SMAP observations to evaluate the applicability of the forward land emission model adopted by the SMAP satellite mission to the desert (Ngari SM observation network) and grassland (Maqu SM observation network) conditions. The results showed that the default SMAP land emission model tends to underestimate the effect of surface roughness and overestimate the effect of vegetation, resulting in the underestimation of year-round in the Ngari area. Overestimation of during the warm season and underestimation of
during the cold season in the Maqu area was also found. Based on this, Zheng et al. [38,54] used the surface roughness parameterizations developed by Wigneron et al. [55] to improve the underestimation of in both the Ngari and Magu regions. A new vegetation parameterization based on simulations produced by a discrete microwave radiative transfer model was further developed to reduce the simulation bias in the Maqu region. The newly developed surface roughness and vegetation parameterizations were adopted by Wu et al. [45] to implement the two-stream microwave emission model developed by Schwank et al. [56] to simulate the in the TP. In comparison to the τ-ω model, the two-stream microwave emission model presents comparable simulations, which consider multiple scattering and reflection and remove the assumption of a “soft layer” that is physically more correct than the τ-ω model [45,56]. In addition, Wu and Zheng [57] firstly investigated the impact of surface roughness on multi-angular simulation using the in situ ELBARA-III observations conducted in the Maqu SM observation network. The results showed that the multi-angular simulation could be improved via site-specific calibration of the h-Q-N model, leading to a nonzero value for the parameter Q. As such, the noncoherent emission contribution to cross-polarization mixing can be accounted for by the h-Q-N model. This indicates that consideration of polarization mixing is necessary for L-band simulation [57].
In addition to the currently widely used τ-ω model, researchers have conducted a lot of research on L-band microwave emission simulation on the TP based on the physically based discrete microwave radiative transfer model developed at the Tor Vergata University of Rome (hereafter “Tor Vergata model”) [33,35,41,52,53,54,55,56,57,58]. Wang et al. [58] used the Tor Vergata model to simulate the active and passive observation signals of the Aquarius mission in the Magu SM observation network. They found that the correlation coefficients computed between the simulated and backscatter coefficients produced by the Tor Vergata model and the corresponding Aquarius satellite observations are about 0.86 and 0.68, demonstrating the applicability of the Tor Vergata model in the Magu region. Bai et al. [59] simultaneously simulated the SMAP observed and backscatter coefficients using the calibrated Tor Vergata model considering the sensitive parameters and found that the simulation results of the combined active–passive model are in good agreement with the SMAP observations. For the simulation under frozen soil conditions, Zheng et al. [33] introduced a four-phase dielectric mixing model [60] to the Tor Vergata model. The results showed that the developed model simulates the εs and for both frozen and thawed soil conditions well, extending the application of the Tor Vergata model on the TP. Recently, Zheng et al. [41] used the Tor Vergata model in combination with the four-phase dielectric mixing model to explore the active and passive microwave characteristics of diurnal soil freeze–thaw transitions. The results further confirmed the ability of the improved Tor Vergata model to reproduce diurnal variations of ground-based observed and backscatter coefficients as well as to quantify their relationships at different observation angles and frequencies. To further explore the impact of SM and soil temperature (SMST) profile dynamics on the diurnal L-band observation signatures of frozen soil, an integrated land emission model was developed by Zheng et al. [35]. The model was developed by combining the improved Tor Vergata model with a multilayer soil scattering model developed based on integrating the Wilheit [61] and the advanced integral equation method (AIEM) [62]. The results showed that the Fresnel simulations with a sampling depth of 2.5 cm fit best with the multilayer Wilheit results, indicating that the diurnal L-band observation signatures of frozen soil are mainly dominated by the SMST dynamics at the surface layer. A similar finding was recently reported by Wu et al. [63].
In summary, two distinguishing features can be drawn related to the L-band microwave emission simulation on the TP. One is that the polarization mixing effect should be considered in simulating the L-band observations on the TP. Figure 3 show the angular dependence of averaged ELBARA-III observations and corresponding simulations produced by the h-Q-N model with/without a zero Q value as well as the parameterized model developed by Shi et al. [64] based on the IEM simulations. Overestimations are noted for the simulations produced by the h-Q-N model with a zero Q value and the parameterized model, especially at the vertical polarization, which also becomes larger with increasing incidence angles. The above deficiency is largely addressed by the calibrated h-Q-N model with a nonzero Q value, indicating the necessity to consider the polarization mixing effect in L-band emission modeling on the TP. The other feature is that the diurnal L-band observation signatures of both frozen and thawed soil conditions are primary dominated by the SMST dynamics at the surface layer of around 2.5 cm. Figure 4 show the comparisons between both and simulations produced by the τ-ω model configured either with the multilayer Wilheit [61] model or with the single Fresnel model considering three depths of SMST profile at 2.5 (Sim1), 5 (Sim2) and 10 cm (Sim3) for both warm (from 7 August to 30 September) and cold (from 1 January to 15 March) periods. The Fresnel simulations with input of SMST at 2.5 cm (i.e., Sim1) fit best with the multilayer Wilheit simulations at both polarizations for both periods, indicating that the sampling depth of L-band radiometry is close to 2.5 cm for both frozen and thawed soil conditions on the TP. A similar finding was also reported by Zheng et al. [34].
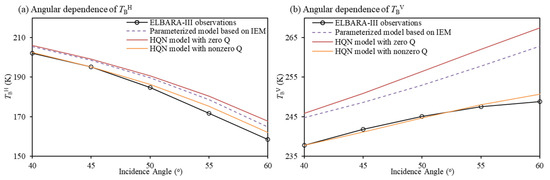
Figure 3.
Angular dependence of ELBARA-III observations and corresponding simulations produced by the h-Q-N model with/without a zero Q value as well as the parameterized model developed by Shi et al. [57] based on the IEM simulations. The figure is modified from Wu and Zheng [57].
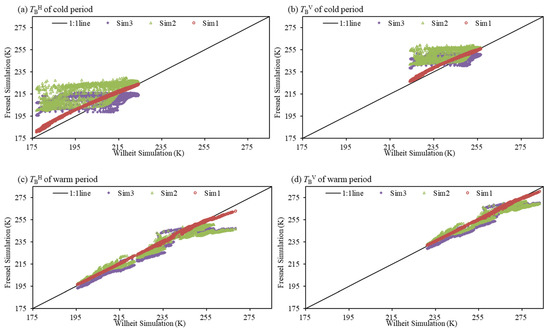
Figure 4.
Comparisons of (a,c) and (b,d) simulations produced by the τ-ω model configured either with the multilayer Wilheit [12] model or with the single Fresnel model considering three depths of SMST profile at 2.5 (Sim1), 5 (Sim2), and 10 cm (Sim3) for (a) cold (from 1 January to 15 March) and (b) warm (from 7 August to 30 September) periods. The figure is modified from Wu [63].
4. Progress of SM Observation and Retrieval Using L-Band Passive Microwave RS on the TP
SM retrieval algorithms for L-band microwave RS show certain errors and limitations for their applications to the TP. In order to obtain higher accuracy of SM products for the TP, further evaluation and improvement of satellite-based SM products and retrieval algorithms are necessary. Among them, in situ data collected by multiple SM observation networks established on the TP are the key basis for the evaluation of L-band SM products and the improvement of retrieval algorithms. In this section, the details of SM observation networks in the TP and the research progress of validating the L-band SM products and improving the corresponding retrieval algorithms are reviewed.
4.1. SM Observation Networks on the TP
Due to the high spatial variability of SM and the large error in using a single station observation to represent the true value of regional-scale SM, several regional-scale SM observation networks have been established on the TP, including the upper Heihe River Basin, Maqu, Naqu, Pali, and Ngari observation networks [16,17,18,40,65,66,67,68] (Figure 5). Dense SM observation stations are distributed within these networks to provide SM data of different soil layers. In addition, by means of soil sampling and laboratory measurements, these observation networks also provide information on soil texture and organic carbon content across the observation stations. Table 3 summarize the basic information of the five SM observation networks on the TP, such as the number of stations deployed, climate type, land cover type, the temporal resolution of observation, and observation depth for each network. A brief description of the five observation networks is provided below.
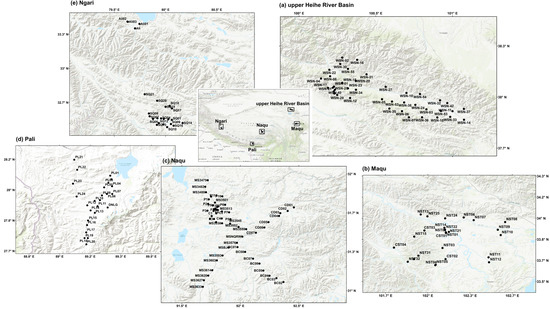
Figure 5.
Locations of (a) upper Heihe River Basin, (b) Maqu, (c) Naqu, (d) Pali, and (e) Ngari SM observations networks and corresponding deployed SM observation stations on the TP.
Table 3.
Basic information of SM observation networks on the TP.
The Heihe River is the second largest inland river in China, and a variety of land cover types such as oasis, desert, and grassland are distributed across the river basin [29]. The upper reaches of the Heihe River basin have an average elevation of 4869 m, which belong to a humid climate with precipitation mainly falling from May to September. The area is widely covered by permafrost and seasonally frozen ground, and the main land cover is alpine meadows [66]. In 2012, 40 wireless SM observation stations were set up within the framework of the HiWATER experiment [29]. At each station, sensors were installed at soil depths of 4, 10, and 20 cm to collect SM data every 5 min. The relevant data were published on the website of the HiWATER experiment (http://westdc.westgis.ac.cn/data/df372e4a-7da8-4c9d-8479-75cafb44007f (accessed on 22 August 2022)).
The Maqu SM observation network [16,17] is located in the source area of the Yellow River in the northeastern part of the TP, with altitudes ranging from 3400 to 3800 m. The climate type is characterized as cold and humid with rainy summers and cold, dry winters. The average annual temperature is about 1.2 °C, and the annual precipitation is about 600 mm. The main land cover type is alpine meadows. In 2008, 20 observations were originally installed, which a covered area of about 40 × 80 km2. In 2014, six new stations were installed due to the damage to several old monitoring sites caused by local people or animals [16]. Decagon 5TM ECH2O probes were used to measure SM at depths of 5, 10, 20, 40, and 80 cm with a temporal resolution of 15 min. The relevant data were published by the National Tibetan Plateau Data Center (http://www.tpdc.ac.cn/en/data/d323f0b2-dada-4ed5-aa00-57564da788d2/ (accessed on 22 August 2022)).
The Naqu SM observation network [18,37] is located in the central part of the TP with an average altitude of 4650 m. The climate type is characterized as cold and semi-arid, and the main land cover type is alpine meadows with low vegetation coverage. The soil includes high soil organic carbon content. The mean annual precipitation in the Naqu region is around 500 mm, and 75% of the precipitation is concentrated between May and October due to the impact of South Asian monsoons. There are 56 stations established in the observation network, with 38, 22, and 9 stations distributed in the spatial grids of 1.0°, 0.3°, and 0.1°, respectively, to provide an observational basis for the study of SM upscaling and downscaling. The stations are also equipped with Decagon 5TM ECH2O probes at observation depths of 5, 10, 20, and 40 cm with a temporal resolution of 30 min. The relevant data were published by the National Tibetan Plateau Data Center (https://www.tpdc.ac.cn/en/data/ef949bb0-26d4-4cb6-acc2-3385413b91ee/ (accessed on 22 August 2022)).
The Pali SM observation network [37] is located in the southern part of the TP that is near the northern slope of the Himalayas, with an average altitude of 4486 m. The climate type is characterized as semi-arid, and the main land cover types are sparse grassland and bare soil. The average annual precipitation in the Pali region is less than 400 mm, and about 85% of the precipitation is concentrated between May and October due to the impact of South Asian monsoons. The Pali SM observation network consists of 25 stations with Decagon 5TM ECH2O probes installed at depths of 5, 10, 20, and 40 cm to collect SM data at a temporal resolution of 30 min. The relevant data were published by the National Tibetan Plateau Data Center (https://www.tpdc.ac.cn/en/data/ef949bb0-26d4-4cb6-acc2-3385413b91ee/ (accessed on 22 August 2022)).
The Ngari SM observation network [16,17] is located in the western part of the TP with an average elevation of 4869 m. The climate is characterized as cold and arid, and the land cover is bare soil and desert. Twenty SM observation stations were established in June 2010 in the Ngari area, of which four stations were set up in the desert area, and the rest were located near the city of Shiquanhe. In 2016, five new stations were installed due to the damage to several old monitoring sites caused by local people or animals [16]. Each station was equipped with Decagon 5TM ECH2O probes at depths of 5, 10, 20, 40, and 60 cm to collect SM observations with a temporal resolution of 15 min. The relevant data were published by the National Tibetan Plateau Data Center (http://www.tpdc.ac.cn/en/data/d323f0b2-dada-4ed5-aa00-57564da788d2/ (accessed on 22 August 2022)).
4.2. Validation of SM Products Retrieved from the L-Band Passive RS on the TP
Due to the impact of different instruments, operational modes, and retrieval algorithms adopted by the three different L-band satellite missions (i.e., SMOS, Aquarius and SMAP, see Table 1 and Table 2), the performances of SM products retrieved using the observations collected from these three satellites present distinct characteristics for different climate and land cover conditions on the TP. Therefore, it is necessary to validate the performance of these satellite-based SM products on the TP using SM measurements collected from the five in situ SM observation networks (see Figure 5 and Table 3). Table 4 summarize the error statistics for the validations of L-band satellite-based SM products performed on the TP in recent years, which mainly include correlation coefficient (R), bias, and RMSE.
For SMOS SM products, Su et al. [17] firstly made a preliminary evaluation of L2 SM products using measurements collected from the Maqu network and found that the correlation coefficient can reach 0.72 and the RMSE is about 0.09 m3 m−3. Zhao et al. [69] further evaluated their performances using measurements collected from the Naqu network and found that the L2 and L3 SM products show greater uncertainty at the SMOS original grid (15, 25 km), and the correlation coefficient between SM products and observations can be improved through averaging the values of SM products to the spatial resolution of 100 km. Zeng et al. [70] thoroughly evaluated the performance of L3 SM products using SM measurements collected from both the Maqu and Naqu networks and found that SMOS products show large noise and bias, especially at the descending overpass. They further pointed out that the presence of RFI can be an important factor causing bias. In addition, it was found that the performance of SMOS products in the Naqu network is better than that of the Maqu network covered by denser vegetation. A similar finding was also reported by Chen et al. [37], who found that the L3 SM product performs well in the Naqu network with correlation coefficients of about 0.67 and 0.73 for the ascending and descending overpasses, respectively. Recently, Liu et al. [71] thoroughly evaluated the performance of multiple satellite-based SM products using data from the five in situ SM observation networks for the first time. They found that the SMOS-IC products were affected by RFI with a slight underestimation. Liu et al. [72] further evaluated the performance of SMOS-IC products using the three-corned hat method and also found that it is strongly influenced by the presence of RFI. In general, SMOS SM products can reflect SM conditions across the TP to some extent, but the performance is inconsistent in different areas of the TP. In addition, there is a slight dry bias in most areas, and the uncertainty of SM products is high due to the influence of RFI presence.
Relatively less work has been carried out to validate the SM products of the Aquarius satellite mission. Li et al. [73] used data from the Naqu network to evaluate the Aquarius L3 SM product and found that the correlation coefficient could reach 0.77 with an RMSE of about 0.08 m3 m−3. It was also shown that the Aquarius SM product could generally reflect the spatial and temporal variations of SM. It is worth noting that the revisit period of the Aquarius satellite is 7 days, resulting in a limited number of SM retrievals within the study time frame.
Regarding SMAP SM products, Chen et al. [37] evaluated the performance of L3 passive SM products using data from both Naqu and Pali networks and found that the products could capture the amplitude and temporal variation of SM observations well. Liu et al. [71] thoroughly evaluated the L3 passive SM products using data from the five in situ SM observation networks on the TP and found that the SMAP product correlates well with SM observations with smaller RMSE and bias in comparison to other products. They also showed that the SMAP product shows higher accuracy in relatively sparsely vegetated areas. A similar finding was also reported by Zeng et al. [74]. Li et al. [75] further evaluated the performance of both L3 original and enhanced passive SM products using data from the Naqu and Magu networks and found that both products capture the temporal variability and spatial distribution characteristics of SM observations with strong correlation. They also showed that the enhanced product presents a higher correlation and provides more details of SM variability. Ma et al. [76] thoroughly evaluated the performance of passive, active, and combined active–passive SM products with resolutions of 3, 9, and 36 km using data from the upper and middle reaches of the Heihe River basin. They found that SMAP products are able to capture spatial and temporal variability of SM observations and typical precipitation events in most of the study areas, with passive SM products performing best. In addition, it was found that SMAP SM products perform better in bare soil areas than the vegetated areas. In general, SMAP SM products can better reflect the spatial and temporal variations of SM in multiple observation network areas of the TP with relatively high accuracy in comparison to other products.
Table 4.
Summary of error statistics for the validations of L-band satellite-based SM products performed on the TP.
Table 4.
Summary of error statistics for the validations of L-band satellite-based SM products performed on the TP.
| Satellite | SM Product | Spatial Resolution | SM Network | Error Statistics * | Reference | ||
|---|---|---|---|---|---|---|---|
| R | Bias (m3 m−3) | RMSE (m3 m−3) | |||||
| SMOS | L2_SM | 25 km | Maqu | 0.72 | - | 0.09 | Su et al. [17] |
| L2_SM | 15 km | Naqu | 0.41 a/0.41 d | −0.02 a/0.00 d | - | Zhao et al. [69] | |
| L3_SM | 25 km | 0.26 a/0.17 d | −0.06 a/0.03 d | - | |||
| L3_SM | 25 km | Maqu | 0.24 a/0.20 d | −0.03 a/0.25 d | 0.14 a/0.37 d | Zeng et al. [70] | |
| Naqu | 0.54 a/0.43 d | −0.07 a/0.00 d | 0.10 a/0.14 d | ||||
| L3_SM | 25 km | Naqu | 0.67 a/0.73 d | −0.02 a/−0.01 d | 0.07 a/0.06 d | Chen et al. [37] | |
| Pali | 0.31 a/0.37 d | −0.02 a/−0.04 d | 0.09 a/0.08 d | ||||
| SMOS-IC | 25 km | Heihe | 0.18 a/0.30 d | −0.04 a/−0.12 d | 0.12 a/0.14 d | Liu et al. [71] | |
| Naqu | 0.43 a/0.47 d | −0.13 a/−0.05 d | 0.18 a/0.14 d | ||||
| Pali | 0.60 a/0.52 d | −0.06 a/−0.03 d | 0.07 a/0.09 d | ||||
| Maqu | 0.49 a/0.64 d | −0.01 a/−0.07 d | 0.08 a/0.11 d | ||||
| Ngari | 0.12 a/0.10 d | −0.02 a/0.00 d | 0.09 a/0.12 d | ||||
| Aquarius | L3_SM | 1° | Naqu | 0.77 | −0.07 | 0.08 | Li et al. [73] |
| SMAP | L3_SM_P | 36 km | Naqu | 0.87 d | −0.03 d | 0.06 d | Chen et al. [37] |
| Pali | 0.67 d | −0.03 d | 0.04 d | ||||
| L3_SM_P | 36 km | Heihe | 0.64 a/0.78 d | −0.11 a/−0.10 d | 0.11 a/0.11 d | Liu et al. [71] | |
| Naqu | 0.84 a/0.82 d | −0.00 a/−0.02 d | 0.08 a/0.07 d | ||||
| Pali | 0.67 a/0.62 d | −0.03 a/−0.05 d | 0.05 a/0.06 d | ||||
| Maqu | 0.72 a/0.81 d | −0.07 a/−0.07 d | 0.09 a/0.08 d | ||||
| Ngari | 0.57 a/0.34 d | −0.04 a/−0.05 d | 0.05 a/0.05 d | ||||
| L3_SM_P_E | 9 km | Naqu | 0.88 | 0.00 | 0.06 | Li et al. [75] | |
| Maqu | 0.65 | 0.11 | 0.13 | ||||
| L3_SM_P | 36 km | Naqu | 0.88 | 0.00 | 0.06 | ||
| Maqu | 0.64 | 0.12 | 0.13 | ||||
| L3_SM_P | 36 km | Maqu | 0.55 d | 0.07 d | 0.12 d | Zeng et al. [74] | |
| Naqu | 0.78 d | −0.01 d | 0.06 d | ||||
| Pali | 0.73 d | −0.05 d | 0.06 d | ||||
| L2_SM_A | 3 km | Heihe | 0.21~0.78 | −0.12~0.09 | 0.03~0.17 | Ma et al. [76] | |
| L2_SM_P | 36 km | 0.55~0.78 | −0.00~0.09 | 0.03~0.09 | |||
| L2_SM_AP | 9 km | 0.39~0.81 | −0.20~0.03 | 0.04~0.81 | |||
* The superscripts a and d represent the SM products retrieved using the observations collected during the ascending and descending overpasses.
Three distinct features can be drawn from the summary of validating the three L-band SM products on the TP (see Table 4): (1) the applicability of the three satellite-based SM products varies in different climatic and land cover regions, while in most cases they can capture the amplitude and temporal changes of SM observations; (2) through comprehensive analysis, it is found that the SMAP satellite products perform the best, and the SMOS retrieval results have large deviation and relatively high uncertainty due to the presence of RFI; (3) different vegetation cover types show different degrees of influence on the satellite-based soil moisture retrievals, and generally speaking, the accuracy of the products in bare soil areas is better than that in vegetation cover areas.
4.3. Improvement and Development of SM Retrieval Algorithms Using the L-Band Passive RS on the TP
Based on the τ-ω model, researchers have developed many SM retrieval algorithms for the L-band passive microwave RS, including the iterative inversion algorithm based on the L-MEB forward model [42], Single Channel Algorithm (SCA) [44], Dual Channel Algorithm (DCA) [44], and Land Parameter Retrieval Model (LPRM) [77]. The SMOS satellite uses the iterative inversion algorithm based on the L-MEB forward model as the default algorithm. This method takes into account a priori information on the retrieved parameters and minimizes the cost function by a generalized least squares iterative algorithm to retrieve both SM and τ [42]. Currently, the default algorithms implemented by the Aquarius and SMAP satellite missions are based on the SCA using the (i.e., SCA-H) and (i.e., SCA-V) observations, respectively. The SCA firstly converts the observation into emissivity using the effective soil temperature and then removes the impact of vegetation and surface roughness based on certain parameterizations to obtain soil emissivity, which finally uses the Fresnel equation in combination with a soil dielectric constant model to obtain SM [20,44]. In general, the errors of satellite-based SM products are mainly sourced from adopted forward land emission models and input parameters [20,71,74]. Our review of the progress of L-band microwave emission simulation on the TP (see Section 3.2) reveals that the forward land emission models adopted by current L-band satellite missions still show deficiencies in their applications to the TP, such as underestimation of effective soil temperature and surface roughness effects, overestimation of vegetation effects, and the inapplicability of the adopted dielectric constant models for frozen soil conditions [33,35,45,54,57], etc. Based on this, researchers have improved the relevant parameterizations adopted in the current SM retrieval algorithm, as well as developed a new SM retrieval algorithm to obtain high accuracy of SM retrievals for the TP environment.
For instance, current commonly used soil dielectric constant models (e.g., Dobson model [50], Wang and Schmugge model [51], and Mironov model [52]) are unable to simulate the dielectric constant of frozen soils, leading to the failure of retrieving unfrozen (liquid) water content for frozen ground based on current L-band satellite missions. Zheng et al. [38,39] validated the applicability of the four-phase dielectric mixing model for estimating the soil permittivity of frozen ground on the TP, which divides the components of wet soil into the air, ice, matrix, and liquid water and is able to simulate the dielectric constants of soils under both frozen and thawed conditions [56]. Later on, Zheng et al. [35] compared the performance of three dielectric mixing models that are suitable for both frozen and thawed soil conditions on the TP, i.e., the four-phase dielectric mixing model and another two models developed by Zhang et al. [78] and Mironov [79]. The results showed that the four-phase dielectric mixing model is more suitable for the TP condition. On this basis, Zheng et al. [38,54] further improved the underestimation of the surface roughness effect in the SMAP SM retrieval algorithm by adopting a new surface roughness parameterization, thus improving the accuracy of SM retrievals in desert areas (e.g., Ngari network) and in vegetated areas during the freezing period (e.g., Maqu network) on the TP. Furthermore, Zheng et al. [38,39] introduced a new vegetation parameterization and found that the SM retrieval in the Maqu network can be further improved with ubRMSE reduced by more than 40%. Recently, Wu et al. [45] introduced the four-phase dielectric mixing model and the new parameterizations of surface roughness and vegetation developed by Zheng et al. [38,39] to the two-stream microwave emission model that is physically more correct than the τ-ω model [56]. The improved two-stream microwave emission model was further adopted to replace the τ-ω model adopted by the SMAP default SM retrieval algorithm to improve the SM retrievals on the TP. Figure 6 show the time series of θliq measurements and retrievals obtained by the SCA-V and DCA based on the improved two-stream microwave emission model using the SMAP measurements during the descending and ascending overpasses for the period from August 2016 to July 2017. The SMAP SM products are also shown for comparison purposes, which are only available for the warm season due to the fact that the Mironov model [52] adopted by the current SMAP SM retrieval algorithm (see Table 2) is only suitable for thawed soil conditions. On the contrary, the SCA-V and DCA developed based on the improved two-stream microwave emission model with the implementation of a four-phase dielectric mixing model are able to retrieve unfrozen (liquid) water content θliq under both frozen and thawed soil conditions. The two methods are generally comparable to each other and are better than the SMAP product, whereby the latter tends to underestimate the θliq. Therefore, usage of the improved two-stream microwave emission model configured with the four-phase dielectric mixing model to replace the τ-ω model implemented by the current SMAP SM retrieval algorithm has improved the accuracy of SM retrievals and extended the retrieval algorithm to the frozen ground that widely covers the TP. In summary, three distinct features can be drawn from the abovementioned efforts made to improve the accuracy of SM retrievals on the TP using the algorithms implemented by current L-band satellite missions. First, a new soil dielectric mixing model was introduced and validated to fill the gap in retrieving unfrozen water content in frozen soil. Second, surface roughness and vegetation parameterizations embedded with default algorithms of current satellite missions were updated for the TP environment, which leads to better SM retrievals. Third, a more physical-based forward land emission model was implemented to release the assumptions made by the current widely used τ-ω model, providing the potential to retrieve SM from more complex land conditions.
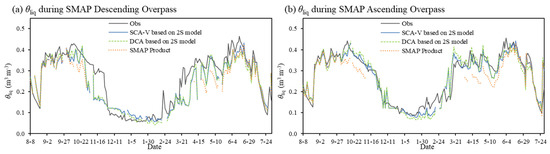
Figure 6.
Time series of θliq measurements and retrievals obtained by the SCA-V and DCA based on the improved two-stream (2S) microwave emission model using the SMAP measurements during the (a) descending and (b) ascending overpasses. The values derived from the SMAP SM products are also shown. The figure is modified from Wu [45].
In addition to improving the default retrieval algorithms implemented by current satellite missions, researchers also improved the current SM retrieval accuracy by developing new retrieval algorithms. Wang et al. [58,80] developed a new SM retrieval algorithm based on the physical-based Tor Vergata model to retrieve SM in the Maqu network based on the combination of Aquarius active and passive observations. The obtained SM retrievals were found to be able to reflect SM variations in the study area, providing a new way for the simultaneous use of active and passive observations to retrieve SM. Recently, Zeng et al. [81] developed a physical-based SM Index (SMI), which was shown to be able to reproduce measured θliq dynamics for both frozen and thawed conditions in the Naqu and Pali networks. The developed SMI shows great potential to produce better θliq retrievals on the TP based on the SMAP measurements.
5. Conclusions
L-band passive microwave RS observation is an important tool for monitoring global SM and its freeze/thaw state, which can provide large-scale and long time series SM products for the TP in a complex natural environment. In recent years, researchers conducted ground-based and airborne L-band microwave radiometry observation experiments and established regional-scale in situ SM observation networks on the TP. In addition, a lot of work has been carried out to evaluate and improve the accuracy of current forward land emission models and SM retrieval algorithms to further improve the applicability of L-band satellite-based SM products to the TP condition. Progress related to L-band microwave emission modeling on the TP have highlighted the necessity to consider the impact of polarization mixing. For the first time, it was reported that the diurnal observation signatures of both frozen and thawed soil conditions are primarily dominated by SMST dynamics at the surface layer around 2.5 cm. To further address the deficiencies in retrieving SM on the TP, such as lack of product under frozen ground, new parameterizations of soil permittivity, surface roughness, and vegetation are developed or introduced, which largely improve the accuracy of current SM retrievals. Moreover, to overcome the deficiency of the current widely used τ-ω model, more physical-based models such as the Tor Vergata model and the two-stream emission model are validated and implemented to develop new algorithms to better retrieve SM on the TP.
In short, progress has been made via the abovementioned efforts, which greatly promotes the in-depth application and development of L-band passive microwave RS technology in the TP. However, there are still many problems in the current research. For example, most work focuses on evaluating the accuracy of satellite-based SM products for a short-term period (e.g., less than 5 years), while the evaluation and improvement of the forward land emission model and SM retrieval algorithm are limited to the site or grid scale. There is still a lack of evaluating and improving both the land emission model and SM retrieval algorithms/products at the whole plateau scale, and the operational monitoring of unfrozen (liquid) water content in frozen ground is still missing. In view of the above research problems, in order to further enhance and expand the application of L-band passive microwave RS technology in the TP, the following research should be strengthened in the future.
Firstly, SMOS and SMAP satellite missions have provided long time series SM products for more than 12 and 7 years, respectively, while current work is mainly focused on evaluating the performance of these products for selected limited years. It is still unknown how accurate these products can capture the long-term trend of SM variations on the TP. Therefore, additional work is still needed to carry out long-term trend evaluation and analysis, whereby the long-term in situ SM dataset recently released by Zhang et al. [16] can be used as the ground reference for such assessment.
Secondly, to carry out the evaluation of the microwave emission model at the plateau scale. Specifically, to further validate and improve the parameterizations of the soil dielectric constant model, surface roughness and vegetation optical thickness are developed at the site or grid-scale for their applications to the whole plateau and to enhance the accuracy of microwave emission simulation at the plateau scale.
Thirdly, large amounts of research have been carried out to improve SM retrieval algorithms and products at the plateau scale based on the improved plateau-scale land emission model in combination with SM retrieval algorithms improved or newly developed at the site or grid scale. In addition, work has also been conducted to improve and develop SM products for a complete time series of consecutive years (including freezing periods) based on the L-band passive microwave RS observation via implementation of the four-phase dielectric mixing model that is applicable to both frozen and thawed soil conditions on the TP.
Finally, research has been conducted to further enhance the application of L-band satellite-based SM products on the TP, to assimilate satellite-based SM products or observations to improve the simulation accuracy of plateau-scale water cycle and energy balance, and to evaluate and improve satellite-based precipitation products based on improved SM products. In addition, further work can be conducted to monitor drought changes and vegetation growth response to wet and dry transitions based on SM products, further expanding the application of L-band passive microwave RS products in the TP.
Author Contributions
Conceptualization, X.W. and J.W.; writing—original draft preparation, X.W.; writing—review and editing, J.W.; supervision, J.W.; funding acquisition, X.W. and J.W. All authors have read and agreed to the published version of the manuscript.
Funding
This research was funded by the National Natural Science Foundation of China (grant numbers 42030509, 41971308 and 41901317).
Data Availability Statement
Not applicable.
Conflicts of Interest
The authors declare no conflict of interest.
References
- WMO; IOC; UNEP; ICSU. Implementation Plan for the Global Observing System for Climate in Support of the UNFCCC. GCOS-138, WMO-TD-1523. 2010. Available online: https://library.wmo.int/doc_num.php?explnum_id=3851 (accessed on 22 August 2022).
- Koster, R.D.; Dirmeyer, P.A.; Guo, Z.; Bonan, G.; Chan, E.; Cox, P.; Gordon, C.T.; Kanae, S.; Kowalczyk, E.; Lawrence, D.; et al. Regions of Strong Coupling between Soil Moisture and Precipitation. Science 2004, 305, 1138–1140. [Google Scholar] [CrossRef] [PubMed]
- Dorigo, W.; Himmelbauer, I.; Aberer, D.; Schremmer, L.; Petrakovic, I.; Zappa, L.; Preimesberger, W.; Xaver, A.; Annor, F.; Ardö, J.; et al. The International Soil Moisture Network: Serving Earth system science for over a decade. Hydrol. Earth Syst. Sci. 2021, 25, 5749–5804. [Google Scholar] [CrossRef]
- Green, J.K.; Seneviratne, S.I.; Berg, A.M.; Findell, K.L.; Hagemann, S.; Lawrence, D.M.; Gentine, P. Large influence of soil moisture on long-term terrestrial carbon uptake. Nature 2019, 565, 476–479. [Google Scholar] [CrossRef]
- Helbig, M.; Waddington, J.M.; Alekseychik, P.; Amiro, B.D.; Aurela, M.; Barr, A.G.; Black, T.A.; Blanken, P.D.; Carey, S.K.; Chen, J.; et al. Increasing contribution of peatlands to boreal evapotranspiration in a warming climate. Nat. Clim. Chang. 2020, 10, 555–560. [Google Scholar] [CrossRef]
- Zheng, D.; Van der Velde, R.; Su, Z.; Wen, J.; Wang, X.; Booij, M.J.; Hoekstra, A.Y.; Lv, S.; Zhang, Y.; Ek, M.B. Impacts of Noah model physics on catchment-scale runoff simulations. J. Geophys. Res. Atmos. 2016, 121, 807–832. [Google Scholar] [CrossRef]
- Zheng, D.; Van Der Velde, R.; Su, Z.; Wang, X.; Wen, J.; Booij, M.J.; Hoekstra, A.; Chen, Y. Augmentations to the Noah Model Physics for Application to the Yellow River Source Area. Part I: Soil Water Flow. J. Hydrometeorol. 2015, 16, 2659–2676. [Google Scholar] [CrossRef]
- Zheng, D.; van der Velde, R.; Su, Z.; Wen, J.; Booij, M.J.; Hoekstra, A.Y.; Wang, X. Under-canopy turbulence and root water uptake of a Tibetan meadow ecosystem modeled by Noah-MP. Water Resour. Res. 2015, 51, 5735–5755. [Google Scholar] [CrossRef]
- Pendergrass, A.G.; Meehl, G.A.; Pulwarty, R.; Hobbins, M.; Hoell, A.; AghaKouchak, A.; Bonfils, C.J.W.; Gallant, A.J.E.; Hoerling, M.; Hoffmann, D.; et al. Flash droughts present a new challenge for subseasonal-to-seasonal prediction. Nat. Clim. Chang. 2020, 10, 191–199. [Google Scholar] [CrossRef]
- Brocca, L.; Tarpanelli, A.; Filippucci, P.; Dorigo, W.; Zaussinger, F.; Gruber, A.; Fernández-Prieto, D. How much water is used for irrigation? A new approach exploiting coarse resolution satellite soil moisture products. Int. J. Appl. Earth Obs. Geoinf. 2018, 73, 752–766. [Google Scholar] [CrossRef]
- Rigden, A.J.; Mueller, N.D.; Holbrook, N.M.; Pillai, N.; Huybers, P. Combined influence of soil moisture and atmospheric evaporative demand is important for accurately predicting US maize yields. Nat. Food 2020, 1, 127–133. [Google Scholar] [CrossRef] [Green Version]
- Zhang, K.; Li, X.; Zheng, D.; Zhang, L.; Zhu, G. Estimation of Global Irrigation Water Use by the Integration of Multiple Satellite Observations. Water Resour. Res. 2022, 58, e2021WR030031. [Google Scholar] [CrossRef]
- Wu, G.; Duan, A.; Liu, Y.; Mao, J.; Ren, R.; Bao, Q.; He, B.; Liu, B.; Hu, W. Tibetan Plateau climate dynamics: Recent research progress and outlook. Natl. Sci. Rev. 2014, 2, 100–116. [Google Scholar] [CrossRef]
- Zheng, D.; van der Velde, R.; Su, Z.; Wen, J.; Wang, X.; Yang, K. Impact of soil freeze-thaw mechanism on the runoff dynamics of two Tibetan rivers. J. Hydrol. 2018, 563, 382–394. [Google Scholar] [CrossRef]
- Zheng, D.; Van Der Velde, R.; Su, Z.; Wen, J.; Wang, X.; Yang, K. Evaluation of Noah Frozen Soil Parameterization for Application to a Tibetan Meadow Ecosystem. J. Hydrometeorol. 2017, 18, 1749–1763. [Google Scholar] [CrossRef]
- Zhang, P.; Zheng, D.; van der Velde, R.; Wen, J.; Zeng, Y.; Wang, X.; Wang, Z.; Chen, J.; Su, Z. Status of the Tibetan Plateau observatory (Tibet-Obs) and a 10-year (2009–2019) surface soil moisture dataset. Earth Syst. Sci. Data 2021, 13, 3075–3102. [Google Scholar] [CrossRef]
- Su, Z.; Wen, J.; Dente, L.; van der Velde, R.; Wang, L.; Ma, Y.; Yang, K.; Hu, Z. The Tibetan Plateau observatory of plateau scale soil moisture and soil temperature (Tibet-Obs) for quantifying uncertainties in coarse resolution satellite and model products. Hydrol. Earth Syst. Sci. 2011, 15, 2303–2316. [Google Scholar] [CrossRef]
- Yang, K.; Qin, J.; Zhao, L.; Chen, Y.; Tang, W.; Han, M.; Lazhu; Chen, Z.; Lv, N.; Ding, B.; et al. A Multiscale Soil Moisture and Freeze–Thaw Monitoring Network on the Third Pole. Bull. Am. Meteorol. Soc. 2013, 94, 1907–1916. [Google Scholar] [CrossRef]
- Babaeian, E.; Sadeghi, M.; Jones, S.B.; Montzka, C.; Vereecken, H.; Tuller, M. Ground, Proximal, and Satellite Remote Sensing of Soil Moisture. Rev. Geophys. 2019, 57, 530–616. [Google Scholar] [CrossRef]
- Wigneron, J.-P.; Jackson, T.; O’Neill, P.; De Lannoy, G.; de Rosnay, P.; Walker, J.; Ferrazzoli, P.; Mironov, V.; Bircher, S.; Grant, J.; et al. Modelling the passive microwave signature from land surfaces: A review of recent results and application to the L-band SMOS & SMAP soil moisture retrieval algorithms. Remote Sens. Environ. 2017, 192, 238–262. [Google Scholar] [CrossRef]
- Kerr, Y.H.; Waldteufel, P.; Wigneron, J.P.; Martinuzzi, J.; Font, J.; Berger, M. Soil moisture retrieval from space: The Soil Moisture and Ocean Salinity (SMOS) mission. IEEE Trans. Geosci. Remote Sens. 2001, 39, 1729–1735. [Google Scholar] [CrossRef]
- Lagerloef, G.; Colomb, F.R.; Le Vine, D.; Wentz, F.; Yueh, S.; Ruf, C.; Lilly, J.; Gunn, J.; Chao, Y.; Decharon, A.; et al. The Aquarius/SAC-D Mission: Designed to Meet the Salinity Remote-Sensing Challenge. Oceanography 2008, 21, 68–81. [Google Scholar] [CrossRef]
- Entekhabi, D.; Njoku, E.G.; O’Neill, P.E.; Kellogg, K.H.; Crow, W.T.; Edelstein, W.N.; Entin, J.K.; Goodman, S.D.; Jackson, T.J.; Johnson, J.; et al. The Soil Moisture Active Passive (SMAP) Mission. Proc. IEEE 2010, 98, 704–716. [Google Scholar] [CrossRef]
- Shi, J.; Dong, X.; Zhao, T.; Du, J.; Jiang, L.; Du, Y.; Liu, H.; Wang, Z.; Ji, D.; Xiong, C. WCOM: The science scenario and objectives of a global water cycle observation mission. In Proceedings of the IEEE International Geoscience and Remote Sensing Symposium, Quebec City, QC, Canada, 13–18 July 2014; pp. 3646–3649. [Google Scholar] [CrossRef]
- Schwank, M.; Wigneron, J.-P.; Lopez-Baeza, E.; Volksch, I.; Matzler, C.; Kerr, Y.H. L-Band Radiative Properties of Vine Vegetation at the MELBEX III SMOS Cal/Val Site. IEEE Trans. Geosci. Remote Sens. 2012, 50, 1587–1601. [Google Scholar] [CrossRef]
- Montzka, C.; Bogena, H.R.; Weihermuller, L.; Jonard, F.; Bouzinac, C.; Kainulainen, J.; Balling, J.E.; Loew, A.; Dall’Amico, J.T.; Rouhe, E.; et al. Brightness Temperature and Soil Moisture Validation at Different Scales During the SMOS Validation Campaign in the Rur and Erft Catchments, Germany. IEEE Trans. Geosci. Remote Sens. 2012, 51, 1728–1743. [Google Scholar] [CrossRef]
- Panciera, R.; Walker, J.P.; Jackson, T.J.; Gray, D.A.; Tanase, M.A.; Ryu, D.; Monerris, A.; Yardley, H.; Rudiger, C.; Wu, X.; et al. The Soil Moisture Active Passive Experiments (SMAPEx): Toward Soil Moisture Retrieval from the SMAP Mission. IEEE Trans. Geosci. Remote Sens. 2013, 52, 490–507. [Google Scholar] [CrossRef]
- Colliander, A.; Cosh, M.H.; Misra, S.; Jackson, T.J.; Crow, W.; Chan, S.; Bindlish, R.; Chae, C.; Collins, C.H.; Yueh, S.H. Validation and scaling of soil moisture in a semi-arid environment: SMAP validation experiment 2015 (SMAPVEX15). Remote Sens. Environ. 2017, 196, 101–112. [Google Scholar] [CrossRef]
- Li, X.; Cheng, G.; Liu, S.; Xiao, Q.; Ma, M.; Jin, R.; Che, T.; Liu, Q.; Wang, W.; Qi, Y.; et al. Heihe Watershed Allied Telemetry Experimental Research (HiWATER): Scientific Objectives and Experimental Design. Bull. Am. Meteorol. Soc. 2013, 94, 1145–1160. [Google Scholar] [CrossRef]
- Zhao, T.; Shi, J.; Lv, L.; Xu, H.; Chen, D.; Cui, Q.; Jackson, T.J.; Yan, G.; Jia, L.; Chen, L.; et al. Soil moisture experiment in the Luan River supporting new satellite mission opportunities. Remote Sens. Environ. 2020, 240, 111680. [Google Scholar] [CrossRef]
- Colliander, A.; Jackson, T.J.; Bindlish, R.; Chan, S.; Das, N.; Kim, S.B.; Cosh, M.H.; Dunbar, R.S.; Dang, L.; Pashaian, L.; et al. Validation of SMAP surface soil moisture products with core validation sites. Remote Sens. Environ. 2017, 191, 215–231. [Google Scholar] [CrossRef]
- Zhao, T.; Shi, J.; Bindlish, R.; Jackson, T.; Kerr, Y.; Cui, Q.; Li, Y.; Che, T. Refinement of SMOS multi-angular brightness temperature and its analysis over reference targets. IEEE J. Sel. Top. Appl. Earth Obs. Remote Sens. 2015, 8, 589–603. [Google Scholar] [CrossRef]
- Zheng, D.; Wang, X.; Van Der Velde, R.; Zeng, Y.; Wen, J.; Wang, Z.; Schwank, M.; Ferrazzoli, P.; Su, Z. L-Band Microwave Emission of Soil Freeze–Thaw Process in the Third Pole Environment. IEEE Trans. Geosci. Remote Sens. 2017, 55, 5324–5338. [Google Scholar] [CrossRef]
- Zheng, D.; Li, X.; Wang, X.; Wang, Z.; Wen, J.; van der Velde, R.; Schwank, M.; Su, Z. Sampling depth of L-band radiometer measurements of soil moisture and freeze-thaw dynamics on the Tibetan Plateau. Remote Sens. Environ. 2019, 226, 16–25. [Google Scholar] [CrossRef]
- Zheng, D.; Li, X.; Zhao, T.; Wen, J.; van der Velde, R.; Schwank, M.; Wang, X.; Wang, Z.; Su, Z. Impact of Soil Permittivity and Temperature Profile on L-Band Microwave Emission of Frozen Soil. IEEE Trans. Geosci. Remote Sens. 2020, 59, 4080–4093. [Google Scholar] [CrossRef]
- Dente, L.; Su, Z.; Wen, J. Validation of SMOS Soil Moisture Products over the Maqu and Twente Regions. Sensors 2012, 12, 9965–9986. [Google Scholar] [CrossRef]
- Chen, Y.; Yang, K.; Qin, J.; Cui, Q.; Lu, H.; La, Z.; Han, M.; Tang, W. Evaluation of SMAP, SMOS, and AMSR2 soil moisture retrievals against observations from two networks on the Tibetan Plateau. J. Geophys. Res. Atmos. 2017, 122, 5780–5792. [Google Scholar] [CrossRef]
- Zheng, D.; Wang, X.; van der Velde, R.; Ferrazzoli, P.; Wen, J.; Wang, Z.; Schwank, M.; Colliander, A.; Bindlish, R.; Su, Z. Impact of surface roughness, vegetation opacity and soil permittivity on L-band microwave emission and soil moisture retrieval in the third pole environment. Remote Sens. Environ. 2018, 209, 633–647. [Google Scholar] [CrossRef]
- Zheng, D.; Wang, X.; van der Velde, R.; Schwank, M.; Ferrazzoli, P.; Wen, J.; Wang, Z.; Colliander, A.; Bindlish, R.; Su, Z. Assessment of Soil Moisture SMAP Retrievals and ELBARA-III Measurements in a Tibetan Meadow Ecosystem. IEEE Geosci. Remote Sens. Lett. 2019, 16, 1407–1411. [Google Scholar] [CrossRef]
- Li, X.; Liu, S.; Xiao, Q.; Ma, M.; Jin, R.; Che, T.; Wang, W.; Hu, X.; Xu, Z.; Wen, J.; et al. A multiscale dataset for understanding complex eco-hydrological processes in a heterogeneous oasis system. Sci. Data 2017, 4, 170083. [Google Scholar] [CrossRef]
- Zheng, D.; Li, X.; Wen, J.; Hofste, J.G.; van der Velde, R.; Wang, X.; Wang, Z.; Bai, X.; Schwank, M.; Su, Z. Active and Passive Microwave Signatures of Diurnal Soil Freeze-Thaw Transitions on the Tibetan Plateau. IEEE Trans. Geosci. Remote Sens. 2021, 60, 4301814. [Google Scholar] [CrossRef]
- Kerr, Y.H.; Waldteufel, P.; Richaume, P.; Wigneron, J.P.; Ferrazzoli, P.; Mahmoodi, A.; Al Bitar, A.; Cabot, F.; Gruhier, C.; Juglea, S.E.; et al. The SMOS Soil Moisture Retrieval Algorithm. IEEE Trans. Geosci. Remote Sens. 2012, 50, 1384–1403. [Google Scholar] [CrossRef]
- Bindlish, R.; Jackson, T.; Cosh, M.; Zhao, T.; O’Neill, P. Global Soil Moisture from the Aquarius/SAC-D Satellite: Description and Initial Assessment. IEEE Geosci. Remote Sens. Lett. 2015, 12, 923–927. [Google Scholar] [CrossRef]
- O’Neill, P.; Chan, S.; Njoku, E.; Jackson, T.; Bindlish, R. Algorithm Theoretical Basis Document (ATBD): Level 2 & 3 Soil Moisture (Passive) Data Products [J/OL]. 2015. Initial Release, v.3, 1 October. Available online: http://smap.jpl.nasa.gov/science/dataproducts/ATBD/ (accessed on 22 August 2022).
- Wu, X. Implementation of Two-Stream Emission Model for L-Band Retrievals on the Tibetan Plateau. Remote Sens. 2022, 14, 494. [Google Scholar] [CrossRef]
- Mo, T.; Choudhury, B.J.; Schmugge, T.J.; Wang, J.R.; Jackson, T.J. A model for microwave emission from vegetation-covered fields. J. Geophys. Res. Earth Surf. 1982, 87, 11229–11237. [Google Scholar] [CrossRef]
- Jackson, T.; Schmugge, T. Vegetation effects on the microwave emission of soils. Remote Sens. Environ. 1991, 36, 203–212. [Google Scholar] [CrossRef]
- Wang, J.R.; Choudhury, B.J. Remote sensing of soil moisture content, over bare field at 1.4 GHz frequency. J. Geophys. Res. Earth Surf. 1981, 86, 5277–5282. [Google Scholar] [CrossRef]
- Wigneron, J.-P.; Laguerre, L.; Kerr, Y. A simple parameterization of the L-band microwave emission from rough agricultural soils. IEEE Trans. Geosci. Remote Sens. 2001, 39, 1697–1707. [Google Scholar] [CrossRef]
- Dobson, M.C.; Ulaby, F.T.; Hallikainen, M.T.; El-Rayes, M.A. Microwave Dielectric Behavior of Wet Soil-Part II: Dielectric Mixing Models. IEEE Trans. Geosci. Remote Sens. 1985, 23, 35–46. [Google Scholar] [CrossRef]
- Wang, J.R.; Schmugge, T.J. An Empirical Model for the Complex Dielectric Permittivity of Soils as a Function of Water Content. IEEE Trans. Geosci. Remote Sens. 1980, GE-18, 288–295. [Google Scholar] [CrossRef]
- Mironov, V.L.; Kosolapova, L.G.; Fomin, S.V. Physically and Mineralogically Based Spectroscopic Dielectric Model for Moist Soils. IEEE Trans. Geosci. Remote Sens. 2009, 47, 2059–2070. [Google Scholar] [CrossRef]
- Choudhury, B.J.; Schmugge, T.J.; Mo, T. A parameterization of effective soil temperature for microwave emission. J. Geophys. Res. Earth Surf. 1982, 87, 1301–1304. [Google Scholar] [CrossRef]
- Zheng, D.; Van Der Velde, R.; Wen, J.; Wang, X.; Ferrazzoli, P.; Schwank, M.; Colliander, A.; Bindlish, R.; Su, Z. Assessment of the SMAP Soil Emission Model and Soil Moisture Retrieval Algorithms for a Tibetan Desert Ecosystem. IEEE Trans. Geosci. Remote Sens. 2018, 56, 3786–3799. [Google Scholar] [CrossRef]
- Wigneron, J.P.; Chanzy, A.; Kerr, Y.; Shi, J.C.; Cano, A.; Rosnay, P.D.; Escorihuela, M.J.; Mironov, V.; Demontoux, F.; Grant, J. Improved Parameterization of the Soil Emission in L-MEB. IEEE Trans. Geosci. Remote Sens. 2011, 49, 1177–1189. [Google Scholar] [CrossRef]
- Schwank, M.; Naderpour, R.; Mätzler, C. “Tau-Omega”- and Two-Stream Emission Models Used for Passive L-Band Retrievals: Application to Close-Range Measurements over a Forest. Remote Sens. 2018, 10, 1868. [Google Scholar] [CrossRef]
- Wu, X.; Zheng, D. Surface Roughness Effect on L-Band Multiangular Brightness Temperature Modeling and Soil Liquid Water Retrieval of Frozen Soil. IEEE Geosci. Remote Sens. Lett. 2021, 18, 1615–1619. [Google Scholar] [CrossRef]
- Wang, Q.; van der Velde, R.; Su, Z. Use of a discrete electromagnetic model for simulating Aquarius L-band active/passive observations and soil moisture retrieval. Remote Sens. Environ. 2018, 205, 434–452. [Google Scholar] [CrossRef]
- Bai, X.; Zeng, J.; Chen, K.-S.; Li, Z.; Zeng, Y.; Wen, J.; Wang, X.; Dong, X.; Su, Z. Parameter Optimization of a Discrete Scattering Model by Integration of Global Sensitivity Analysis Using SMAP Active and Passive Observations. IEEE Trans. Geosci. Remote Sens. 2018, 57, 1084–1099. [Google Scholar] [CrossRef]
- Schwank, M.; Stahli, M.; Wydler, H.; Leuenberger, J.; Matzler, C.; Fluhler, H. Microwave L-band emission of freezing soil. IEEE Trans. Geosci. Remote Sens. 2004, 42, 1252–1261. [Google Scholar] [CrossRef]
- Wilheit, T.T. Radiative Transfer in a Plane Stratified Dielectric. IEEE Trans. Geosci. Electron. 1978, 16, 138–143. [Google Scholar] [CrossRef]
- Chen, K.S.; Wu, T.D.; Tsang, L.; Li, Q.; Shi, J.; Fung, A.K. Emission of rough surfaces calculated by the integral equation method with comparison to three-dimensional moment method simulation. IEEE Trans. Geosci. Remote Sens. 2003, 41, 90–101. [Google Scholar] [CrossRef]
- Wu, X. Implementation of Wilheit Model for Predicting L-Band Microwave Emission in the Third Pole Environment. IEEE Geosci. Remote Sens. Lett. 2021, 19, 4500505. [Google Scholar] [CrossRef]
- Shi, J.; Chen, K.S.; Li, Q.; Jackson, T.J.; O’Neill, P.E.; Tsang, L. A parameterized surface reflectivity model and estimation of bare surface soil moisture with L-band radiometer. IEEE Trans. Geosci. Remote Sens. 2002, 40, 2674–2686. [Google Scholar]
- Jin, R.; Li, X.; Yan, B.; Li, X.; Luo, W.; Ma, M.; Guo, J.; Kang, J.; Zhu, Z.; Zhao, S. A Nested Ecohydrological Wireless Sensor Network for Capturing the Surface Heterogeneity in the Midstream Areas of the Heihe River Basin, China. IEEE Geosci. Remote Sens. Lett. 2014, 11, 2015–2019. [Google Scholar] [CrossRef]
- Kang, J.; Jin, R.; Li, X.; Zhang, Y. Mapping High Spatiotemporal-Resolution Soil Moisture by Upscaling Sparse Ground-Based Observations Using a Bayesian Linear Regression Method for Comparison with Microwave Remotely Sensed Soil Moisture Products. Remote Sens. 2021, 13, 228. [Google Scholar] [CrossRef]
- Zhang, P.; Zheng, D.; van der Velde, R.; Wen, J.; Ma, Y.; Zeng, Y.; Wang, X.; Wang, Z.; Chen, J.; Su, Z. A dataset of 10-year regional-scale soil moisture and soil temperature measurements at multiple depths on the Tibetan Plateau. Earth Syst. Sci. Data Discuss. 2022. [Google Scholar] [CrossRef]
- Dente, L.; Vekerdy, Z.; Wen, J.; Su, Z. Maqu network for validation of satellite-derived soil moisture products. Int. J. Appl. Earth Obs. Geoinf. ITC J. 2012, 17, 55–65. [Google Scholar] [CrossRef]
- Zhao, L.; Yang, K.; Qin, J.; Chen, Y.; Tang, W.; Lu, H.; Yang, Z.-L. The scale-dependence of SMOS soil moisture accuracy and its improvement through land data assimilation in the central Tibetan Plateau. Remote Sens. Environ. 2014, 152, 345–355. [Google Scholar] [CrossRef]
- Zeng, J.; Li, Z.; Chen, Q.; Bi, H.; Qiu, J.; Zou, P. Evaluation of remotely sensed and reanalysis soil moisture products over the Tibetan Plateau using in-situ observations. Remote Sens. Environ. 2015, 163, 91–110. [Google Scholar] [CrossRef]
- Liu, J.; Chai, L.; Lu, Z.; Liu, S.; Qu, Y.; Geng, D.; Song, Y.; Guan, Y.; Guo, Z.; Wang, J.; et al. Evaluation of SMAP, SMOS-IC, FY3B, JAXA, and LPRM Soil Moisture Products over the Qinghai-Tibet Plateau and Its Surrounding Areas. Remote Sens. 2019, 11, 792. [Google Scholar] [CrossRef]
- Liu, J.; Chai, L.; Dong, J.; Zheng, D.; Wigneron, J.-P.; Liu, S.; Zhou, J.; Xu, T.; Yang, S.; Song, Y.; et al. Uncertainty analysis of eleven multisource soil moisture products in the third pole environment based on the three-corned hat method. Remote Sens. Environ. 2021, 255, 112225. [Google Scholar] [CrossRef]
- Li, D.; Zhao, T.; Shi, J.; Bindlish, R.; Jackson, T.J.; Peng, B.; An, M.; Han, B. First Evaluation of Aquarius Soil Moisture Products Using In Situ Observations and GLDAS Model Simulations. IEEE J. Sel. Top. Appl. Earth Obs. Remote Sens. 2015, 8, 5511–5525. [Google Scholar] [CrossRef]
- Zeng, J.; Shi, P.; Chen, K.-S.; Ma, H.; Bi, H.; Cui, C. Assessment and Error Analysis of Satellite Soil Moisture Products Over the Third Pole. IEEE Trans. Geosci. Remote Sens. 2021, 60, 4405418. [Google Scholar] [CrossRef]
- Li, C.; Lu, H.; Yang, K.; Han, M.; Wright, J.S.; Chen, Y.; Yu, L.; Xu, S.; Huang, X.; Gong, W. The Evaluation of SMAP Enhanced Soil Moisture Products Using High-Resolution Model Simulations and In-Situ Observations on the Tibetan Plateau. Remote Sens. 2018, 10, 535. [Google Scholar] [CrossRef]
- Ma, C.; Li, X.; Wei, L.; Wang, W. Multi-Scale Validation of SMAP Soil Moisture Products over Cold and Arid Regions in Northwestern China Using Distributed Ground Observation Data. Remote Sens. 2017, 9, 327. [Google Scholar] [CrossRef]
- Owe, M.; de Jeu, R.; Walker, J. A methodology for surface soil moisture and vegetation optical depth retrieval using the microwave polarization difference index. IEEE Trans. Geosci. Remote Sens. 2001, 39, 1643–1654. [Google Scholar] [CrossRef]
- Zhang, L.; Zhao, T.; Jiang, L.; Zhao, S. Estimate of phase transition water content in Freeze–Thaw process using microwave radi-ometer. IEEE Trans. Geosci. Remote Sens. 2010, 48, 4248–4255. [Google Scholar] [CrossRef]
- Mironov, V.L.; Kosolapova, L.G.; Lukin, Y.I.; Karavaysky, A.Y.; Molostov, I.P. Temperature- and texture-dependent dielectric model for frozen and thawed mineral soils at a frequency of 1.4 GHz. Remote Sens. Environ. 2017, 200, 240–249. [Google Scholar] [CrossRef]
- Wang, Q.; van der Velde, R.; Ferrazzoli, P.; Chen, X.; Bai, X.; Su, Z. Mapping soil moisture across the Tibetan Plateau plains using Aquarius active and passive L-band microwave observations. Int. J. Appl. Earth Obs. Geoinf. ITC J. 2019, 77, 108–118. [Google Scholar] [CrossRef]
- Zeng, J.; Chen, K.S.; Cui, C.; Bai, X. A Physically Based Soil Moisture Index from Passive Microwave Brightness Temperatures for Soil Moisture Variation Monitoring. IEEE Trans. Geosci. Remote Sens. 2020, 58, 2782–2795. [Google Scholar] [CrossRef]
Publisher’s Note: MDPI stays neutral with regard to jurisdictional claims in published maps and institutional affiliations. |
© 2022 by the authors. Licensee MDPI, Basel, Switzerland. This article is an open access article distributed under the terms and conditions of the Creative Commons Attribution (CC BY) license (https://creativecommons.org/licenses/by/4.0/).